1. Introduction
Soil is the main medium for plant growth, germination, and development, and fertilization helps both plants and microorganisms to grow in the soil environment. However, the increase in the use of fertilizers on farm fields over the past 50 years has contributed to increased yields but also caused serious environmental problems [
1,
2,
3,
4,
5]. Consequently, one of the main goals of the European Commission’s “Farm to Folk” strategy, which was recently adopted to ensure a sustainable food value chain, is to reduce fertilizer use by at least 20% by 2030. Technological progress and changing climatic conditions also cause farmers to constantly seek new (optimal) agrotechnical solutions [
5]. One of them is the no-till (NT) system, which combines elements of environmental protection with the improvement of economic and organizational factors on the farm [
6,
7,
8,
9], and mitigates negative climate change (less CO
2 and fumes are released into the atmosphere) [
6,
7,
10]. In contrast to NT, many researchers have proved that conventional intensive agricultural practices (primarily, the excessive use of fertilizers and pesticides as well as plowing–PL system) in agricultural areas have already led to a significant decline in the quality and biodiversity of these soils [
9,
11,
12,
13]. Indeed, an excess of nitrogen (N) fertilizers in particular causes a reduction in the amount of plant metabolites and a decrease in the biological activity of soils [
9,
11,
14,
15,
16]. To obtain information about the current biological state of soils and their potential fertility, it is recommended that, e.g., respiration activity (RA) [
16,
17] and the concentration of humic acid-like substances (HA-like) [
18,
19] should be measured. Respiration is a universal process carried out by all soil-dwelling heterotrophic organisms using available carbon derived from organic matter [
17,
20]. It has been evidenced that HA-like can have a positive effect on the texture, structure, water holding capacity, cation exchange capacity, pH, carbon, enzymes, N cycling, and nutrient availability [
18,
19].
Maize is a major cereal crop for livestock feed, fuel, fodder, and human nutrition across the world [
21,
22]. It is worth mentioning that maize requires several types of sustenance throughout its growth, and N is among the most significant components for maize growth and development; hence, a lack of it might limit the nutritional elements of this crop [
22,
23,
24]. It was reported that N fertilization efficiency can be increased not only by adjusting the fertilizer dose to the plant’s requirements, but also by removing all of the soil factors that constrain nutrient uptake [
24,
25]. Consequently, understanding and assessing the impact of reduced fertilizer application rates on soil fertility are not possible without recognizing the most important chemical characteristics of soils (e.g., pH, carbon, and nutrient element content). The pH of agriculturally exploited soils is generally acidic, limiting the uptake of nutrients, which are converted into a form inaccessible to plant roots and microorganisms [
4,
5,
20,
21]. This usually results in a decrease in yields [
9,
14]. Importantly, N fertilization is well known for its impact on soil acidity in the arable layer [
10,
25,
26]. Concurrently, the carbon and nutrient contents in arable (mineral) soils are not high, which is also reflected in the quality of the soil and its crop yields [
13,
16,
26]. Therefore, the knowledge of individual environmental parameters allows specific activities to be undertaken to reduce the adverse effects of individual factors and mitigate the worsening environmental problem (e.g., soil acidification, nutrient depletion). Both excess and deprived application of N could be detrimental to plants [
22,
24]. N shortage during the vegetative stage directly affects root development, stem elongation, and the uptake of other nutrients, whereas the excess supply of this element, particularly combined with a low potassium (K) dose, promotes vigorous vegetative growth [
21,
22].
In the present study, the most important chemical and biological parameters were monitored before maize sowing and after harvesting. This approach facilitated the verification of the hypothesis that, in addition to the economic aspect, reduced fertilization rates combined with proper tillage systems (PL, NT) may be sufficient to maintain the fertility and good quality of agriculturally exploited soils and guarantee high yields of maize.
Consequently, the main objective of this study was to check whether the 20% lower N fertilization (in agreement with the EU “Farm to Folk” directive) may ensure good yields on the one hand and, on the other hand, may contribute to the maintenance of soil fertility in monoculture maize cultivation in the NT system versus the traditional PL system.
2. Materials and Methods
The field experiment was carried out in the arable fields of the Potulicka Foundation Group located in Janin (53°17′02″ N 17°43′36″ E) in NW Poland (Kujawsko–Pomorskie Voivodeship). More details about the location and sampling points are presented in
Figure A1.
Two neighboring fields (10 ha each) were established for plowing (PL) and no-tillage (NT) maize cultivation (
Figure A1). Both tillage systems had the same maize variety, sowing date, rates, and applied fertilizers, and were harvested with the same combine on the same day.
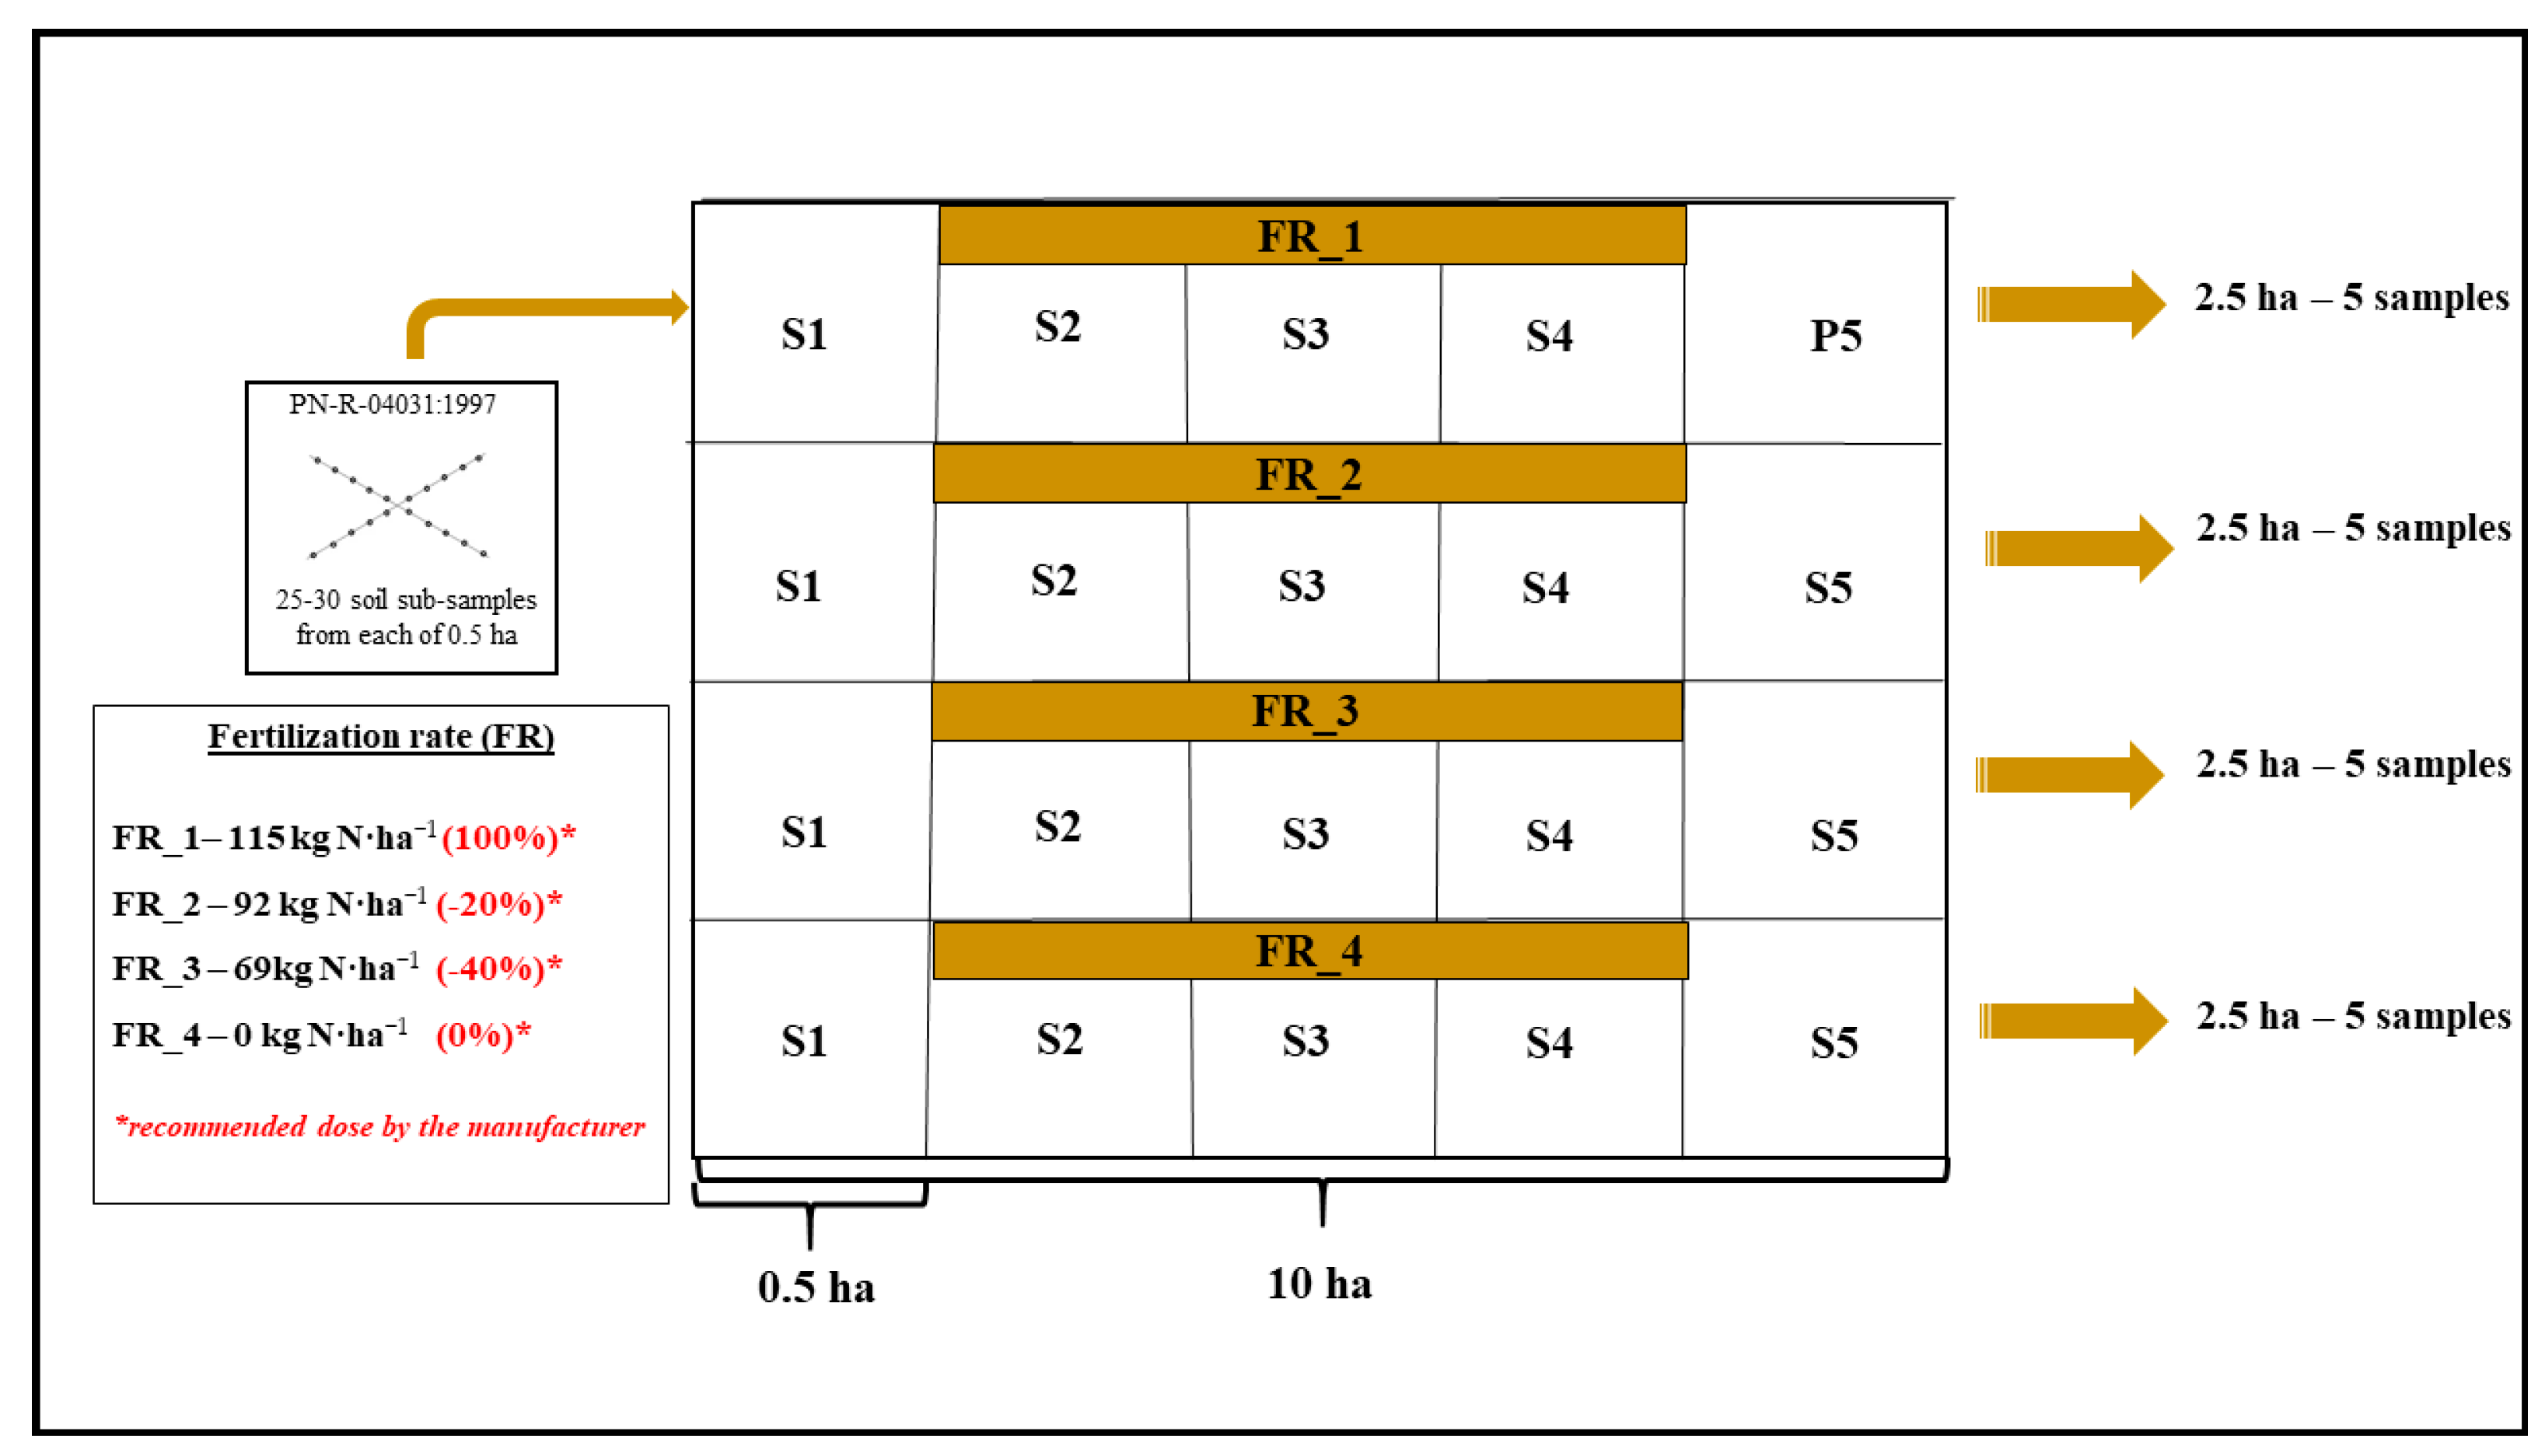
The scheme of a single field with a description of the reduced fertilization pattern and rules of soil sampling is presented in
Figure 1. The large-scale area of agricultural soils (20 ha) managed by the Potulicka Foundation and dedicated to the current experiment is a guarantee of the representativeness of the obtained results (taking into account the heterogeneity of the soil environment). Moreover, the Potulicka Foundation agricultural acreage is predominantly (>95%) mapped using GPS, and the precision farming system is successfully applied in the whole area hence, precise doses of fertilizers were applied and samples for analysis were collected from the same places.
Within each of the 10 ha fields (
Figure 1), 2.5-ha plots were exposed to the following N treatments: (1) control sites with no fertilization (0.0 kg ha
−1, FR_4) from which 5 composite samples were taken and variable N rates, (2) amount based on soil properties and crop requirements (115.0 kg ha
−1, FR_1) represented by 5 composite samples, (3) standard fertilizer rate reduced by 20% (in agreement with the EC directive, FR_2) represented by 5 composite samples, and (4) standard fertilizer rate reduced by 40% (also 5 composite samples, FR_3). The greatest possible representativeness of the soil material was guaranteed by the single soil sub-sampling from 25–30 randomly selected sites from each experimental “microplot” (0.5 ha area) separated from the 2.5 ha plot (
Figure 1) at a surface soil depth of 0–20 cm. Finally, twenty soil samples represented the PL system, whereas another twenty samples pertained to the NT maize cultivation system.
The soil (according to the Food and Agriculture Organization of the United Nations–FAO classification: Haplic Podzol) was collected according to PN-R-04031:1997, using an automatic sampler (Wintex 100, AgroTechnology, Łobez, Poland) with an Egner stick [
27]. Soil samples were taken in two periods: (1) before maize sowing (April 2022) and (2) after harvesting the crop (November 2022). Importantly, pre-sowing soil samples were taken before the fertilizer application so that the freshly applied fertilizer could not disturb the tested values. The Kujawsko–Pomorskie Voivodeship is characterized by a moderately continental climate with an average temperature of 8.7 °C and rainfall of approx. 600 mm in spring, and 12.2 °C and approx. 400 mm in autumn. The study site represented soils classified into class V.
Phosphorus fertilization (Super FOS DAR 40™–superphosphate enriched with 40% P2O5) at a rate of 170 kg ha−1 (68 kg P2O5 ha−1) and multi-nutrient fertilization (ICL PotashpluS™) at a rate of 150 kg ha−1 were applied in the studied fields. The composition of the ICL PotashpluS™ fertilizer is 37% K2O, 9% S (24% SO3), 3% MgO, and 8% CaO. It is worth mentioning that ICL PotashpluS™ contains boron, and 100% of sulfur, magnesium, and calcium in this fertilizer are in the form of sulfate (SO4).
Since 2015, the fields have remained in a monoculture of maize planted for grain (except in 2019, when maize was harvested for silage). The fertilizer reductions in the studied fields have been implemented since 2019. The maize variety grown in the experimental fields are Dekalb DKC 3730 from Bayer (Monsanto). In the studied fields, basal fertilization with urea 46% N (with urease inhibitors F.2.1) was applied at NT sowing and dosed directly using a cultivator aggregated with a seeder to a depth of about 20 cm. In the PL sowing variant, a traditional fertilizer spreader was used before tillage, and the fertilizer was mixed with an approximately 5–10 cm soil layer with a cultivator. In both technologies, the doses of 0.0, 150.0, 200.0, and 250.0 kg ha−1 of urea corresponded to the N content of 0.0, 69.0, 92.0, and 115.0 kg N ha−1.
Soil acidity (pH) was determined from a 1:2.5 soil suspension (10 g of soil, 25 mL of water) prepared in distilled water. An automatic multifunctional potential meter HQ40d equipped with a glass measuring electrode pHC301 (Hach, Loveland, CL, USA) was applied.
Water holding capacity (WHC) was determined using the under-bed (suction) method. Approximately 10 cm high plastic cylinders, onto which permeable nylon fabric membranes were placed and attached with a rubber band, were used for the measurements. The cylinders were weighed, filled with soil, and then weighed again. The determination of WHC was carried out after the preparation of a cuvette. Its bottom was covered with sand at such a height that the sand covered the filler of the bottle turned upside down, thus regulating a constant water level. The cylinders of soil were placed in the cuvette prepared in this way and incubated for at least 10 days until a constant mass was obtained. After completion of the incubation, WHC was calculated using the following formula: Mw = Mt − Ms, where Mw is the mass of water in grams, Mt is the total mass of the container and wet soil in grams, and Ms is the total mass of the container and dry soil in grams (1 g of water is equal to 1 milliliter of water, therefore, Vw = Mw). Consequently, the percentage of holding capacity (WHC%) = (Vw/Vt) × 100, where Vw is the volume of water and Vt is the total volume of saturated soil.
The total carbon (TC) content was measured using an automatic carbon analyzer TOC-VCSH SSM 5000 A (Shimadzu, Kyoto, Japan). A total of 150 mg of soil was pulverized, dried, and combusted at 900 °C in a column containing a platinum and cobalt oxide catalyst. All carbon compounds were converted into carbon dioxide and detected using an infrared detector.
Easily degradable carbon (EDC) was measured spectrophotometrically (λ = 550 nm, UV-1800, Shimadzu, Kyoto, Japan) in extracts prepared (2.5 g of air-dry soil sample (dw) mixed with 2 mL of 0.2 KMnO
4 in 1 M CaCl
2 (pH 7.2) and diluted to 20 mL using distilled water) according to the Weil et al. [
28] method. Details are described in [
20].
The content of N forms (NH4-N and NO3-N) and biologically available phosphorus (Olsen P) were determined colorimetrically using an AutoAnalyser 3 System (Bran+Luebbe, Norderstedt, Germany) in the prepared soil extracts (35 g of fresh soil (fw) and 100 mL of water).
The total concentrations of potassium (K), magnesium (Mg), and calcium (Ca) were established using the flame atomic absorption spectrometry (FAAS) technique (ZA-3300 Hitachi, Tokyo, Japan) after microwave mineralization of the soil material (Ethos One, Milestone, Sorisole, BG, Italy) in a mixture of HNO3:HCl:HF (2:1:5 mL).
The total sulfur (TS) content was determined at the District Chemical and Agricultural Station in Lublin. The determination was carried out using the nephelometric technique. The principle of the method is to oxidize organic sulfur to SO4 and determine its content nephelometrically as BaSO4. The oxidation process while maintaining sulfur as SO4 was carried out in an electric muffle furnace (Nabertherm GmbH, Lilienthal, Germany) at 500 °C in the presence of sodium bicarbonate and oxygen from the air. Readings were taken on a spectrophotometer capable of measuring absorbance at 490 nm (Specol 11, Carl Zeiss, Jena, Germany).
Respiration activity (AR) in the studied soils was determined with the gas chromatography (GC) technique. Briefly, 5 g of each soil sample was placed in 60-mL dark sterile bottles, tightly closed, and incubated at 20 °C for one week. Both at the beginning of the experiment and after 7 days, the level of accumulated CO2 was monitored in the headspace of the soil samples (GC CP-3800, Varian, Palo Alto, CL, USA). Based on the differences between the concentration of CO2 at the start and end of the experiment, AR was calculated and expressed as the mass of produced CO2 per the mass of fresh soil used in the experiment and per unit of time (mg CO2 per kg of fresh soil per day).
The chemical preparation of HA-like materials was based on the Kononova and Belchikova [
29] method with modifications. Briefly, the soil samples were incubated with 0.1 M NaOH in a ratio of 10 mL of liquid per g soil for 4 h with shaking at 180 rpm·min
−1 (25 °C). The supernatant was separated by centrifugation (10 min, 4000 rpm), acidified with 1 M HCl to set pH < 2, and allowed to stand overnight (HA-like precipitate). The HA-like precipitate was obtained by centrifugation at 12,000 rpm (10 min), after which it was washed with water at pH 1. The decantation process was then performed. The HA-like precipitate was stored (4 °C, dark) until use. The susceptibility of the HA-like solution (0.02% HA-like, in 0.5 M NaHCO
3 with 5% H
2O
2) precipitates to 5% H
2O
2 oxidation was determined by measuring the absorbance (at λ = 465 and λ = 665 nm, BioSpectrometers, Eppendorf, Hamburg, Germany) of the HA-like solutions [
29]. The absorbance [
30] was measured after 1, 6, and 24 h of oxidant treatment with simultaneous measurement of HA-like material absorbance without oxidant treatment (0.02% HA-like, in 0.5 M NaHCO
3). The measured absorbance values and indices [
30] were used as proxies for estimating the degree of humification (E4/E6). All the above-mentioned measurements were taken in triplicate. The E4/E6 ratio (ratio of the absorbances at 465 nm and at 665 nm) has been widely used to study the HA fraction [
31]. The E4/E6 ratio is considered to be inversely related to the degree of condensation and aromaticity of the humic substances and to their degree of humification [
32]. In our study, the E4/E6 ratio was used to characterize the organic compounds in the HA-like fraction of the SOM in agricultural soil.
The yield was determined based on the weight of the harvester, previously calibrated with a legalized scale. The harvester saves a yield map; next, in the Climate Field View™ platform (The Climate Corporation, San Francisco, CA, USA), the selected area of the field is marked and finally a yield summary is received. The obtained data are precise because the CFV software also shows the paths of the harvester’s travel, and an operator is involved during harvesting to supervise that the harvester harvests grain strictly from a given plot (in this study, corresponding with the N rate) in one pass.
The data were statistically processed by means of SPSS 27 PL (IBM, Armonk, NY, USA). The requirements of parametric tests were checked using Shapiro–Wilk and Levene’s statistics. In order to assess the effects of the tillage system and the level of fertilization and to compare changes over time, a MANOVA with Tukey’s post hoc test was used. Then, a correlation analysis was conducted by calculating either Person’s r or Spearman’s rho coefficient, depending on data normality. A correlation matrix was prepared using R software (version 4.1.2, R Foundation, Vienna, Austria) [
33]. Significance was accepted at
p < 0.05, and all figures present average values of the given parameter ± standard deviation (SD). For the correlation analysis, the significance of the r-values was indicated as follows: *—
p < 0.05, **—
p < 0.01. In order to examine the relationship between the studied soil properties and the yield obtained (after maize harvesting), a correlation analysis was performed for the seasons separately and for the entire dataset. In the description of the data, the measure of the correlation and its strength and direction are given, and statistical significance is denoted as follows: *
p < 0.05, **
p < 0.01. To avoid duplication of the correlations, they are presented based on half of the matrix.
3. Results
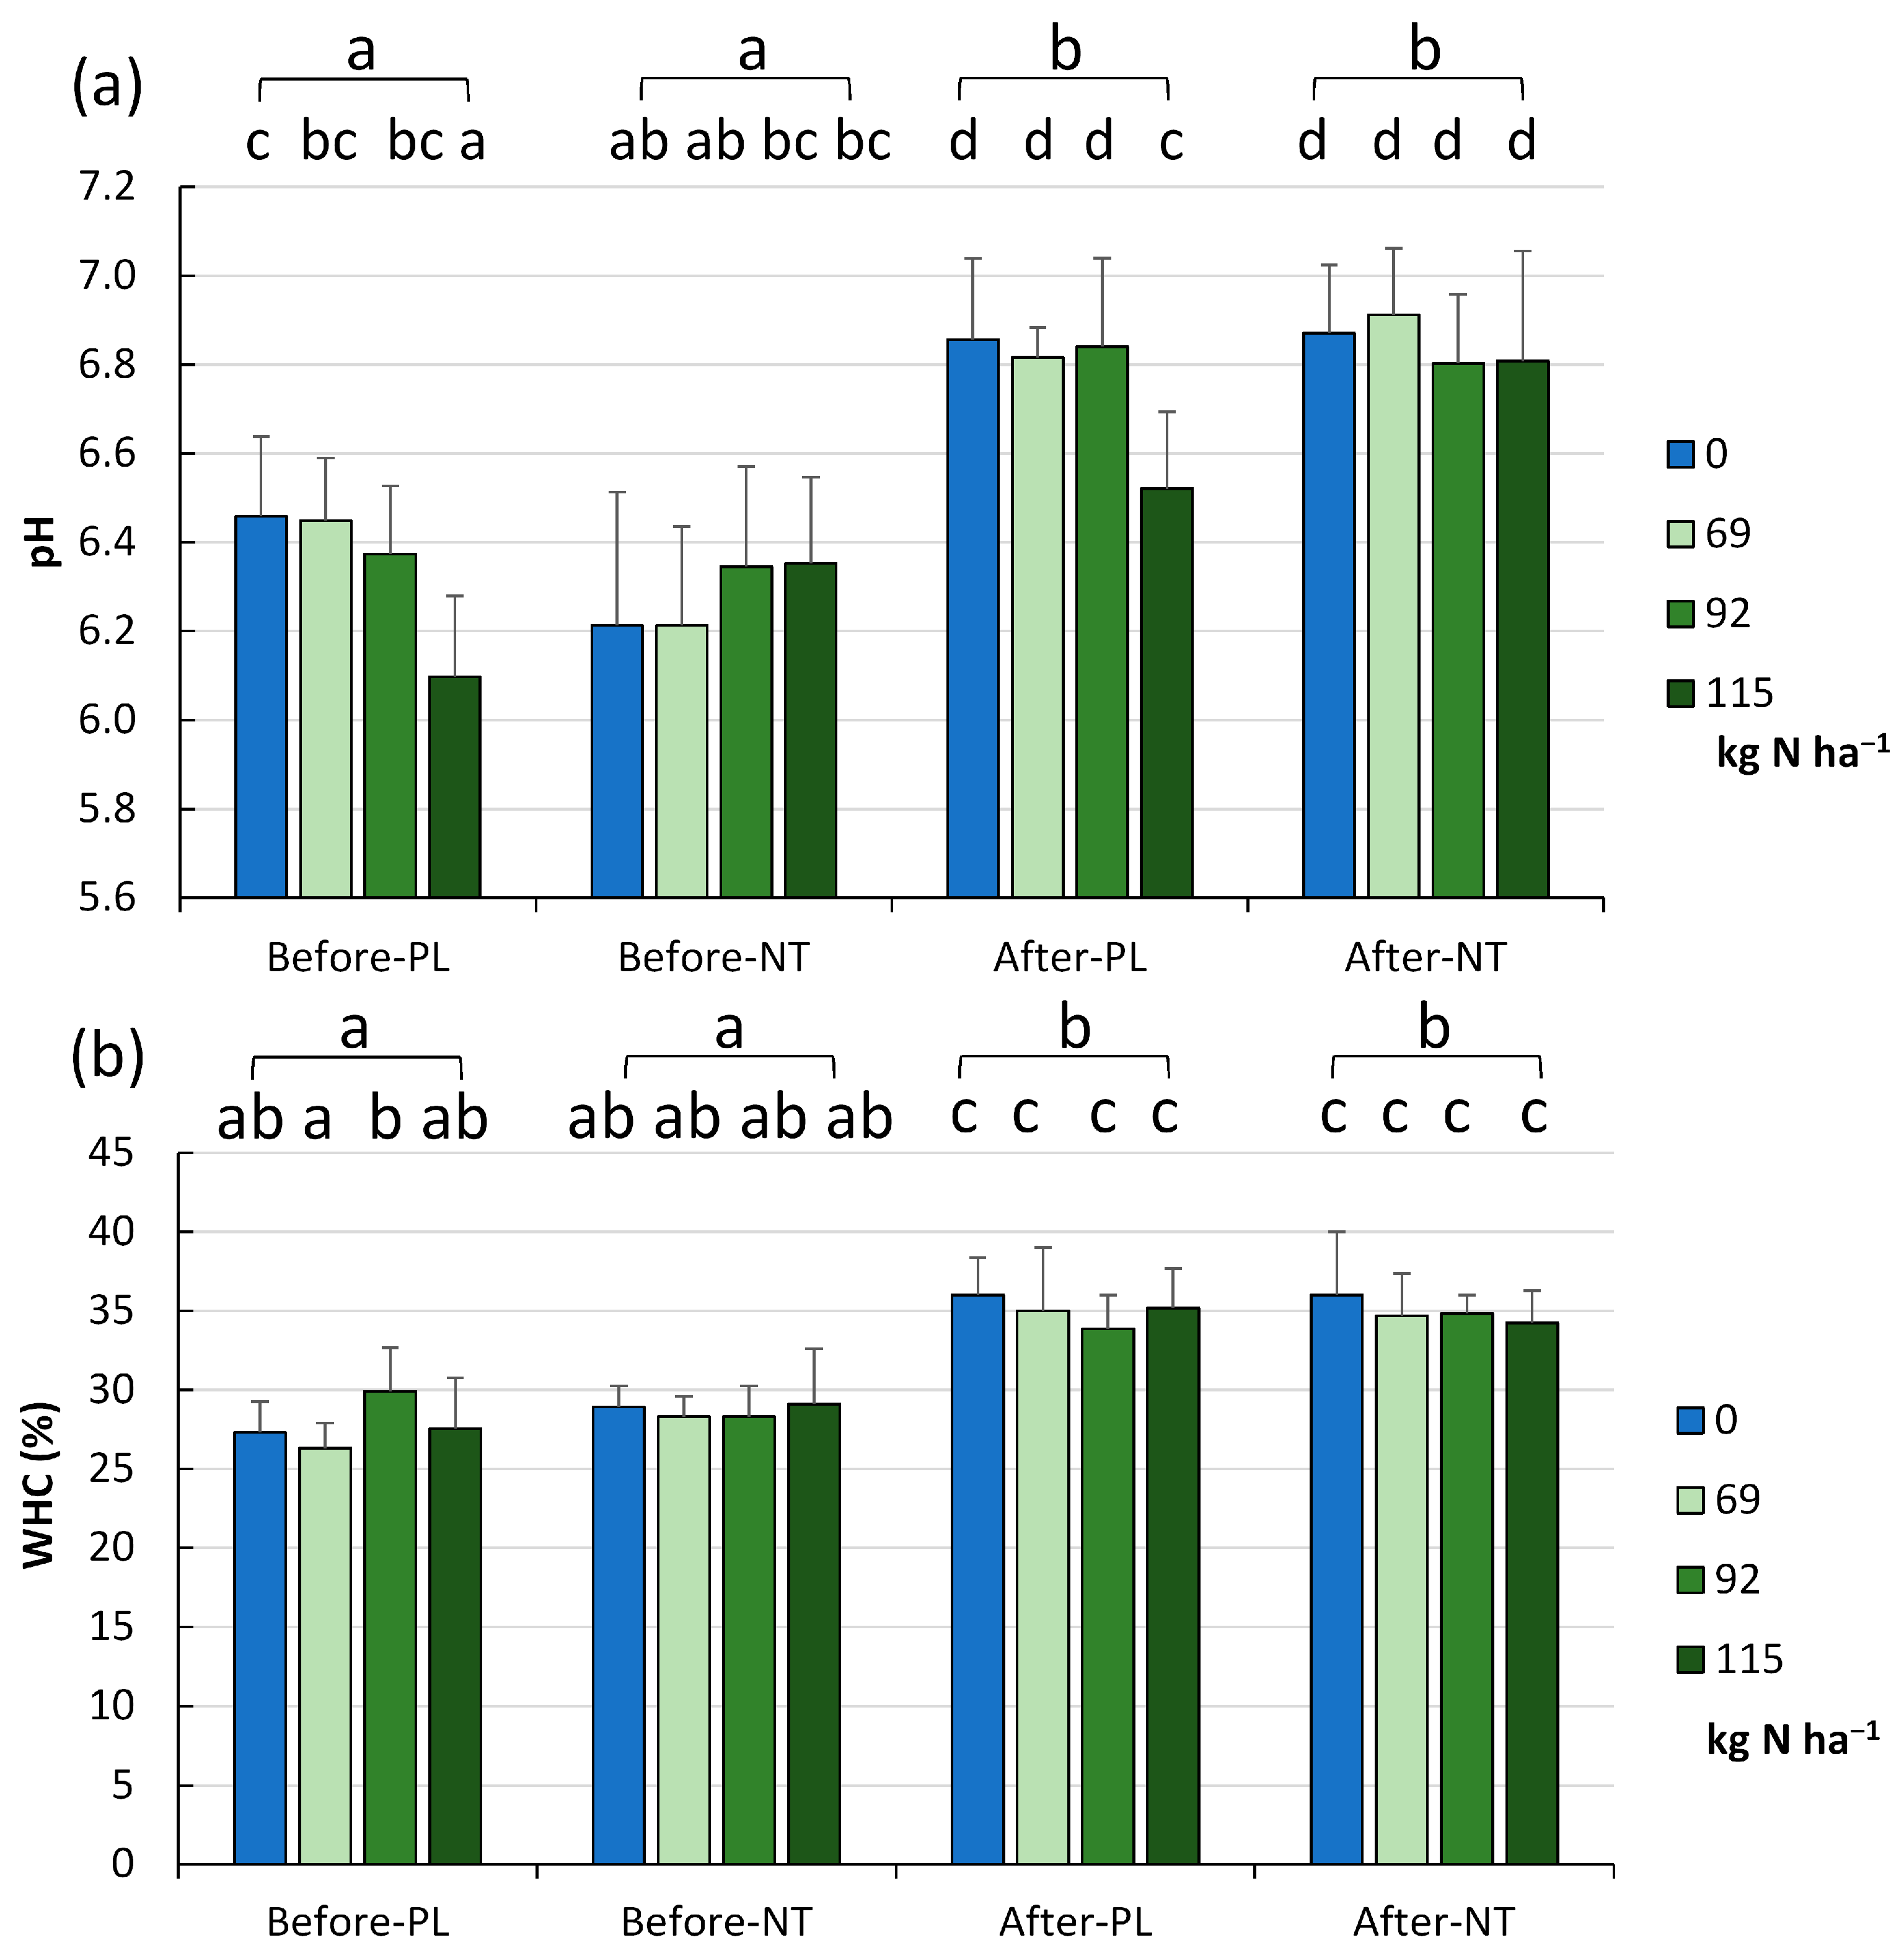
The variation in soil acidity and water holding capacity in each tillage system and level of fertilization in the two terms of the vegetation season is shown in
Figure 2a and
Figure 2b, respectively.
The soil pH value in the studied fields ranged from 5.69 to 6.77 (mean 6.31 ± 0.23). The analysis of the effect of reduced fertilization revealed a significant effect of the fertilizer dose on the pH in the PL field (
p < 0.001,
Figure 2a). Taking into account three factors (tillage system, fertilizer application rate, and the two terms of the vegetation season), homogeneity in the pH of soils sampled after maize harvesting was revealed (exception: PL system with 115.0 kg of N ha
−1, FR_1). In general, irrespective of the N dose, the acidity was approx. 0.4 pH unit higher (close to neutral conditions) at the end of the maize vegetation season than at the start of vegetation (
Figure 2a).
A similar trend was confirmed in the WHC level (
Figure 2b). A significant increase in WHC from 28.21 ± 2.51% in spring (before maize sowing) to 34.97 ± 2.79% in autumn was recorded after maize harvesting (
p < 0.001). In fact, this was the only factor differentiating the soils without differences within the groups (fertilizer dose) or between the tillage system (PL, NT) in a given season (before sowing, after harvesting).
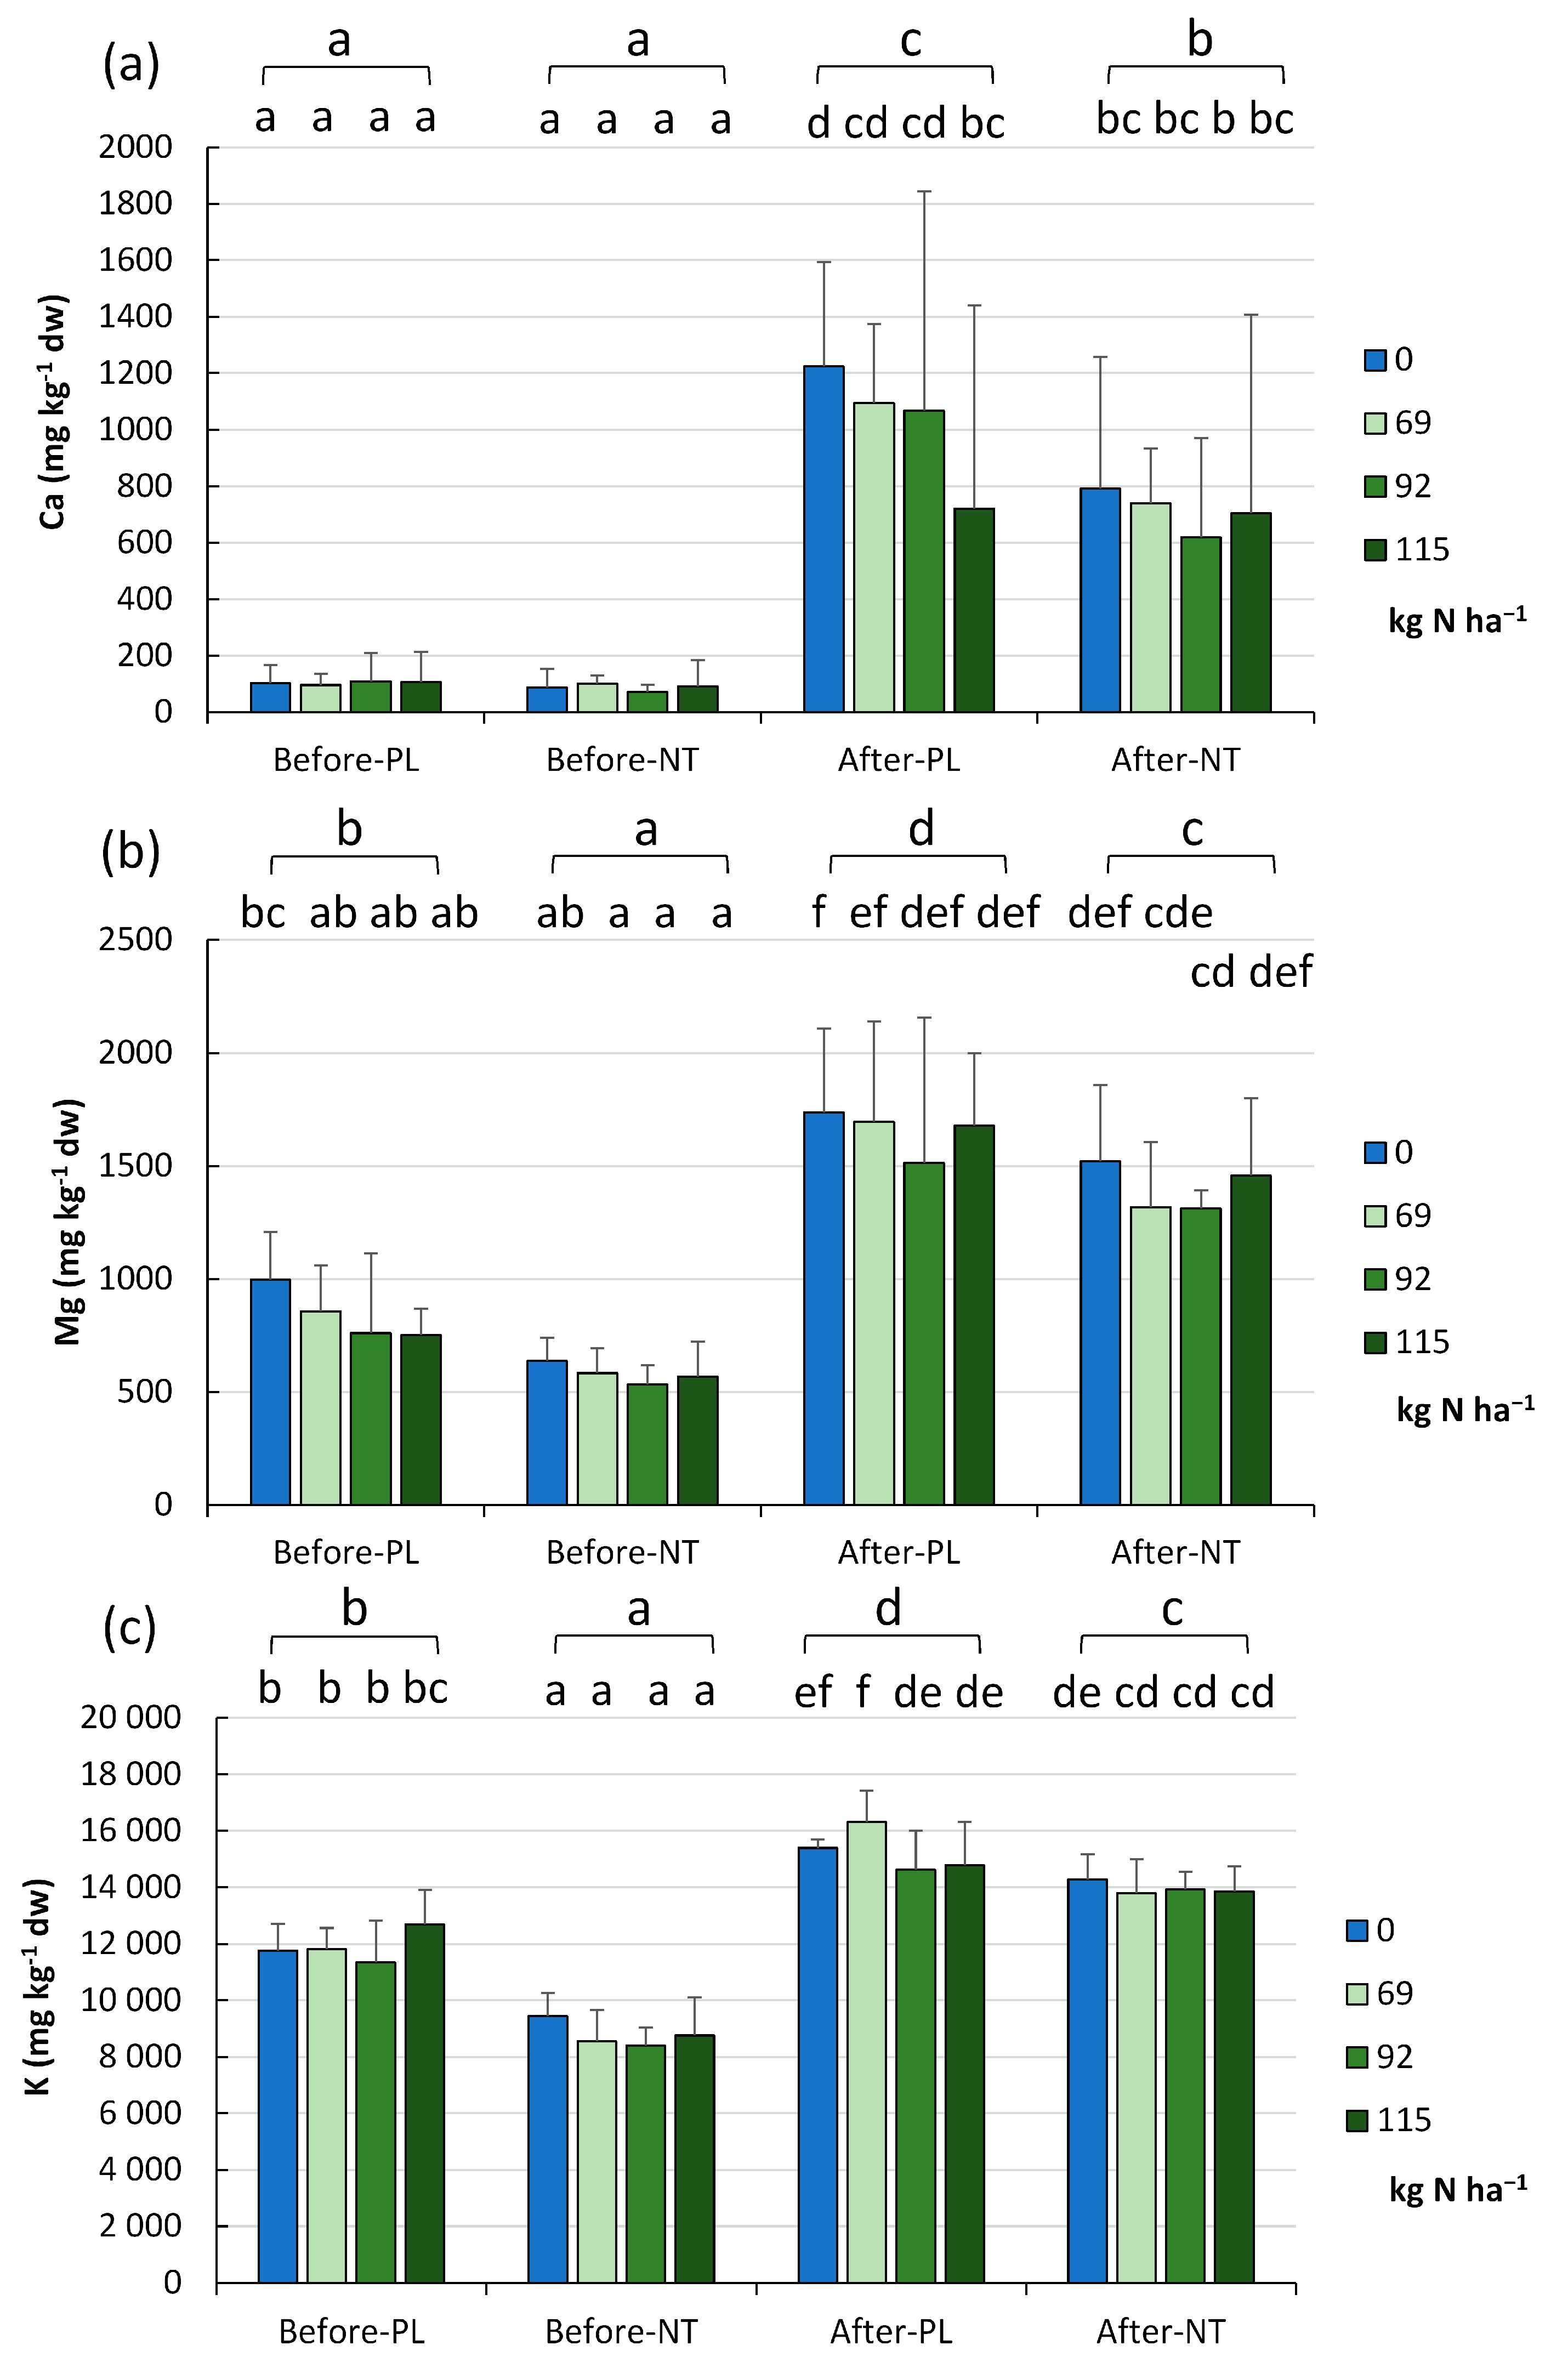
The analysis of the macronutrient abundance in the PL and NT fields resulted in the determination of Ca, Mg, and K levels at the beginning and end of the maize vegetation season and with reference to the fertilizer dose (
Figure 3a,
Figure 3b and
Figure 3c, respectively).
In spring, the soils contained an average of 95.89 ± 57.62 mg Ca kg
−1 dw irrespective of the tillage system and the fertilizer dose (
Figure 3a). After the maize harvest, significantly higher Ca levels were recorded, i.e., on average 869.8 ± 477.3 mg kg
−1 dw (
p < 0.001). The analysis of the complete set-up indicated lower Ca content in the NT and 92 kg N ha
−1 (FR_2) variant (at both the beginning and end of the maize vegetation season), and the highest content in autumn in the unfertilized part of the PL field (1224 mg kg
−1 dw). In general, there was a trend towards the lowest Ca values in spring and the highest concentration in autumn in both the PL and NT systems (
p < 0.001,
Figure 3a).
Similar to the content of Ca, the Mg concentration in the arable fields was significantly higher in autumn (1529.2 ± 402.2 mg kg
−1 dw) than in spring (711.3 ± 235.2 mg kg
−1 dw,
p < 0.001). The analysis of the effect of reduced N fertilization on Mg levels both before maize sowing and after harvesting showed that the 20 and 40% fertilization reduction resulted in a slight, though statistically significant, decrease in the content of this element, which was particularly evident in autumn (
Figure 3b).
The K content exhibited a similar trend of changes to that of the elements reported above (
Figure 3c). The K content displayed variation between the seasons and tillage systems (two-factor system). The lowest values were recorded before maize sowing in NT, followed by PL, and higher values were noted after harvesting in NT and PL (
p < 0.001). To summarize, the reduction of the N fertilization dose undoubtedly does not reduce the potassium levels in soils (
Figure 3c).
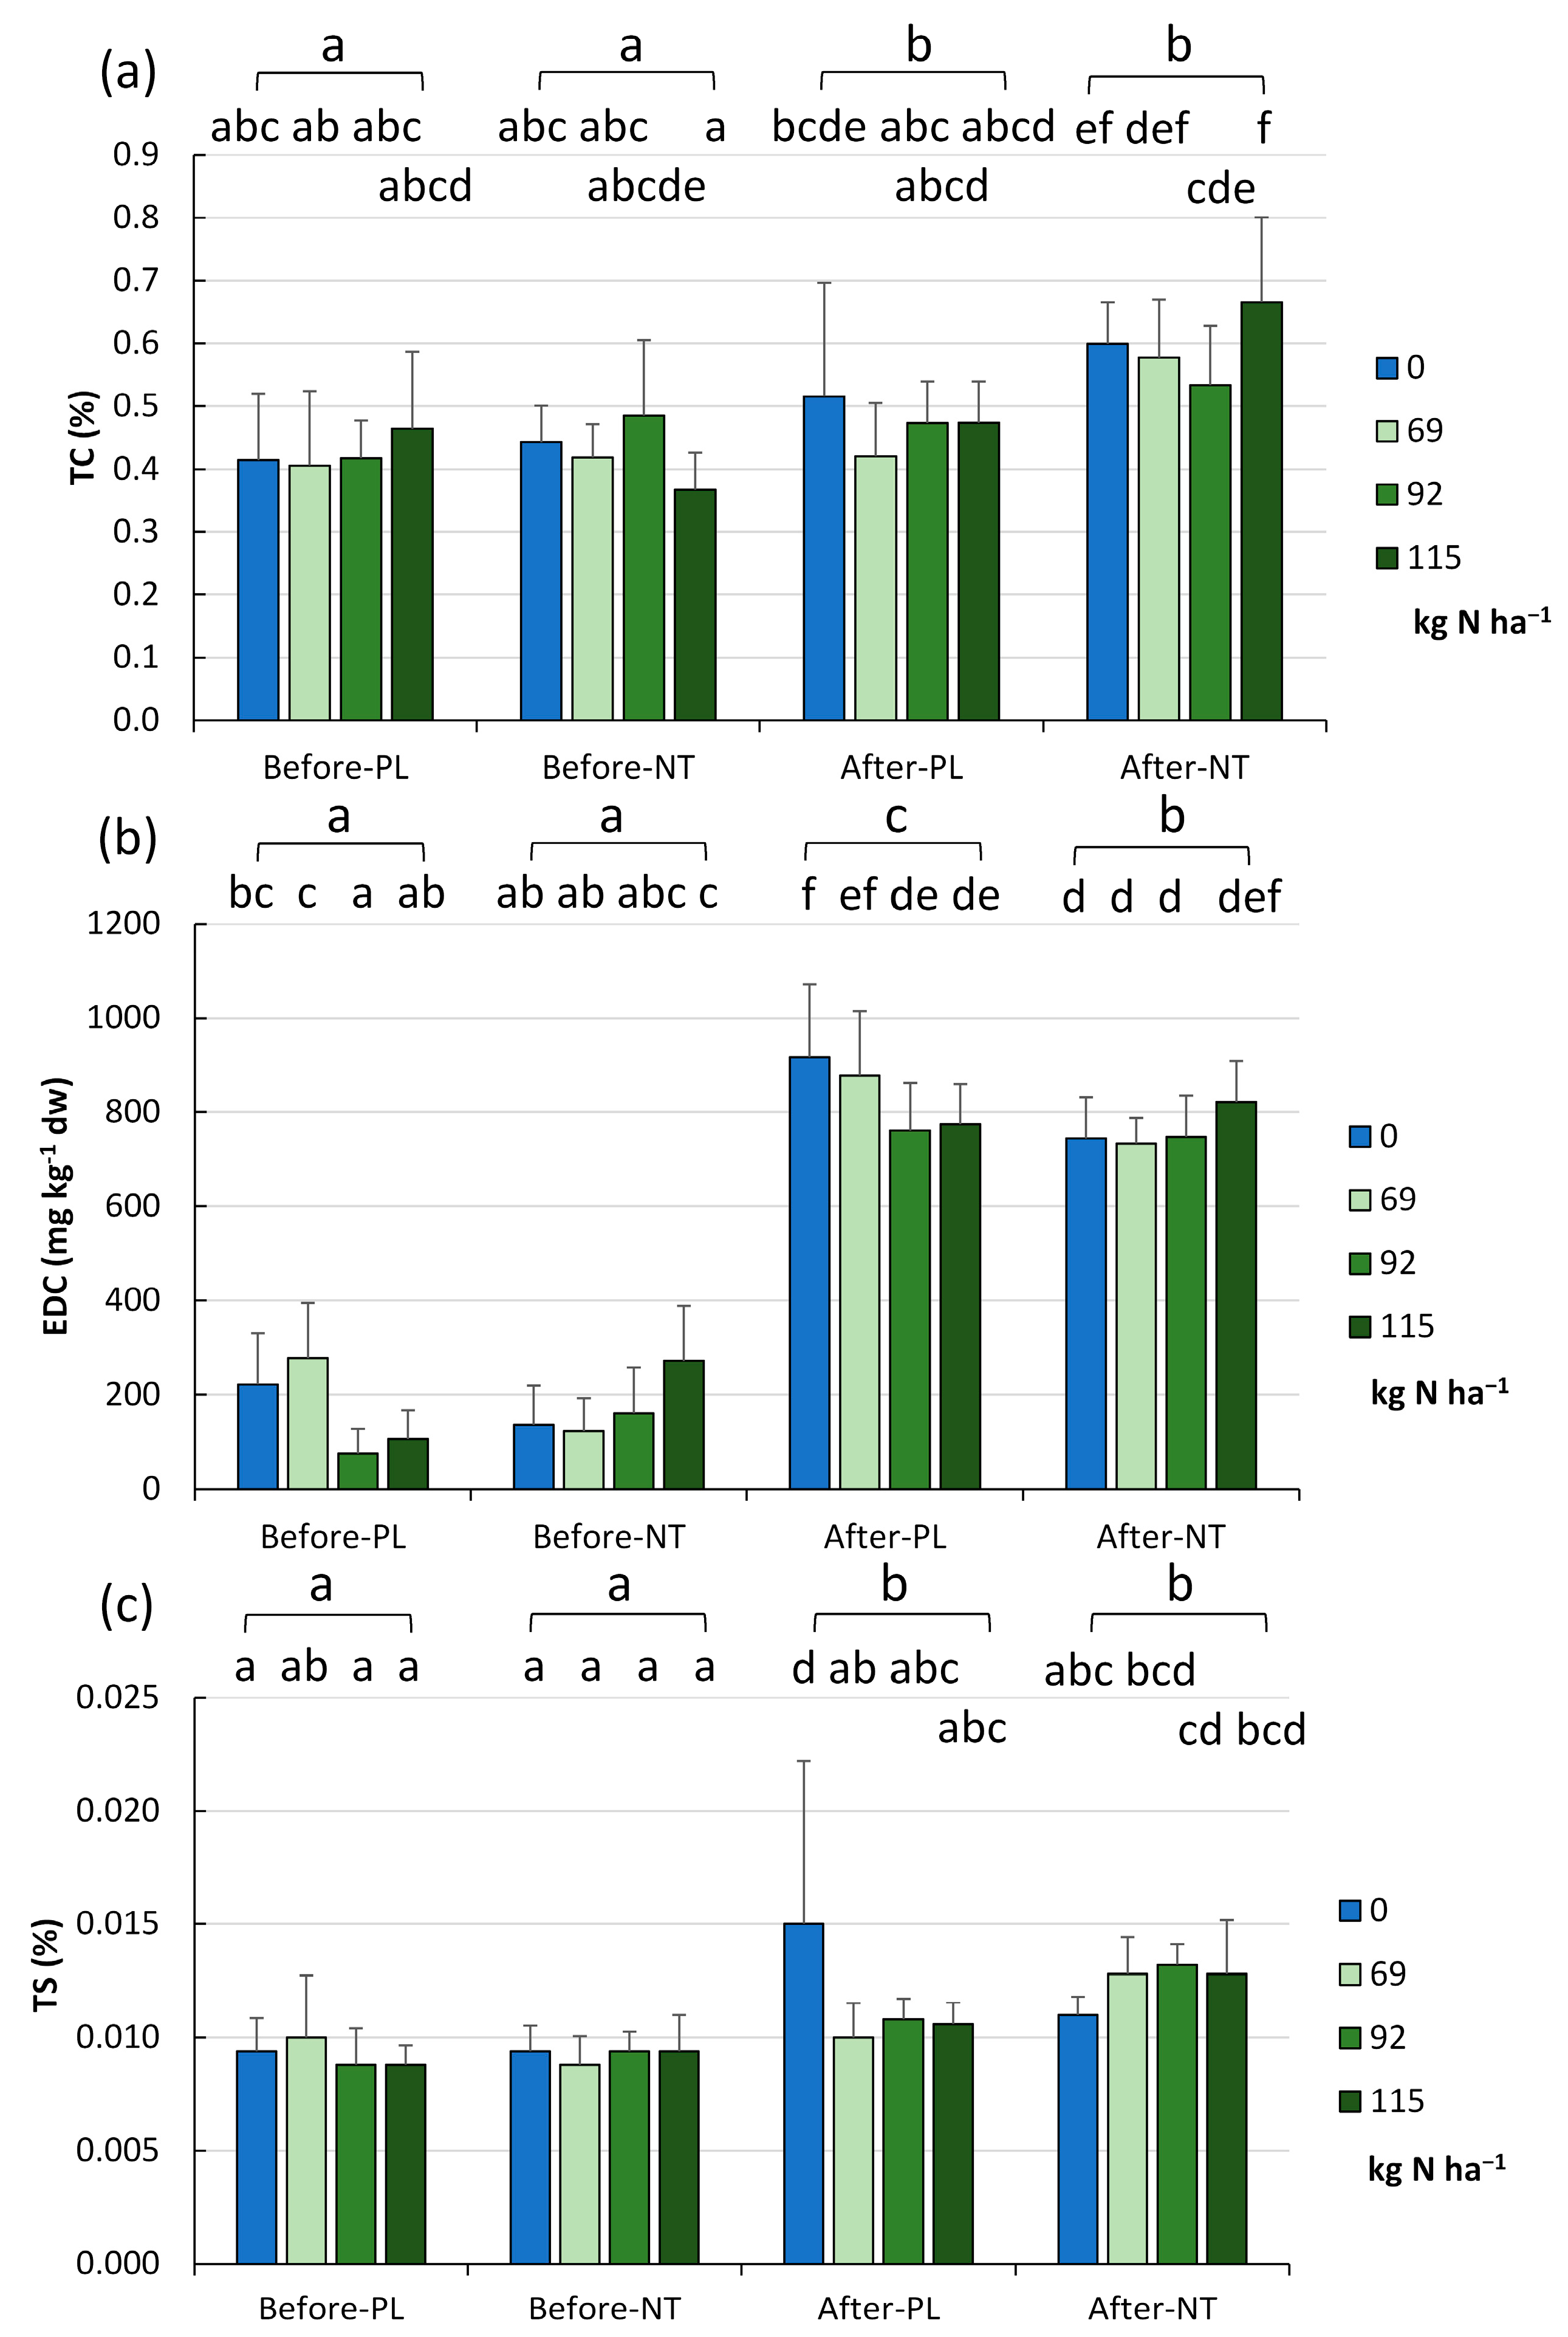
The entire TC pool was composed of total organic carbon (TOC), whose concentration did not exceed the level of 1% (due to the mineral character of the soils), with an average content of about 0.532 ± 0.127% (
Figure 4a). A statistically significant effect of the fertilization level was only observed in the NT field (after harvesting), with the lowest TC content of 0.534% at 92.0 kg N ha
−1 (FR_2) and the highest level (0.666%) at 115.0 kg N ha
−1 (FR_1,
p < 0.01).
To complement the data on the content of carbon in the tested soils, its bioavailable (useful) fraction for microorganisms and plants was determined (
Figure 4b). The pool of bioavailable carbon was significantly higher in autumn (mean 796.996 ± 114.102 mg kg
−1 dw) than in spring (mean 172.012 ± 114.10 mg kg
−1 dw,
p < 0.001). It was revealed that, at the end of the growing season, the reduced fertilizer application rates did not significantly affect the levels of the bioavailable form of carbon (
Figure 4b).
There was also a significant increase in the TS content (
Figure 4c) from spring to autumn (0.009 ± 0.001% in spring and 0.012 ± 0.003% in autumn,
p < 0.001), with no significant differences between the cultivation methods at each sampling date. Taking into account the N fertilization rate, it was found that the reduced N doses did not affect the TS level (
Figure 4c).
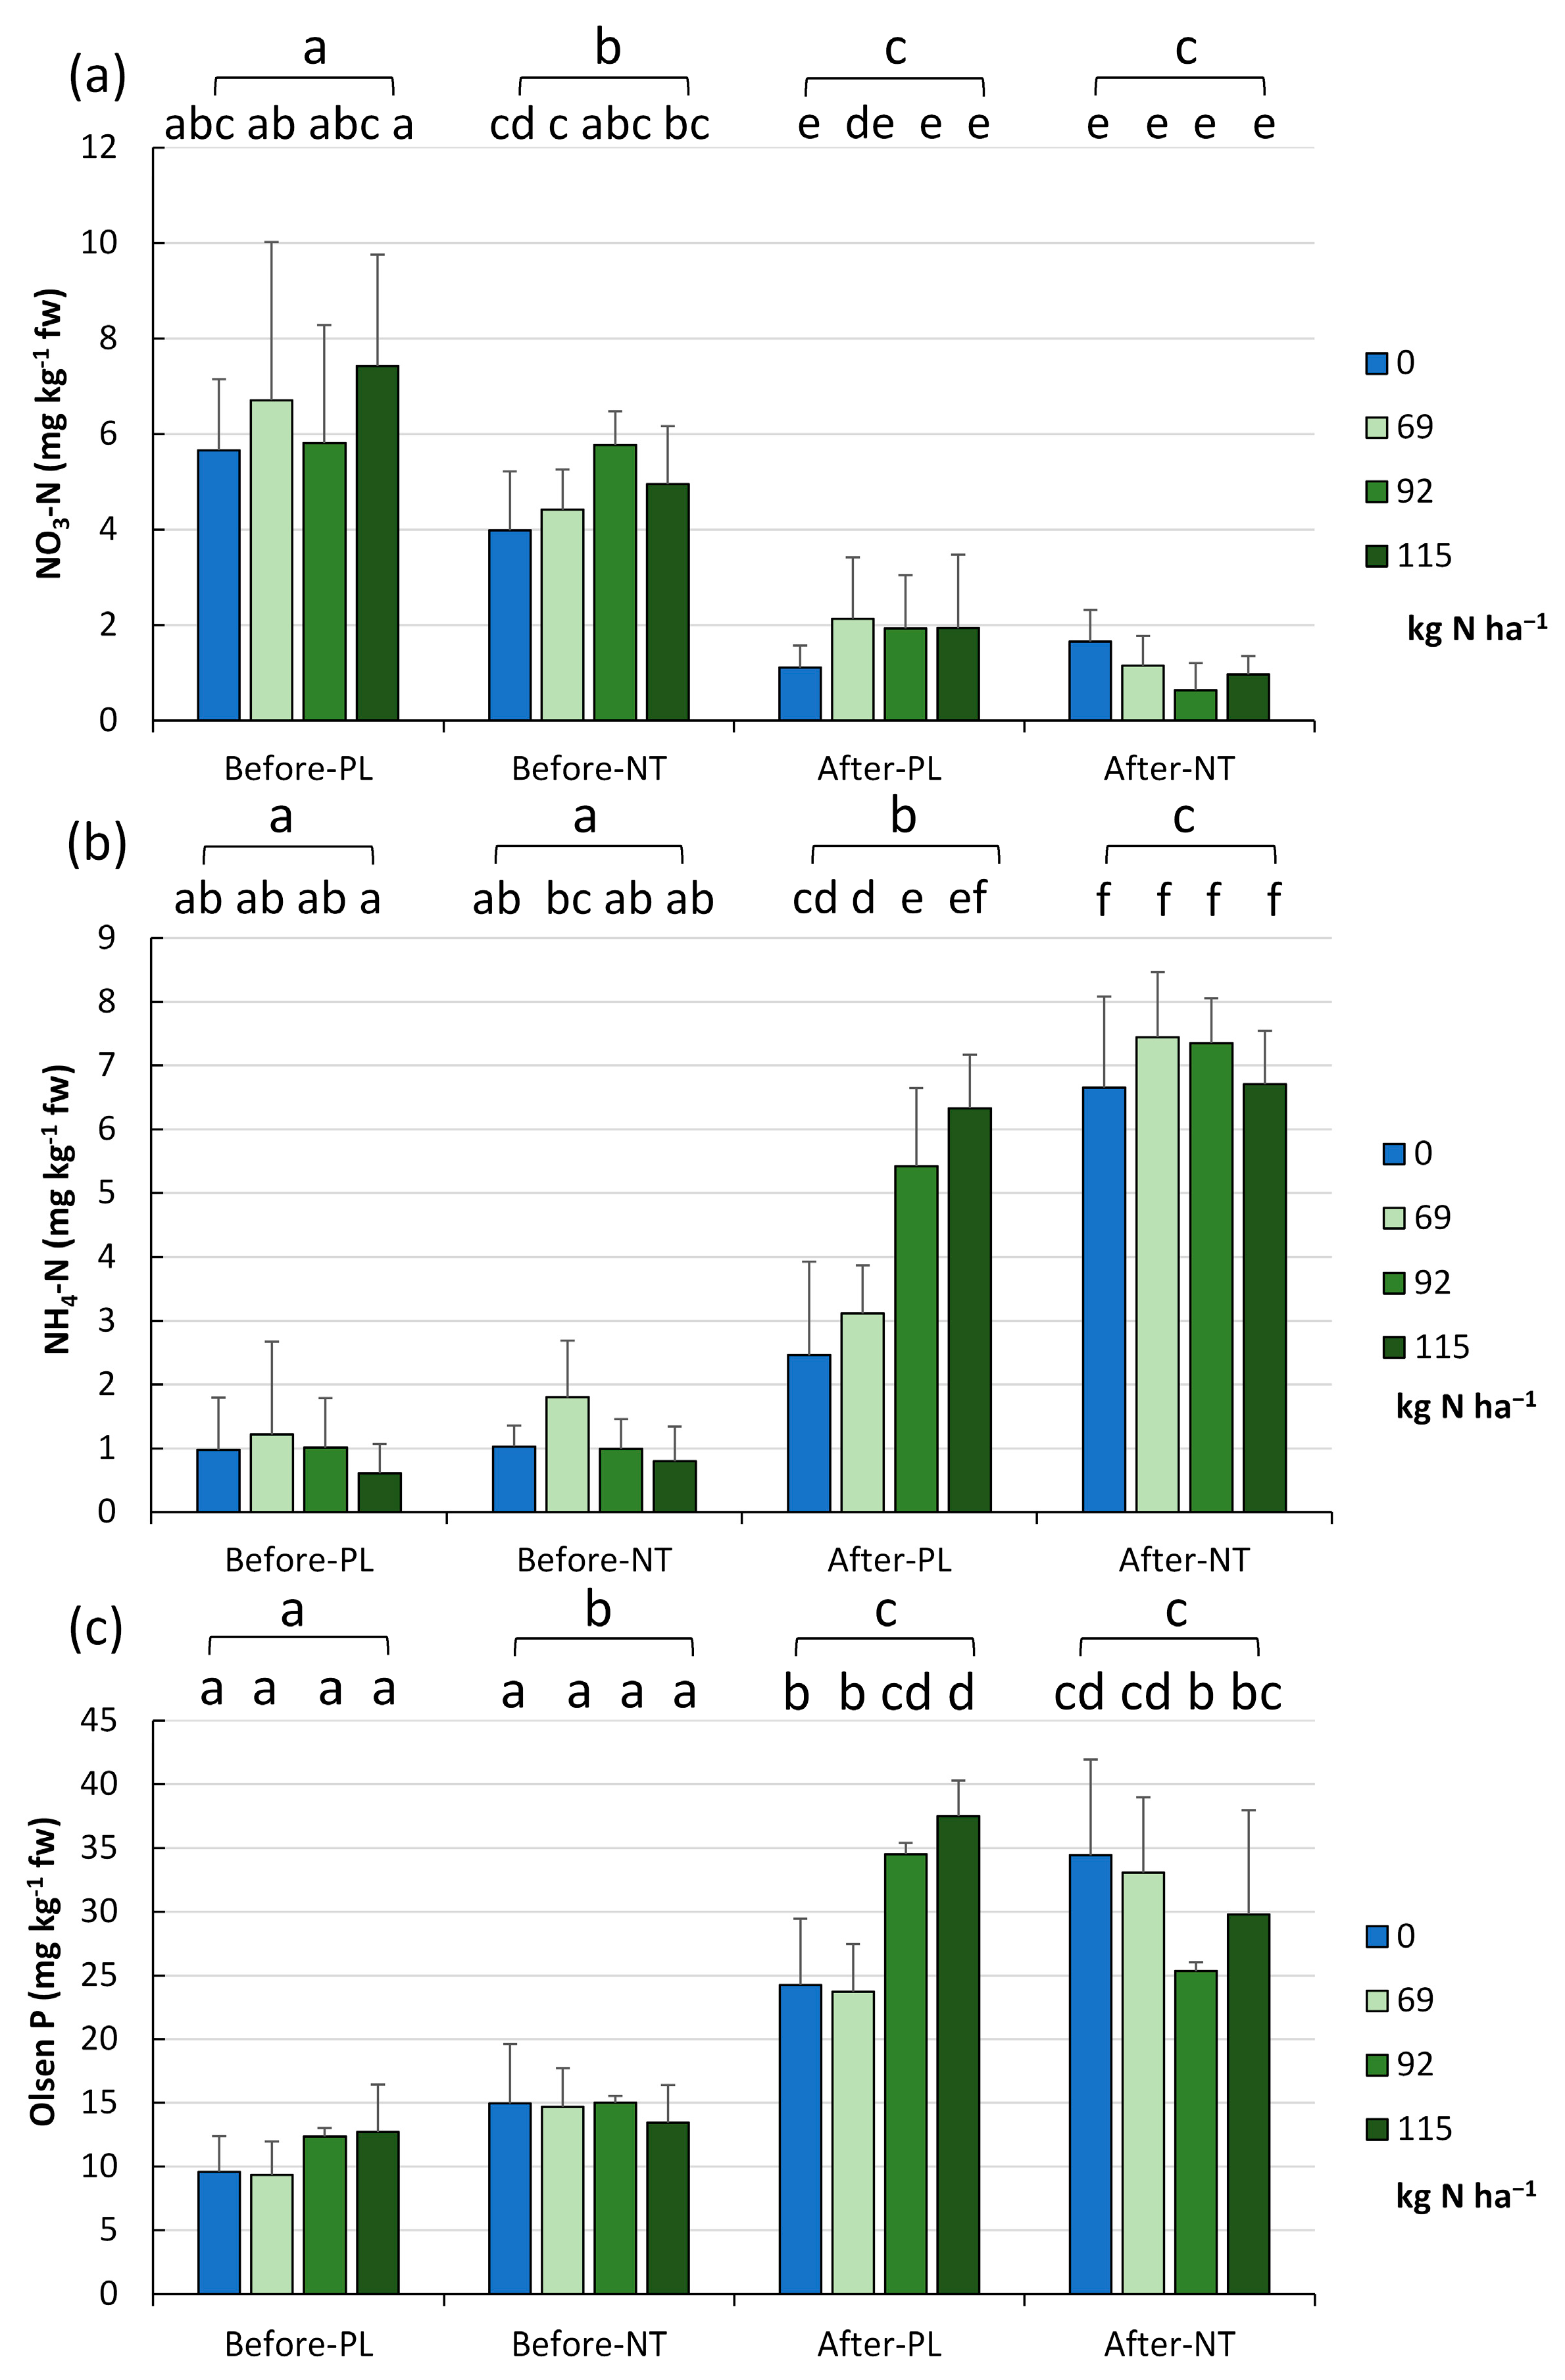
As part of the comprehensive characterization of the chemical traits of the studied soils, their content of N (nitrate, ammonium) and P forms was also determined, focusing on their bioavailable (and therefore most useful) form for plants (called Olsen P). The changes in the availability of nitrates (V), ammonium, and Olsen P in each tillage system and level of fertilization in the two terms of the vegetation season are illustrated in
Figure 5a,
Figure 5b and
Figure 5c, respectively.
The NO
3-N (
Figure 5a) decreased from 5.59 ± 2.13 mg kg
−1 fw in spring to 1.44 ± 1.03 mg kg
−1 fw in autumn (
p < 0.001). This trend was maintained at every N fertilization rate tested. The full factorial analysis indicated the lowest nitrate values at the end of the growing season in NT with the N dose addition of 92.0 kg ha
−1, FR_2 (0.637 mg kg
−1 fw), and the highest levels were recorded in PL at the beginning of vegetation with the application of 115.0 kg N ha
−1, FR_1 (7.42 mg kg
−1 fw,
p < 0.001,
Figure 5a).
The ammonium N content increased from spring to autumn in a statistically significant manner (
Figure 5b) from 1.054 ± 0.837 to 5.685 ± 2.067 mg kg
−1 fw (
p < 0.001). After harvesting the maize, significant differences were found between the cultivation methods (
p < 0.001), i.e., there were higher NH
4-N levels (7.038 mg kg
−1 fw) in NT than in PL (4.33 mg kg
−1 fw). This trend was maintained regardless of the N fertilization rate (
Figure 5b). However, the 40% reduction (FR_3) of fertilization in the PL system (in autumn) resulted in a significant decrease in the soil NH
4-N content in comparison to higher fertilization rates. In contrast, this relationship was not confirmed in the NT system.
After harvesting the maize crop, the pool of bioavailable Olsen P (
Figure 5c) increased from the spring values from 12.764 ± 4.155 to 30.331 ± 7.857 mg kg
−1 fw (
p < 0.001). The analysis of all variables revealed that there were no significant differences in soil samples exposed to the different levels of fertilization and collected before maize sowing, while samples taken after maize harvesting seemed to be more diverse in this respect (
p < 0.001).
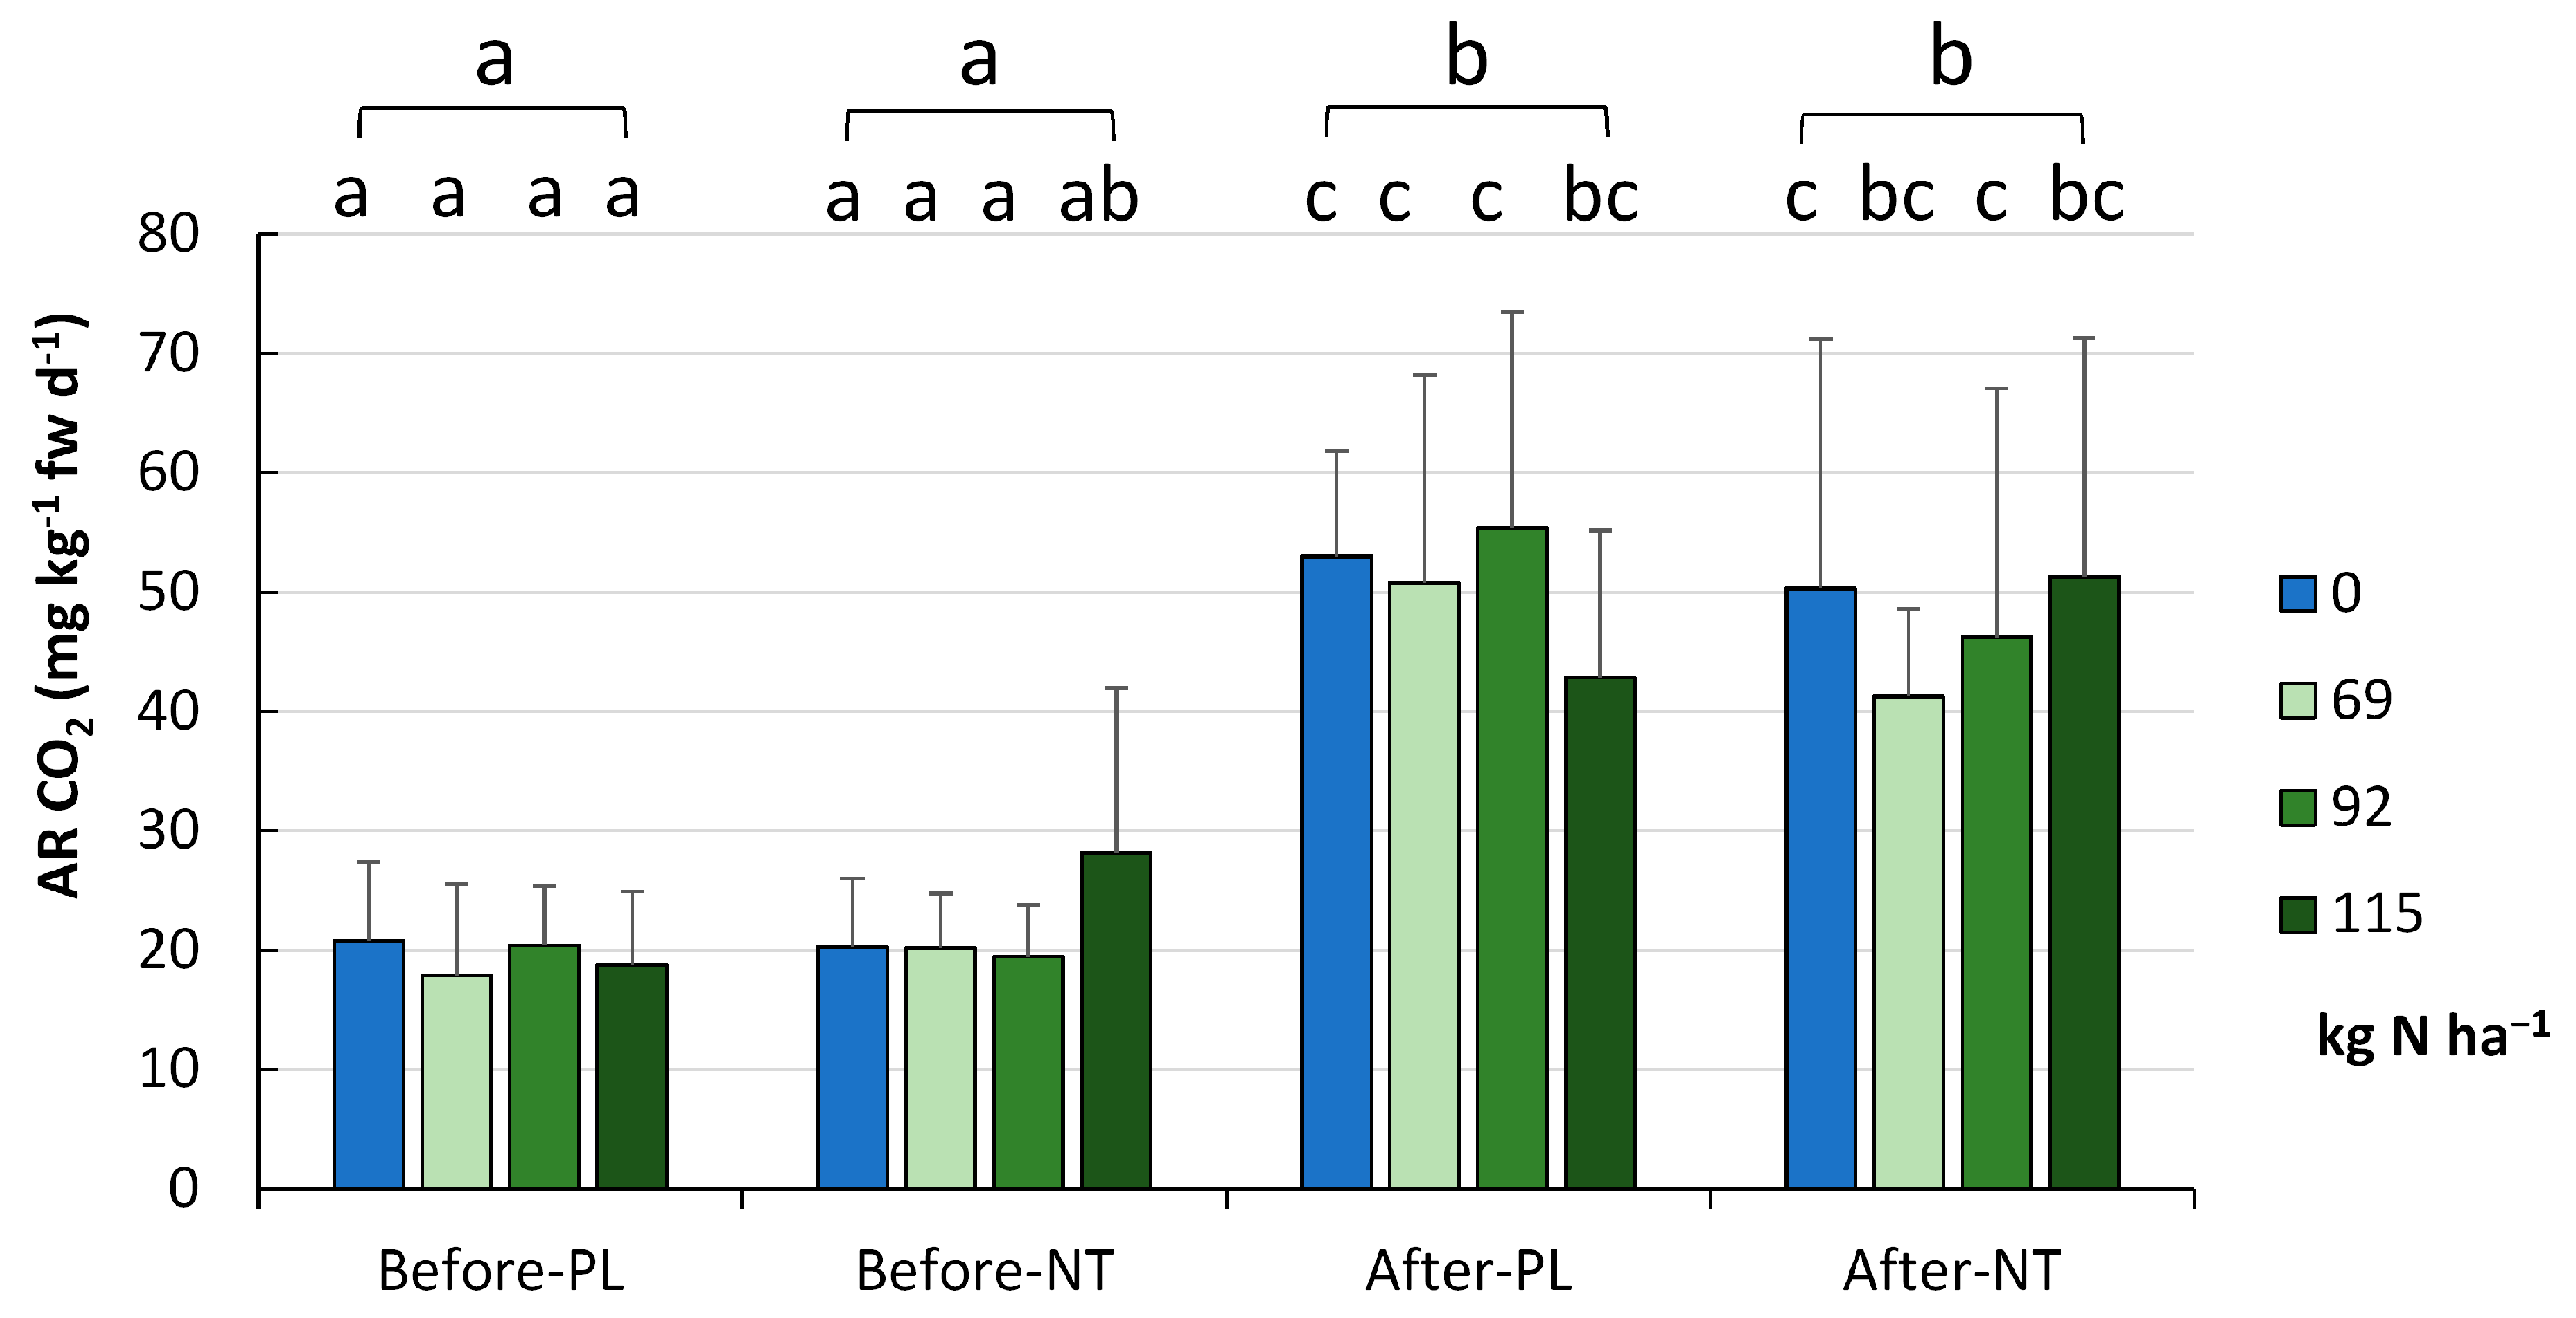
The respiratory activity (AR) of the tested soils (
Figure 6) was significantly higher after maize harvesting in autumn (48.9 ± 16.7 mg CO
2 kg
−1 fw d
−1) than before maize sowing in spring (20.7 ± 7.7 mg CO
2 kg
−1 fw d
−1,
p < 0.001), showing no variation between the cropping systems in the two terms of the vegetation season. The reduced doses (in accordance with the EC suggestion) by 20% (FR_2) and even by 40% (FR_3) had a positive (but insignificant) impact on the level of AR.
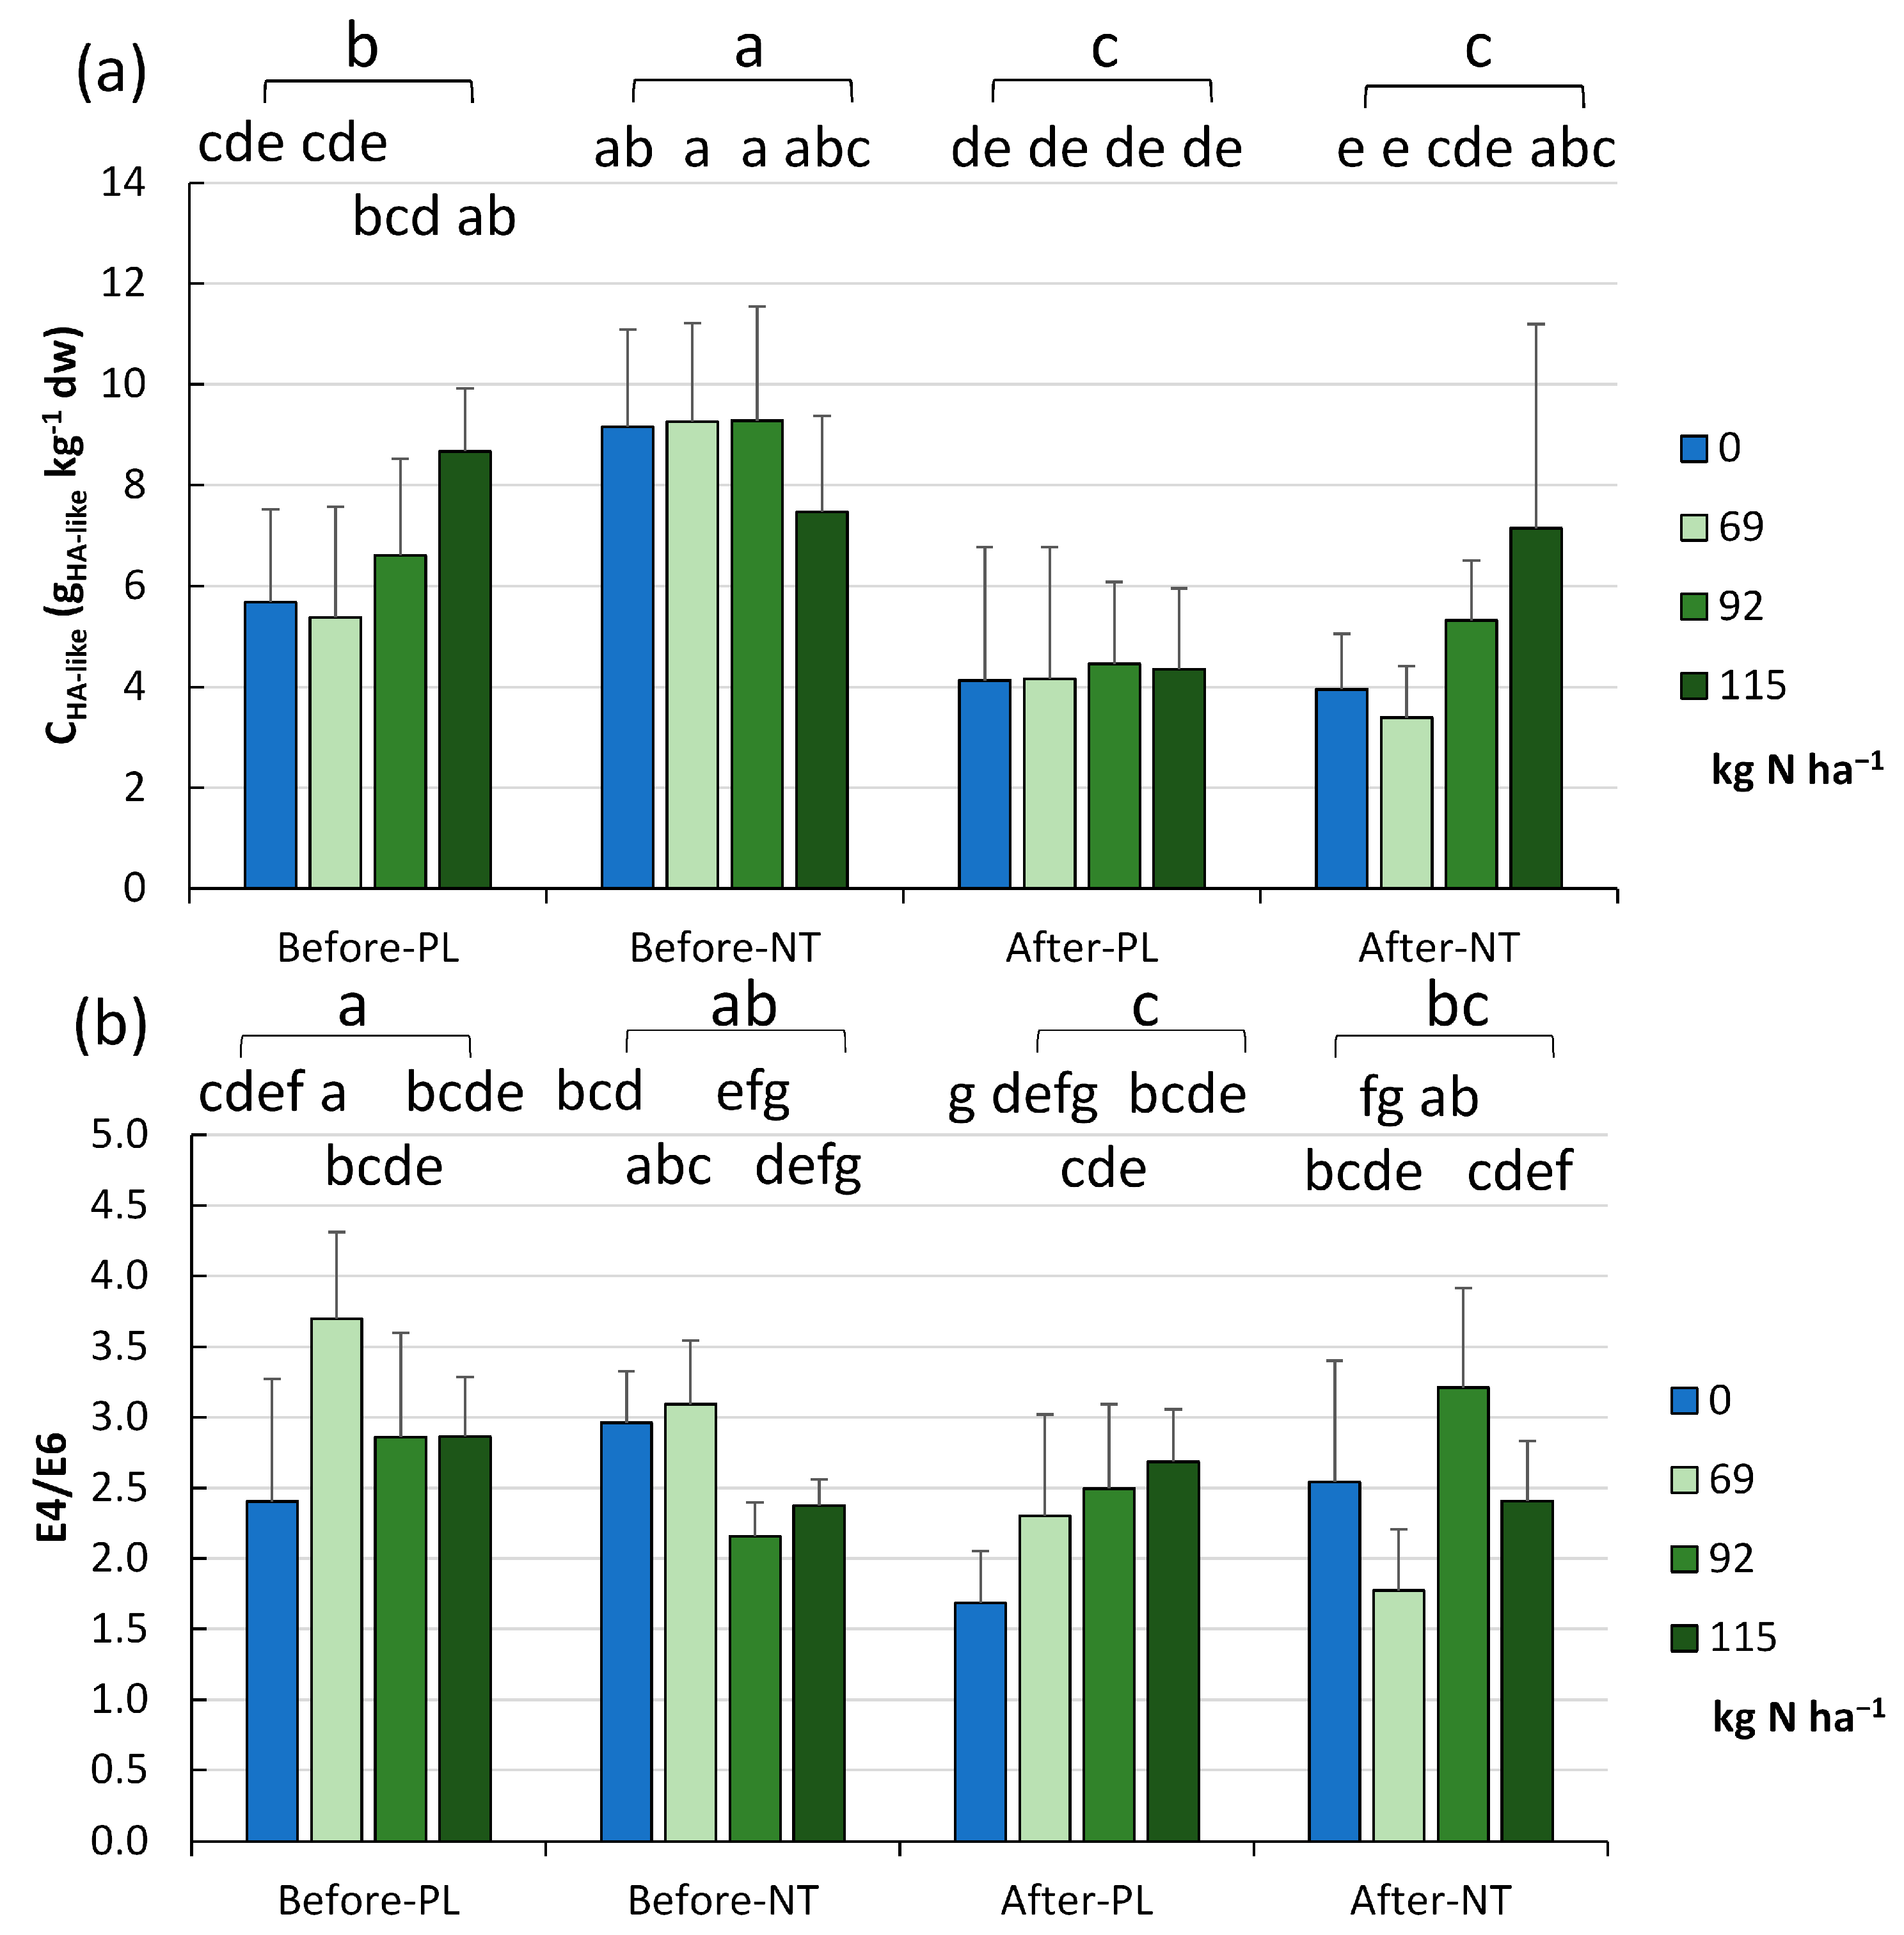
The level of HA-like substances and E4/E6 ratios obtained in the experiment are presented in
Figure 7a and
Figure 7b, respectively. The content of HA-like substances was in the range of 2.37–13.66 gHA-like kg
−1 (mean 7.69 ± 2.42 g gHA-like kg
−1) and was significantly higher (
p < 0.001) in the NT than the PL system (8.79 ± 2.11 and 6.58 ± 0.21 gHA-like kg
−1, respectively). Our results suggest that, before maize sowing in the NT, it is not necessary to apply nitrogen, as it resulted in a lower level of HA-like substances, whilst it is more reasonable to reduce N fertilization by 20 or even 40% at the beginning of the vegetation season, in contrast to the end of vegetation when the maximal N dose resulted in the highest content of HA-like substances in the soil (
Figure 7a).
The PL experimental field showed different HA-like values depending on the amount of fertilization (
p < 0.05), i.e., the highest level of humic substances was recorded at the dose of 115.0 kg N ha
−1 (FR_1) (8.67 gHA-like kg
−1). The analysis of the full model showed significantly lower HA-like values in the PL field at 69 kg N ha
−1 (FR_3), while significantly higher values were recorded in the NT system with fertilization between 0.0 (FR_4) and 115.0 kg·ha
−1 (FR_1) (
p < 0.001) considering all the results obtained from the two vegetation periods (
Figure 7a).
The E4/E6 ratios of HA-like substances (
Figure 7b) oscillated between 0.396 and 4.880 (2.801 ± 0.692). Significantly higher values (
p < 0.05) were recorded for HA-like materials isolated from the PL soils (2.957 ± 0.813, range: 0.396–4.880), while lower values were recorded for HA-like substances obtained from the NT soils (2.646 ± 0.506, range: 1.727–4.000). The analysis of the full model data evidenced statistically significant differences between the E4/E6 ratios obtained from the NT at 92.0 (FR_2) and 69.0 kg N ha
−1 (FR_3) (3.699,
p < 0.001) (
Figure 7b).
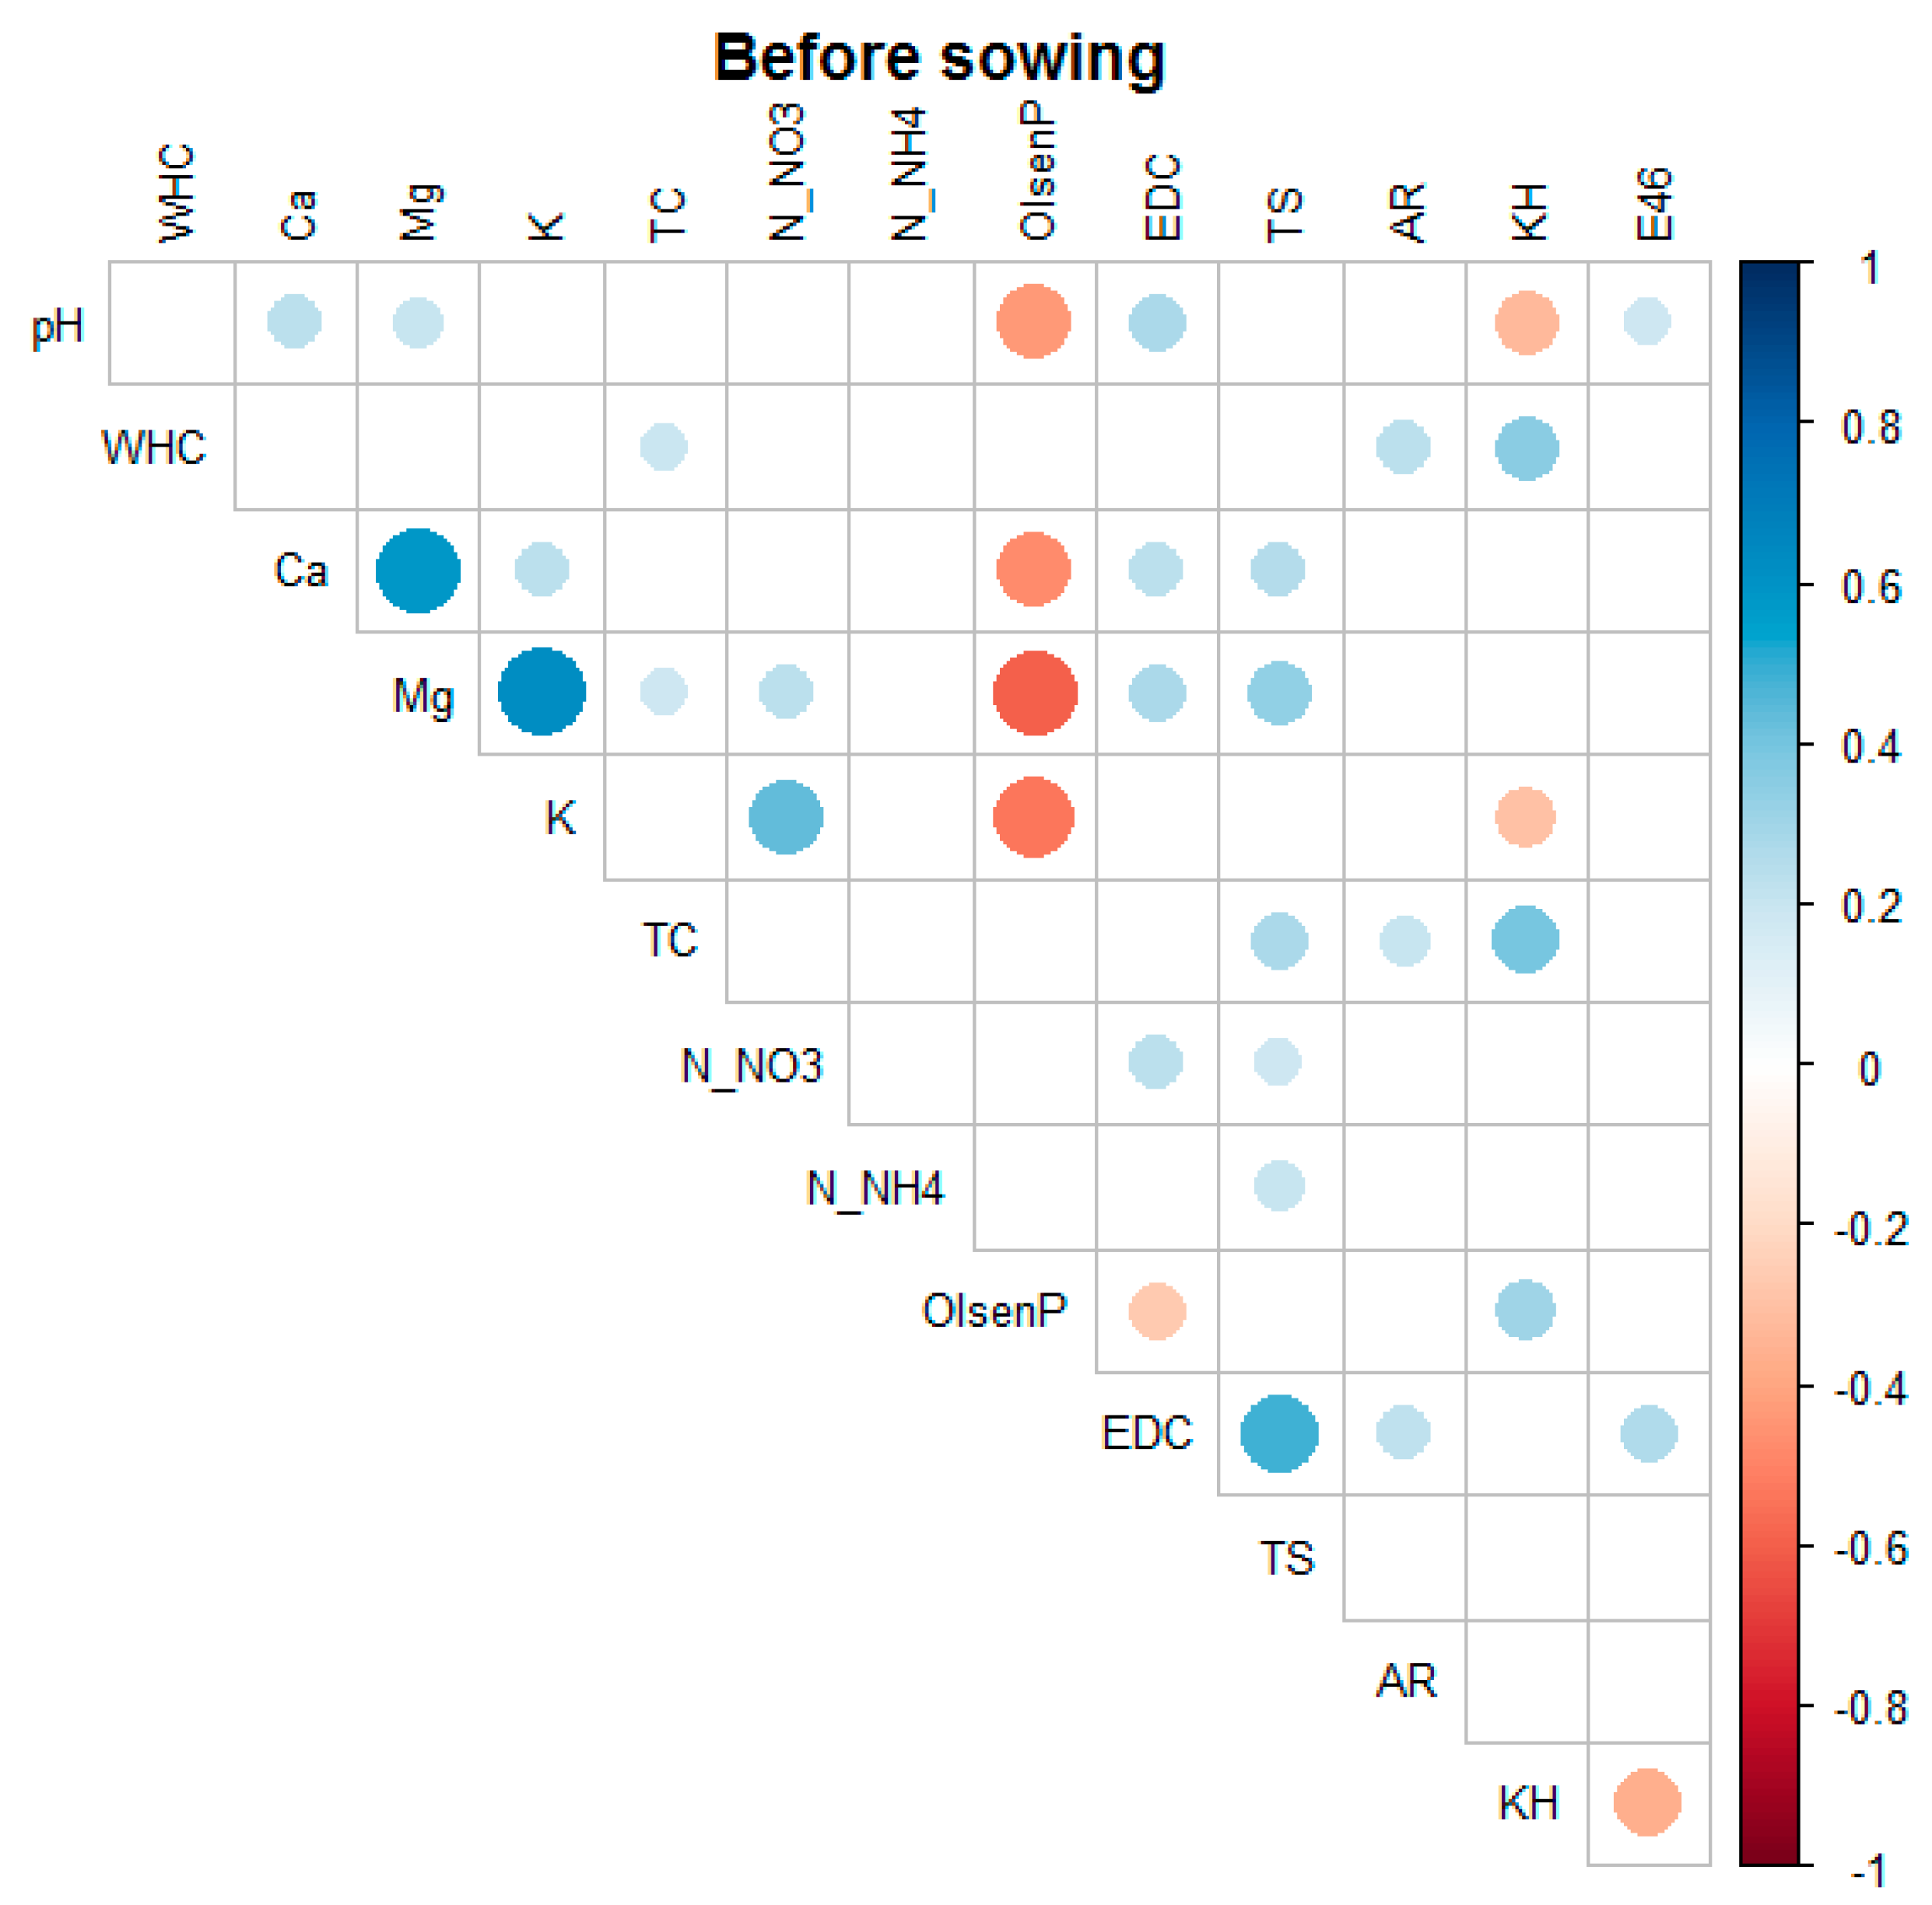
Before maize sowing (spring,
Figure A2), positive correlations were found among pH and the level of Ca, Mg, EDC, and absorbance coefficient E4/E6. In turn, negative relationships were shown between soil pH, Olsen P, and the HA-like level. At the beginning of the vegetation season, WHC correlated directly proportionally with HA-like levels, AR, and TC. The strongest positive correlations in the spring season were determined between the abundance of Mg versus Ca and K, whereas the strongest negative correlations were found between Olsen P versus Mg, K, and Ca. Equally noteworthy is the correlation between EDC and TS.
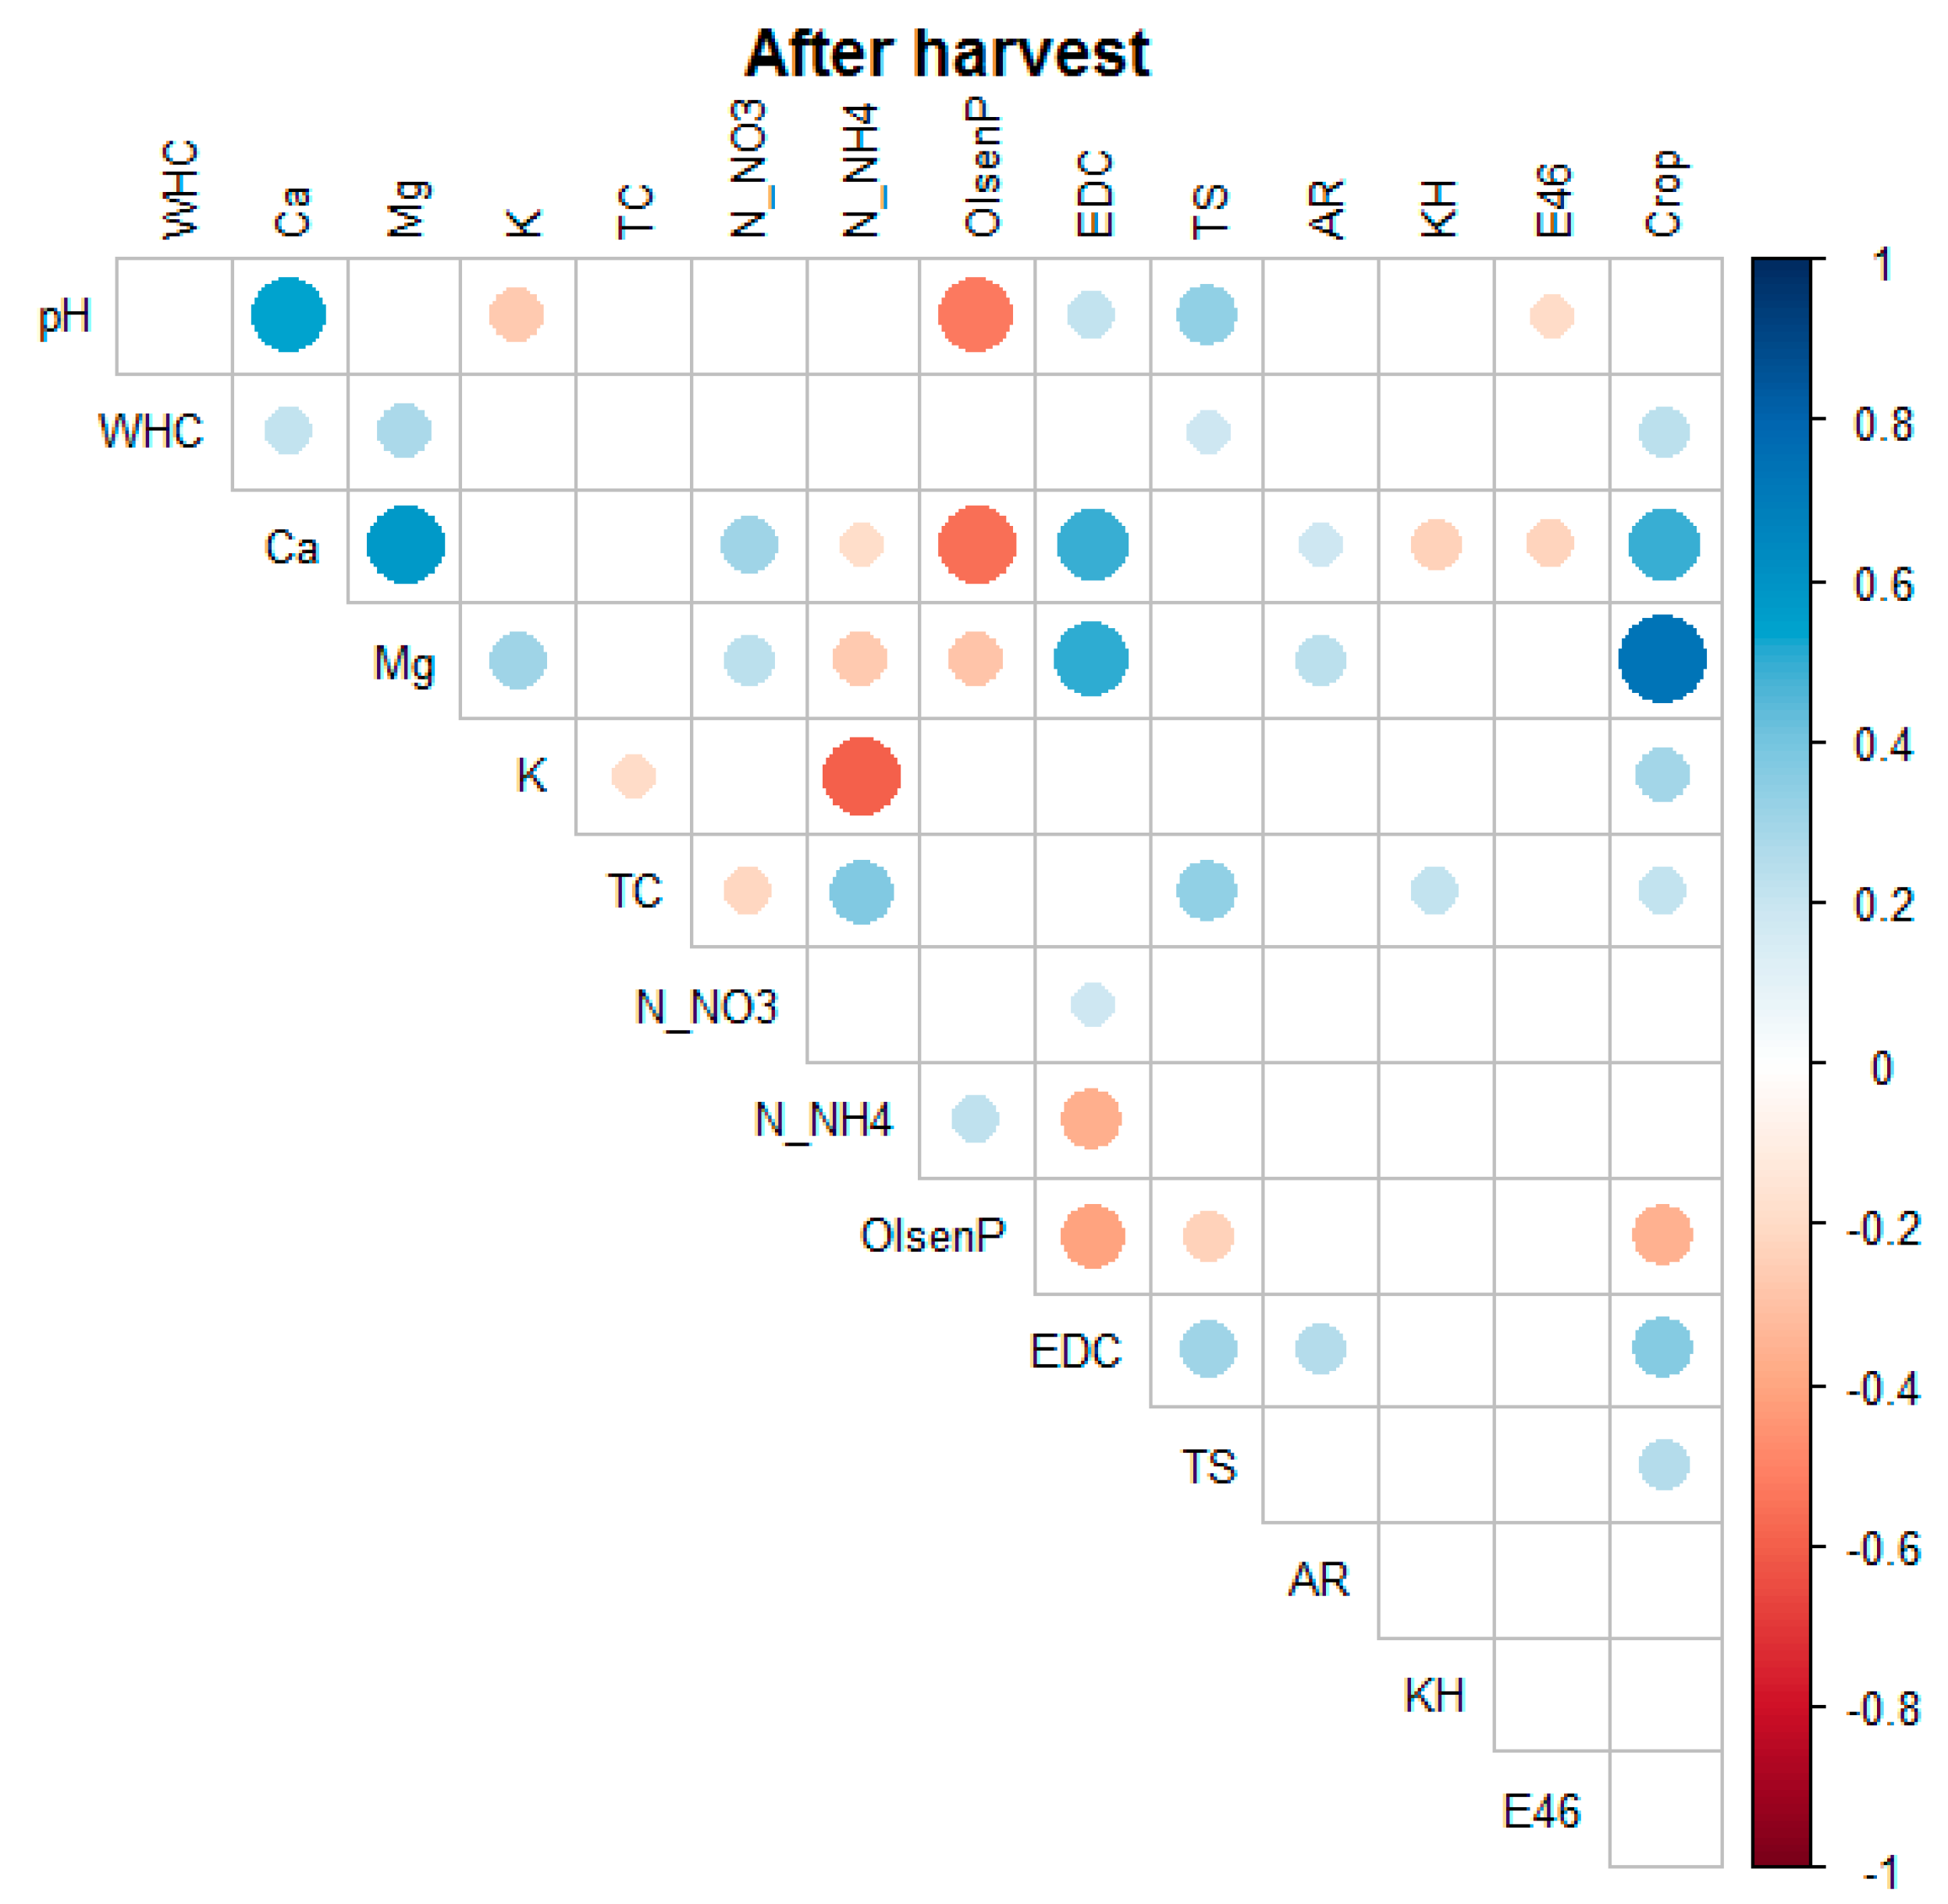
After maize harvesting, it was also possible to determine correlations with the maize crop obtained in 2022 (
Table 1). Knowledge of the yields was available owing to the principles of precision agriculture applied on the farm of the Potulicka Foundation, which made it possible to estimate that the average maize yields amounted to 4095.75 kg ha
−1 in the PL system and 2162.05 kg ha
−1 in the NT system (
Table 2a and
Table 2b, respectively), suggesting that the PL system is better for monoculture maize cultivation (
p < 0.001). The yield was affected by the drought phenomenon that occurred in the Kujawsko–Pomorskie Voivodeship in 2022. Interestingly, according to the data, both fields (PL, NT) were characterized by excellent yields without additional fertilization (
Table 2a,b). However, when the maximum fertilization rate suggested by the fertilizer supplier was assumed as 100% (FR_1), it was shown that the 20% reduction in N fertilization (FR_2) in the PL system resulted in an approximately 18% decrease in the yield, while the 40% reduction rate (FR_3) decreased the yield by approximately 6.7%. The situation was different in the case of the NT system, where the reduction in fertilization by 20% (FR_2) contributed to an approx. 20.4% increase in the maize yield versus the manufacturer’s recommended rate, while the 40% reduction in the fertilization dose (FR_3) resulted in a 21.3% increase in the yield (
Table 2b). However, all of these differences were insignificant (PL:
p = 0.728, NT:
p = 0.598). The correlation analysis evidenced that the maize crop was mainly affected by the content of Mg and Ca, followed by Olsen P and EDC. Other directly proportional statistically significant relationships were found for the effects of K, TS, WHC, and TC on the maize yield (
Figure A3). In addition to the correlations related to the yield, after the maize harvest, the most significant relationships were noted between pH and the Ca and Olsen P content. Furthermore, a significant correlation was determined between Ca and EDC and Olsen P levels. Mg was found to be significantly correlated with EDC, while K was significantly correlated with the ammonium nitrogen content (
Figure A3).
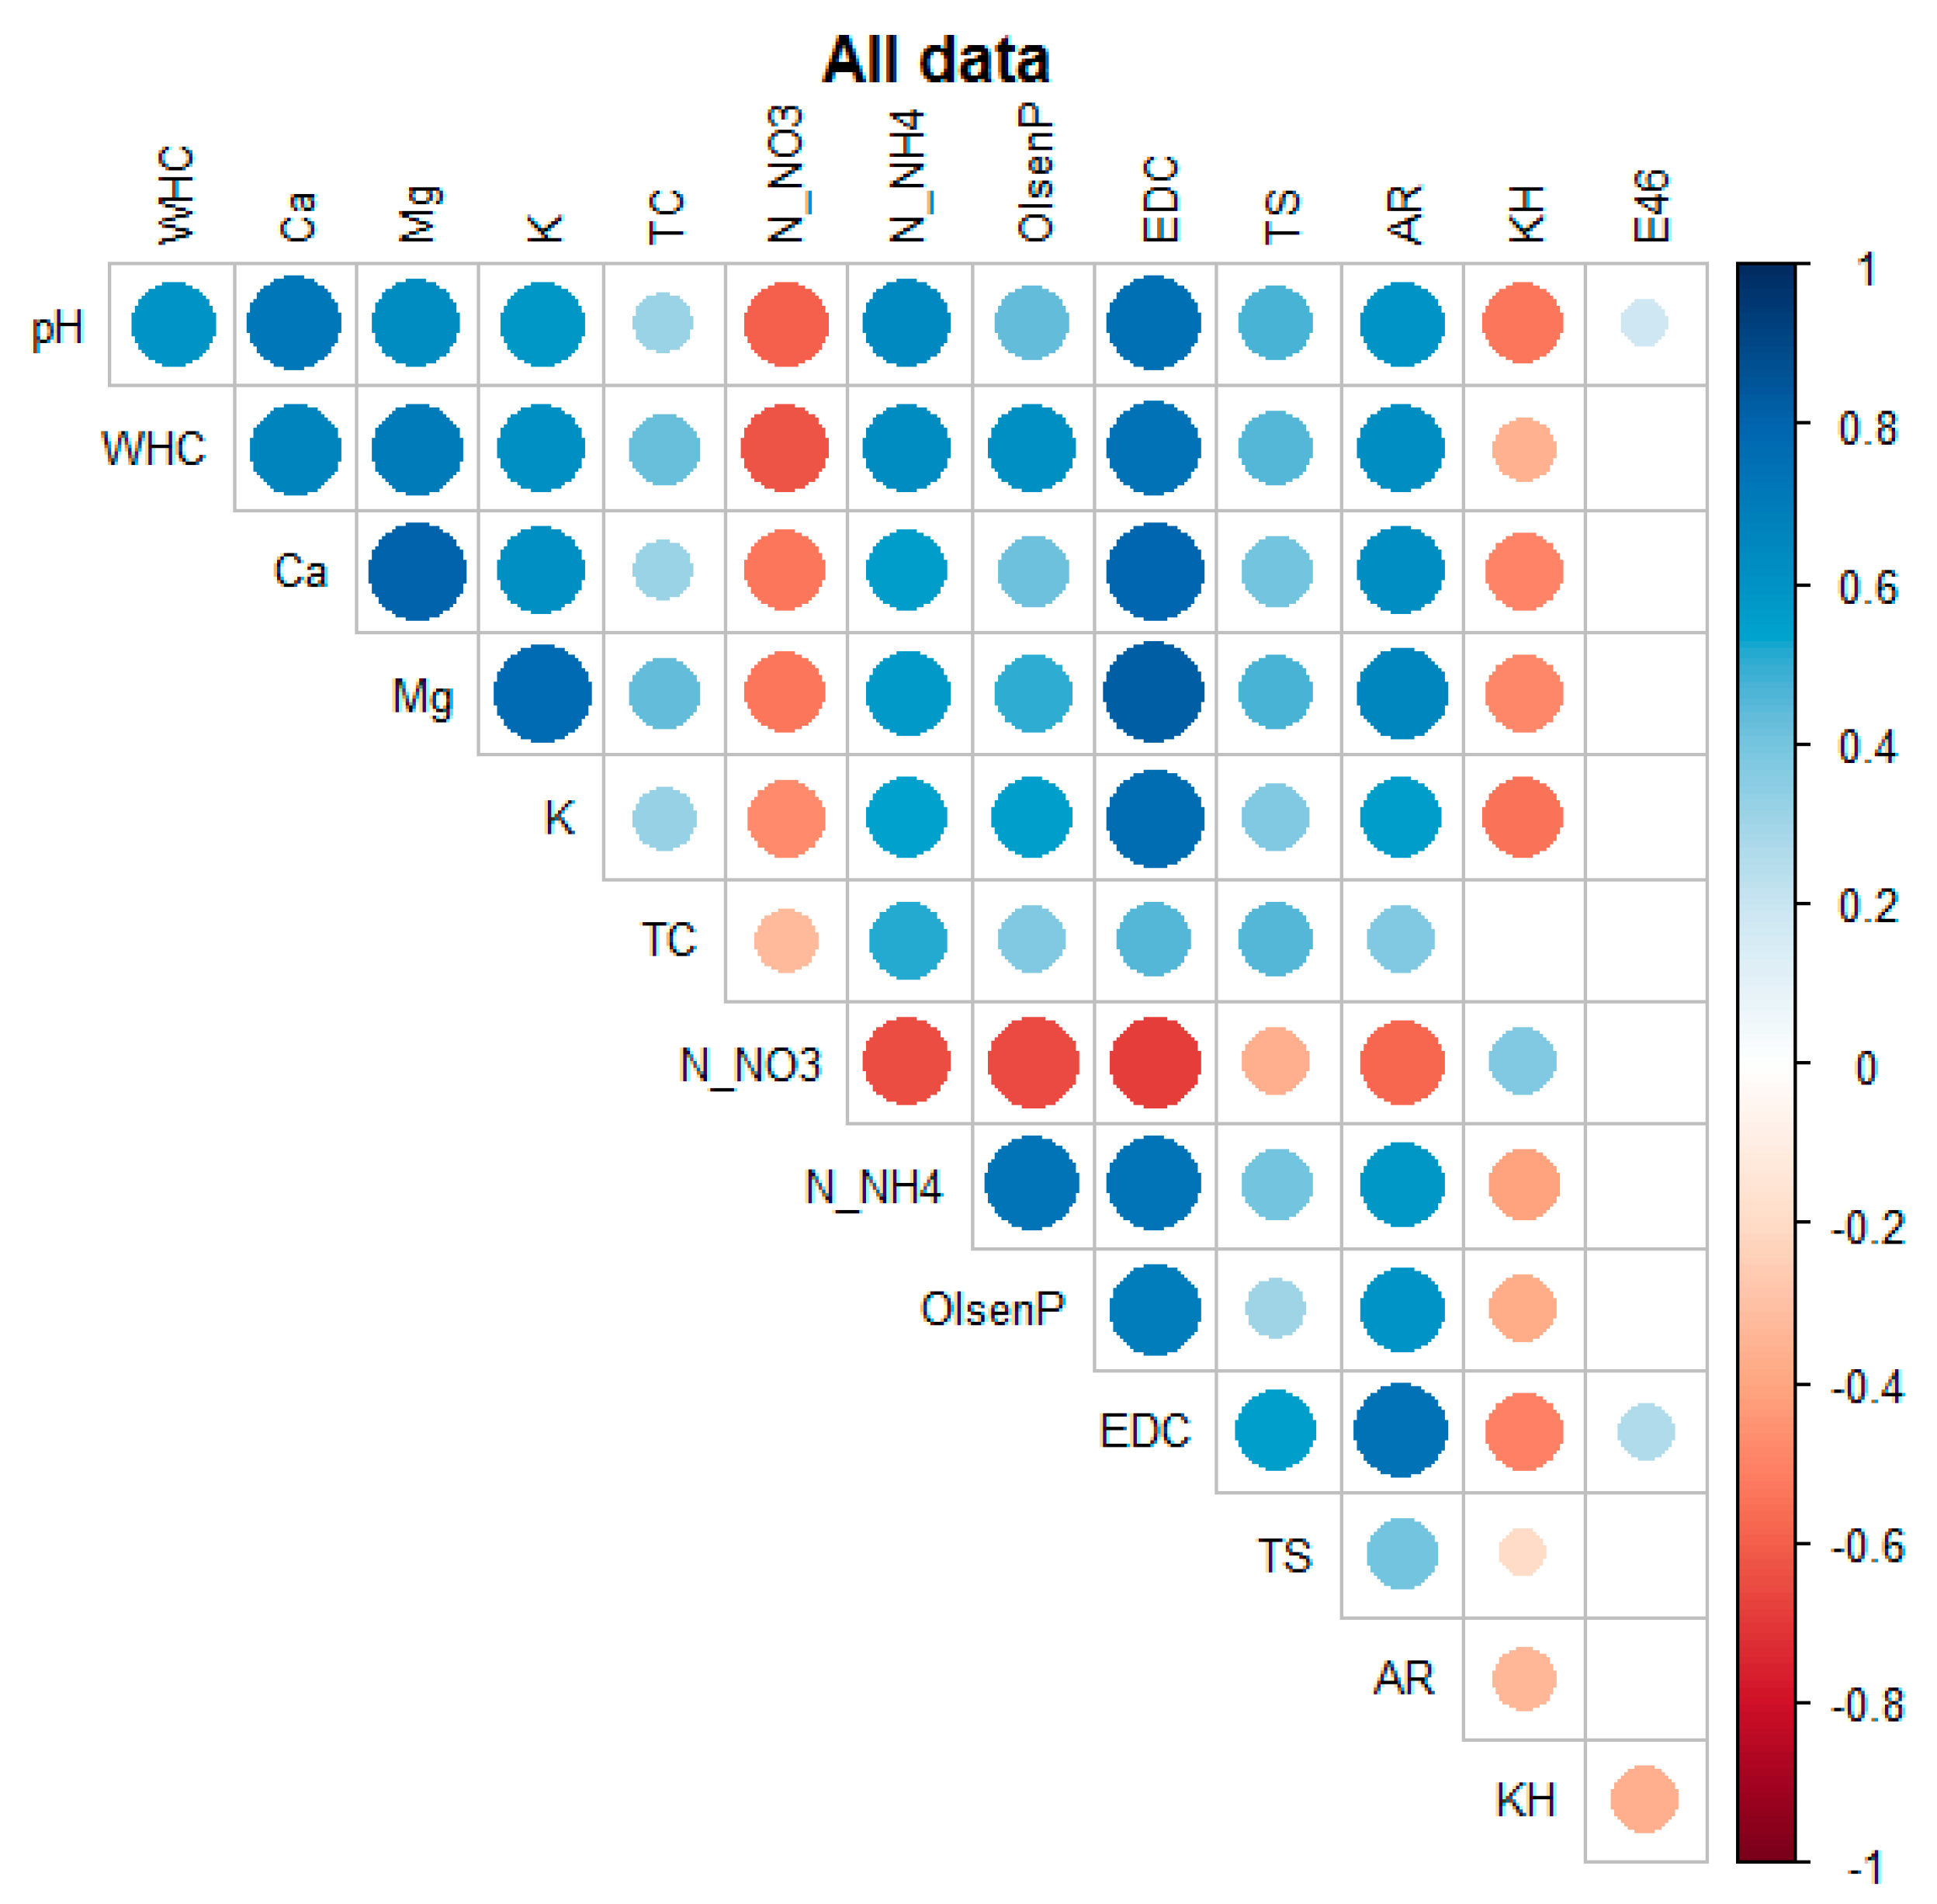
The compilation of the entire dataset showed numerous statistically significant correlations between the variables under study, as presented in
Figure 8. All these soil properties strongly depended on one external factor—the season of the year (
Figure A1 and
Figure A2). Nevertheless, all studied factors are important for maintaining good soil quality, and therefore should be constantly monitored.
In general, soil pH was highly correlated with EDC, Ca, NH4-N, Mg, NO3-N, AR, WHC, and K, and negatively correlated with the content of HA-like substances. The WHC of the studied soils was strongly positively associated with EDC, Mg, Ca, NH4-N, AR, K, Olsen P, TS, and TC, and negatively correlated with NO3-N. The NO3-N levels seemed to be significantly negatively correlated with EDC, Olsen P, NH4-N, and AR. The NH4-N content was most strongly associated with EDC, Olsen P, and AR, followed by TS, HA-like substances, and E4/E6. Olsen P was additionally correlated with EDC, AR, TS, HA-like content, and E4/E6. The EDC form of carbon was strongly dependent on AR, TS, and HA-like materials and weakly correlated with E4/E6. The total sulfur content was positively correlated with AR and negatively correlated with the content of humic-like substances. Finally, AR was negatively correlated with HA-like materials.
4. Discussion
In this study, we intended to verify whether a reduction in N fertilization by at least 20 and 40% (in combination with the tillage system) affects the yield of maize and the chemical-physical and biological parameters of soils that guarantee their fertility. The undoubted advantage of this study are the results achieved in a multi-area field experiment conducted by the Potulicka Foundation (each field is an area of 10 hectares) rather than from small experimental plots, which incomparably improves the quality and precision of conclusions, since we worked on representative soil material, taking into account many environmental variables.
Optimal N management is critical for efficient crop production and agricultural pollution control [
27,
34]. However, fertilizers are often overused on smallholder farms, which not only results in lower crop yields but also causes damage to the environment and human health [
34,
35,
36]. Research data emphasize that tillage is an important management practice, with conventional tillage (CT) helping to manage weeds, prepare the soil for sowing, and mix soil nutrients and crop residues [
9,
37]. However, CT can also decrease soil water retention, accelerate soil erosion (given that there is minimal crop residue retained on the soil surface), increase the oxidation of organic matter, and deplete N and other nutrients in soils [
9]. In contrast, NT management can create a cooler microclimate in the topsoil with higher water content, i.e., more favorable for microbial growth compared to CT [
9,
38]. It was found that TOC significantly increased only when the N fertilizer was applied under NT [
9]. Similarly, we also noted that, in the case of maize monoculture, NT favors the presence of a higher TC pool. Su et al. [
37], who compared crop yield data from the NT and CT systems, noted that the adoption of NT practice overall led to a yield decrease. This is consistent with findings reported by other researchers [
38,
39,
40]. However, after one year of the experiment, we found that the differences in the maize cultivation systems resulted in higher yields in the PL vs. NT system (
Table 2a,b). In NT, there was no plowing, which in the PL system allowed the soil to warm up faster to the depth of sowing and ensured a better aeration of the soil, better preparation and, as a result, more precise sowing, which was reflected by better emergence, greater initial plant vigor, and ultimately higher yields. Nonetheless, we expect that the advantages of NT described in the studies mentioned above will allow us in the long term to recommend just this system to achieve better results in maize cultivation. Yan et al. [
41] have carried out a random analysis of maize yields and showed that the maize varieties and soil properties were the most important factors in their study. However, the fertilizer application rates, cultivation regions, planting systems, and soil types had weaker effects, similar to what we found in our study.
Our experiment evidenced that the combination of the three factors (time of soil sampling—seasonality, cultivation system, and N dose) had an impact on soil chemical-physical and biological features, with an emphasis on the highest impact of seasonality. Indeed, the majority of the studied parameters (WHC, Ca, Mg, K, EDC, NH
4-N, Olsen P, TS, and AR) reached higher levels after maize harvesting (autumn) than at the beginning of the vegetation season (spring), with the exception of the content of NO
3-N and HA-like substances that had higher values in the spring before the maize harvest. The statistical analysis of the determined soil parameters revealed correlation with soil pH as one of the important soil parameters that determines nutrient uptake by plants. We documented that soil acidity was highly positively correlated with EDC, Ca, NH
4-N, Mg, NO
3-N, and K, and negatively correlated with the content of HA-like substances. Similar trends were evidenced previously by other researchers [
9,
21,
25,
26].
Our results may be also supported by the findings reported by [
42,
43], who noted analogical differences in pH, TOC, N forms, P, K, Mg, Ca, and AR when comparing spring and autumn soil sampling. We also emphasized that, in the case of the PL cultivation system, the highest dose of N fertilization (115.0 kg ha
−1, FR_1) resulted in a lower pH value; therefore, when farming maize with PL, it is worth reducing the fertilization rate to prevent soil acidification. This is because of the N-fertilizer type used (urea). Furthermore, it has been shown that soil acidity drastically reduces maize crop yields, and that minimum tillage has a positive effect on soil acidity [
9,
44]. Interestingly, in the NT system, the pH value at the highest fertilization rate was similar to that in the 20% fertilization reduction variant, which suggests that the cultivation system has a crucial role in soil acidity. It is worth mentioning here that soil acidity is accelerated by crop production practices, mainly by the application of nitrogenous fertilizers to enhance crop productivity [
23,
44]. Qiao et al. [
45] reported that N additions in tea plantations acidified soils (a significant decrease by 0.41 pH unit on average) and produced soil nutrient imbalance [
45]. Kou et al. [
46] concluded that N fertilizer reduction directly decreased the amount of NO
3-N in the soil and then alleviated the soil acidification caused by the excessive use of N fertilizers. In contrast, no significant difference in TN was observed upon a 25% reduction in chemical N fertilizers in the study conducted by Liu et al. [
47]. It was also assumed that soil pH declined significantly when the fertilizer level exceeded 200 kg N ha
−1 [
26].
The analysis of the effect of a 20% reduction in N fertilization (in accordance with the EC recommendation) showed that this amount is better for maintaining Ca levels (likewise in the case of the 40% reduction) as well as the Olsen P pool and AR levels. In recent years, studies have been conducted to determine the effects of N enrichment on AR in soil ecosystems [
48,
49]. However, the effect of N addition on AR remains still controversial and unclear. AR was sometimes found to increase during the first year of N fertilization but decrease in subsequent years [
48,
50]; hence, we decided to continue our experiment for the next vegetation season. Moreover, with respect to the TC content in the field under the NT system, it was observed that the 20% N fertilization reduction (FR_2) resulted in a lower carbon pool after the maize harvest. Research conducted by Su et al. [
21] indicated that the N dose could be reduced by at least 25% without compromising grain production. Furthermore, it was concluded that reducing N application rates has strong recoverability in maize production and can maximize the capture and utilization of resources, increasing the maize grain yield [
21]. Importantly, field experiments are being continued in the next maize vegetation season (in the same fields), which will allow the verification of the present results and observed trends.
Our results evidenced that the reduction in the N fertilization did not affect the level of most of the monitored parameters, e.g., WHC (no threat to the water-holding properties of soils), did not deteriorate the quality of soils in terms of Mg abundance, and did not deplete the K pool. Furthermore, the fertilizer reduction did not have a statistically significant effect on the carbon fraction of EDCs or the nitrate abundance in the soils. It should be noted that positive correlations of the EDC content with the same soil components (Ca and Mg pool) have been demonstrated (
Table 1). A very important ingredient is carbon, especially that which is biologically available to plants and microorganisms. It is also worth mentioning that carbon gives structure and life to the soil and is essential for nutrient retention. Our data are compatible with the study conducted by Zhang et al. [
9], who indicated that tillage did not have a significant effect on carbon pooling in the soil environment. The variable rates of reduced fertilization were not significantly related to the TS levels. There was also no effect of the N dose on the humic substance levels in the PL field, although a decrease in the HA-like substances was observed in the NT system after the 20 and 40% fertilization reductions, while the highest humic substance levels were recorded at the standard fertilization rate.
After analyzing the values of the E4/E6 coefficient in the two tillage systems, PL and NT, and at the two terms of the vegetation season, before sowing and after harvesting the crop, it can be concluded that the HA-like substances in the soils cultivated in the NT system were characterized by a higher E4/E6 coefficient after harvesting the maize. It is worth emphasizing that E4/E6 values higher than 6 suggest the predominance of fulvic acid-type compounds, while values lower than 6 point to the predominance of humic acids in the humic substance solution studied [
30]. HA-like substances with higher values of this ratio characterize fertile and biologically active soils. Many authors have suggested that the value of the E4/E6 ratio, calculated for HA-like solutions, is a criterion that characterizes soil type and humus quality [
30,
31,
32]. As demonstrated by Watanabe et al. [
51], an increase in the degree of humification with a decreasing amount of HA-like substances due to changes in land use suggests the selective decomposition of humic acid molecules or parts with a low degree of humification. The higher values of the E4/E6 ratio of the HA-like substances analyzed in the soils after the maize harvest may indicate the presence of non-humidified material due to the presence of proteins and carbohydrates. Similar conclusions were made by Morán-Vieyra et al. [
52], who reported a higher value of the E4/E6 ratio in soil material from agricultural soils. We evidenced that the E4/E6 parameter in all studied soils had values below 6, indicating an advanced stage of humification of organic matter, with a predominance of highly polymerized humic acid-like compounds. As suggested by Licznar et al. [
53], the low values of this parameter indicate the occurrence of degradation processes that are not conducive to the humification of organic matter and its transformation into high-molecular HA-like substances. Given the assumption made by Licznar et al. [
53] and the values of the E4/E6 coefficient below 3 determined in the studied soils with regard to HA-like substances, it can be assumed that there are degradation processes in both fields (PL, NT), which do not support the humification of organic matter and its transformation into high molecular humus compounds. Hence, samples with a reduced E4/E6 ratio may require supplementation with humus-enhancing preparations. Importantly, an increase in the E4/E6 ratio was observed in the NT system, which may indicate the first signs of humus level restoration. It should be mentioned that our results showed a most strong correlation between the E4/E6 ratio with the NH
4-N content and Olsen P and that may also partly explain the higher values of the E4/E6 ratio of the HA-like substances analyzed in the soils after the maize harvest. This condition may indicate the presence of very low humidified material due to the presence of proteins and carbohydrates in which nitrogen and phosphorus are the main molecules that build them.
The effectiveness of precision farming techniques used on the farm is also reflected in the condition of soils treated as controls (without the fertilizer), which are rich in nutrient elements. Consequently, as shown by our results, it seems reasonable to reduce N fertilization, especially since research data proved that higher rates of N fertilization cause soil secondary salinization and acidification, and thus inhibit soil enzyme activities, the functional diversity of microbial communities, and nitrification capacity [
54].


 ,
, 


