Abstract
Terrestrial ecosystems depend heavily on their vegetation; it is possible to forecast future growth trends of regional vegetation by keeping an eye on changes in vegetation dynamics. To circumvent the potential reduction in prediction accuracy caused by the non-stationarity of meteorological changes, we analyzed the characteristics of NDVI (Normalized Difference Vegetation Index) spatial and temporal changes and the influencing factors over the past 20 years in the Maowusu Sandland of China via attribution analysis. We also constructed a comprehensive analysis system for vegetation pre-restoration. Moreover, we combined meteorological data from 2000 to 2018 and presented a deep-learning NDVI-Informer prediction model with a self-attentive mechanism. We also used distillation operation and fusion convolutional neural network for NDVI prediction. Incorporating a probsparse self-attention method successfully overcomes Transformer weaknesses by lowering the memory use and complexity of large time series. It significantly accelerates the inference speed of long time series prediction and works well with non-smooth data. The primary findings were: (1) the Maowusu Sandland’s 20-year average showed a consistent increasing trend in the NDVI at 0.0034 a−1, which was mostly caused by climate change, with a relative contribution rate of 55.47%; (2) The Informer-based model accurately forecasted the NDVI in the research region based on meteorological elements and conducted a thorough analysis of the MAPE (mean absolute percentage error) (2.24%). This suggests that it can effectively lower the data’s volatility and increase prediction accuracy. The anticipated outcomes indicate that the trend will stabilize during the following ten years. To attain more sustainable and efficient agricultural production, the results of this study may be used to accurately estimate future crop yields and NDVI using previous data.
1. Introduction
One of the key elements of terrestrial ecosystems is vegetation, which influences the earth’s ecological balance, water cycle, and temperature [1,2] and contributes significantly to information transit, energy movement, and material cycle, among other things [3]. Jiazheng Zhang performed visualization calculation analysis and processing using the Google Earth Engine (GEE), which can monitor the dynamic changes of large-scale and long-time sequence vegetation and subsequently serve as a useful resource for local environmental management [4]. One of China’s four main sandy zones, Maowusu Sandland, is surrounded by agricultural and livestock industries with a low forest cover and vulnerable ecosystems [5]. Maowusu Sandland had more than 90% desertified and sandy land in the 1950s, with sandy area making up 40% of the total area and only 2.6% of the area covered by forests [6,7,8]. The vegetation in the Maowusu Sandland has deteriorated considerably due to man-made and natural forces [9]. For the study of NDVI extraction in the Maowusu Sandland, it is crucial to understand the spatial and temporal dynamics of vegetation in the region as well as trend prediction. Vegetation degradation is accompanied by a drop in the NDVI [10]. This study examines the spatiotemporal aspects of NDVI changes over the past 20 years in the study region and investigates trend changes using remote sensing technologies.
The prediction of NDVI based on Moderate Resolution Imaging Spectroradiometer (MODIS) and Landsat data has gained considerable attention in recent years. It is now used to interpolate the Landsat NDVI data throughout an entire year to complete the evaluation of the vegetation state [11]. There are, however, fewer studies on the primary factors influencing vegetation change in dry and semi-arid regions and precise long-term projections, with earlier research mainly concentrating on how vegetation responds to the environment and human activity [12]. Precipitation and air temperature are currently the primary parameters used by many researchers, which are relatively varied concerning vegetation in space due to the effect of climate change on vegetation change [13]. The two areas where human activity has the greatest impact on vegetation change are: (1) implementing ecological initiatives, such as converting farms to forests and shutting down mountains to grow grass [14]; (2) human production and living activities, together with the urbanization process, have the potential to upset the ecosystem’s delicate balance, preventing plants from growing normally [15]. We can gain a deeper understanding by thoroughly analyzing the effects of climate change and human activities on vegetation change. Currently, global change research focuses on the quantitative analysis of the impact of vegetation change drivers and the prediction of future trends [16]. Additionally, the multivariate linear residual analysis [17], which carefully examines the relative influence of human actions [18], dominates the quantitative analysis. The major models used for trend prediction include the stochastic Forest, Support Vector Machine (SVM), and Support Vector Regression (SVR) models [19], as well as machine learning techniques for forecasting future trends. For instance, Guo et al. [20] used the residual method, which is the most popular model for separating climate change and human activities, and is appropriate for long time series analyses, to quantitatively analyze the effects of climate change and human activities on changes in vegetation cover. The Support Vector Regression (SVR) approach was successfully used by Yang Wei et al. [21] and others to increase the NDVI inversion accuracy, however, the model suffers from a sluggish convergence speed and a very complicated optimization procedure [22]. To simulate and quantify the effects of climate change and human activity on vegetation cover, Shengzhi Huang et al. [23] introduced a Support Vector Machine (SVM) model. However, the limitations of machine learning, including its difficulty in feature learning, difficulty in determining hyper-parameters, and slow computation speed, decrease prediction accuracy.
Deep learning offers superior learning and fitting capabilities compared to statistical and machine learning approaches, and it can fully exploit large-scale time series data for improved short-term NDVI forecasting [24]. Convolutional neural networks (CNNs), recurrent neural networks (RNNs), deep belief networks (DBNs), and deep neural networks (DNNs) are examples of deep learning techniques [25]. Peiqiang Gao et al. [26] use CNNs to create an NDVI prediction model to thoroughly examine how the NDVI responds to environmental conditions, which significantly increases the accuracy of NDVI prediction. However, when dealing with very volatile and non-stationary data, CNN prediction accuracy suffers. The cyclic structure introduced by RNN is better able to handle time series data and extract NDVI data for fitting, however, it also has issues with fading gradients and the inability to record long-term dependencies [27]. As a specific type of RNN, the long short-term memory (LSTM) network outperforms current neural networks (RNNs) in short-term NDVI prediction tasks. However, LSTM also has issues with many parameters and sluggish model convergence [28]. The prediction accuracy of the aforementioned deep learning models is significantly better than that of conventional statistical models and machine learning techniques; however, it is not optimal when dealing with nonlinear time series data. In the field of time series prediction, the Transformer model [29] has recently been proposed and applied. However, despite producing predictions with better accuracy, the Transformer model has a high memory occupancy rate and time complexity.
This study focuses on fixing the issues with the earlier Transformer model, while the Informer model [30] is suggested to address the Transformer’s weaknesses. This study aims to address three issues of the earlier Transformer: (1) The self-attention mechanism’s complexity and memory requirements; (2) The memory bottleneck with lengthy input stacked layers; and (3) The performance deterioration of forecasting long output time series. In addition to exhibiting excellent potential in long-time series input and output dependencies, the improved Informer model introduces the probabilistic sparse self-attention mechanism, which can efficiently reduce the spatial complexity of the long sequence time-series forecasting (LSTF) problem.
Determining the long-term spatial and temporal NDVI changes in the Maowusu Sandland and the pattern of such changes is crucial for ensuring ecological quality [31]. There are currently few persistent analyses for trend prediction, and the geographical and temporal variations of NDVI in the Maowusu Sandland are in the monitoring stage. The Maowusu Sandland’s NDVI trend in the future is crucial for addressing drought.
This study is based on the Google Earth Engine (GEE) cloud platform. It integrates multiple change analysis and attribution algorithms over 20 years to construct a set of comprehensive analysis systems for vegetation pre-restoration. These systems are used to predict future changes in vegetation trends, to thoroughly reveal through in-depth analysis the relationships and roles of vegetation, climate, and human activities, and to provide trustworthy scientific data (Figure 1) [32,33,34]. Therefore, the study’s specific goals are to (1) thoroughly explore the relationship between the dynamic changes in vegetation and the spatial and temporal changes in the climate under artificial restoration and natural restoration, taking into account the context of 20 years of climate warming and aridification of severe ecological restoration projects as an entry point; (2) conduct a regional ecological assessment, evaluate the spatial and temporal changes, and forecast future NDVI trends to examine the distinct effects of artificial restoration and natural restoration on vegetation changes in the Maowusu Sandland area as an example; (3) compile and train 19 years’ worth of NDVI data in the research region, as well as meteorological parameters, and propose a technique based on Informer’s accurate long-term NDVI prediction, which will serve as a scientific foundation for ecological environmental conservation and sustainable development.
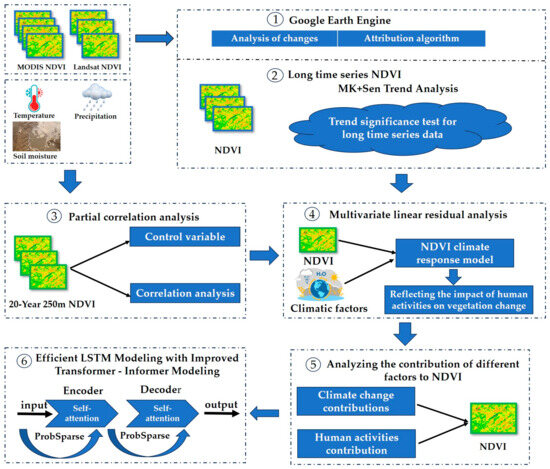
Figure 1.
Methodology flowchart.
2. Materials and Methods
2.1. Study Area
Maowusu Sandland, with an average elevation of 1347 m above sea level, is situated in the semi-arid desert region of northwest China, between the Yulin area of Shaanxi Province and Ordos City of Inner Mongolia Autonomous Region (Figure 2). It has an administrative area that includes the Wushen Banner of Ordos City, Ejin Horo Banner, Ertok Banner, and Ertokqian Banner. The region’s geography is high in the north and south and low in the east and west. It has a land area of roughly 2.98 × 10⁴ km2 [35]. With an average annual temperature of 6.0–8.5 °C, average annual precipitation of 220–400 mm, average annual evaporation of 2100–2600 mm, and average annual wind speed of 4.5 m/s, the Maowusu Sandland is classified as having a moderate continental monsoon climate. The region’s climatic features include a dry environment, significant evaporation, uneven distribution of precipitation, powerful insolation, windy weather, and sandy terrain [36].
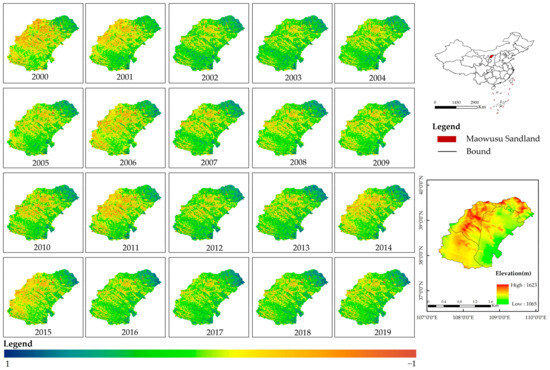
Figure 2.
NDVI long time series data and elevation of the Maowusu Sandland.
2.2. Data and Processing
The method effectively removed the temporal and spatial constraints in the geomorphological study. The Google Earth Engine (GEE) cloud platform was used to generate long time series and multi-year mean analyses based on the Landsat series, which was used to construct the NDVI dataset of 250 m spatial resolution long time series for remotely sensed data in the study area.
The GEE platform (https://earthengine.google.com/) (accessed on 30 June 2023)was used to obtain NDVI data from the Moderate Resolution Imaging Spectroradiometer (MODIS) data. The Maowusu Sandland was subjected to a quantitative investigation of plant cover changes utilizing the monthly temporal and geographical resolution of 250 m MOD13Q1 NDVI. NDVI data were created using the average synthesis approach with data from January through December. Additionally, Landsat remote image NDVI obtained each year of the research period underwent pixel-by-pixel yearly 95th quantile synthesis, which can partially mitigate the uncertainty caused by the year’s limited number of picture acquisitions.
Using ASTERGDEM 30M resolution digital elevation data, digital elevation model (DEM) data were chosen from the geospatial data cloud (https://www.gscloud.cn/) (accessed on 5 July 2023). ArcGIS was used to analyze the digital elevation model (DEM) data to acquire elevation information.
The two primary sources of meteorological data were the National Tibetan Plateau Science Data Center and the fifth-generation European Centre for Medium-Range Weather Forecasts (ECMWF) atmospheric reanalysis (ERA5) dataset from the GEE cloud platform. The mean_2m_air_temperature band temperature data at 2 m above ground level per hour and total_precipitation band calculations were the foundation of the European Centre for Medium-Range Weather Forecasts Fifth Generation Atmospheric Reanalysis (ERA5) dataset (resolution 27,830 m), which gathers daily mean temperature and daily precipitation data from 2000 to 2019. Meanwhile, researchers from Peng Shouzhang obtained data from the National Tibetan Plateau Science Data Center, including differences in mean annual temperature and rainfall through time and space. These data were created using the worldwide high-resolution climate dataset from World Clim and the global 0.5° climate dataset from Climatic Research Unit Time Series (CRU), which were both downscaled in the Chinese region using the Delta spatial downscaling tool. Data from 496 different meteorological observation stations were utilized for validation to confirm the accuracy of the data, and the validated findings demonstrated its reliability.
Three periods of land-use data were gathered for 2000, 2010, and 2020. The land-use data were acquired from the Globeland30 dataset (30 m resolution), a worldwide surface cover dataset created in China. Bare land, grassland, farmland, shrubland, wetland, water bodies, woodland, and man-made land surfaces were among the several types of land.
The surface soil moisture covariate from the ERA5 reanalysis data was used to interpolate the 0.25° resolution European Space Agency Climate Change Initiative (ESA-CCI) surface soil moisture product to obtain the spatiotemporally continuous day-by-day 0.25° resolution soil moisture. Machine learning algorithms were then used to downscale the daily 0.25°-resolution surface soil moisture to a daily 1-km resolution [37] using data from the International Soil Moisture Observation Network’s global soil moisture observatory, along with other high-resolution optical remote sensing data.
The accuracy of the aforementioned data was strictly controlled and was collected from reputable sources, including the National Aeronautics and Space Administration (NASA), the Computer Network Information Center of the Chinese Academy of Sciences, the European Centre for Medium-Range Weather Forecasts (ECMWF), and the Global Surface Coverage Remote Sensing Mapping and Key Technology Research Project of the National High-Technology Research and Development Program of China.
2.3. Research Methodology
2.3.1. MK + Sen Trend Analysis
The temperature–rainfall time series was examined for noteworthy patterns using nonparametric approaches. The Mann–Kendall (MK) and Sen slope estimators, which are computationally effective, were employed to determine the trend and slope, respectively, as temperature–rainfall data were not normally distributed [38].
The Sen trend is a more reliable non-parametric statistic for trend calculations. It is insensitive to measurement error and outlier data. In contrast, the MK test does not require the samples to follow a particular distribution and is less affected by outliers, making it suitable for significant tests of trends in long time series data [39]. The Sen trend and MK tests can be combined to analyze long vegetation time series [32]. The formula for calculating the significant trend is as follows:
where Xj and Xi are time series data; β is an indicator that represents the trend of a time series; β > 0 indicates an upward trend in the time series; β < 0 indicates a downward trend in the time series.
2.3.2. Partial Correlation Analysis
In addition to applying to multivariate data, partial correlation analysis permits hypothesis testing to ascertain whether there is a statistically significant relationship between two variables by controlling for the impact of one or more confounding variables on the relationship between two variables [40]. The t-test, which statistically analyzes each pixel at a significance threshold of 0.05, was used for the correlation study [41]. This study examined the association between three variables—temperature, precipitation, and soil moisture—and the change in NDVI from 2000 to 2019 using MATLAB2016-based partial correlation analysis.
2.3.3. Multivariate Linear Residual Analysis
To isolate the portion of the climatic effect that impacts vegetation development, residual analysis is a method for modeling regression between climate parameters and the NDVI (Normalized Vegetation Index) [42,43]. Regression modeling is used in this approach to determine the expected values of the NDVI, which in turn produces the residuals between the real and predicted values. These values are then used to assess the influence of human activity on vegetation growth [44]. This paper establishes a multiple regression model between the NDVI and climate factors before the implementation of the ecological project (2000–2010) (i.e., a metric scale to calculate the NDVI climate response model) [45] to better reflect the impact of human activities on vegetation changes.
The NDVI predictions—driven solely by climate change—were calculated image-by-element from 2000 to 2020 using the established regression equations. The NDVI observations were then subtracted from the NDVI predictions—driven solely by climate change—to obtain the NDVI residual time series from 2000 to 2020 [34]. The following formula was used to calculate the residual series:
where ε is the NDVI residual; NDVIabs is the observed NDVI value; NDVIpre is the predicted NDVI value.
2.3.4. Relative Contribution Rate
Relative contribution analysis is a technique for determining the precise percentage that each explanatory variable contributes to the variance of the explained variables. The challenge and concern regarding the relevant research domestically and internationally has been identifying and quantifying the determinants of vegetation change on a wide regional scale [46]. In this study, we adopted a technique to calculate the relative contribution rate of climate change and human activity to vegetation change using multivariate linear residual analysis [45]. We also identified the drivers of vegetation change on an image metric scale and quantified their relative contributions to vegetation change [46]. The associated formula is:
where K is the relative contribution rate; Slope(NDVIobs) is the trend value for the time series of actual NDVI values; Slope(NDVIpre) is the trend value for the time series of predicted NDVI values based on multivariate regression analysis; Slope(NDVIres) is the trend value for the NDVI residual time series based on residual analysis.
2.3.5. Accurate Long-Term NDVI Prediction Model Based on Informer
Although Transformer can predict long time sequences and demonstrates strong prediction ability, the model’s multilayered encoder–decoder structure means that the longer the sequence, the slower the speed, and the worse the effect of the model in predicting long time sequences [47]. Herein, we address this issue and the inherent issues with the encoder–decoder architecture by introducing an effective LSTM model based on an improved Transformer, the Informer model. This model uses probabilistic sparsity inside the encoder—a self-attention mechanism—trained and learned according to sequences with high probability in the data and filtering the Q-value with high weight [48]. As a result, the complexity may be significantly reduced. Figure 3 presents the structure of this model.
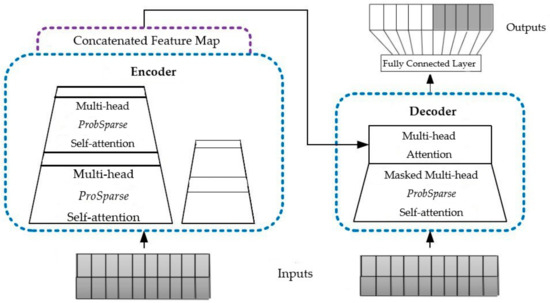
Figure 3.
Schematic diagram of the Informer model.
Based on the encoder–decoder structure of the Informer prediction model system, we developed precise long time series NDVI prediction in this article. For the temporal dimension of the inputs, a distillation operation prioritizes high-level features with dominant features, generates a centralized self-attentive feature mapping in the following layer, and adds a max-pooling layer of two after stacking one layer, which drastically reduces the memory in the downsampling [30].
3. Results
3.1. Spatiotemporal Characteristics of Land Use Types
As illustrated in Figure 4, the land use categories for the Maowusu Sandland from 2000 to 2020 were plow, woodland, grassland, shrubland, wetland, wave, bare land, and man-made surface, in sequence. In the research area, the categories of land use include, in decreasing order, grassland, bare land, farmland, shrubland, water body, wetland, man-made land surface, and forest. Grassland, bare land, and plow all exhibited an upward tendency between 2000 and 2020, with grassland showing the largest increase, wave exhibited the slightest increase, and wetland and forest remaining relatively unchanged.
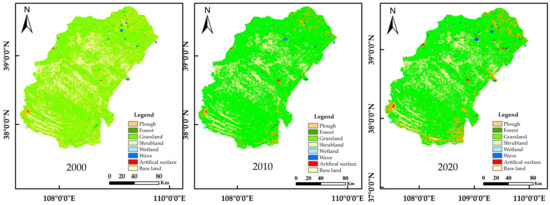
Figure 4.
Land use type maps for 2000, 2010, and 2020.
In general, the Maowusu Sandland exhibits a gradual decline in cultivated land and an increase in woodland and grassland from the northwest to the southeast (Figure 5). The man-made land surface is sporadically distributed throughout the entire region but is primarily concentrated in the eastern part of the Maowusu Sandland and develops with a fast growth trend. After a field investigation, it was discovered that the predominant vegetation in the sandy land was sandy cypress. The Northwest region exhibited an increasing trend in grassland from 2000 to 2020, and the man-made land surface and arable land also showed a slight growth trend, moving in the direction of a trend in restoring ecological well-being.
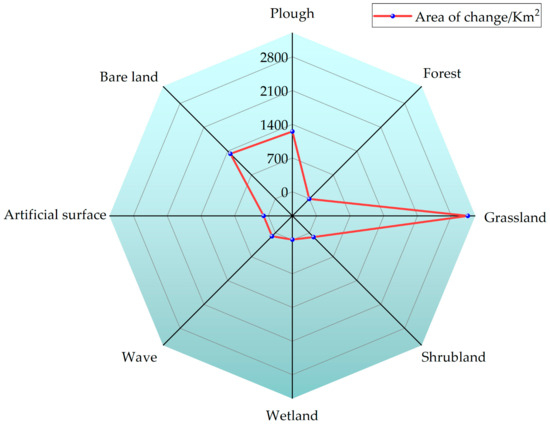
Figure 5.
Land use type change map for 2000, 2010, and 2020.
3.2. Analysis of Groundwater Impact on NDVI
The 2019 groundwater depth spatial distribution map for the Maowusu Sandland was produced using the Spatial Analyst spatial analysis module of the ArcGIS 10.8 software. This map was used to analyze the inverse distance weights of the 2019 groundwater level depth based on the 2019 groundwater level depth data in Maowusu Sandland.
The Ordos Hydrological Bureau, located in China’s Inner Mongolia Autonomous Region, supplied all information on burial depths and groundwater levels. Within the spectrum of places with data recordings, the 2019 groundwater level depth in the Maowusu Sandland exhibited more pronounced variances, as illustrated in Figure 6. In the research area, the depth of the groundwater varied widely, with shallow depths in the middle and northern areas and depths below 10 m in the northern and southern regions. According to the 2019 NDVI spatial distribution map of the Maowusu Sandland, this area had a wide range of variable groundwater depths. We discovered that vegetation was well-developed in areas with shallow groundwater table burial depths, which suggests that groundwater had a beneficial promoting effect on vegetation. However, most places had groundwater buried deeper than 7 m, and the relationship between groundwater and vegetation was weak.
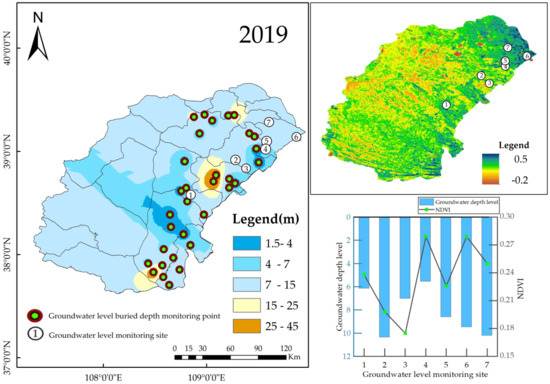
Figure 6.
Spatial distribution of groundwater level changes in 2019.
Our daily monitoring of the Maowusu Sandland groundwater level changes in 2019 revealed that only points 4 and 7 had more obvious variations in groundwater level (Figure 7). This was largely because these points are situated in an area of cultivated land, where the groundwater is primarily used for irrigation water for agricultural development and where the groundwater level is buried deeper.
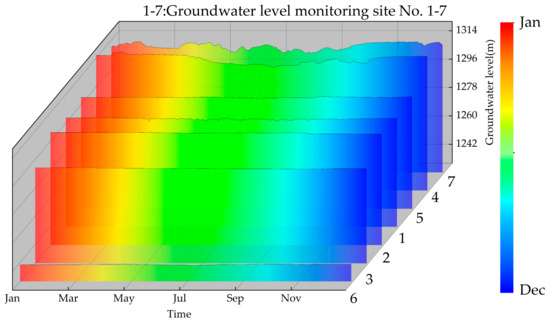
Figure 7.
Monitoring maps of daily changes in groundwater levels.
3.3. Analysis of Vegetation Change Trends
The Maowusu Sandland’s average Sen slope value from 2000 to 2019 was 0.18, and its slope was 0.0034 a−1, showing that the NDVI increased steadily while growing at a relatively modest rate (Figure 8). Most of the quicksand regions were located in the hinterland of the sandy land, which contributed to the study area’s low vegetation cover in 2000. Most of these areas had <30% vegetation cover. The Maowusu Sandland has undergone construction and ecological protection projects in recent years from national and local governments, which have improved the ecological environment and increased the plant cover, although the geographical disparity is still evident [49].
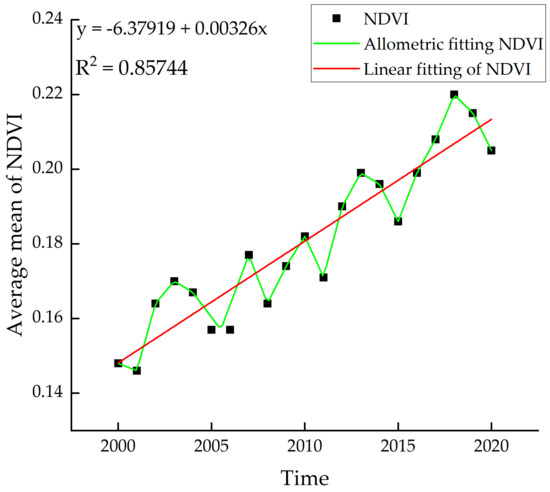
Figure 8.
NDVI trend chart from 2000 to 2019.
The Maowusu Sandland area’s vegetation cover exhibited a decreasing trend from northeast to southwest; however, because the ecological protection construction project’s vegetation growth requires time, the vegetation cover in the eastern region is increasing significantly (Figure 9). This indicates that the project’s ecological protection management is having an impact. Among these, the maximum NDVI in August 2020 is significantly greater than the highest NDVI in August 2000, which is closely related to China’s local governments’ participation in protection and restoration.
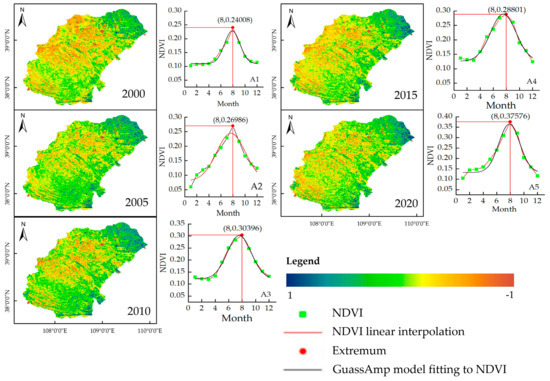
Figure 9.
Spatial distribution of average NDVI in the Maowusu Sandland in 2000, 2005, 2010, 2015, and 2020, and linear interpolation and fitting of NDVI values. Annotation A1 corresponds to 2000, A2 corresponds to 2005, A3 corresponds to 2010, A4 corresponds to 2015, and A5 corresponds to 2020.
The change in vegetation cover was divided into nine classes based on the Theil-Sen Median trend value analysis and the Mann–Kendall nonparametric test at a significance level of 0.05: dramatic increase, significant increase, slightly significant increase, insignificant increase, unchanged, insignificant reduction, slightly significant reduction, significant reduction, and very significant reduction.
The Maowusu Sandland region significantly expanded, accounting for more than 90% of the region, as shown by the NDVI trend change map (Figure 10). Between 2000 and 2020, there was a clear difference in the amount of land, with an increasing trend and an obvious decreasing trend. Of these, 95.28% of the area had significantly improved vegetation cover, while only a small portion had degraded vegetation. This difference is likely due to the implementation of national ecological conservation and construction projects. Throughout the 20 years, the NDVI had a notable increasing trend, and the number of regions with a large increase in plant cover grew significantly. However, these areas were primarily concentrated in areas with high populations.
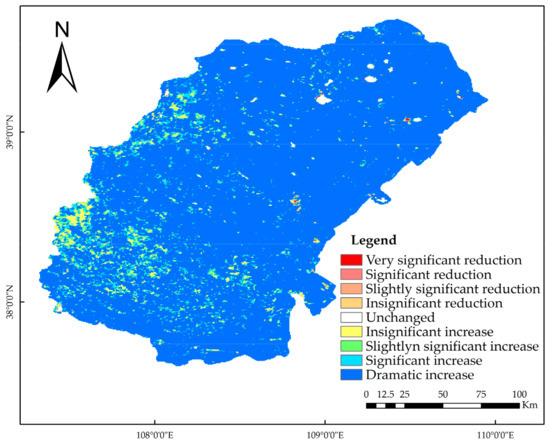
Figure 10.
NDVI change trend chart from 2000 to 2019.
The 20-year NDVI trends were compared, revealing that plant cover rose gradually from 2000 to 2020 with no discernible variation in growth rate. Given that the population is more concentrated in the eastern half of the Maowusu Sandland, the growth rate of vegetation cover is significantly larger than it is in the western region. This finding suggests that the ecological restoration project has a substantial impact on the increase in vegetation cover.
3.4. Characterization of Inter-Annual Variability of Climate Factors
In the study area, the temperature and precipitation change rates showed substantial declining trends between 2000 and 2010 (Figure 11). This suggests that the environment was drier, which was detrimental to the growth and recovery of vegetation. Meanwhile, the rates of temperature and precipitation changes showed substantial upward trends from 2013 to 2019 (Figure 11). During the 2011 to 2013 period, the temperature decreased, and the quantity of precipitation increased. The humid weather created ideal circumstances for the NDVI to thrive.
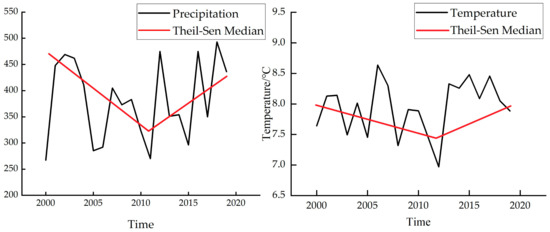
Figure 11.
Characterization of inter-annual variability in precipitation and temperature.
From 2003 to 2018, it was discovered that July through September saw the most rainfall, while June through July saw high temperatures. This helps to keep high temperatures from accelerating drought and causing severe soil moisture loss due to crop transpiration and soil evaporation. There is a greater chance of very heavy precipitation because of the atmosphere’s enhanced capacity to store water vapor before saturation, which is why spring and autumn rainfall has significantly risen. Increased precipitation, sufficient soil moisture, and appropriate temperature contributed to gains in plant cover and growth, creating the ideal environment for vegetation development and the NDVI (Figure 9).
3.5. Relationship between Climate Factors and NDVI
The elevation map indicates that the southeast region has more mountain ranges, high vegetation cover, low surface specific heat capacity, a tendency for stable temperatures, and vegetation that can produce water vapor for precipitation through transpiration and encourage infiltration to replenish the groundwater. This is favorable for the significance of the NDVI in the eastern region (Figure 9). Meanwhile, the western region has a flat terrain predominately made up of deserts, a dry climate, little vegetation cover, high evaporation, low air humidity, and a high water infiltration rate. As a result, transpiration and groundwater absorption by plants are significantly impacted, leading to a prolonged period of low vegetation cover. The Maowusu Sandland’s typical flowing dunes were monitored for soil water seepage at various soil layer depths. The results show that deep water seepage is more affected by heavy rainfall than by changes in soil water storage; moreover, when rainfall is low, the relationship between deep water seepage and soil water storage is stronger.
In most locations, air temperature impeded plant development, as shown by the partial correlation coefficients between vegetation and climatic parameters (Figure 12). The rainfall in most regions encouraged vegetation growth, and the soil moisture in all sites encouraged plant growth. Overall, soil moisture had the greatest impact on vegetation changes, as indicated by the mean values of the partial correlation coefficients for temperature, precipitation, and soil moisture with vegetation NDVI, which were −0.394, 0.108, and 0.726, respectively. We discovered that temperature was the primary driver of the Maowusu Sandland, whereas rainfall was the primary driver in the eastern and southern parts. Among these, precipitation, air temperature, plant type, and topographic variables were the key determinants of soil moisture and accounted for the main drivers of the research region. Precipitation is particularly important for herbaceous plants growing in chestnut calcium soil. It is the main driving factor for the Maowusu Sandland’s large expanse of the steppe zone, which contains high calcium ions and carbonates, loose texture, good permeability, and poor water-holding capacity. In particular, the primary cause of the Maowusu Sandland region’s healthy vegetation development is climate change.
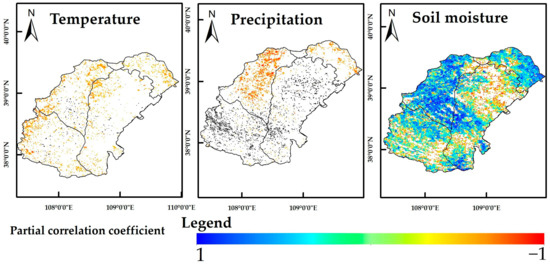
Figure 12.
Partial correlation coefficients for temperature, precipitation, and soil moisture.
3.6. Changes in Plant Cover as a Result of Climatic Conditions and Human Activity
The primary drivers of the growth trends in vegetation NDVI from 2000 to 2019 were human activity and climate change, with the former predominating over the latter (Figure 13). The study area’s vegetation NDVI improvement accounted for 99.26% of the total area. Of these, most of the vegetation improvement areas—primarily located in the eastern and southern regions of the study area—were driven by meteorological changes, while the remaining portion was primarily controlled by human activity. The primary cause of the rising trend in vegetation cover is the effects of climate change. The primary causes of the decreasing trends in plant cover are human activity-influenced forces.
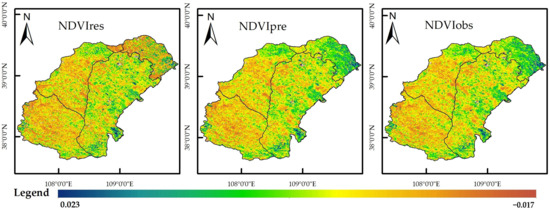
Figure 13.
Trends in the residuals of the NDVIres, NDVIpre, and NDVIobs.
In terms of population density and gross domestic product (GDP) in the study area in 2020 (Figure 14), the population was primarily distributed in the region of vegetation cover NDVI growth, with the high human living standard also located in this region. This is primarily because ecological restoration work in urban suburbs supports development. In contrast, the desert area has a small population and a low human living standard, making the area difficult to develop.
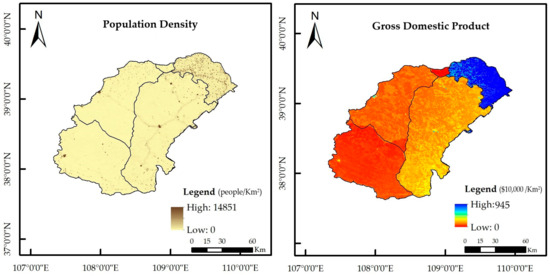
Figure 14.
Population density and gross domestic product (GDP) in 2020.
In particular, the Maowusu Sandland region’s vegetation improvement was primarily driven by climate change, with human-led ecological restoration projects accounting for a small portion of the region. Hence, the region’s vegetation improvement was primarily caused by climate change, with human-led ecological restoration projects serving as a secondary driver. The combined impact of climate change is the primary cause of vegetation decline.
3.7. Relative Contribution of Climate and Human Activities to Vegetation Changes
In regions with increasing NDVIs, the average contribution of climate change to the enhancement of vegetation cover was 55.57%, whereas in regions with declining NDVI, the average contribution of human activities to the deterioration of vegetation cover was 88%. In terms of geographical distribution, the research region’s most densely inhabited city center contributed less compared to vegetation cover. However, the highly populated region had a more favorable influence on ecological restoration efforts. We discovered that there are two main factors contributing to the NDVI decrease: first, the city center area has a greater negative contribution due to human activities compared with the desert area; second, the natural ecological restoration area system has more stable NDVI growth; the desert area has a narrow population distribution and climatic circumstances that make it more vulnerable to the harmful effects of climate change. Because the desert region has fewer people and a harsher environment that is not conducive to plant development, the negative effects of climate change are more pronounced.
Climate change and human activities have the greatest impact on vegetation changes, and climate change has the greatest impact on regions with growing trends in vegetation. In the dry and semi-arid Mao Sandland, rainfall has the greatest impact on plant growth. Sufficient water is necessary to encourage the development and recovery of vegetation. The study area’s shift in land use patterns is partially the result of frequent human activity; as urban sprawl has intensified, there has been a commensurate rise in the amount of man-made land and a corresponding decline in the plant cover in certain localized areas.
3.8. Accurate Long Sequence Prediction Based on Informer
To conduct this study, a total of 7305 days of daily meteorological data for 228 months, spanning from 1 January 2000 to 31 December 2019, were chosen for the Maowusu Sandland. These data included information on temperature and rainfall.
Python 3.8, the PyCharm 3.8.1 framework, Windows 11, and 16 GB comprised the experimental environment.
This study adjusts the hyperparameters according to the training results of its prediction model, and the final hyperparameters are set as follows: learning rate, 0.001; number of iterations, 20; batch size, 128; activation function, Gaussian error linear units (GELU). This study’s hyperparameters were adjusted according to the meteorological data of the prediction model.
Four commonly used evaluation metrics were selected to assess the prediction performance of the model from different perspectives, i.e., mean absolute error (MAE), mean square error (MSE), root mean square error (RMSE), and mean absolute percentage error (MAPE). The smaller the value of these four evaluation indexes, the closer the prediction result is to the real value, and the more accurate the prediction accuracy of the model; the specific calculation formula is as follows:
where yi is the true value of the original data; is the predicted value of the original data; n is the test sample size; i is the test sample point sequence number.
The average daily temperature (calculated based on 24-h temperature observations), total daily precipitation (based on rainfall totals over 24 h), and NDVI data from 2000 to 2018 were used in the prediction validation experiment to assess the predictive model’s accuracy. The prediction results are depicted in Figure 15.
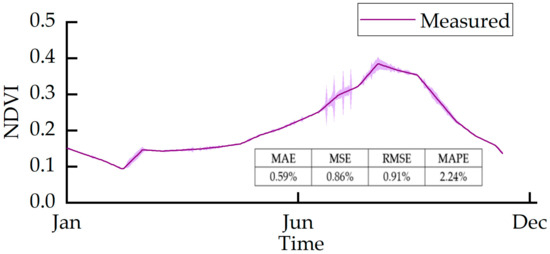
Figure 15.
Informer model prediction error plot.
Figure 16 shows that the prediction error values of the Informer model’s findings compared to the actual results are 0.59%, 0.86%, 0.91%, and 2.24% for mean absolute error (MAE), mean square error (MSE), root mean square error (RMSE), and mean absolute percentage error (MAPE), respectively. This provides strong evidence that our enhanced Transformer-based Informer model closely approximates the real values’ curve fit. Our prediction model will have a lower error value and use less computation time than the conventional model, thoroughly demonstrating the viability of the model. As a result, the model is more effective in forecasting NDVI’s future trends.
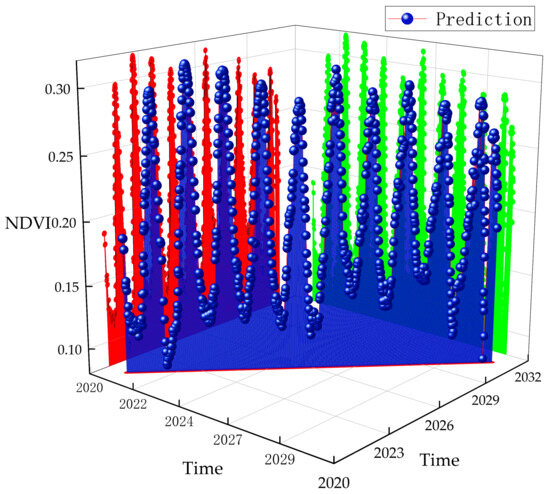
Figure 16.
Map of NDVI projection results for the next ten years.
In this study, we utilized the Informer model and input average daily temperature, total daily precipitation, and NDVI data from 2000 to 2020 for deep learning to forecast the NDVI trend for the following ten years (Figure 16). As further evidence of the reliability of the prediction findings, the peak NDVI for each year in the prediction results is approximately 0.3, which does not differ significantly from the peak input NDVI data in recent years. Figure 17 illustrates the forecast findings, which demonstrate that the NDVI trend will stabilize during the following ten years. The nonlinear fitted equation has a slope of 0.000294, indicating a minimal change over the following ten years (Figure 17).
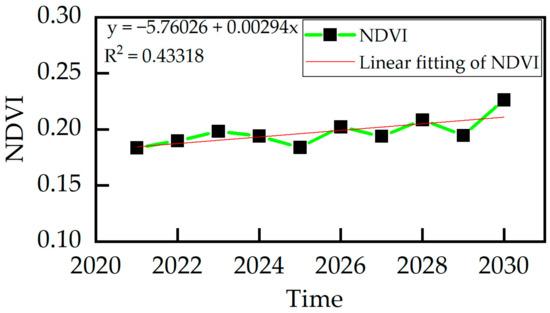
Figure 17.
NDVI trend chart for the next ten years.
4. Discussion
4.1. Characteristics of Dynamic Changes in Land-Use Types and Changes in Groundwater Resources in the Maowusu Sandland Area
According to our research, the Maowusu Sandland area’s primary land use categories from 2000 to 2019 were, in descending order, farmland, forest, grassland, shrubland, wetland, water body, bare ground, and man-made land surface (Figure 4 and Figure 5). Man-made surfaces were sporadically distributed, mostly concentrated in the eastern region of the Maowusu Sandland, and developing rapidly, with a fast growth trend, the same as that reported in the past. The study area showed a trend of gradually increasing cropland and decreasing grassland from the southeast to the northwest [50]. Wetlands, cropland, bare land, and man-made land surfaces all exhibited an upward trend between 2000 and 2020, with cropland having the largest increase, water bodies showing a slight decrease, grassland exhibited the largest decline in 20 years, and forests and shrublands showing relatively no change. Grassland is a key land use type for the ecological repair and preservation of sandy land. According to the field research, the predominant vegetation was sandy cypress, and between 2000 and 2020, grassland had a decreasing tendency. However, man-made land surfaces and arable land also showed a minor growth trend, shifting toward reversing the ecologically unsound trend.
According to our 2020 daily monitoring data, from April through October, numerous monitoring sites located at agricultural sites within the study region exhibited decreasing groundwater levels. This shows that groundwater may be the area’s primary source of agroecological water. In regions where the groundwater table is < 4 m deep, we discovered that the flora is well-developed. This supports earlier findings and implies that groundwater has a positive influence on promoting plants [51]. According to research by Zhang et al. [8], high-density vegetation in the Maowusu Sandland may have contributed to a drop in the groundwater table and retention of water in the soil. To maintain the sustainability of the ecosystem, we propose that water balance concerns be taken into account in upcoming ecological restoration initiatives in China and across the world.
4.2. Quantifying the Impacts of Human Activities and Climate Change on NDVI
Lin et al. [50] tracked the Maowusu Sandland region’s sandy vegetation cover from 2000 to 2019 and linked changes in the local climate to NDVI-related land cover metrics. Using residual analysis, they assessed the various contributions and discovered that most of the NDVI exhibited an increasing trend, with only 0.08% in the highly damaged area. According to our study, which aligns with the other data, the vegetation cover in the studied region exhibited a decreasing trend from east to west. It also had a larger distribution of mostly low and medium vegetation cover [50]. Vegetation cover had a variable increasing trend of 0.0034 a−1, which was primarily demonstrated by an ongoing but slower rate of increase in NDVI across the study period.
According to Tian et al. [52], in the Yellow River Basin, NDVI is positively associated with air temperature and precipitation, with precipitation having a greater impact on plant development than air temperature. According to Yang et al. [35], the Maowuosu Sandland region’s response relationship between NDVI and climatic factors in one year was primarily in the spring, with most precipitation negatively correlated with NDVI and the areas of positive and negative correlation essentially flat in other months. In our study, the two climatic elements restricting plant growth—air temperature and precipitation—were both somewhat favorably and slightly negatively associated with the total NDVI growth rate in the study region.
Gao et al. [53] used the residual analysis of Maowusu Sandland from 1985 to 2020 to reveal that human activity contributed 56.44% of the NDVI, and climatic change contributed 43.56%. Lin et al. [50] measured the Maowusu Sandland’s impact from 2000 to 2019, revealing that human activity was the primary driving force. In our research, we discovered that the Maowusu Sandland’s plant cover was mostly favorably influenced by climate change, with a relative contribution rate of 55.47%, and that human activities and climate change had some heterogeneity. However, the improvement in vegetation was primarily attributed to the ecological restoration project driven by climate change, in which human activities only made up a small portion of the factors, and its implementation had a positive impact on governance. In contrast, the decline in vegetation was primarily attributed to the impact of climate change. Temperature changes and extreme weather have a greater impact on vegetation development. The ecosystem is more stable and resistant to the effects of the outside environment when the ecological environment is better.
4.3. Precision Long Time Series-Informer Model
To guarantee ecological quality and offer a scientific foundation for sustainable development, accurate NDVI predictions are crucial. Huang et al. [23] reported that the support vector machine (SVM) could accurately recreate the observed NDVI series. However, the normalized system criterion (NSC) value for the validation period was only guaranteed to be between 0.9 and 0.95. For the NPP spatial simulation distribution prediction, Wang et al. [54] utilized a CA-Markov model with a kappa coefficient of 0.8776. However, it can fully utilize large-scale time series data for improved short-term NDVI prediction compared to deep learning, which has higher learning and fitting capabilities. The NDVI and meteorological factor data from 2000 to 2018 were utilized for deep learning using the Informer model, an effective long short-term memory (LSTM) model enhanced based on the Transformer; the hyperparameters were ideally changed to provide a probabilistic sparse self-attention mechanism.
The model can recognize patterns in unsteady, smoothed meteorological factor data. Moreover, using a probabilistic sparse self-attention mechanism can remove the volatility of the meteorological factor to enhance the accuracy of NDVI predictions while retaining the original data’s key elements. The mean absolute percentage error (MAPE) of the Informer model suggested in this study may be reduced to 2.24% after analyzing the NDVI prediction data, providing a strong scientific foundation for future NDVI predictions in China and throughout the world.
5. Conclusions
The Maowusu Sandland area has the following land use classifications, in descending order: grassland, bare land, farmland, shrubland, water body, wetland, man-made surface, and forest. The overall pattern is cropland progressively declining from east to west and grassland growing. The NDVI has a decreasing tendency from east to west and is mostly dispersed by low and medium vegetation cover. It swings upward by 0.0034 a−1, primarily caused by the NDVI’s constant increase throughout the period. In the Maowusu Sandland, which is primarily impacted by the climate change-led ecological restoration project, human activities account for a small portion of the factors. The ecological restoration project has a better management effect, with some heterogeneity in the contribution of vegetation cover due to both factors. The impact of climate change is primarily to blame for the decline in the vegetative cover.
The primary issues that the Informer model resolves with the Transformer are (1) not being directly affected by the long sequence time-series forecasting (LSTF) problem; (2) excessive memory occupancy; (3) encoder–decoder architectural restrictions; and (4) performance loss in long output time series prediction. We used this method for NDVI prediction because it can identify patterns in the unsteady smoothed weather factor data and, by removing the volatility of the weather factors through a probsparse self-attention mechanism, it can remove the volatility while maintaining the critical information of the original data, resulting in accurate long time series prediction (MAPE = 2.24%). Using historical data, the study’s conclusions may accurately forecast future crop yields, crop pests and diseases, and NDVI. This opens up new agricultural production and management avenues and contributes to realizing more sustainable and productive agricultural practices. This discovery has broad ramifications for real-world applications and is significant for scientific research.
Author Contributions
The contributions of H.H., R.L., H.Z. and C.T. involved in designing the manuscript; H.H., H.L. and J.W. carried out this experiment; G.W., Z.Q. and W.W. analyzed the data and wrote the manuscript. All authors have read and agreed to the published version of the manuscript.
Funding
Key Special Project of “Science and Technology for the Development of Inner Mongolia”: Project of “Creating Erdos National Sustainable Development Agenda Innovation Demonstration Zone—Technology and Demonstration of Intensive and Efficient Utilization: 2021EEDSCXSFQZD010; Research on groundwater exploitation and utilization and ecological environment monitoring and early warning system development in Mu Us SandLand, China: MK20210222; Research on grassland drought monitoring and scale transformation based on multi-source and multi-temporal remote sensing: 52269004.
Data Availability Statement
The data presented in this study are available on request from the corresponding author. The data are not publicly available due to privacy.
Conflicts of Interest
The authors declare no conflict of interest.
References
- Gong, Z.; Zhao, S.; Gu, J. Correlation analysis between vegetation coverage and climate drought conditions in North China during 2001–2013. J. Geogr. Sci. 2017, 27, 143–160. [Google Scholar] [CrossRef]
- Zhao, J.; Du, Z.Q.; Wu, Z.T.; Zhang, H.; Guo, N. Seasonal variation of diurnal warming in temperate China and its impact on vegetation dynamics. J. Geogr. 2018, 73, 395–404. [Google Scholar]
- Ye, W.; van Dijk, A.I.; Huete, A.; Yebra, M. Global trends in vegetation seasonality in the GIMMS NDVI3g and their robustness. Int. J. Appl. Earth Obs. Geoinf. 2021, 94, 102238. [Google Scholar] [CrossRef]
- Zhang, J.; Li, C.; Wang, T. Dynamic changes of vegetation coverage on the Loess Plateau and its factors. Res. Soil Water Conserv. 2022, 29, 224–230, 241. [Google Scholar]
- Li, X.; Yang, L.; Tian, W.; Xu, X.; He, C. A review of land use/cover change studies in northern China’s agricultural and pastoral intertwined zone. J. Appl. Ecol. 2018, 29, 3487–3495. [Google Scholar]
- Li, X. Analysis of the Desertification Reversal Process and Causes in the Mu Us Sandy Land. Ph.D. Thesis, Shaanxi Normal University, Xi’an, China, 2017. [Google Scholar]
- Han, X.; Yang, G.; Qin, F.; Jia, G.; Ling, X.; Gao, G. Spatiotemporal Dynamic Evolution Pattern of Desertified Land in the Mu Us Sandy Land in the Past 30 Years. Soil Water Conserv. Res. 2019, 26, 144–157. [Google Scholar]
- Zhang, M.; Wu, X. The rebound effects of recent vegetation restoration projects in Mu Us Sandy land of China. Ecol. Indic. 2020, 113, 106228. [Google Scholar] [CrossRef]
- Dai, Z. Intensive agropastoralism; dryland degradation, the theGrain to Green Program and islands of sustainability in the US Sandy Land of China. Agric. Ecosyst. Environ. 2010, 138, 249–256. [Google Scholar] [CrossRef]
- Nathan, S.D.; Wanger, J.; Zibrak, J.D.; Wencel, M.L.; Burg, C.; Stauffer, J.L. Using forced vital capacity (FVC) in the clinic to monitor patients with idiopathic pulmonary fibrosis (IPF): Pros and cons. Expert Rev. Respir. Med. 2021, 15, 175–181. [Google Scholar] [CrossRef]
- Li, F.; Wang, G.; Du, H.; Li, M.; Liang, S.; Peng, H. Reconstruction of NDVI and Analysis of Annual Maximum Changes in a Typical Area of Qinghai Lake Basin by Integrating MODIS and Landsat Data. Acta Prataculturae Sin. 2023, 32, 28–39. [Google Scholar] [CrossRef]
- Jiang, M.; He, Y.; Song, C.; Pan, Y.; Qiu, T.; Tian, S. Disaggregating climatic and anthropogenic influences on vegetation changes in Beijing-Tianjin-Hebei region of China. Sci. Total Environ. 2021, 786, 147574. [Google Scholar] [CrossRef]
- Fang, J.; Yu, G.; Liu, L.; Hu, S.; Chapin, F.S., III. Climate change, human impacts, and carbon sequestration in China. Proc. Natl. Acad. Sci. USA 2018, 115, 4015–4020. [Google Scholar] [CrossRef] [PubMed]
- Xu, Y.; Yang, D.; Tang, L.; Qiao, Z.; Ma, L.; Chen, M. Exploring the Impact of Grain-for-Green Program on Trade-Offs and Synergies among Ecosystem Services in West Liao River Basin, China. Remote Sens. 2023, 15, 2490. [Google Scholar] [CrossRef]
- Guo, Z.; Xie, Y.; Guo, H.; Zhang, X.; Wang, H.; Bie, Q.; Ma, C. Do the ecosystems of Gansu Province in Western China’s crucial ecological security barrier remain vulnerable? Evidence from remote sensing based on geospatial analysis. J. Clean. Prod. 2023, 402, 136740. [Google Scholar] [CrossRef]
- Dong, X.; Zhou, Y.; Liang, J.; Zou, D.; Wu, J.; Wang, J. Assessment of Spatiotemporal Patterns and the Effect of the Relationship between Meteorological Drought and Vegetation Dynamics in the Yangtze River Basin Based on Remotely Sensed Data. Remote Sens. 2023, 15, 3641. [Google Scholar] [CrossRef]
- Li, M.; Qin, Y.; Zhang, T.; Zhou, X.; Yi, G.; Bie, X.; Gao, Y. Climate Change and Anthropogenic Activity Co-Driven Vegetation Coverage Increase in the Three-North Shelter Forest Region of China. Remote Sens. 2023, 15, 1509. [Google Scholar] [CrossRef]
- Wang, J.; Wang, S.; Li, Q.; Li, M. Determining the Contributions of Climate Change and Multiple Human Activities to Runoff and Sediment Reduction in the Eastern Loess Plateau, China. Catena 2023, 232, 107376. [Google Scholar] [CrossRef]
- Goswami, S.; Mehta, A.; Verma, G. Trend and Time Series Analysis of Vegetation Dynamics Using Satellite Data: A Case Study of Uttarakhand, India. Curr. J. Appl. Sci. Technol. 2022, 32, 14–26. [Google Scholar]
- Guo, J.; Wu, X.; Dong, G.; Li, Y.; Wu, R. Relative Contribution Analysis of Driving Factors for Vegetation Cover Change in the Tarim River Basin Based on MODIS/NDVI. Arid Zone Res. 2017, 34, 621–629. [Google Scholar] [CrossRef]
- Yang, W.; Zhang, X.; Zhao, J. Remote Sensing Inversion of Leaf Area Index Based on Geospatial Model and SVR Algorithm. Sci. Soil Water Conserv. 2018, 16, 48–55. [Google Scholar] [CrossRef]
- Luo, J.; Hong, T.; Gao, Z.; Fang, S.C. A robust support vector regression model for electric load forecasting. Int. J. Forecast. 2023, 39, 1005–1020. [Google Scholar] [CrossRef]
- Huang, S.; Zheng, X.; Ma, L.; Wang, H.; Huang, Q.; Leng, G.; Guo, Y. The quantitative contribution of climate change and human activities to vegetation cover variations based on the GA-SVM model. J. Hydrol. 2020, 584, 124687. [Google Scholar] [CrossRef]
- Blekanov, I.; Molin, A.; Zhang, D.; Mitrofanov, E.; Mitrofanova, O.; Li, Y. Monitoring of grain crops’ nitrogen status from UAV multispectral images coupled with deep learning approaches. Comput. Electron. Agric. 2023, 212, 108047. [Google Scholar] [CrossRef]
- Cheng, H.; Zhen, H. Short-term Electric Power Load Forecasting Model Based on Improved PSO Optimized RNN. Electron. Meas. Technol. 2019, 42, 94–98. [Google Scholar] [CrossRef]
- Gao, P.; Du, W.; Lei, Q.; Li, J.; Zhang, S.; Li, N. NDVI Forecasting Model Based on the Combination of Time Series Decomposition and CNN–LSTM. Water Resour. Manag. 2023, 37, 1481–1497. [Google Scholar] [CrossRef]
- Ahmad, R.; Yang, B.; Ettlin, G.; Berger, A.; Rodr guez-Bocca, P. A machine-learning-based ConvLSTM architecture for NDVI forecasting. Int. Trans. Oper. Res. 2023, 30, 2025–2048. [Google Scholar] [CrossRef]
- Haq, M.A.; Ahmed, A.; Khan, I.; Gyani, J.; Mohamed, A.; Attia, E.A.; Pandi, D. Analysis of environmental factors using AI and ML methods. Sci. Rep. 2022, 12, 13267. [Google Scholar] [CrossRef]
- Li, J.; Li, C.; Xu, W.; Feng, H.; Zhao, F.; Long, H.; Yang, G. Fusion of optical and SAR images based on deep learning to reconstruct vegetation NDVI time series in cloud-prone regions. Int. J. Appl. Earth Obs. Geoinf. 2022, 112, 102818. [Google Scholar] [CrossRef]
- Zhou, H.; Zhang, S.; Peng, J.; Zhang, S.; Li, J.; Xiong, H.; Zhang, W. Informer: Beyond efficient transformer for long sequence time-series forecasting. In Proceedings of the AAAI Conference on Artificial Intelligence, Virtual, 2–9 February 2021; Volume 35, pp. 11106–11115. [Google Scholar]
- Guo, Z.C.; Wang, T.; Liu, S.L.; Kang, W.P.; Chen, X.; Feng, K.; Zhi, Y. Biomass and vegetation coverage survey in the Mu Us sandy land based on unmanned aerial vehicle RGB images. Int. J. Appl. Earth Obs. Geoinf. 2021, 94, 102239. [Google Scholar] [CrossRef]
- Yan, Y.; Yang, Y.; Wang, Y.; Yan, J. Trends and Attribution Analysis of Habitat Quality Changes in Beijing-Tianjin-Hebei Region over the Past 40 Years. Remote Sens. Technol. Appl. 2023, 38, 251–263. [Google Scholar]
- He, Y.; Wang, L.; Niu, Z.; Nath, B. Vegetation recovery and recent degradation in different karst landforms of southwest China over the past two decades using GEE satellite archives. Ecol. Inform. 2022, 68, 101555. [Google Scholar] [CrossRef]
- Dong, H.; Liu, Y.; Cui, J.; Zhu, M.; Ji, W. Based on GEE, spatial and temporal variations of vegetation cover and its influencing factors in Shandong Province. Environ. Monit. Assess. 2023, 195, 1023. [Google Scholar] [CrossRef]
- Yang, M.; Jin, X.; Wang, T. Changes in Vegetation Phenology in the Mu Us Sandy Land and Its Response to Climate Change. Bull. Soil Water Conserv. 2022, 42, 242–249. [Google Scholar] [CrossRef]
- Lian, H. Spatiotemporal Dynamics and Deep Leakage Characteristics of Soil Moisture in Four Land Use Types in the Mu Us Sandy Land. Ph.D. Thesis, Inner Mongolia Agricultural University, Hohhot, China, 2023. [Google Scholar] [CrossRef]
- Cao, Y.; Fang, X.; Yang, L.; Jiang, X.; Liao, M.; Ren, L. Downscaling Study of CCI Soil Moisture in the Xiliao River Basin Based on Random Forest. J. Geo-Inf. Sci. 2023, 25, 1669–1681. [Google Scholar]
- Frimpong, B.F.; Koranteng, A.; Molkenthin, F. Analysis of temperature variability utilizing Mann–Kendall and Sen’s slope estimator tests in the Accra and Kumasi Metropolises in Ghana. Environ. Syst. Res. 2022, 11, 24. [Google Scholar] [CrossRef]
- Wan, H.; Wang, Y.; Hou, P.; Liu, Y.; Li, G.; Zhao, S. Monitoring and analysis of vegetation and water dynamics in Chinese priority areas for biodiversity conservation during 2001–2016. J. Ecol. Rural Environ. 2019, 35, 273–282. [Google Scholar]
- Lai, J.; Qi, S.; Liao, R.; Cui, R.; Li, P.; Tang, Y. Response of Vegetation Changes in the Southwest Mountainous Gorge Area from 2000 to 2019 to Climate Change and Human Activities. J. Agric. Eng. 2023, 39, 1–9. [Google Scholar]
- Li, X.; Wang, X.; Liu, X.; Zhang, L.; Jin, X.; Chen, Y. Spatiotemporal Changes of NDVI in Shaanxi Province from 2000 to 2020 and Detection of Climate Factors. Soil Water Conserv. Res. 2023, 39, 1–11. [Google Scholar]
- Xue, X.; Wang, Z.; Hou, S. NDVI-Based Vegetation Dynamics and Response to Climate Changes and Human Activities in Guizhou Province, China. Forests 2023, 14, 753. [Google Scholar] [CrossRef]
- Evans, J.; Geerken, R. Discrimination between climate and human-induced dryland degradation. J. Arid Environ. 2004, 57, 535–554. [Google Scholar] [CrossRef]
- Li, H.; Liu, G.; Fu, B. Response of vegetation to climate change and human activity based on NDVI in the Three-River Headwaters region. Shengtai Xuebao/Acta Ecol. Sin. 2011, 31, 5495–5504. [Google Scholar]
- Jin, K.; Wang, F.; Han, J.; Shi, S.; Ding, W. Contribution of climatic change and human activities to vegetation NDVI change over China during 1982–2015. Acta Geogr. Sin. 2020, 75, 961–974. [Google Scholar]
- Xu, H.; Cheng, J.; He, Y.; Wang, Y.; Zhang, M. The Impact of Climate Change and Human Activities on the Net Primary Productivity of Vegetation in Yunnan Province. Plateau Meteorol. 2023, 32, 1–10. [Google Scholar]
- Dong, Z.; Li, F.; Sun, H.; Zhu, M.; Fan, B. Competency Assessment of Workload Management in the Approach Phase Based on the Informer Model. Flight Dyn. 2023, 41, 81–87. [Google Scholar] [CrossRef]
- Zhu, L.; Han, K.; Zhu, C. Short-term Electric Power Load Forecasting Method Combining Informer with Secondary Decomposition Strategy. Foreign Electron. Meas. Technol. 2023, 42, 23–32. [Google Scholar] [CrossRef]
- Guo, Z.; Liu, S.; Kang, W.; Chen, X.; Zhang, X. Change Trend of Vegetation Coverage in the Mu Us Sandy Region from 2000 to 2015. J. Desert Res. 2018, 38, 1099–1107. [Google Scholar]
- Lin, M.; Hou, L.; Qi, Z.; Wan, L. Impacts of climate change and human activities on vegetation NDVI in China’s Mu Us Sandy Land during 2000–2019. Ecol. Indic. 2022, 142, 109164. [Google Scholar] [CrossRef]
- Xi, H.; Feng, Q.; Si, J.; Chang, Z.; Su, Y. Study on the response of NDVI to groundwater level changes in the lower reaches of the Heihe River Oasis. China Desert 2013, 33, 574–582. [Google Scholar]
- Tian, Z.; Ren, Z.; Wei, H. Driving mechanism of spatiotemporal evolution of vegetation in the Yellow River Basin from 2000 to 2020. Environ. Sci. 2022, 43, 743–751. [Google Scholar] [CrossRef]
- Gao, W.; Zheng, C.; Liu, X.; Lu, Y.; Chen, Y.; Wei, Y.; Ma, Y. NDVI-based vegetation dynamics and their responses to climate change and human activities from 1982 to 2020: A case study in the Mu Us Sandy Land, China. Ecol. Indic. 2022, 137, 108745. [Google Scholar] [CrossRef]
- Wang, L.; Zhang, H.; Liu, Z.; Zhang, S.; Kong, J.; Gao, L. A coupled model for simulating and predicting the pattern of net primary productivity. Geomat. Sci. Wuhan Univ. 2021, 46, 1756–1765. [Google Scholar] [CrossRef]
Disclaimer/Publisher’s Note: The statements, opinions and data contained in all publications are solely those of the individual author(s) and contributor(s) and not of MDPI and/or the editor(s). MDPI and/or the editor(s) disclaim responsibility for any injury to people or property resulting from any ideas, methods, instructions or products referred to in the content. |
© 2023 by the authors. Licensee MDPI, Basel, Switzerland. This article is an open access article distributed under the terms and conditions of the Creative Commons Attribution (CC BY) license (https://creativecommons.org/licenses/by/4.0/).