Article

Identifying the Spatial Risk Patterns of Agricultural Non-Point Source Pollution in a Basin of the Upper Yangtze River

1
Eco-Environmental Protection Research Institute, Shanghai Academy of Agricultural Sciences, Shanghai 201403, China
2
Shanghai Engineering Research Centre of Low-Carbon Agriculture (SERCLA), Shanghai 201415, China
*
Author to whom correspondence should be addressed.
Agronomy 2023, 13(11), 2776; https://doi.org/10.3390/agronomy13112776
Submission received: 19 October 2023 / Revised: 3 November 2023 / Accepted: 6 November 2023 / Published: 8 November 2023

Abstract

:
Agricultural non-point source pollution (ANPSP) is a primary cause of watershed water quality deterioration, and over 50% of NPS pollutants are estimated to come from ANPSP. Based on the “source-sink” theory and minimum cumulative resistance (MCR) model, ANPSP source and key resistance factors were integrated to identify areas at risk of ANPSP production and transportation into the waters of the upper Yangtze River basin. The results showed a spatial difference in the agricultural pollution sources of the basin, which were determined using both ANPSP loads and land-use types. Soil type, rainfall erosivity, and elevation were the three most important resistance factors in pollution transportation, weighting 0.373, 0.241, and 0.147, respectively. There was a spatial effect on the comprehensive resistance of ANPSP transportation, which was lower in mountainous terrain at the central basin. On the coupling of source and resistance processes, regions at serious risk of ANPSP were found to be concentrated in the southwest area. Areas at very high risk of NH3-N and TP pollution accounted for 37.6% and 38.1%, respectively, in the total town/street area. The spatial risk patterns identified in this study could be used for decision making and policy regulation of ANPSP and for aquatic environmental protection.

1. Introduction

Agricultural non-point source pollution (ANPSP), which is a crucial risk factor for surface water eutrophication and groundwater pollution, has become an international research hotspot [1]. Approximately 50% of NPS pollutants are estimated to come from agricultural production in Europe [2]. In China, the ANPSP load shows a staged growth trend. Agricultural nitrogen (N) and phosphorus (P), which are the two main pollutants contributing to eutrophication, are estimated to comprise 57% and 67%, respectively, of the total load [3,4]. Most of these ANPS pollutants come from agricultural areas, that is, farmland, animal manure, and aquaculture [5], and runoff, such as direct surface runoff from rainfall. There are a wide range of uncertainties involved in ANPS processes, and the identification, monitoring, prevention, control, and management of ANPSP are therefore connected issues that need to be addressed systemically. An in-depth understanding of the characteristics of ANPSP at multiple basin scales and the influence of natural and social processes in the basin are an essential first step.
It is impossible to effectively carry out large-scale control of ANPSP with the limited available human and financial resources. Identifying the hotspots (areas at high pollution risk) of ANPSP can help distribute the limited resources and governance into these areas and provide cost-effective solutions to reduce the risk of eutrophication in receiving water bodies [6]. Various models have been developed in recent decades to evaluate the risk of ANPSP. The most typical methods are physically based models or empirical models [7,8]. These models have an established capacity to reproduce hydrological processes. During terrestrial ANPS pollutants’ occurrence and transport to receiving water, they will pass through a series of terrestrial ecological processes and certain spatial distances, including land use, agricultural management practices, and natural environments, among others [9]. Focus on the influence of terrestrial resistance processes could provide quantitative results of ANPSP occurrence and transport in the basin.
The agricultural geographic landscapes related to ANPSP influence the distribution form and composition of surface resources, biogeochemical cycles, and other environmental processes [10], which are important for the description of terrestrial resistance process effects on ANPSP. Several studies have attempted to simulate these processes through “source-sink” landscape theory and by applying the minimum cumulative resistance (MCR) model [9,11]. According to the “source-sink” theory, “source” landscapes are those that promote the development of ANPSP, while “sink” landscapes are those that prevent and delay the development of ANPSP [12]. The MCR model comprehensively considers the horizontal connections and ecological processes between landscapes by analyzing the resistance of matter and energy diffusing through landscape space from the source [13]. The “source-sink” landscape theory combined with the MCR model can help obtain an effective simulation of the actual situation, identify the transportation process of ANPSP, and evaluate critical spatial risks [14]. Such information will aid in the development of ANPSP control and management approaches.
Pollutant mobilization processes and transport to the water network vary by region and river [15]. The Yangtze River is the third largest river in the world and the largest river in China, feeding >450 million people [16]. It has a very important strategic position in terms of economic and social development and for ecological environmental protection. An agricultural basin of the upper river is a source of ANPSP, and it plays a critical role in the water quality of the Yangtze River. The discharged ANPS pollutants may increase the risk of eutrophication and pose a threat to the health of aquatic ecosystems and to humans. In the upper area of the Yangtze River, the Linjiang River basin is a high-crop-plantation and a dense aquaculture area. ANPSP in this river basin is particularly serious [17]. From the perspective of the overall ecosystem, the analysis of ANPSP hotspots in agricultural basins can aid in the formulation of effective targeted policies. Integrating these policies with the comprehensive management of basins is conducive to improving the local ecological economy and social benefits.
The Linjiang River basin in the upper area of the Yangtze River, with rich agricultural activity, was selected as the study area. By using the “source-sink” theory and the MCR model, the terrestrial processes on ANPSP occurrence and transport in the basin can be quantitatively and intuitively displayed, and this is indispensable for spatial management. The main objectives of this study were: (1) to compare the spatial patterns of ANPSs according to the loading data from the “Linjiang River (Yongchuan) Deadline Compliance Planning (2020–2023)” and land-use types, (2) to build high-performance comprehensive resistance surfaces for the MCR model, and (3) to identify risk areas for ANPS pollutant production and transportation by using the MCR model and to provide a scientific basis for the prevention and control of aquatic environment pollution. Our study provided practical guidance for ANPSP planning and constitutes an important supplement to government-dominated planning.

2. Materials and Methods

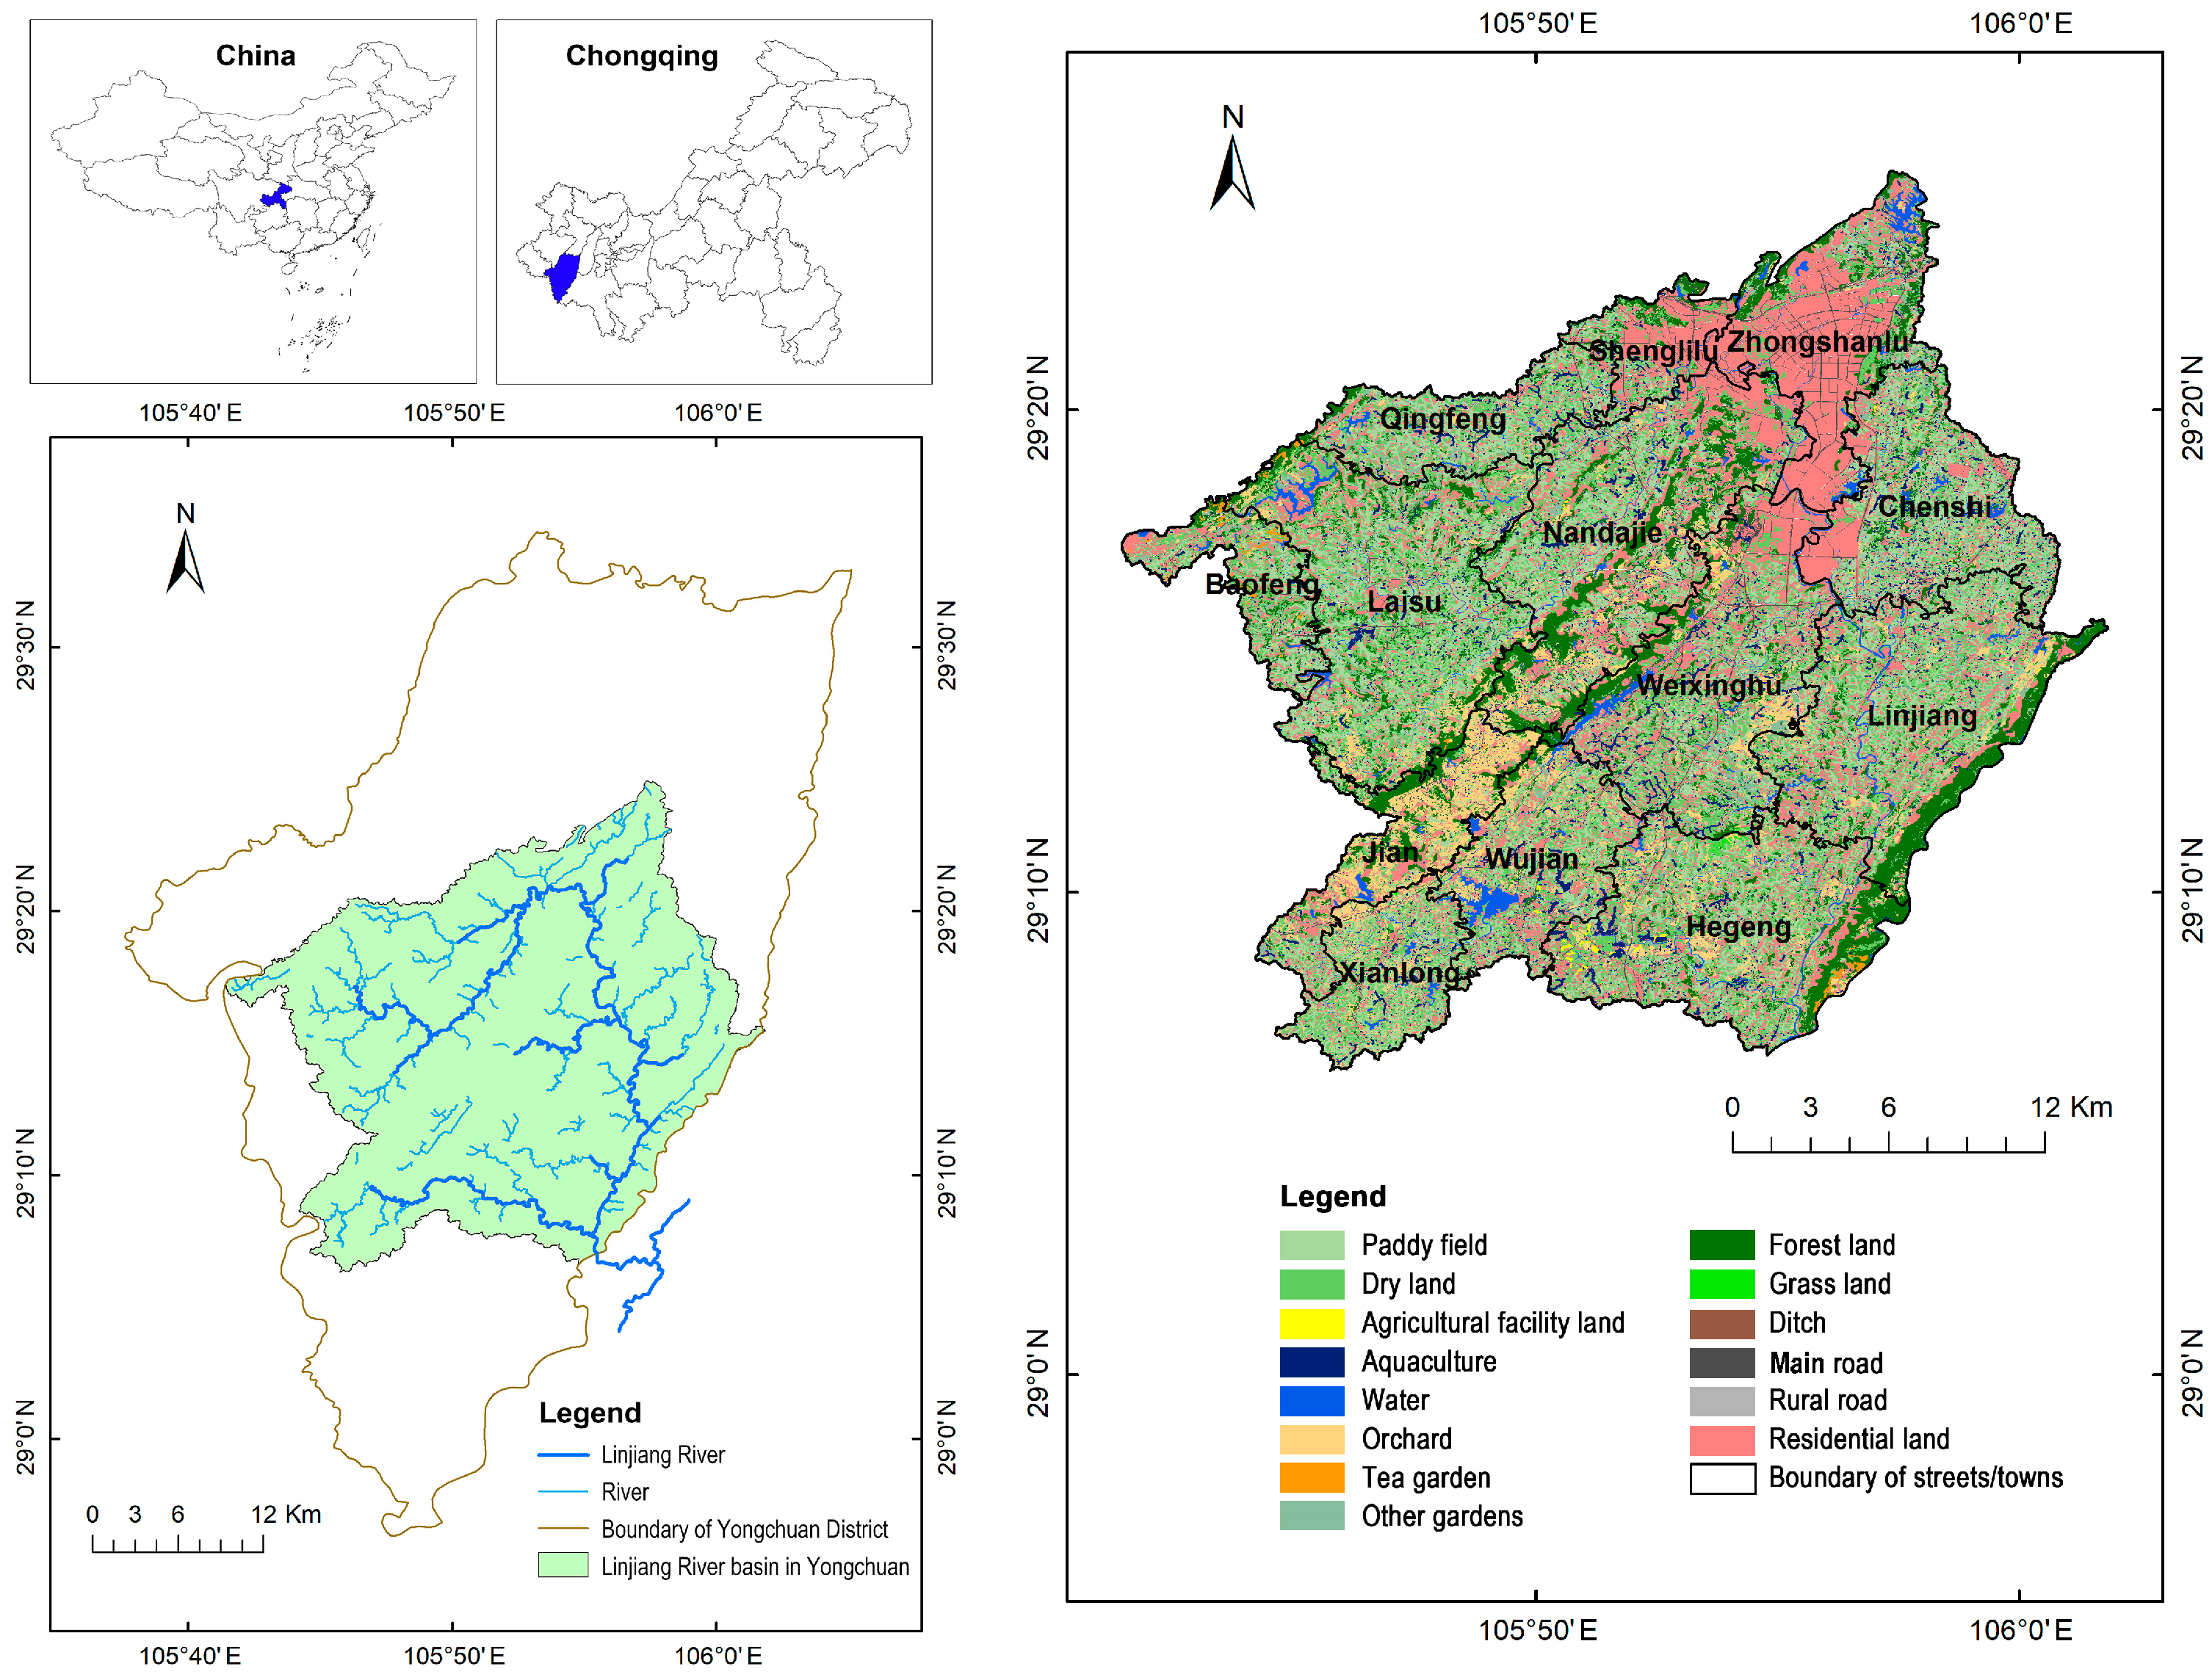
2.1. Site Description

The Linjiang River, a first-level tributary of the upper reaches of the Yangtze River, has a total length of 96.4 km. Its total drainage covers an area of 730 km2, of which 655.8 km2 is in the Yongchuan Distinct, Chongqing City, China (28°56′–29°34′ N, 105°38′–106°05′ E). The Linjiang River basin in Yongchuan District was selected as the study area (Figure 1). Within Yongchuan, the length of the river is about 86.2 km, and it flows through 13 streets/towns, including Zhongshanlu, Shenglilu, Nandajie, Chenshi, Weixinghu, Qingfeng, Linjiang, Hegeng, Xianlong, Jian, Wujian, Laisu, and Baofeng. The basin area accounts for 41.5% of the total area of Yongchuan District. It is characterized by a subtropical humid monsoon climate, with an annual average temperature of 17.8 °C, ranging from −2.9 °C (extreme minimum temperature) in the winter to 40.8 °C (extreme maximum temperature) in the summer. The annual precipitation averages 1042.2 mm, with about 841.1 mm in the summer half-year (May to October) accounting for 80.7% of the annual precipitation and about 201.1 mm in the winter half-year (November to April) accounting for 19.3% of the annual precipitation. The annual evaporation averages 1061.7 mm, the annual relative humidity averages 82%, and the frost-free period averages 312 days.
The study area lies in the parallel ridge valley of east Chongqing. Hills, gentle hills and flatlands, and low mountains are the three major types of landforms. The main soil types are paddy soil, alluvial soil, purple soil, yellow soil, and red soil. Based on the second soil census report in Yongchuan of Sichuan Province conducted in 1982, soil erosion is prevalent in the region. The agricultural land area is large, accounting for 72.1% of the total basin area, and the main plantation crops are rice and vegetables. The area also has a long history of livestock farming and aquaculture, with 24 km2 of freshwater aquaculture in the basin. ANPSP is therefore a major issue for water pollution in this basin. N and P are the major pollutants, with inputs from chemical fertilizers, livestock farming, aquaculture, and soil erosion, among others.

2.2. Data Source

Several datasets were employed to conduct this study. (1) The 30 m × 30 m resolution Landsat8 remote sensing image and digital elevation model were derived from the geospatial data cloud (http://www.gscloud.cn, accessed on 13 October 2022). (2) The administrative boundary and land-use types of the Linjiang River basin in Yongchuan were obtained from the Planning and Natural Resources Bureau of Yongchuan. (3) The soil type was obtained from the Agriculture and Rural Affairs Committee of Yongchuan. (4) The Meteorological data were obtained from the Meteorological Bureau of Yongchuan. (5) Road network data were provided by the Open Street Map website (https://www.openstreetmap.org, accessed on 14 July 2023). (6) ANPSP load data were obtained from the Linjiang River (Yongchuan) Deadline Compliance Planning (2020–2023) (http://www.cqyc.gov.cn/, accessed on 14 July 2023). The collected data were standardized, the coordinate system and attribute structure unified, and the data processed into unified 30 × 30 grid data [18].

2.3. Methodology

2.3.1. Minimum Cumulative Resistance Model

The MCR model was first proposed by Knaapen et al. [19]. It is a derivative of the depletion distance model, which has been widely used in ecology. The model considers the “source”, the spatial distance, and the basic resistance value. For this method, the regional ANPSP index system was constructed, and each index weight was calculated. This was followed by the superposition of each resistance factor on the spatial distance. The MCR value was determined as follows [20]:
MCR = f m i n j = n i = m ( D i j × R i )
where MCR is the minimum cumulative resistance value; f is an unknown function of the positive correlation, min denotes the minimum value of cumulative resistance produced by the different processes of location i transforming into a different source j, Dij is the spatial distance from location i to source j, and Ri denotes the resistance encountered in the process of migration.
There are three main parts to the MCR model: (1) defining the “source” and “sink” (destination), (2) obtaining the basic resistance values of each individual factor that influences the diffusion from the “source”, and (3) calculating the MCR from the “source” to the “sink” using the MCR model [9].

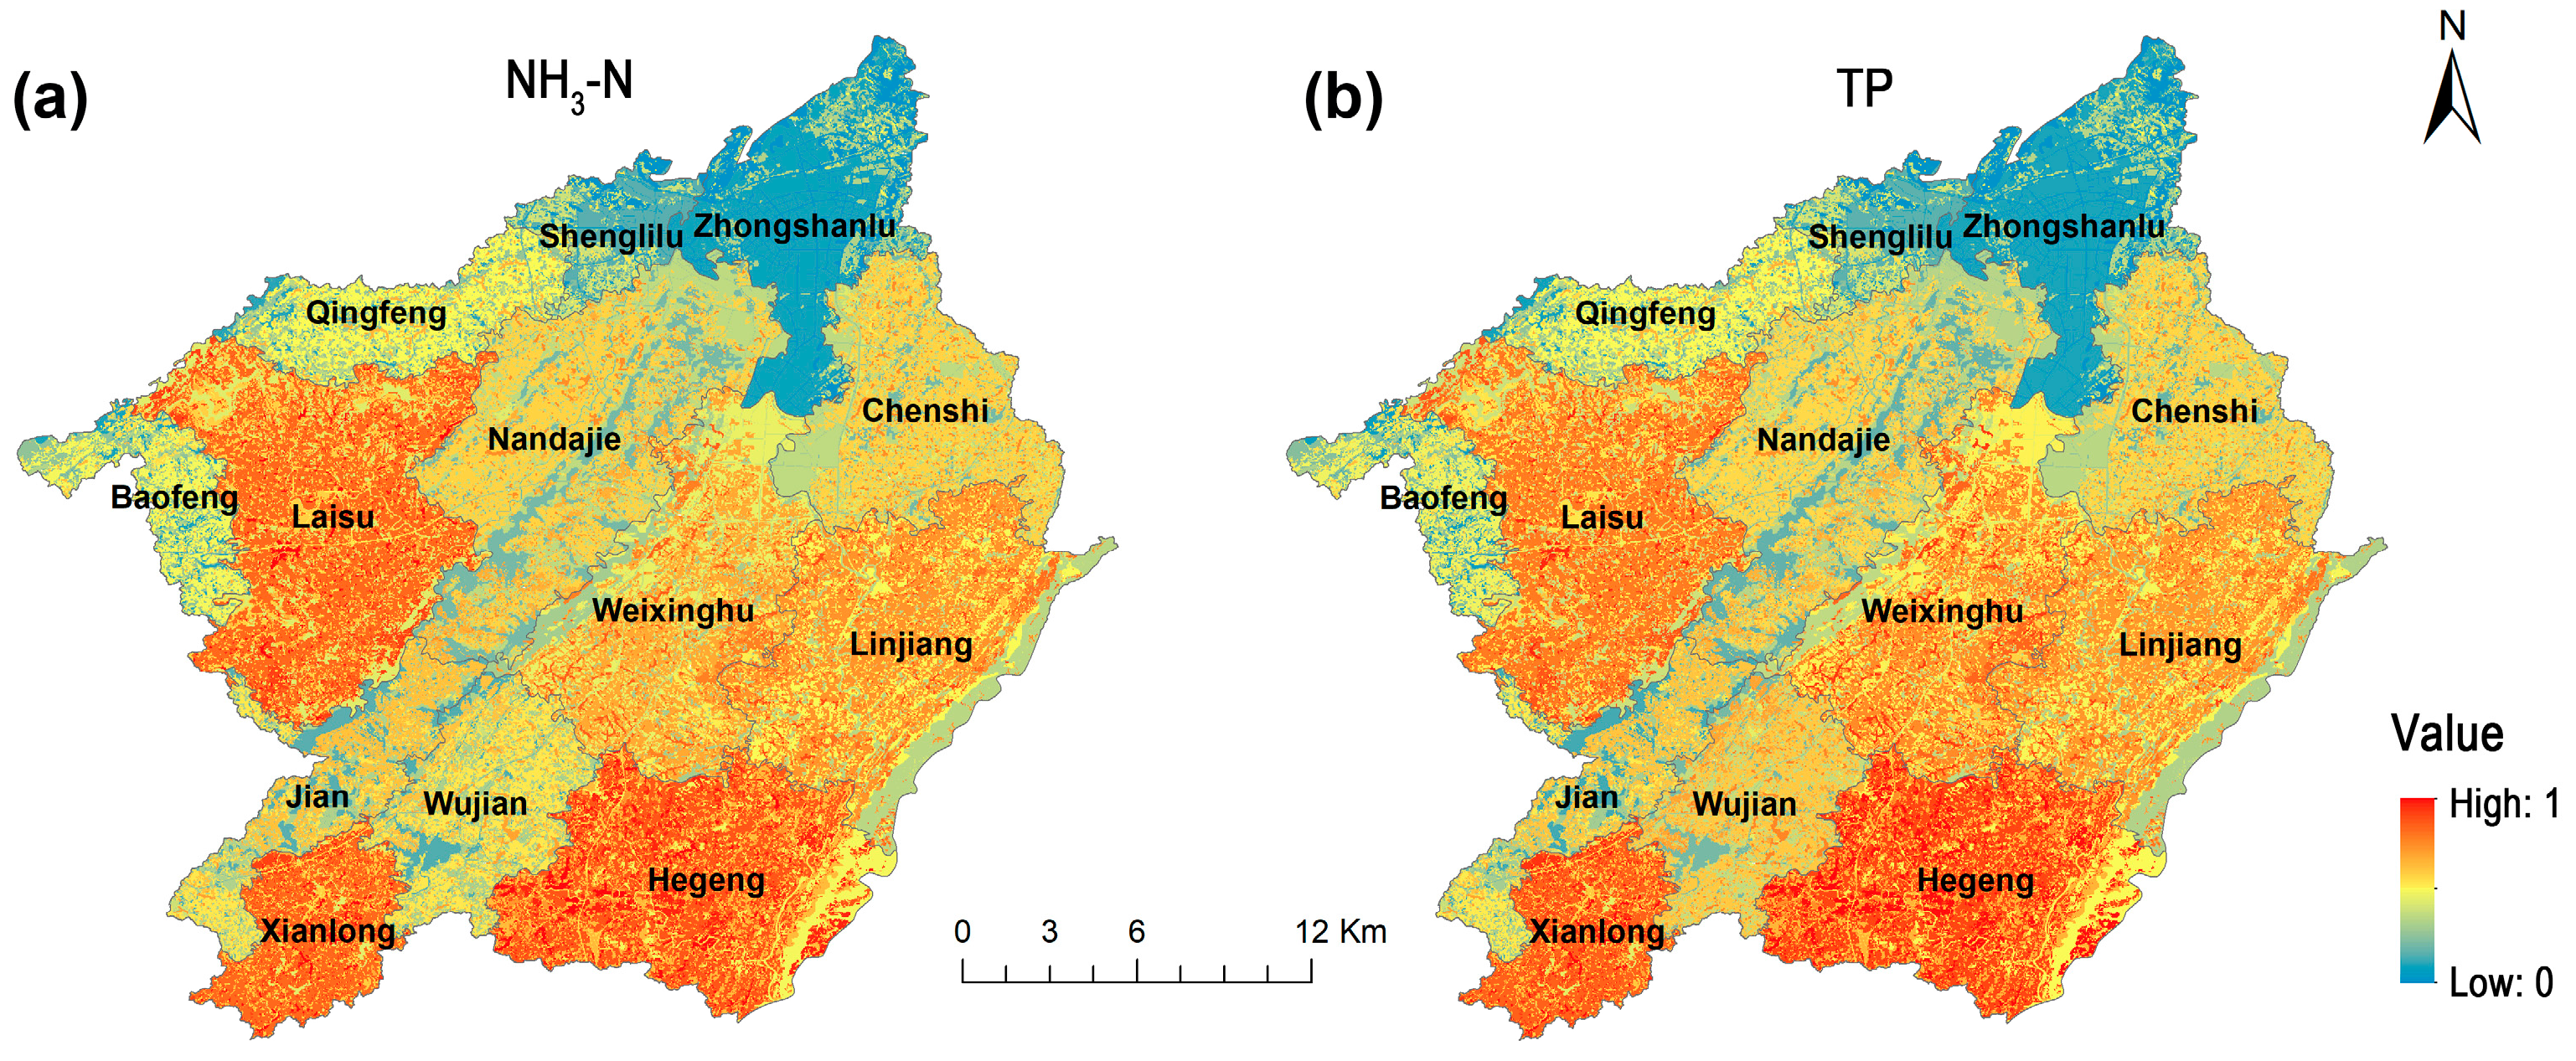
2.3.2. Source Identification

ANPSP sources differ greatly in their expansion capacity across locations [21]. ANPS pollutants are transported from source to sink and eventually enter into the Yangtze River, threatening the water quality. In the present study, terrestrial areas of various landscapes that influence the production and transport of ANPS pollutants into the Yangtze River were considered the “source”, and the water (rivers and lakes) in the basin was considered the “sink”. We superimposed the regional ANPSP load data from 2019 (Table S1) on the land-use type data and used the union of the two as the ANPSP source data. The normalized values of the source were then calculated.
Agricultural structures subject to different management practices can result in different residues of ANPSP [22]. Agricultural activity is a major source of ANPSP transport into the water and is therefore important for the assessment of water quality risks. Values were assigned to different agricultural land-use types in Yongchuan (Figure 1). The values ranged from 1 to 8 for aquaculture, orchard and tea garden, paddy field and dry land, ditch, agricultural facility land and other gardens, residential land, main road and rural road, and forest land and grassland, respectively, with 1 being the most likely to produce ANPSP and 8 being the least likely to produce ANPSP. These values are relative, not absolute.

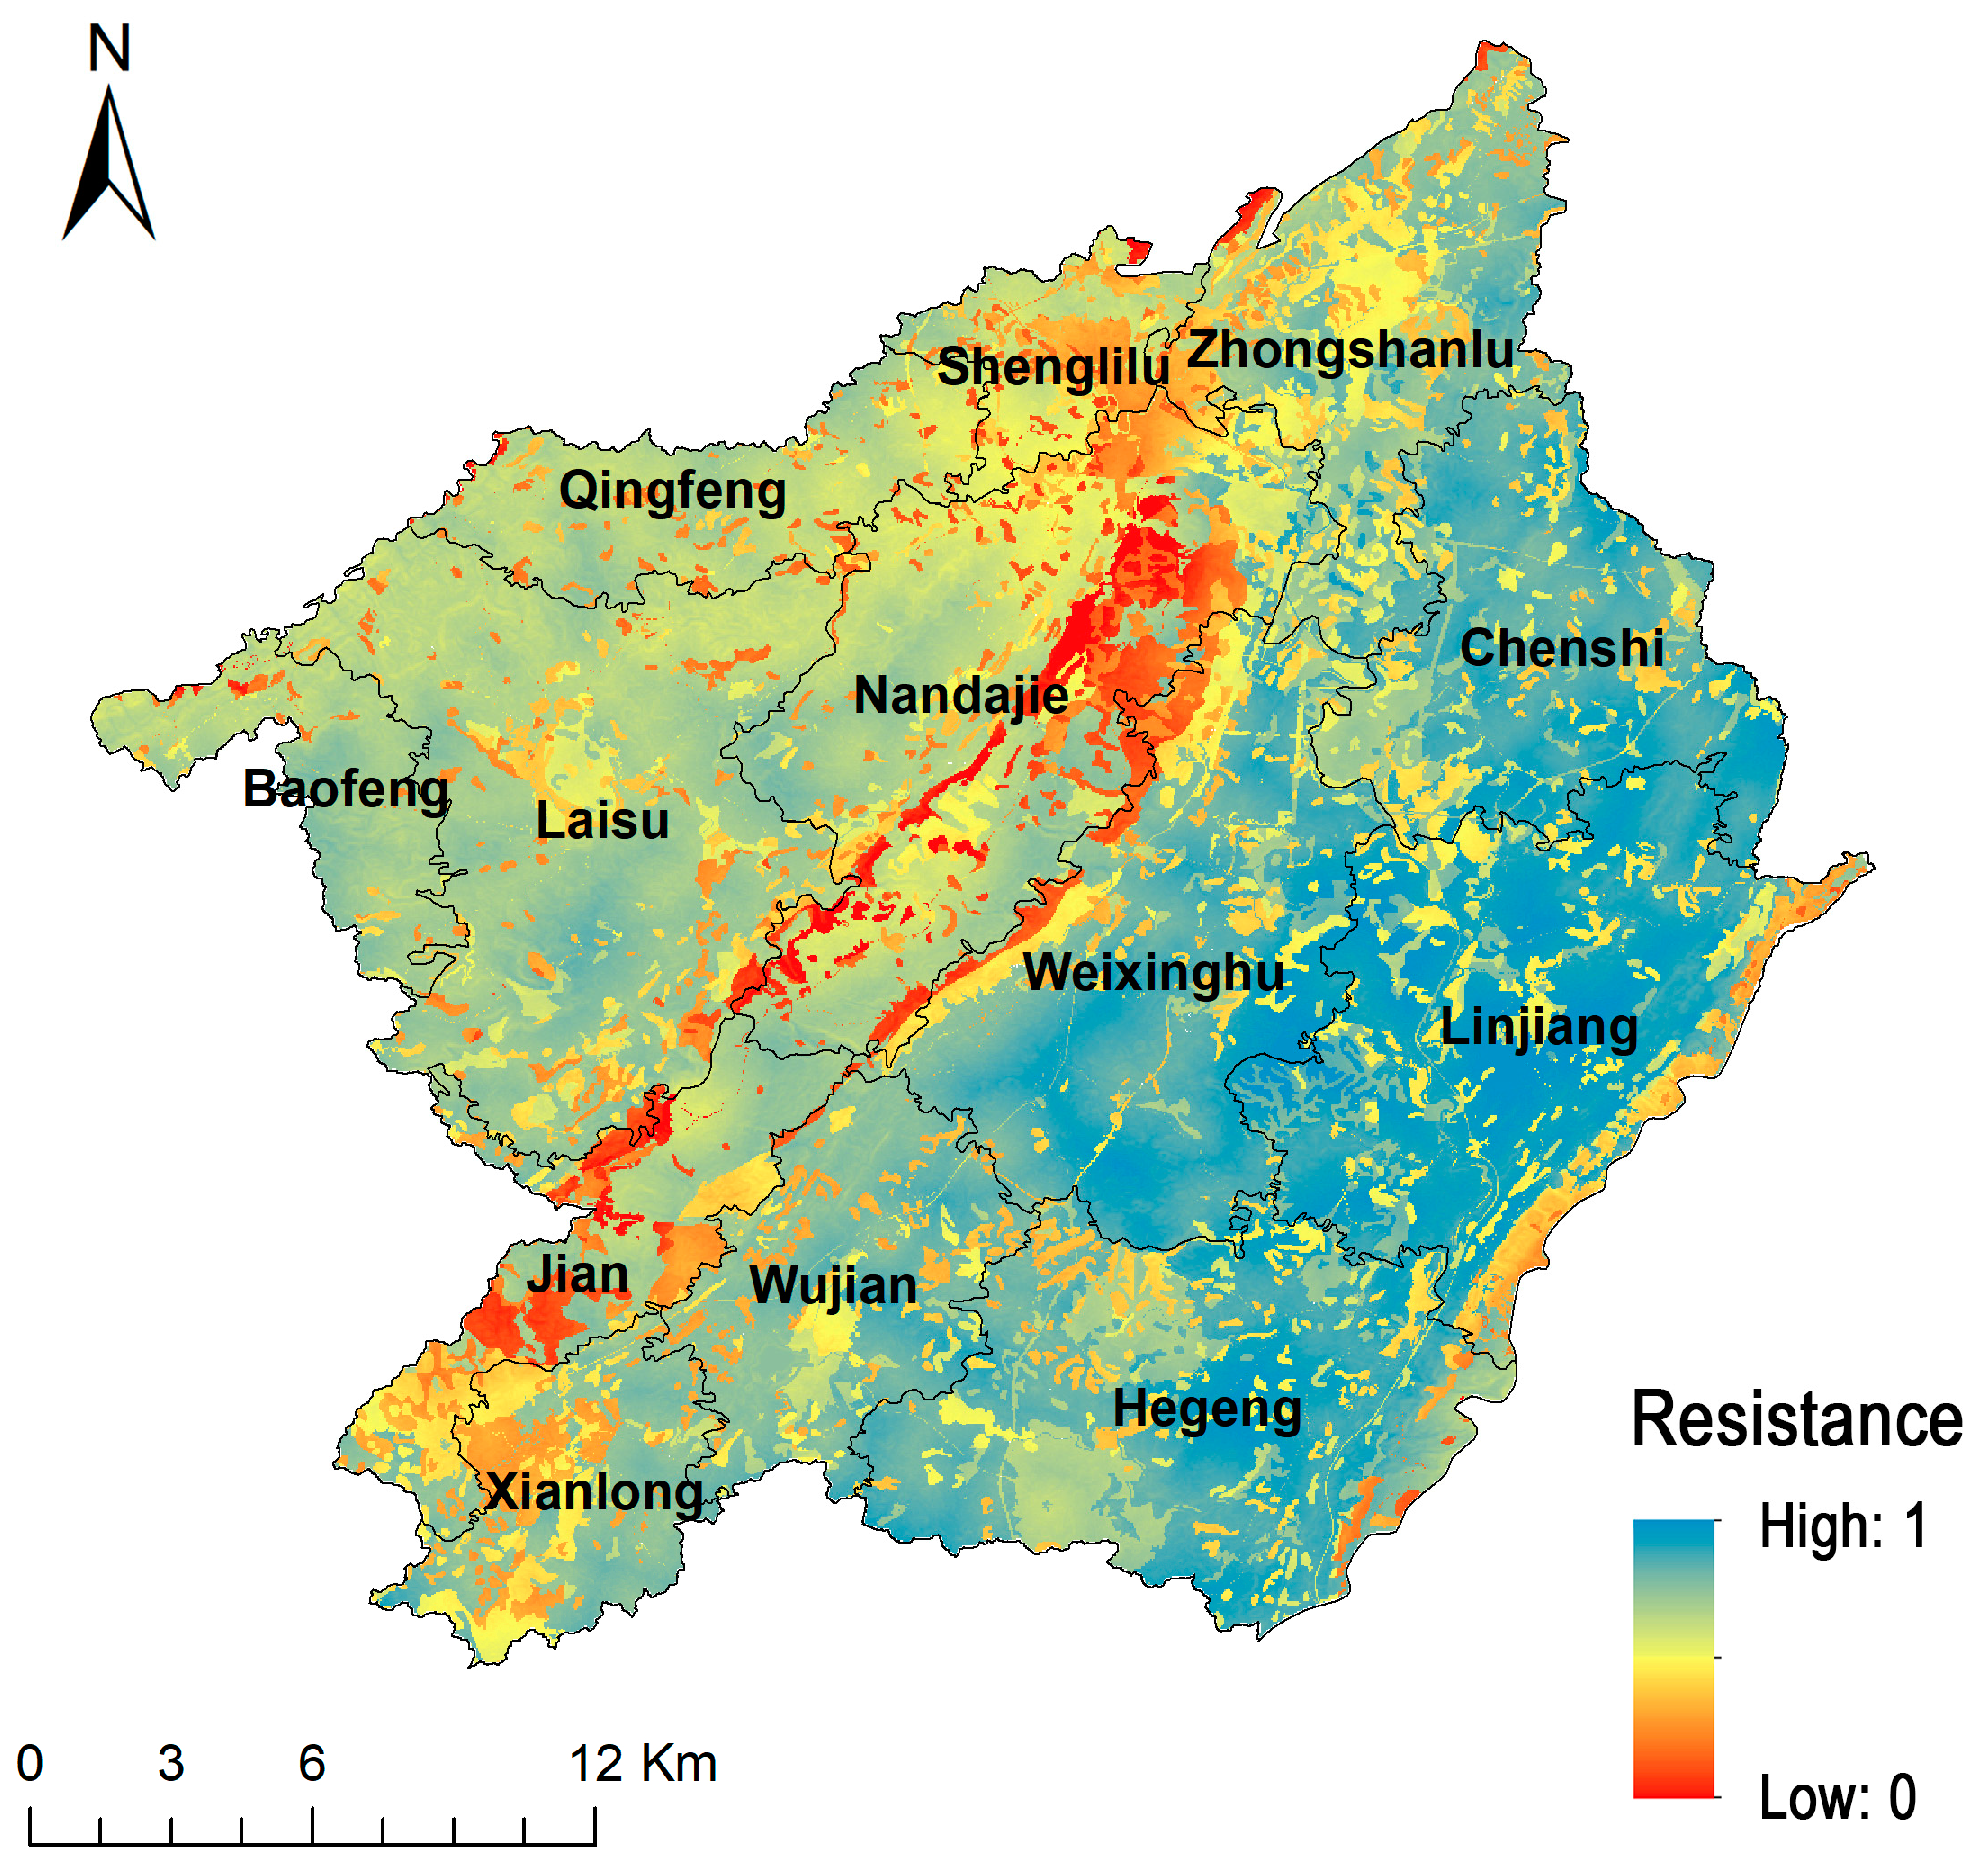
2.3.3. Determination of the Basic Resistance Surface

The capability of ANPSP expansion or attraction is related to the surrounding media [21]. The larger the resistance of the surrounding media, the less likely ANPSP is to occur. On the contrary, the lower the resistance of the surrounding media, the more likely ANPSP is to occur. The spatial heterogeneity of the land determines the different land units and their resistance surfaces [23]. ANPSP from source to sink was therefore studied by determining the resistance surfaces of the surrounding spaces. Resistance surfaces include natural geographical factors such as topography, meteorology, soil, and vegetation, among others, as well as human interference, all of which control the transport processes of ANPSP through terrestrial spaces [9,24].
Based on data availability, operability, and comprehensiveness, as well as observations of the study area, a total of seven basic resistance factors were selected: elevation, slope, rainfall erosivity, soil type, vegetation cover, distance from waters, and distance from main roads. These factors affected the spread of pollutants as well as their interception, absorption, and transformation [25]. Elevation (m) and slope (°) were used to represent physical geographic resistance factors. Generally, land with higher elevations and steeper slopes was more conducive to ANPS pollutant transport and therefore had lower resistance [26,27].
For rainfall erosivity (MJ·mm·hm−2·h−1·a−1), a modified version of the annual R-value estimation formula used in Chongqing was applied [28]. The higher the value, the lower the resistance, and the higher the risk of ANPSP:
R = 5.249 × i = 1 12 P i P P i 1.205
where R is the annual rainfall erosivity (MJ·mm·hm−2·h−1·a−1), Pi is the monthly rainfall (mm), and P is the annual rainfall (mm). The rainfall data used in the calculation were obtained from three hydrological stations in the basin in 2019. The spatial distribution of rainfall erosivity was obtained through interpolation analysis.
According to the second soil census report in Yongchuan of Sichuan Province conducted in 1982, soil type is correlated with ANPS pollutant loss. In total, 31 soil types in the Yongchuan Linjiang River basin (Figure S1) were divided into five categories based on soil fertility characteristics and environmental conditions. The values assigned were from 1 to 5, with 1 being the best and 5 the worst. The higher the value, the higher the risk of ANPSP.
Vegetation cover intercepts the transportation of pollutants to a certain extent. The higher the vegetation cover, the more significant the interception of pollutants [27]. Vegetation cover was measured using remote sensing imagery (2 May 2020) and obtained as the normalized difference vegetation index (NDVI). The image with less than 5% cloud cover was selected.
The distance relative to the waters and roads influences ANPSP in the basin [25]. The shorter the distance from the water, the more likely the pollutants will enter the water and vice versa [11]. Land closer to main roads is more conducive to surface runoff and to human interference and thereby has smaller resistance [29]. Similarly, the farther away from waters and main roads, the lower the risk of ANPSP is considered to be [27].
Because the indicators have different dimensions, they were not comparable and had to be converted to dimensionless parameters. A linear normalization method was used to convert their raw values to normalized values ranging from 0 to 1 [13]:
X * = X m i n m a x m i n
X * = m a x X m a x m i n
where Formula (3) is a direct indicator, Formula (4) is a contrary indicator, X* represents the normalized value of the deviation, max represents the maximum value of the data, and min represents the minimum value of the data. In this study, a value of 1 represents the maximum resistance to ANPSP transport through media. These resistance values are only a reflection of the relative resistance, as the purpose of resistance surface constructions is to reflect the relative spatial distributions of resistance [25].

2.3.4. Weight of the Basic Resistance Surface

The contribution of basic resistance surfaces to pollutant losses is different among basins. Standardization to each basic resistance surface is therefore required, and this can be performed by assigning a weight [30]. In this study, the spatial principal component analysis (SPCA) was used to determine the weight of each basic resistance surface. This method compressed the information of multiple raster layers into several representative composite variable layers, which circumvented the variable selection redundancies and correlations [29].
The comprehensive resistance surface was calculated according to the weighted sum of the principal component, and the ability to reuse a variance contribution rate of each principal component is related to each other. The following formula can be used to calculate the resistance surface [31]:
R i = j = 1 n ( W j × A i j )
where Ri represents the resistance value of the i-th grid unit, Wj represents the weight of the j-th factor, Aij represents the resistance value of the j-th factor in the i-th grid unit, and n represents the total number of resistance factors.

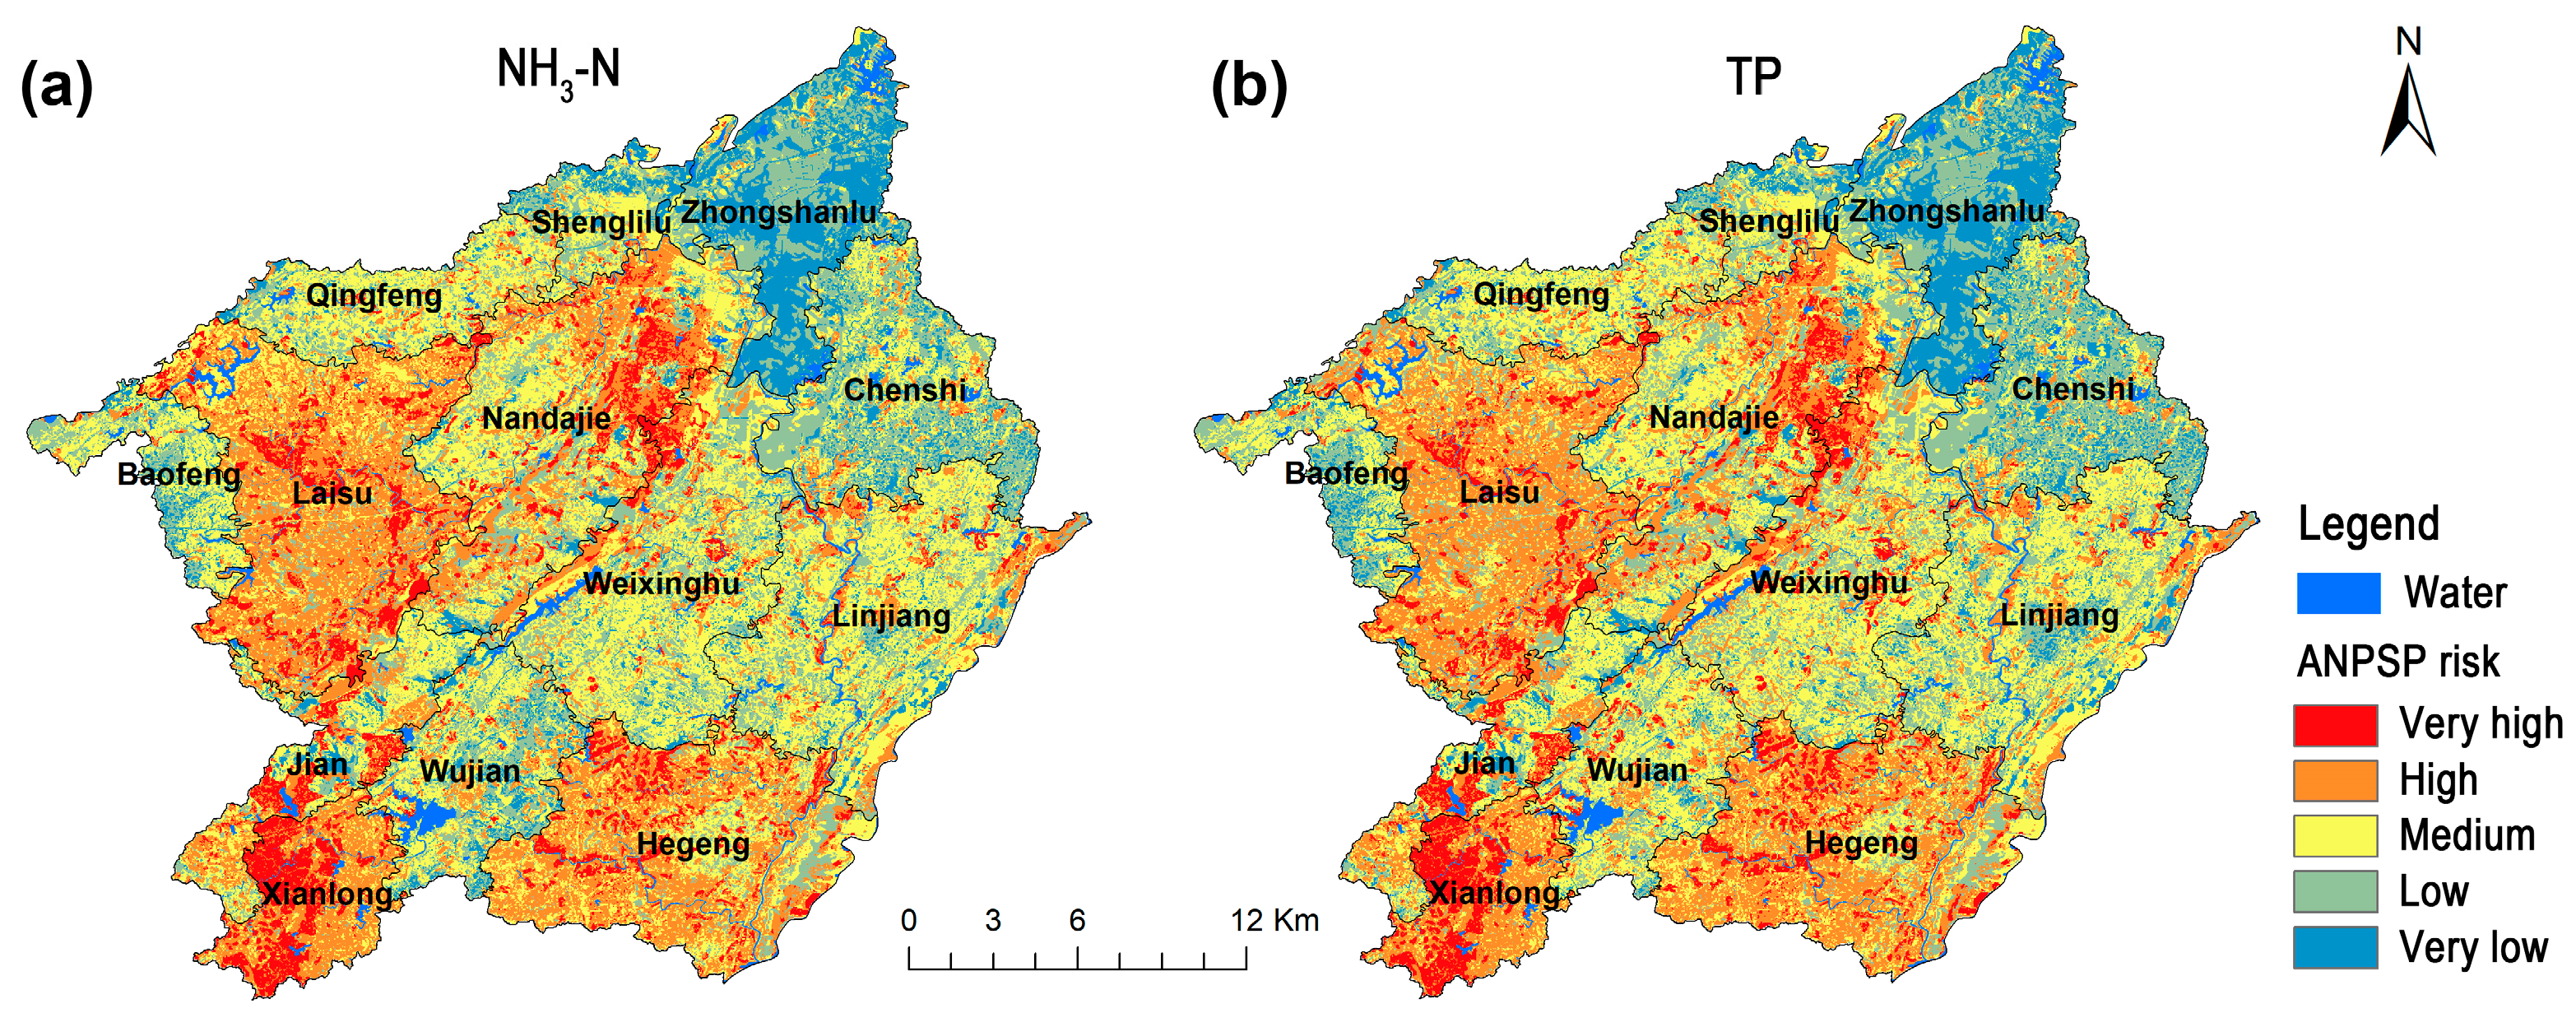
2.3.5. Spatial Risk Assessment of ANPSP

In the MCR model, the resistance surface is used as the cost grid of the source and is gradually expanded to obtain the MCR surface [32]. A MCR surface for the ANPSP risk pattern in the Linjiang River basin was thus generated. This surface reflected the spatial trend and risk patterns of ANPSP. ArcGIS 10.8 and natural breaks from the breakpoint method (Jenks) were used to classify the ANPSP risk into five levels: very high, high, medium, low, and very low [14].

3. Results

3.1. ANPSP Source Distribution

The spatial trends of NH3-N and TP NPS loads into waters (total of planting, livestock, aquaculture, and soil erosion) at the street/town scale were consistent (Figure 2a,b). Relatively higher values were identified in Hegeng, Xianlong, and Laisu, and relatively low values were identified in Zhongshanlu and Shenglilu. Land-use data calculated using ArcGIS (Figure 1) showed that paddy field and dry land dominated the main farmland types in the basin, accounting for 21.5% and 20.6%, respectively, of the total area. Orchard was the next prevalent agricultural land type (7.1%), followed by aquaculture (4.5%) and tea garden (0.2%). Water as the sink type in the basin accounted for 2.5% of the total area. Considering the regional status, and based on the ANPSP production level, values were assigned to terrestrial land-use types (Figure S2c). The smaller the value, the easier it was to generate and transport ANPSP.
The regional ANPSP load was superimposed on the land-use type source level to obtain the regional ANPSP source level (Figure 2). Generally, consistent spatial trends of NH3-N and TP source levels were observed. Relatively high levels were observed in Hegeng, Xianlong, and Laisu, followed by Weixinghu and Linjiang, and relatively low levels were observed in Zhongshanlu and Shenglilu.

3.2. Comprehensive Resistance Evaluation

In this study, resistance factors were calculated based on seven natural and social factors (Figure 3). Based on individual factors, the elevation and slope were higher in the central and southeastern parts of the basin, where the resistance values were low. The resistance value of rainfall erosivity in the western regions was relatively lower, and that of the eastern regions was higher. In most parts of the basin (67.4% of the total area), the evaluation class and the resistance values of soil type were high, whereas in other areas, especially in the yellow soil on low mountains (3.5% of the total area), the resistance values were low. The resistance of vegetation cover in the basin was moderate. The maximum resistance values for ANPSP were distributed in the urbanized areas, where no agriculture was carried out. The waters and main roads were densely arranged in the basin, and the resistance values generated by the distance elements were relatively low. The low resistance values showed a radial distribution around the waters and a striped distribution along the main roads.
The comprehensive resistance surface was calculated according to the weight of each factor (Table 1). As determined from the distribution of the comprehensive resistance values (Figure 4), relatively high resistance areas were mainly concentrated in the eastern side of the basin, including Chenshi, Weixinghu, Linjiang, and Hegeng. Moderate resistance areas were concentrated in the western side. Relatively low resistance values were observed in the central regions, including Shenglilu, Nandajie, and Jian, and they were therefore conducive to the spread of nutrients and the dispersal of ANPS pollutants, representing potential risks. The phenomenon was mainly dominated by soil type (weight = 0.373), rainfall erosivity (weight = 0.241), and mountainous terrain (elevation weight = 0.147), while vegetation cover had a weak influence (weight = 0.005) due to its relative homogeneity.

3.3. Spatial Risk Pattern Identification

Based on the MCR model, this study integrated ANPSP source identification and comprehensive resistance surface evaluation to reflect the risk of ANPSP generation and transport to the basin (Figure 5). After standardization, the spatial risk patterns were divided into five levels using the natural breakpoint method. The results showed that the areas at very high, high, medium, low, and very low risk of NH3-N pollution accounted for 8.5%, 24.9%, 34.1%, 21.3%, and 8.8%, respectively, of the study area, while that of TP accounted for 8.1%, 25.5%, 32.2%, 22.6%, and 9.2%, respectively. To ease the ANPSP operations for local administration, this study analyzed patch distribution at the street/town scale (Figure 6). Generally, Xianlong had the largest ANPSP risk among the streets/towns studied, and the area most at risk for NH3-N and TP pollution accounted for 37.6% and 38.1%, respectively. Other NH3-N risk areas were mainly distributed in Laisu (16.9%), Hegeng (13.5%), Jian (12.4%), and Nandajie (10.5%), and other TP risk areas were mainly distributed in Hegeng (14.5%), Laisu (12.2%), and Jian (11.8%). The proportion of area at very high risk accounted for >10%. The very low ANPSP risk area was mainly distributed in Zhongshanlu of the built-up area.

4. Discussion

Intensive agricultural activities affect the environment and the water quality in nearby basins [33]. One of the most significant effects occurs through ANPSP loading into water bodies. A previous study showed that even slight changes in ANPSP loading caused considerable changes to water quality in agricultural watersheds [34]. Heterogeneous spatial distributions of natural and human conditions within a basin influence ANPSP loadings. In this study, relatively higher NH3-N and TP loads were identified in Hegeng, Xianlong, and Laisu, Zhongshanlu and Shenglilu were mainly urban, with relatively small agricultural land areas, and the ANPSP loads were relatively small. Control and prevention of ANPSP should therefore be adapted to local conditions [35]. The ANPSP loads entering into the waters were closely related to the land-use types. The larger the area from which ANPSP was generated, the greater the effect on water quality. The different natural and socio-economic factors among streets/towns, such as land-use types, tillage, and management practices, and in particular, the strength of fertilizers, had a direct effect on the composition of runoff and basin water quality [36,37].
Different land-use types exhibit significantly different source strengths during the formation of ANPSP [38]. In agriculture-dominated basins, intensive land use, cultivation methods, pesticides, and fertilizers coupled with runoff have a strong effect on basin water quality [36,39]. Generally, agricultural land area accounted for a relatively large proportion in the basin, resulting in a high likelihood of ANPSP contribution. Frequent tillage activities may accelerate soil erosion, and this can also exacerbate ANPSP. Forest and grasslands provide various ecosystem services and play a critical role in the balance of regional ecosystems [40]. Generally, the more forest and grasslands in a basin, the smaller the nutrient loads in the water [41]. In this basin, however, forest and grasslands accounted for a relatively small proportion of the total area, that is, 10.5% and 0.1%, respectively. In the present study, land-use types were classified based on the ANPSP source level. In some studies, however, forest and grasslands were classified as sink landscapes [14].
The spatial risk patterns of ANPSP are not only decided by the ANPSP source but also by spatial location, topography, rainfall, soil attributes, and mutual relations with other spatial elements [14]. Differences among these factors influence runoff intensity and affect the transition and migration of N and P pollutants [42,43], as well as the biogeochemical processes occurring within the basin. In this study, the distance from water bodies reflected human disturbance, and the distance from roads reflected human activities [44]. We added the two factors to represent regional social factors. Under the influence of rainfall, the characteristics of ANPSP should be explored, which can reflect the impact on the water quality of the basin. Soil type had a strong influence (weight = 0.373) on the comprehensive resistance surface and should be considered as a priority factor in the ANPSP management of the basin. In the urbanized areas, ANPSP was low, but impervious surfaces reduced water infiltration and storage, thus negatively affecting pollutant sequestration [45].
Based on the “source-sink” theory and the MCR model, this study integrated ANPSP source and resistance factors to identify risk areas of ANPSP production and transportation into the water of the upper Yangtze River basin and analyzed spatial patterns at the street/town scale. By identifying the potential risks of ANPSP in the basin, targeted strategies could be formulated for different regions [46]. The analysis was conducted at the street/town scale, where ANPSP treatment and protection were relatively flexible and easy to manage administratively. Focus and limited resources should be prioritized for the most at-risk areas to provide maximum protection to water quality in the basin, such as Xianlong. The very low ANPSP risk area was mainly distributed in Zhongshanlu of the built-up area. Although the ANPSP risk was low, the risk from other sources such as urban NPSs may be high. This has not been considered in the present study. Spatial ANPSP risk pattern identification was useful in terms of highlighting priorities in management practices and in governance. As a result, investment can be improved and pollution control made easier to implement. The objective of governance can thereby be easily achieved [11].
ANPSP risk assessment plays a crucial role in aquatic environmental protection. Optimizing the spatial risk can improve the basin water quality and promote regional ecosystem stability and sustainable development. To achieve high level conservation with minimum costs, priority restoration areas should be based on the location and land-use status [45]. Based on the identified high-risk areas, the entire control process of ANPSP from the source to the water body should be strengthened from multiple angles such as monitoring, management, and governance. For example, in Xianlong, ANPSP control and protection should be prioritized to conserve its ecological environment and stability. For regional ANPSP control, a plan of governance for risk areas should be proposed based on the combination of ANPSP generation and transportation statuses in different regions [47]. In areas dominated by planting, the relationship between fertilization and fertilizer use rate should be balanced. Substituting fertilizers at the source with green production and implementing ecological interception projects for ANPS pollutants around the water network should be carried out. Efficient natural materials should be utilized to enhance soil–plant productivity and to sustainably reduce pollutants [48]. Agricultural production practices, like precision farming, could help to lower the input of energy, water, organic matter, and agro-chemicals [49]. Based on terrain characteristics, multi-level reuse of nutrient treatments could be implemented. In areas dominated by livestock and aquaculture, drainage management should be carried out. Recycling methods that combine planting and breeding could also be implemented. Ecological engineering measures such as vegetation crop isolation and buffer zones should be applied to reduce the pollution caused by soil erosion [35]. Furthermore, regional environmental legislation and law enforcement should be formulated to meet the requirements of ecological protection and economic development [50]. In this study, collected data were primarily used. Data from additional monitoring and investigation need to be integrated into the identification of ANPSP risk patterns in future studies.

5. Conclusions

Combined with the regional ANPSP load and the land-use type at the source level, NH3-N and TP showed consistent spatial trends, with Hegeng, Xianlong, and Laisu having a relatively high ANPSP source level compared to other streets/towns. For these streets/towns, source control should therefore be the focus. The comprehensive resistance surfaces of ANPSP entering waters were defined by seven critical factors, and the values of the comprehensive resistance surface in the central part of the basin, including Shenglilu, Nandajie, and Jian, were small. For these streets/towns, preventing pollutant transportation should therefore be the focus. On the whole, for Xianlong, which showed a relatively high percentage of ANPSP risk and occupied a large area among the streets/towns, the NH3-N and TP risk area accounted for 37.6% and 38.1%, respectively. The analysis at the street/town scale suggested differences in the implementability and allocation of responsibilities for ANPSP control among different administrative areas. Studying regional ANPSP risk patterns is an extremely vital prerequisite for safeguarding the structure and functional capacity of ecosystems and guaranteeing sustainable regional development.

Supplementary Materials

The following supporting information can be downloaded at: https://www.mdpi.com/article/10.3390/agronomy13112776/s1, Table S1: ANPSP load entering into the waters of Yongchuan Linjiang River basin in 2019 (t/a); Figure S1: Spatial distribution of soil types in Yongchuan Linjiang River basin; Figure S2: Spatial patterns (normalized values) of the regional ANPSP load and land use type level: (a) NH3-N load entering into waters; (b) TP load entering into waters; (c) land-use type level.

Author Contributions

Conceptualization, funding acquisition, project administration, resources, and supervision: J.W. and F.L.; methodology and investigation: J.W., Z.F. and H.Q.; data curation, visualization, and writing—original draft: J.W.; formal analysis: J.W. and Y.B.; writing—review and editing: J.W. and F.L. All authors have read and agreed to the published version of the manuscript.

Funding

This research was financially supported by the National Key R&D Program of China (grant number 2021YFC3201502), the National Natural Science Foundation of China (NSFC) (grant number 41807397), and the Shanghai Rising-Star Program, China (grant number 19QC1400700).

Data Availability Statement

The data presented in this study are available upon request from the corresponding author.

Conflicts of Interest

The authors declare no conflict of interest.

References

  1. Teshager, A.D.; Gassman, P.W.; Secchi, S.; Schoof, J.T. Simulation of targeted pollutant-mitigation-strategies to reduce nitrate and sediment hotspots in agricultural watershed. Sci. Total Environ. 2017, 607–608, 1188–1200. [Google Scholar] [CrossRef] [PubMed]
  2. Volk, M.; Liersch, S.; Schmidt, G. Towards the implementation of the European Water Framework Directive? Lessons learned from water quality simulations in an agricultural watershed. Land Use Policy 2009, 26, 580–588. [Google Scholar] [CrossRef]
  3. Edwin, D.O.; Zhang, X.; Yu, T. Current status of agricultural and rural non-point source pollution assessment in China. Environ. Pollut. 2010, 158, 1159–1168. [Google Scholar] [CrossRef]
  4. Zou, L.; Liu, Y.; Wang, Y.; Hu, X. Assessment and analysis of agricultural non-point source pollution loads in China: 1978–2017. J. Environ. Manag. 2020, 263, 110400. [Google Scholar] [CrossRef] [PubMed]
  5. Falconer, L.; Telfer, T.C.; Ross, L.G. Modelling seasonal nutrient inputs from non-point sources across large catchments of importance to aquaculture. Aquaculture 2018, 495, 682–692. [Google Scholar] [CrossRef]
  6. Liao, Y.; Zhao, H.; Jiang, Z.; Li, J.; Li, X. Identifying the risk of urban nonpoint source pollution using an index model based on impervious-pervious spatial pattern. J. Clean. Prod. 2021, 288, 125619. [Google Scholar] [CrossRef]
  7. Zhu, K.W.; Chen, Y.C.; Zhang, S.; Yang, Z.M.; Huang, L.; Li, L.; Lei, B.; Zhou, Z.B.; Xiong, H.L.; Li, X.X.; et al. Output risk evolution analysis of agricultural non-point source pollution under different scenarios based on multi-model. Glob. Ecol. Conserv. 2020, 23, e01144. [Google Scholar] [CrossRef]
  8. Saranya, M.S.; Vinish, V.N. A comparative evaluation of streamflow prediction using the SWAT and NNAR models in the Meenachil River Basin of Central Kerala, India. Water Sci. Technol. 2023, 88, 2002–2018. [Google Scholar] [CrossRef]
  9. Huang, C.; Hou, X.; Li, H. An improved minimum cumulative resistance model for risk assessment of agricultural non-point source pollution in the coastal zone. Environ. Pollut. 2022, 312, 120036. [Google Scholar] [CrossRef]
  10. Wang, Y.; Liu, G.; Zhao, Z.; Wu, C.; Yu, B. Using soil erosion to locate nonpoint source pollution risks in coastal zones: A case study in the Yellow River Delta, China. Environ. Pollut. 2021, 283, 117117. [Google Scholar] [CrossRef]
  11. Jiang, M.; Chen, H.; Chen, Q. A method to analyze “source-sink” structure of non-point source pollution based on remote sensing technology. Environ. Pollut. 2013, 182, 135–140. [Google Scholar] [CrossRef]
  12. Wang, R.; Wang, Y.; Sun, S.; Cai, C.; Zhang, J. Discussing on “source-sink” landscape theory and phytoremediation for non-point source pollution control in China. Environ. Sci. Pollut. Res. 2020, 27, 44797–44806. [Google Scholar] [CrossRef] [PubMed]
  13. Dong, Q.; Wu, L.; Cai, J.; Li, D.; Chen, Q. Construction of ecological and recreation patterns in rural landscape space: A case study of the Dujiangyan Irrigation District in Chengdu, China. Land 2022, 11, 383. [Google Scholar] [CrossRef]
  14. Zhu, K.; Cheng, Y.; Zhang, S.; Yang, Z.; Huang, L.; Lei, B.; Li, L.; Zhou, Z.; Xiong, H.; Li, X. Identification and prevention of agricultural non-point source pollution risk based on the minimum cumulative resistance model. Glob. Ecol. Conserv. 2020, 23, e01149. [Google Scholar] [CrossRef]
  15. Wang, J.; Huo, A.; Hu, A.; Zhang, X.; Wu, Y. Simulation for non-point source pollution based on QUAL2E in the Jinghe River, Shaanxi Province, China. Water Technol. Sci. 2017, 8, 117–126. (In Spanish) [Google Scholar] [CrossRef]
  16. Li, B.; Chen, N.; Wang, W.; Wang, C.; Schmitt, R.J.P.; Lin, A.; Daily, G.C. Eco-environmental impacts of dams in the Yangtze River basin, China. Sci. Total Environ. 2021, 774, 145743. [Google Scholar] [CrossRef]
  17. Luo, G.; Bu, F.; Xu, X.; Gao, J.; Shu, W. Seasonal variations of dissolved inorganic nutrients transported to the Linjiang Bay of the Three Gorges Reservoir, China. Environ. Monit. Assess. 2011, 173, 55–64. [Google Scholar] [CrossRef]
  18. Jurado, J.M.; Lopez, A.; Padua, L.; Sousa, J.J. Remote sensing image fusion on 3D scenarios: A review of applications for agriculture and forestry. Int. J. Appl. Earth Obs. Geoinf. 2022, 112, 102856. [Google Scholar] [CrossRef]
  19. Knaapen, J.P.; Scheffer, M.; Harms, B. Estimating habitat isolation in landscape planning. Landsc. Urban Plan. 1992, 23, 1–16. [Google Scholar] [CrossRef]
  20. Yu, K.J. Landscape ecological security patterns in biological conservation. Acta Ecol. Sin. 1999, 1, 8–15. [Google Scholar]
  21. Ye, Y.; Su, Y.; Zhang, H.; Liu, K.; Wu, Q. Construction of an ecological resistance surface model and its application in urban expansion simulations. J. Geogr. Sci. 2015, 25, 211–224. [Google Scholar] [CrossRef]
  22. Hou, C.; Chu, M.L.; Botero-Acosta, A.; Guzman, J.A. Modeling field scale nitrogen non-point source pollution (NPS) fate and transport: Influences from land management practices and climate. Sci. Total Environ. 2021, 759, 143502. [Google Scholar] [CrossRef] [PubMed]
  23. Li, F.; Ye, Y.; Song, B.; Wang, R. Evaluation of urban suitable ecological land based on the minimum cumulative resistance model: A case study from Changzhou, China. Ecol. Model. 2015, 318, 194–203. [Google Scholar] [CrossRef]
  24. Wang, Y.; Liu, G.; Zhao, Z. Spatial heterogeneity of soil fertility in coastal zones: A case study of the Yellow River Delta, China. J. Soils Sediments 2021, 21, 1826–1839. [Google Scholar] [CrossRef]
  25. Zhang, X.; Cui, J.; Liu, Y.; Wang, L. Geo-cognitive computing method for identifying “source-sink” landscape patterns of river basin non-point source pollution. Int. J. Agric. Biol. Eng. 2017, 5, 55–68. [Google Scholar]
  26. Kairis, P.A.; Rybczyk, J.M. Sea level rise and eelgrass (Zostera marina) production: A spatially explicit relative elevation model for Padilla Bay, WA. Ecol. Model. 2010, 221, 1005–1016. [Google Scholar] [CrossRef]
  27. Zhu, K.; Chen, Y.; Zhang, S.; Lei, B.; Yang, Z.; Huang, L. Vegetation of the water-level fluctuation zone in the Three Gorges Reservoir at the initial impoundment stage. Glob. Ecol. Conserv. 2020, 21, e00866. [Google Scholar] [CrossRef]
  28. Shi, D.; Jiang, D.; Lu, X.; Jiang, G. Temporal distribution characteristics of rainfall erosivity in Fuling District, Chongqing. Trans. CSAE 2008, 24, 16–21. (In Chinese) [Google Scholar]
  29. Dai, L.; Liu, Y.; Luo, X. Integrating the MCR and DOI models to construct an ecological security network for the urban agglomeration around Poyang Lake, China. Sci. Total Environ. 2021, 754, 141868. [Google Scholar] [CrossRef]
  30. Wang, S.; He, Q.; Ai, H.; Wang, Z.; Zhang, Q. Pollutant concentrations and pollution loads in stormwater runoff from different land uses in Chongqing. J. Environ. Sci. 2013, 25, 502–510. [Google Scholar] [CrossRef]
  31. Wu, Z.; Lei, S.; Yan, Q.; Bian, Z.; Lu, Q. Landscape ecological network construction controlling surface coal mining effect on landscape ecology: A case study of a mining city in semi-arid steppe. Ecol. Indic. 2021, 133, 108403. [Google Scholar] [CrossRef]
  32. Kang, J.; Zhang, X.; Zhu, X.; Zhang, B. Ecological security pattern: A new idea for balancing regional development and ecological protection. A case study of the Jiaodong Peninsula, China. Glob. Ecol. Conserv. 2021, 26, e01472. [Google Scholar] [CrossRef]
  33. Hosono, T.; Nakano, T.; Igeta, A.; Tayasu, I.; Tanaka, T.; Yachi, S. Impact of fertilizer on a small watershed of Lake Biwa: Use of sulfur and strontium isotopes in environmental diagnosis. Sci. Total Environ. 2007, 384, 342–354. [Google Scholar] [CrossRef] [PubMed]
  34. Tesoriero, A.J.; Duff, J.H.; Wolock, D.M.; Spahr, N.E.; Almendinger, J.E. Identifying pathways and processes affecting nitrate and orthophosphate inputs to streams in agricultural watersheds. J. Environ. Qual. 2009, 38, 1892–1900. [Google Scholar] [CrossRef] [PubMed]
  35. Zuo, D.; Bi, Y.; Song, Y.; Xu, Z.; Wang, G.; Ma, G.; Abbaspour, K.C.; Yang, H. The response of non-point source pollution to land use change and risk assessment based on model simulation and grey water footprint theory in an agricultural river basin of Yangtze River, China. Ecol. Indic. 2023, 154, 110581. [Google Scholar] [CrossRef]
  36. Anderson, T.A.; Salice, C.J.; Erickson, R.A.; McMurry, S.T.; Cox, S.B.; Smith, L.M. Effects of landuse and precipitation on pesticides and water quality in playa lakes of the southern high plains. Chemosphere 2013, 92, 84–90. [Google Scholar] [CrossRef]
  37. Dai, X.; Zhou, Y.; Ma, W.; Zhou, L. Influence of spatial variation in land use patterns and topography on water quality of the rivers inflowing to Fuxian Lake, a large deep lake in the plateau of southwestern China. Ecol. Eng. 2017, 99, 417–428. [Google Scholar] [CrossRef]
  38. Wang, J.; Ni, J.; Chen, C.; Xie, D.; Shao, J.; Chem, F.; Lei, P. Source-sink landscape spatial characteristics and effect on non-point source pollution in a small catchment of the Three Gorge Reservoir Region. J. Mt. Sci. 2018, 15, 327–339. [Google Scholar] [CrossRef]
  39. Karmakar, S.; Haque, S.M.S.; Hossain, M.M.; Sen, M.; Hoque, M.E. Water quality parameter as a predictor of small watershed land cover. Ecol. Indic. 2019, 106, 105462. [Google Scholar] [CrossRef]
  40. Sun, X.; Li, F. Spatiotemporal assessment and trade-offs of multiple ecosystem services based on land use changes in Zengcheng, China. Sci. Total Environ. 2017, 609, 1569–1581. [Google Scholar] [CrossRef]
  41. Kibena, J.; Nhapi, I.; Gumindoga, W. Assessing the relationship between water quality parameters and changes in landuse patterns in the Upper Manyame River, Zimbabwe. Phys. Chem. Earth Parts A/B/C 2014, 67–69, 153–163. [Google Scholar] [CrossRef]
  42. Gergel, S.E.; Turner, M.G.; Miller, J.R.; Melack, J.M.; Stanley, E.H. Landscape indicators of human impacts to riverine systems. Aquat. Sci. 2002, 64, 118–128. [Google Scholar] [CrossRef]
  43. Pärn, J.; Pinay, G.; Mander, Ü. Indicators of nutrients transport from agricultural catchments under temperate climate: A review. Ecol. Indic. 2012, 22, 4–15. [Google Scholar] [CrossRef]
  44. Gao, Y.; Liu, Y.; Qian, J.; Guo, Y.; Hu, Y. Improving ecological security pattern based on the integrated observation of multiple source data: A case study of Wannian County, Jiangxi Province. Resour. Sci. 2020, 40, 2010–2021. (In Chinese) [Google Scholar] [CrossRef]
  45. Li, Q.; Zhou, Y.; Yi, S. An integrated approach to constructing ecological security patterns and identifying ecological restoration and protection areas: A case study of Jingmen, China. Ecol. Indic. 2022, 137, 108723. [Google Scholar] [CrossRef]
  46. Nie, W.; Shi, Y.; Siaw, M.J.; Yang, F.; Wu, R.; Wu, X.; Zheng, X.; Bao, Z. Constructing and optimizing ecological network at county and town scale: The case of Anji County, China. Ecol. Indic. 2021, 132, 108294. [Google Scholar] [CrossRef]
  47. Zhang, Z.; Jin, G.; Tang, H.; Zhang, S.; Zhu, D.; Xu, J. How does the three gorges dam affect the spatial and temporal variation of water levels in the Poyang Lake? J. Hydrol. 2022, 605, 127356. [Google Scholar] [CrossRef]
  48. Rashad, M.; Hafez, M.; Popov, A.I.; Gaber, H. Toward sustainable agriculture using extracts of natural materials for transferring organic wastes to environmental-friendly ameliorants in Egypt. Int. J. Environ. Sci. Technol. 2023, 20, 7417–7432. [Google Scholar] [CrossRef]
  49. Hafez, M.; Popov, A.I.; Rashad, M. The biological correction using humic substances, vermicompost, and Azospirillum as an optimum way of optimizing plant production and enhancing soil micronutrients in arid regions. Open Agric. J. 2022, 16, e187433152204180. [Google Scholar] [CrossRef]
  50. De Paula, F.R.; Gerhard, P.; de Barros Ferraz, F.S.; Wenger, S.J. Multi-scale assessment of forest cover in an agricultural landscape of Southeastern Brazil: Implications for management and conservation of stream habitat and water quality. Ecol. Indic. 2018, 85, 1181–1191. [Google Scholar] [CrossRef]
Figure 1. Location of the study area and land-use types in 2019.
Agronomy 13 02776 g001
Figure 2. Spatial patterns (normalized values) of regional ANPSP source levels: (a) NH3-N; (b) TP.
Agronomy 13 02776 g002
Figure 3. Spatial patterns of normalized resistance factors of the Linjiang River basin in Yongchuan: (a) elevation; (b) slope; (c) rainfall erosivity; (d) soil type; (e) vegetation cover; (f) distance from waters; (g) distance from main roads.
Agronomy 13 02776 g003
Figure 4. Spatial patterns of normalized comprehensive resistance surface.
Agronomy 13 02776 g004
Figure 5. Spatial risk patterns of ANPSP generated and transported to the water in the basin: (a) NH3-N; (b) TP.
Agronomy 13 02776 g005
Figure 6. The proportion of ANPSP risk areas in different streets/towns.
Agronomy 13 02776 g006
Table 1. Weight of each basic resistance surface.
FactorElevationSlopeRainfall ErosivitySoil TypeVegetation CoverDistance from WaterDistance from Main Road
Weight0.1470.0820.2410.3730.0050.1290.022
Disclaimer/Publisher’s Note: The statements, opinions and data contained in all publications are solely those of the individual author(s) and contributor(s) and not of MDPI and/or the editor(s). MDPI and/or the editor(s) disclaim responsibility for any injury to people or property resulting from any ideas, methods, instructions or products referred to in the content.

