Article

Using Partial Least Squares and Regression to Interpret Temperature and Precipitation Effects on Maize and Soybean Genetic Variance Expression

1
Poultry Production and Product Safety Research Unit, USDA-ARS, Fayetteville, AR 72701, USA
2
Plant Science Department, University of Tennessee, Knoxville, TN 37916, USA
3
Animal Science Department, University of Tennessee, Knoxville, TN 37916, USA
*
Author to whom correspondence should be addressed.
Agronomy 2023, 13(11), 2752; https://doi.org/10.3390/agronomy13112752
Submission received: 31 August 2023 / Revised: 27 October 2023 / Accepted: 29 October 2023 / Published: 31 October 2023
(This article belongs to the Section Crop Breeding and Genetics)

Abstract

:
Partial least squares (PLS) is a statistical technique that can evaluate the association of large numbers of external environmental variables with biological responses. PLS is a good method for analyzing the relative importance of variables and compressing the data for regression analyses. The objective of this study was to use PLS and regression analyses on soybean (Glycine max L.) and maize (Zea mays L.) variety trial results for five (soybean) or three (maize) maturity group (MG) tests, at five Tennessee locations spanning 14 years, in order to determine the environmental effects (weekly minimum and maximum air temperature and precipitation) on the expression of yield genetic variance (Vg). Overall, PLS excelled at identifying combinations of weather variables to develop models with high R2 values (41–59%) relative to the regression analysis (R2 = 34–44%), but they did not address the effects of specific variables as in regression analysis. In both maize and soybean, differences in genetic variance occurred among MG tests and locations. Overall, precipitation was the driving variable for maize Vg, indicating maize is more sensitive to rain events during the growing season than soybean, i.e., with each cm of precipitation, maize Vg increased by 11.38–23.78 (Mg ha−1)2. The results suggest that ensuring adequate water, particularly during weeks 3 and 6, is critical for maize Vg, regardless of the MG test and location. Genetically modified soybean cultivars responded similarly to conventional cultivars, suggesting no Vg response differences due to the glyphosate tolerance trait. These results have important implications for irrigation timing for the maximum expression of genetic differences in maize and soybean cultivars, particularly for management planning during future stochastic weather events.

1. Introduction

The magnitude of Vg for yield is a strong indicator of how the relative genetic potential for yield is being expressed for the cultivars being evaluated in the same test in different locations. Variety trials and breeding line tests for yield require multi-environment trials (METs; i.e., location–year combinations) to obtain reliable estimates and rankings of the yield performance of different genotypes across a targeted production region [1]. Varieties grown in MET trials may respond differently to environmental fluctuations, known as genotype × environment interactions (G × E). This interaction has been evaluated via analysis of variance, environmental mean model regression [2,3], additive main effects and multiplicative interaction (AMMI) models [4], and partial least squares (PLS) regression [5,6]. Models such as AMMI, however, use only phenotypic response variables; however, environmental (or genotypic) variables can be regressed and superimposed on AMMI biplots. A study by Vargas et al. (1998) [7] compared PLS, factorial regression, and AMMI based on the environmental and cultivar variables of wheat (Triticum turgidum (L.) var. durum) and found that PLS and factorial regression complement each other and that AMMI and PLS biplots offered similar interpretations of the G × E interaction [7]. However, PLS has the added benefit of testing hypotheses about the influence of external variables (e.g., minimum and maximum air temperature and precipitation) on G × E, considering the statistical difficulties with regression models when many correlated explanatory variables are used (multi-collinearity issues) [8].
The main considerations for yield trial environment selection are the ability to discriminate among genotypes (e.g., enhancing genetic variance (Vg) among cultivars, minimize redundancy, and generating a G × E interaction representative of the targeted market region and optimize production). In previous studies by Ashworth et al. (2020a, 2020b) soybean (Glycine max L.) and maize (Zea mays L.) variety trial results of five and three relative maturity groups (MG), respectively, were used to compare test location uniqueness and/or redundancy via Vg estimates and cluster analysis [9,10]. In both crop evaluations, years and locations affected the magnitude of Vg, with years largely driving genetic expression within MGs in these environments. However, late MGs consistently had the greatest variance estimates. The authors suggested location-induced effects were likely due to different MGs experiencing soil moisture and temperature (day and nighttime) at varying maturity stages. However, specific G × E responses were not quantified. These evaluations also identified that two of the locations were duplicative for soybean and none were duplicative for maize, and that such analyses are worthwhile for comparing yield trial locations for their discriminating ability and representativeness [9,10].
When information on environmental variables such as meteorological data are available, these variables can be regressed via PLS to identify G × E interactions for crop varieties and maturity groups. Vargas et al. (1999) [8] applied PLS regression for determining the most relevant wheat cultivar and environmental variables that explained grain yield and G × E, and found that the relative performance of cultivars was influenced by differential sensitivity to minimum temperatures during peak growth periods. These authors determined that PLS analysis was effective at explaining environmental and cultivar variables associated with G × E. However, limited information exists for predicting the expression of Vg based on environmental predictors among cultivars for different soybean and maize MGs. Such an identification of environmental predictors will help inform the selection or prioritization of locations for conducting yield trials. Therefore, the objective of this paper is to determine the effects of minimum and maximum air temperature and precipitation over the growing season on Vg for different MG tests of soybean and maize. Soybean is a cool season species with a C3 photosynthetic pathway, whereas maize is a warm-season species with a C4 photosynthesis pathway and a higher temperature optimum range requirement [11]. We, therefore, hypothesize that by combining PLS and regression analysis, information could be gained on how the daily minimum and maximum temperatures and precipitation throughout the growing season, individually and collectively, influence the observed genetic variance for soybean and maize yield.

2. Materials and Methods

2.1. Data Sources

Ashworth et al. (2020a) [9] estimated genetic variance (Vg) for individual soybean yield trials for five MGs at five locations in Tennessee for 14 years (2002–2015). Cultivars in all of the MG tests were tolerant to glyphosate, except ‘Conventional 5’. The five locations were the Research and Education Center at Milan (RECM-IR irrigated, RECM-NIR non-irrigated, 35.54° N, 88.44° E; Major Land Resource Area (MLRA) 134, classified as the Southern Mississippi Valley Loess, East Gulf Coastal Plain in LRR ‘P’); the Research and Education Center at Ames (AMES; 35.05° N, −89.18° E, same MLRA as RECM); the East Tennessee Research and Education Center (ETREC; 35.53° N, −83.57° W; Central Farming and Forest Region LRR “N”), Knoxville; and the Highland Rim Research and Education Center (HRREC; 35.5° N, −87.3° W, same MLRA as ETREC). Data included in this study were derived from the University of Tennessee, Institute of Agriculture, official Variety Trials (https://search.utcrops.com/, accessed 13 October 2019). The five different variety trials included in this study were separated by relative MG tests: 4 early (4E, 4.0–4.5 MG), 4 late (4L, 4.6–4.9 MG), 5 early (5E, 5.0–5.5 MG), and 5 late (5L, 5.6–5.9 MG), as well as herbicide tolerance (i.e., RR, glyphosate-tolerant; CV5, susceptible). The five MG tests will hereafter be referred to as RR4E, RR4L, RR5E, RR5L, and CV5. The CV5 test consisted of cultivars of MG 4E through 5L, but 5E and 5L made up the largest portion. The number of entries in each test each year were as follows: 27–50 (RR4E), 40–84 (RR4L), 34–67 (RR5E), 11–79 (RR5L), and 13–36 (CV5).
Following Ashworth et al. (2020b) [10], estimates of Vg for individual maize yield trials for three MGs (early, medium, and late) at the same five locations for the same 14 years were calculated. Briefly, three different variety trials were included in this study for maize and were separated by relative MG tests (early < 114 d after planting (DAP); medium = 114–116 DAP; late > 116 DAP). The number of entries in each test each year were as follows: 30–54 (early MG), 38–55 (medium MG), and 17–25 (late MG).
For the maize and soybean studies above, ~50% of the entries in each of the MGs for soybeans and maize were repeated and ~50% were new entries between successive years. The entries within a test (within a year) were the same at all locations. Each year, the planting dates for soybean tests generally occurred mid to late May, and mid to late April for maize. The five MG tests for soybeans and the three MG tests for maize at the five locations over 14 years (2002–2015) were each analyzed with mixed models (SAS 9.4, SAS Institute, Inc., Cary, NC, USA) with random replications, incomplete blocks, and random cultivars to estimate restricted maximum likelihood Vg [9,10]. The genetic variance estimates obtained in the two above studies were utilized in the study reported herein.
Daily minimum and maximum temperatures and precipitation for the months of March through September at each location for each of the years (2002–2015) were obtained via the National Oceanic and Atmospheric Administration (NOAA) (https://www.ncdc.noaa.gov/cdo-web/, (accessed on 20 January 2019) for each of the five locations mentioned above and have been made available in detail [9]. These three weather variables along with the Vg estimates formed the dataset for the PLS and regression analyses.

2.2. Statistical Methods

For each MG, a preliminary PLS analysis (SAS 9.4) was conducted using cross-validation on randomly chosen training data to determine the number of factors to retain. The PRESS statistic suggested 0 to 4 factors were sufficient, while the Van der Voet (1994) model comparison test showed that 4 to 8 factors would lead to over-fitting [12]. Therefore, 2 factors were retained as a simplifying compromise. Further preliminary PLS analyses were run using daily, weekly, and monthly summaries of the three weather variables (minimum and maximum air temperature and precipitation). Daily values were too variable to produce meaningful models, and monthly means over-summarized the variation, again producing poorly fitting models.
The final two-factor PLS analysis was then run on each MG, using weather variables from the first 16 weeks post planting (thus 48 explanatory variables) each year, as these were available for all MGs and locations. The results included R-squared measures of model fit and various graphical assessments of variable importance. To complement the PLS results, regression analyses were conducted, allowing specific weather variables to be examined (not the principal component factors of PLS) and quantify the influence on Vg with regression slopes. Furthermore, the regression model included both location and MG factors, allowing for specific testing of the consistency of weekly weather influence per year across these factors by testing for interactions. Weather variables were chosen using all-possible-regression model selection, added to an indicator variable linear model which included weather regressions, location, and MG test factors, as well as all possible two-way interaction terms, and this model was simplified by backwards elimination of unimportant (p > 0.05) terms.

3. Results and Discussion

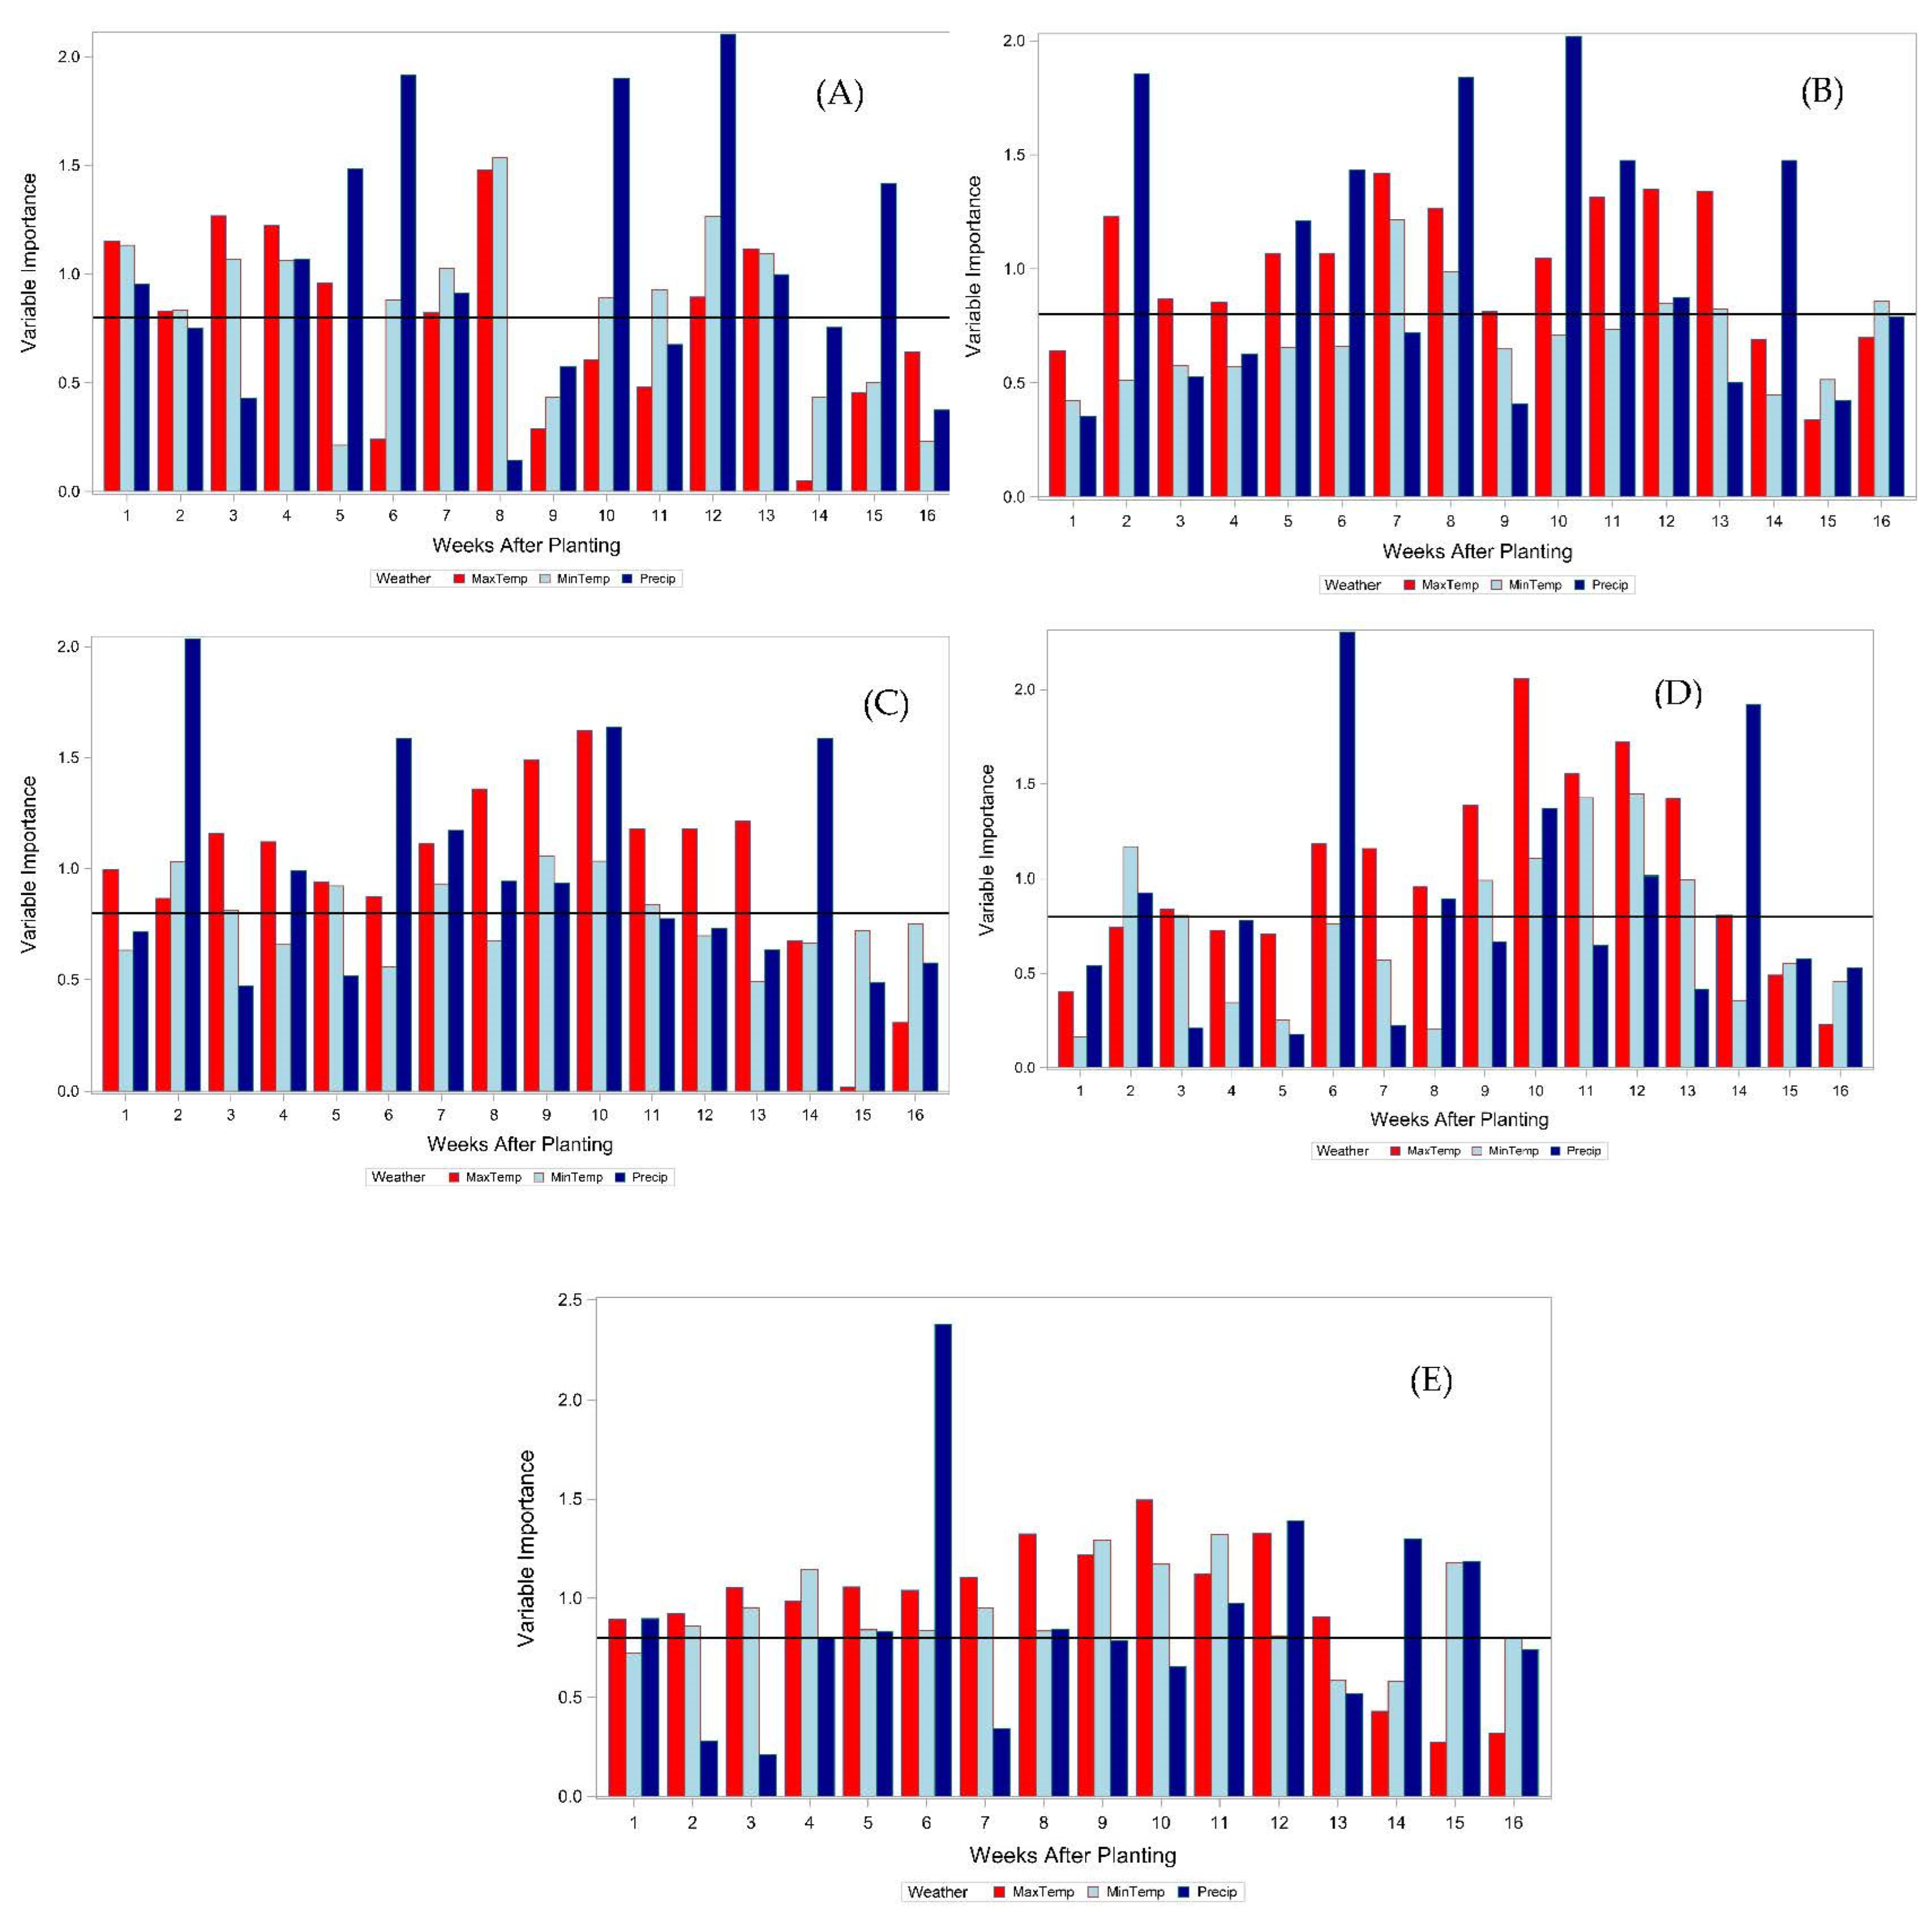
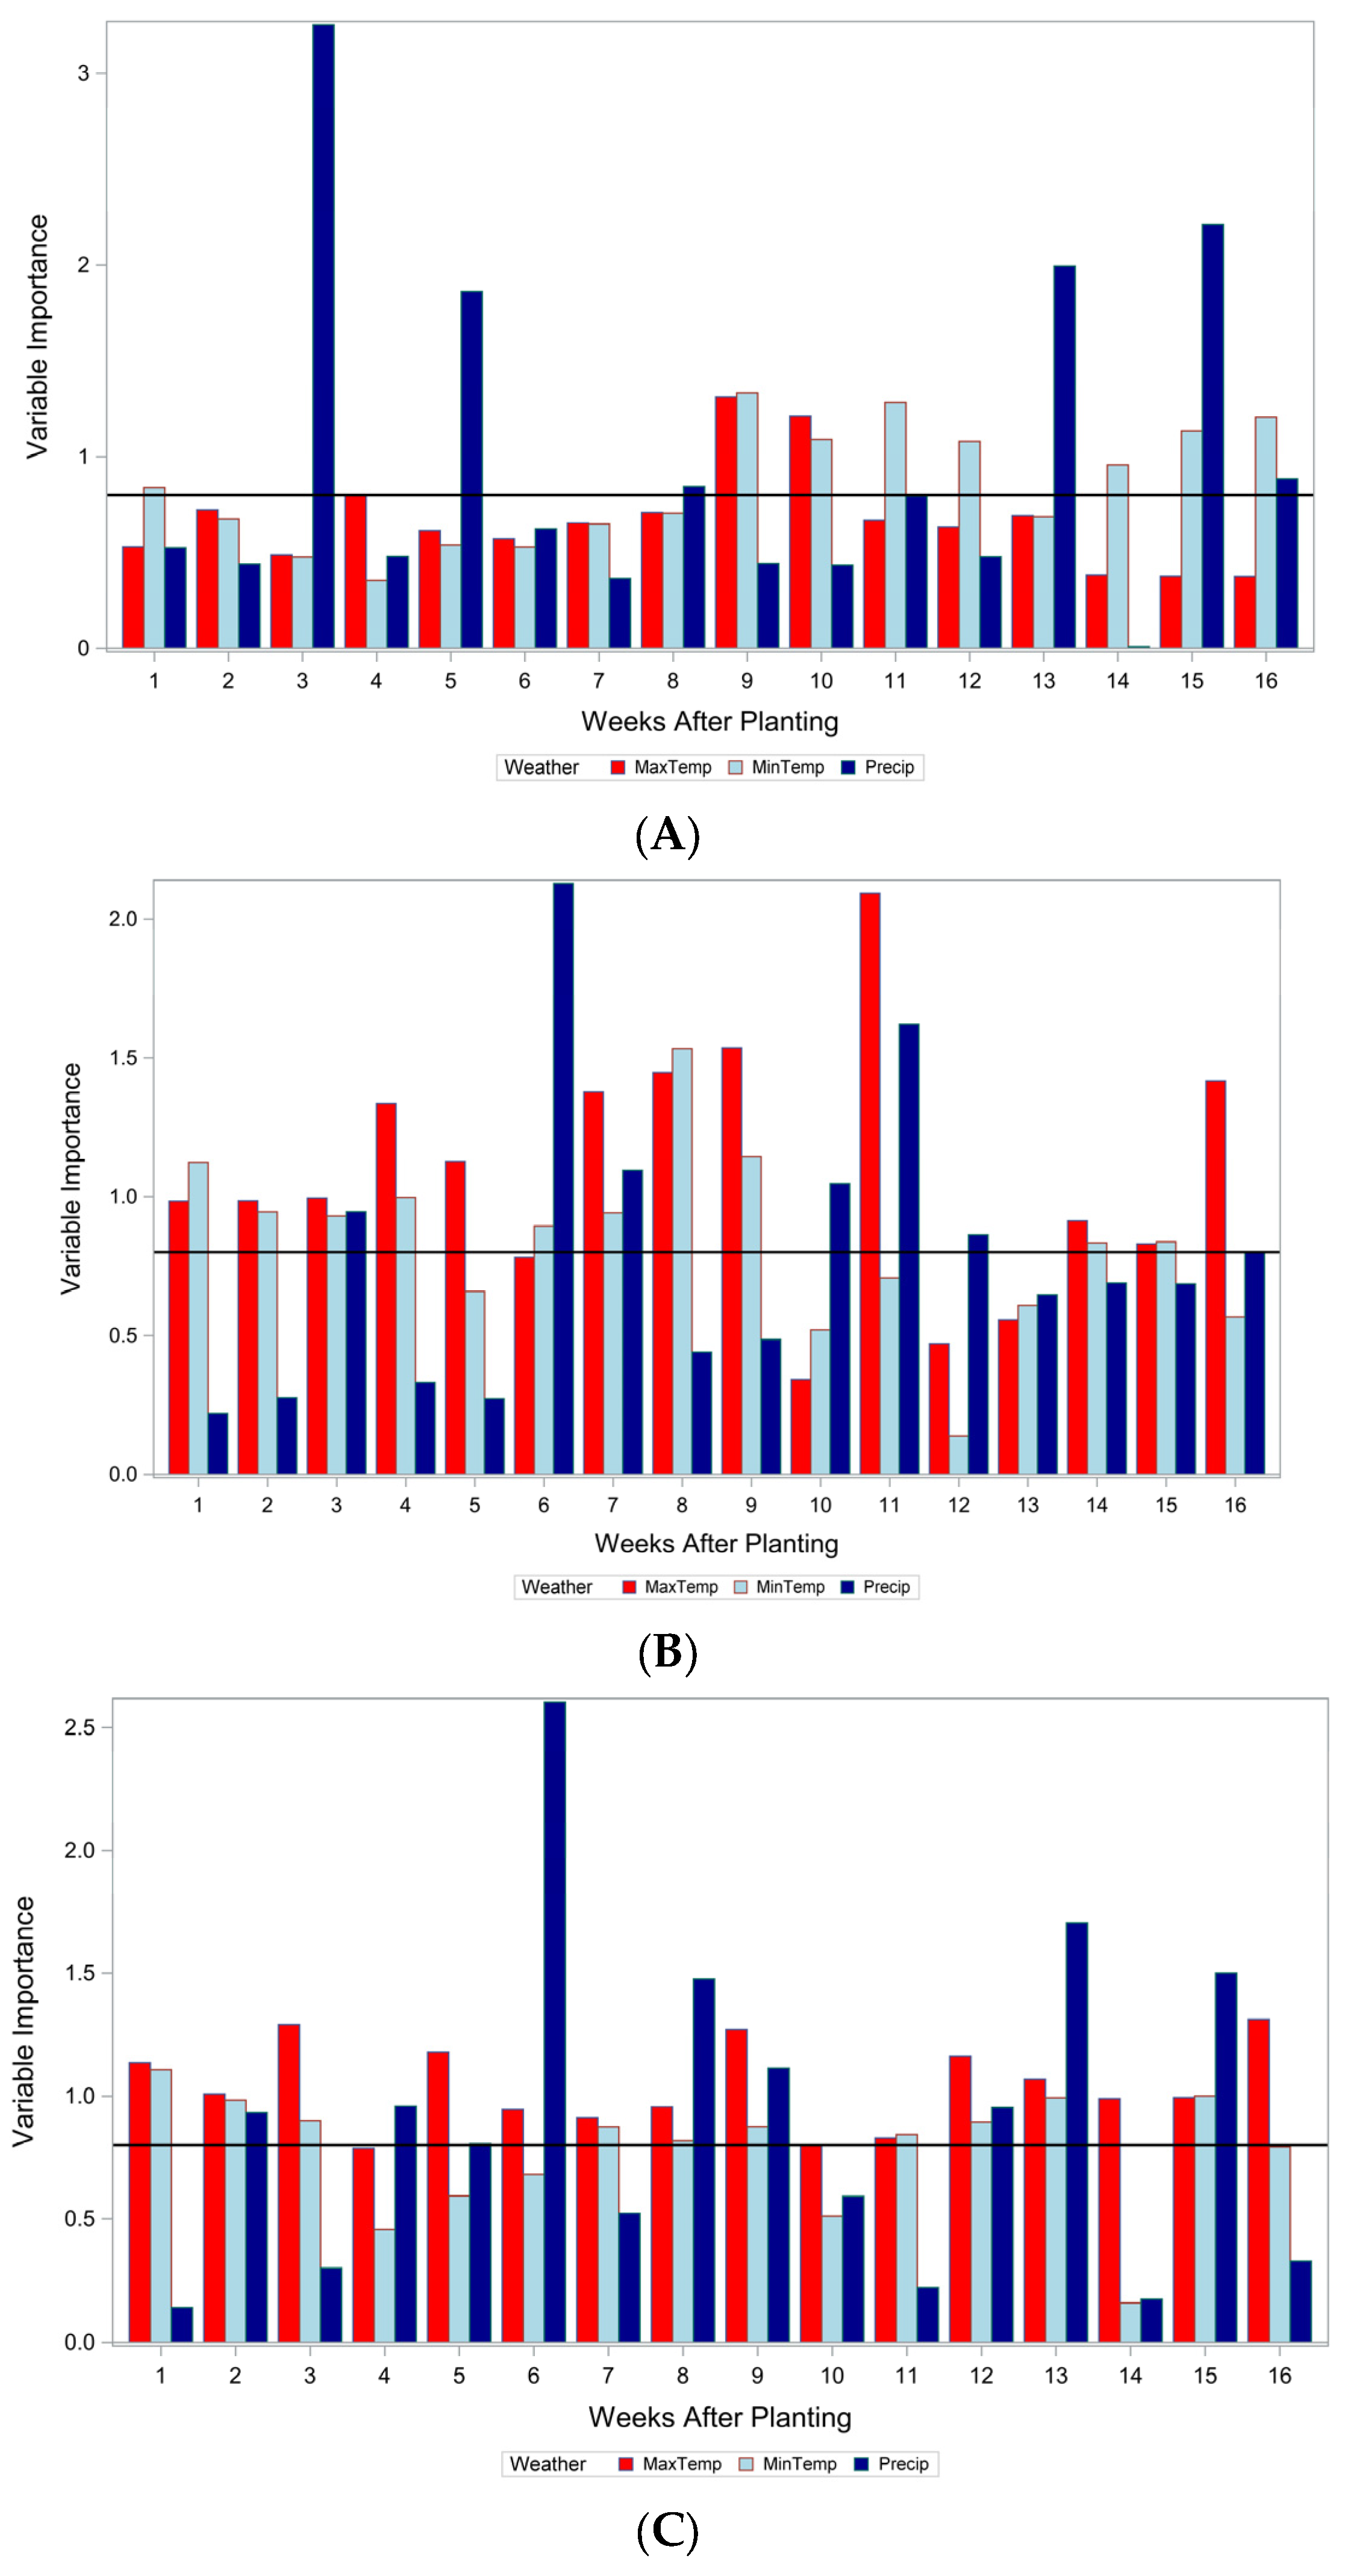
3.1. PLS Analyses of Weather Variables Explaining Vg in Soybean and Maize Maturity Groups

Within each of the MG tests for both soybean and maize, a high percentage of the variation in Vg could be explained by the PLS analysis of all factors (locations, years, weekly maximum and minimum temperature, and precipitation; 48 variables total). The R2 for all variables considered ranged from 50.7 (CV5) to 68.4% (RR4L) for soybean, and 32.2 (Late) to 53.9% (Early) for maize (Table 1). All weather variables (16 weekly precipitation; maximum and minimum temperatures) were used to develop a model for predicting Vg. Ultimately, weekly weather variables were included in the final models, as daily and monthly parameters across years had extreme data variation and did not result in acceptable predictive models for Vg of yield for soybean or maize. When evaluating the three weekly weather variables over 16 weeks of the growing season, the percent variation explained by the PLS models was minimum temperature < maximum temperature < precipitation. The notable exceptions in soybean were in RR5E, in which the R2 for maximum and minimum temperatures were similar (32.7 and 36.6), and in RR5L, in which the R2 for minimum temperature (27.6) was greater than the maximum temperature (19.6), but both were less than R2 for precipitation (38.8) (Table 1). The exceptions in maize were in the early MG tests, where minimum temperatures (32.0) accounted for more variation in Vg than maximum temperature (20.1), but less than precipitation (54.6); and, in medium MG tests, where the R2 for maximum temperature (31.8) was greater than that for precipitation (22.8) and minimum temperature (15.3). When considering precipitation alone, the R2 values ranged from 38.8 to 71.7% for soybean and 22.8–54.6% for maize (Table 1). In soybean, precipitation had a greater effect on Vg in RR4E and RR4L compared with RR5E and RR5L, and CV5. Similarly, in maize, precipitation had a greater effect on Vg in the early MG compared with the medium and late tests. Therefore, precipitation was the most explanatory variable in the model, explaining 53.7 and 35.9% average variation in Vg for soybean and maize, respectively, relative to the maximum temperature and minimum temperature (26.7 and 22.1 for soybean and 21.2 and 20.3% for maize, respectively; Table 1). In soybean, Vg in earlier maturing tests (RR4E and RR5L) and CV5 were affected more by the maximum temperatures, but not in the later maturing tests (RR5E and RR5L).
The maximum and minimum temperatures during the 16-week period had similar effects on percent variation in Vg in late maize MG tests; however, the minimum temperatures had more positive effects on the expression of Vg in the early tests and maximum temperatures had more effects on Vg in the medium tests (Table 1). Genetically modified soybean tests, i.e., roundup ready (RR), did not vary widely than the conventional tests (CV5), suggesting no Vg response differences due to the glyphosate tolerance trait.
Across all variables (location, years, and weather) for the PLS maize model, the early (<114 days) entries explained more variation than the medium and late (Table 1). Particularly, precipitation explained 54.6% of variance for early maize, with maximum temperature and minimum temperatures comprising 20.1 and 32.0%, respectively. The medium test (114–116 days) had 31.8% of variance explained by the minimum temperature. For medium maize tests, precipitation and maximum temperature variables had similar effects, which were greater than the minimum temperature effects, whereas in the late MG, precipitation had a greater effect than maximum and minimum temperatures (Table 1).
Based on the PLS of percent variation model analyses for the individual weeks (across 14 years and five locations), data were thereafter compressed and grouped into weekly growing-season clusters (i.e., weeks 1–16) to determine the relative importance of precipitation and maximum and minimum temperatures on a weekly basis per MG test for both maize and soybean. Overall, precipitation was more explanatory for soybean Vg, but varied by MG and week (Figure 1), particularly during weeks 2 (RR4L), 6 (CV5, RR5E, RR5L), and 10 (RR4E). Furthermore, maximum temperatures had a positive effect on soybean Vg, starting in week 1 and continuing through week 13.
Vargas et al. (1999) [8] applied PLS regression for determining the most relevant cultivar and environmental variables that explained wheat grain yield Vg, and found that sun hours per day in December, February, and March, as well as maximum temperature in March, explained more than 39% of Vg in durum varieties. For bread wheat cultivars, minimum temperature in December and January, as well as sun hours per day in January and February, were environmental variables that explained the greatest expression of Vg (>41%).
Similar to maize, the PLS models using all variables on a weekly basis indicated that precipitation and maximum and minimum temperatures had an affect (p < 0.05) on the magnitude of Vg, which differed among the three test MGs (Figure 2). For example, in the early test MG during week 3, precipitation had a large effect, which was also pronounced later in the season (weeks 13 and 15). However, for the medium and late MG, precipitation had a large effect on the Vg expression of maize during week 6. In addition, for the medium and late MG tests, the maximum temperature had a strong positive effect from weeks 1–16 (Figure 2), likely owing to different MGs experiencing soil moisture and temperature (day and nighttime) at varying maturity stages [9,10].

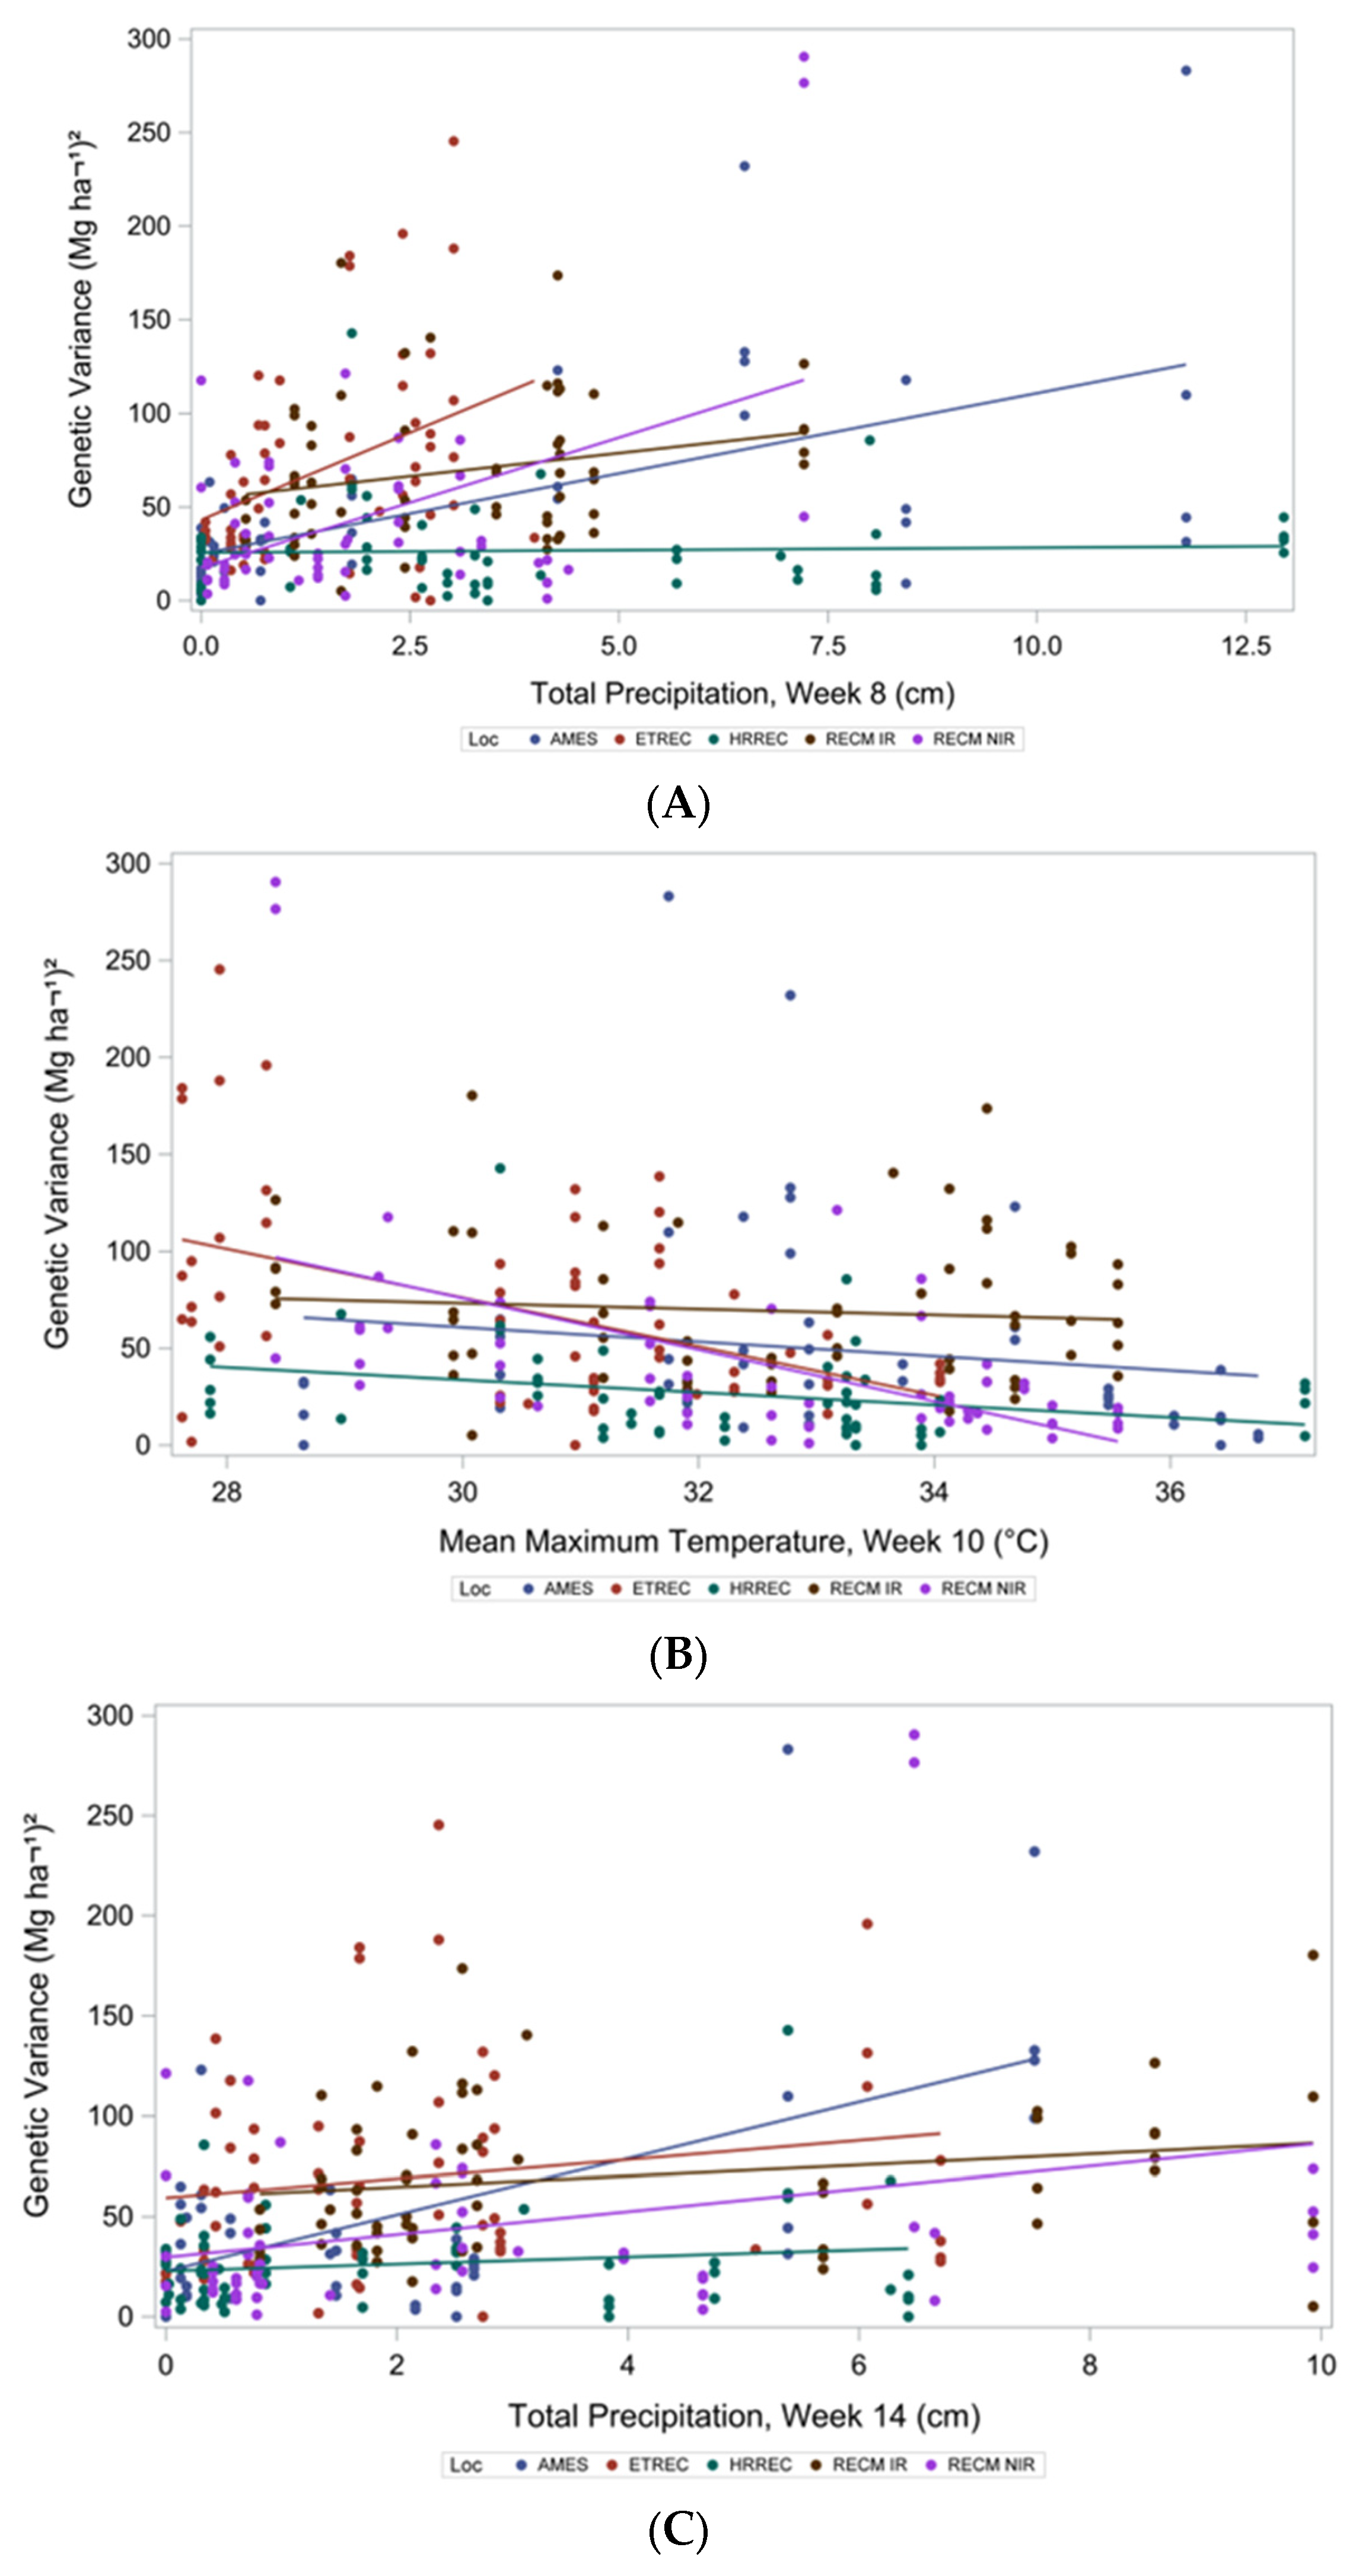
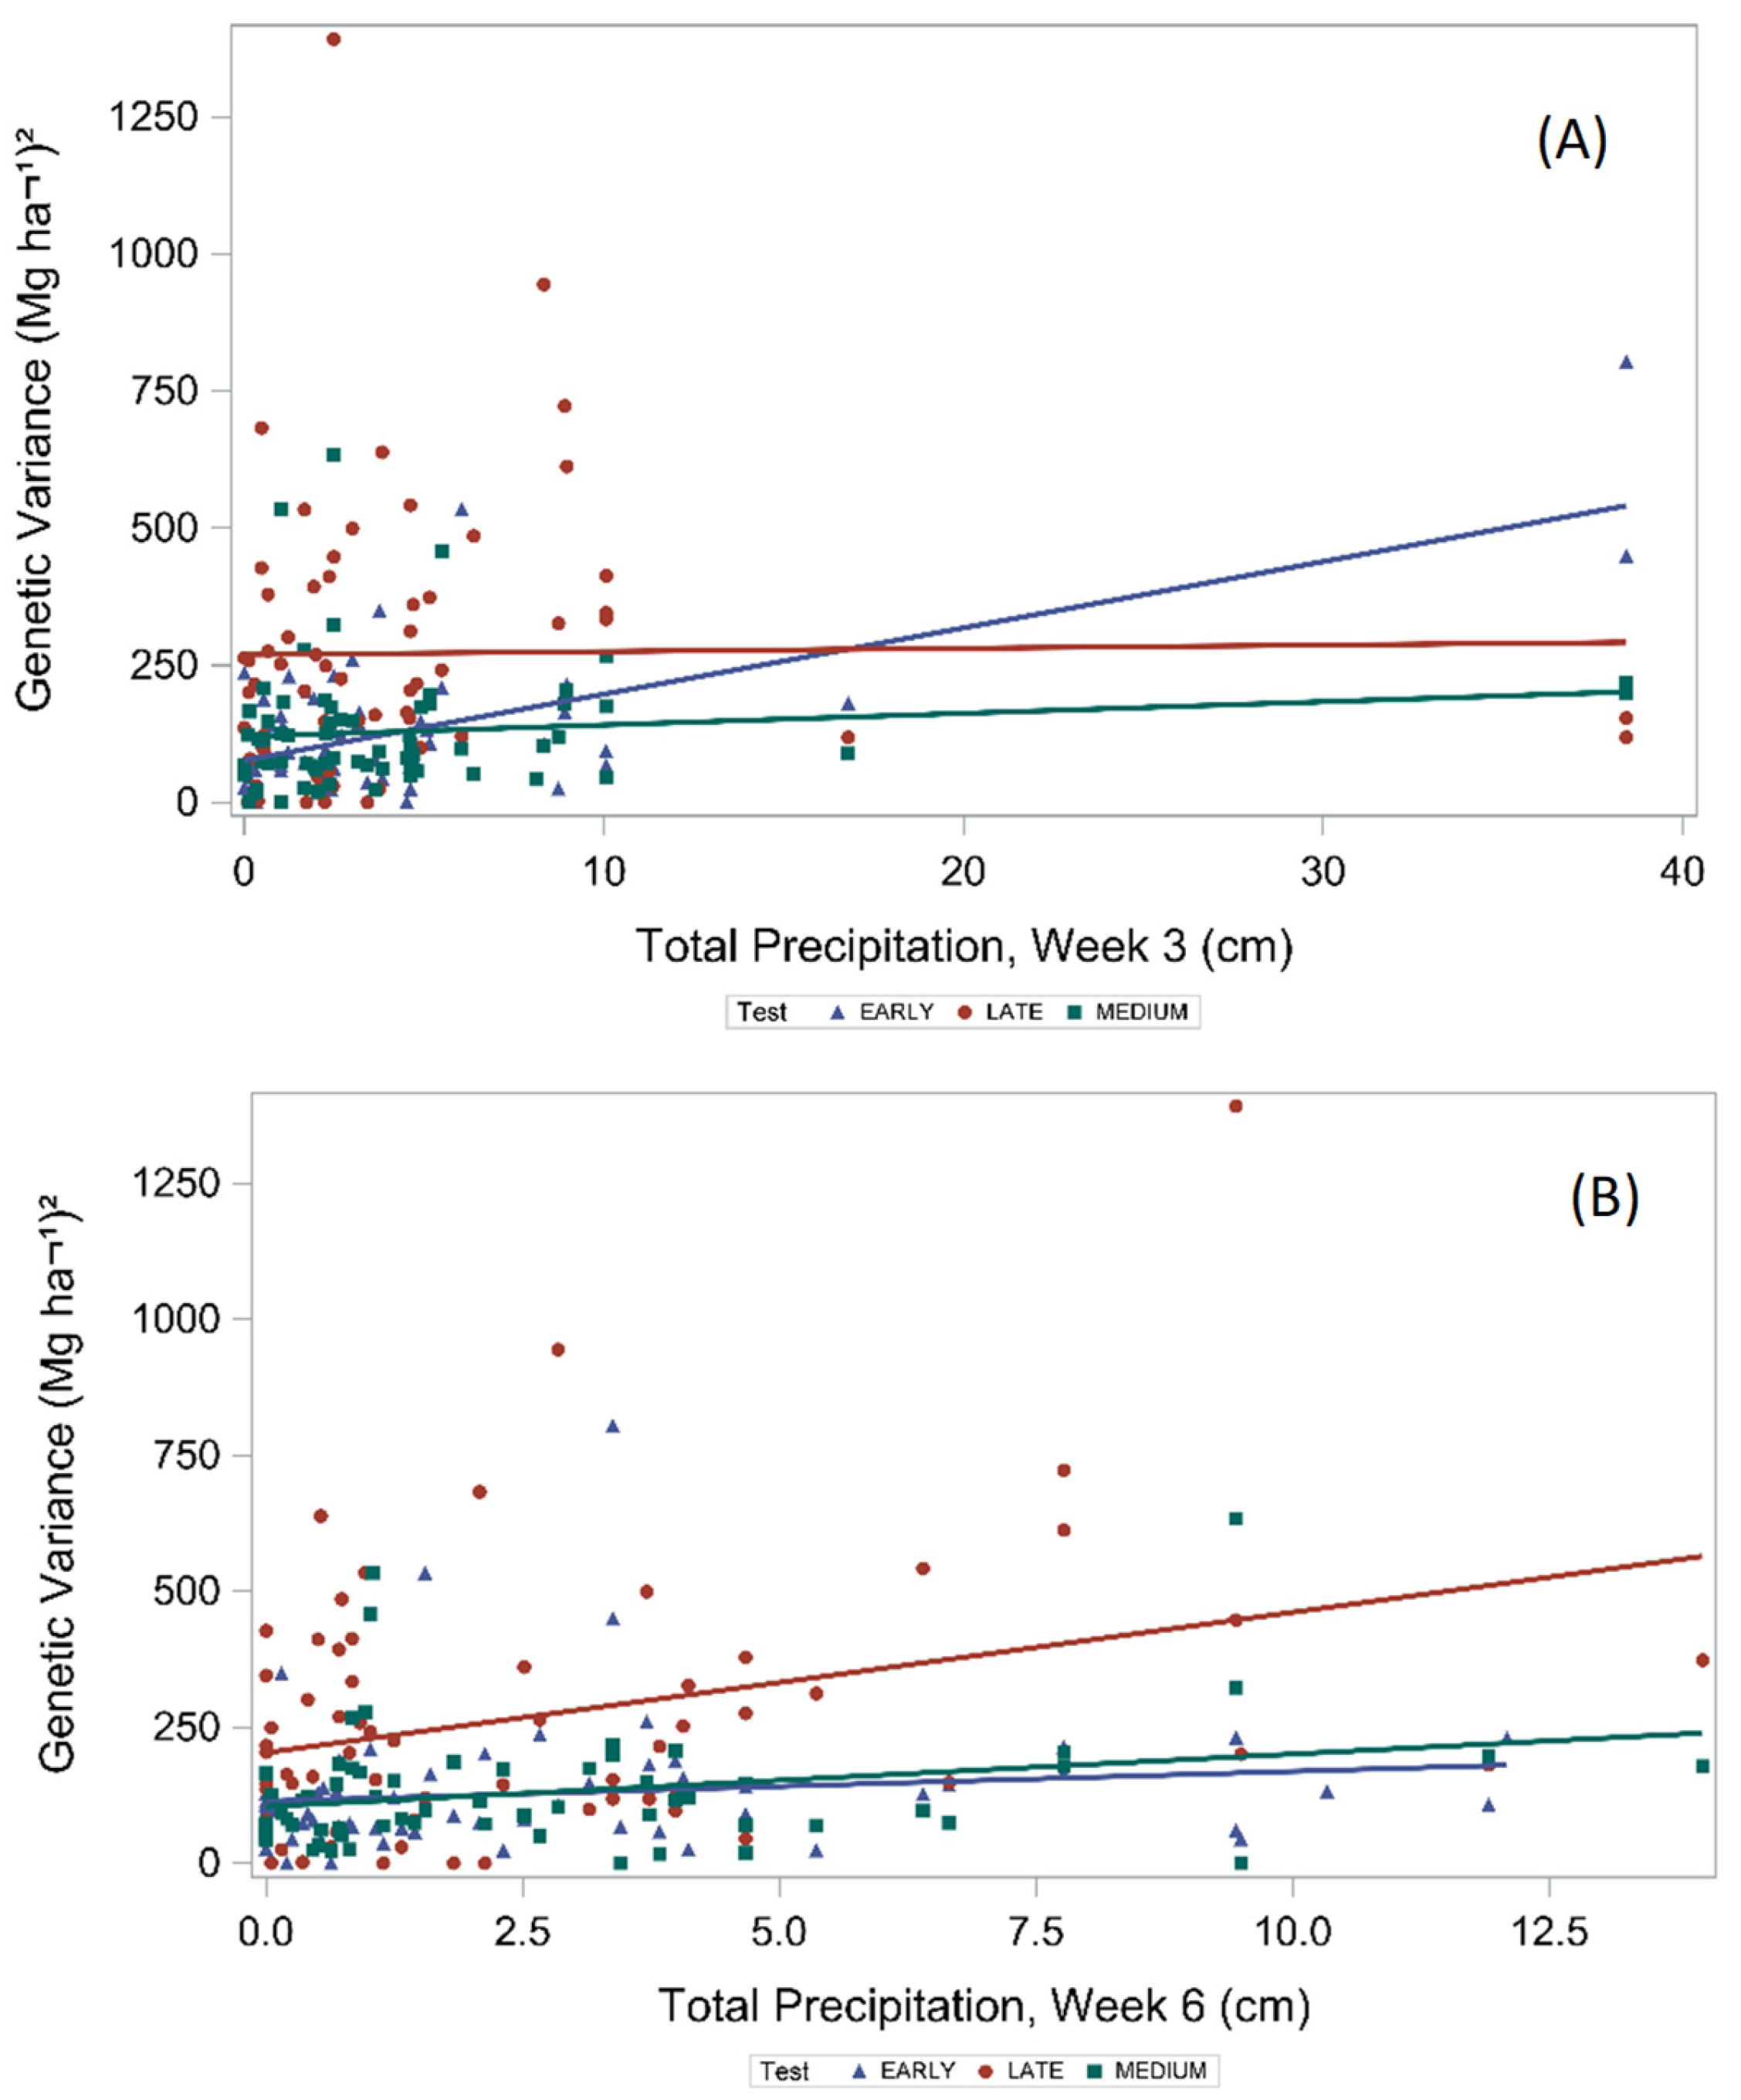
3.2. Regression Analyses of Weather Variables Explaining Vg in Soybean and Maize Maturity Groups

To further explain relationships with Vg and weather variables, regression analyses were conducted to identify the most important time periods throughout the growing season. Overall, weekly weather variables used in the regression analysis (i.e., MG, location, precipitation in weeks 8 and 14, and maximum temperature in week 10) predicted 44.0% of the soybean genetic variance (Table 2). Regression analyses revealed there were differences (p < 0.05) among MG tests in their response to weather variables (Table 2); however, MG did not interact with location. On the other hand, across 14 years, the locations responded differently. For example, Ashworth et al. (2020a, 2020b) [9,10] found that years and locations affected the magnitude of Vg, with year differences largely driving genetic expression within MGs in these environments. Both studies found that there was minimum duplicative information provided across the five yield test sites for both maize and soybean; therefore, all locations were needed and none could be eliminated without compromising cultivar yield trial information for the three MG tests.
In efforts to evaluate the crucial weekly time points interacting with weather variables (mean maximum and minimum temperate and precipitation) across 14 years, 5 test locations, and 5 MG tests, a regression model selection was undertaken. For soybean, there was a location × week 8 precipitation interaction (Table 2 and Figure 3A), as well as a total precipitation week 14 and mean maximum temperature week 10 interaction (Figure 3B,C), thereby suggesting that the locations indeed interacted with variables across soybean MGs in the expression of Vg. All three time frames corresponded to critical soybean reproductive growth stages. During week 8, soybean plants would be at approximately R2-R3 growth stage (de-pending on cultivar and MG) in which there would be rapid flower growth and devel-opment, and pollination occurring and early pod growth (Table 3 [13]). Week 10 corresponds to approximately R4-R5, with rapid pod growth and seed beginning to fill [14]. Week 14 corresponds roughly to R5-R6 with rapid seed filling and nutrients, and N being remobilized from plant parts to seed (Table 3; Ashworth et al. [8]). Moisture and temperature stresses during these critical reproductive stages can result in high flower and pod abortion. A similar response for week 8 precipitation occurred at AMES, ETREC, and RECM-NIR, whereas HREC and RECM-IR had little response to additional precipitation over the 14-year study period. AMES and RECM-NIR had the greatest Vg response to total precipitation during week 14 for soybean (across tests), with other locations not responding greatly (Figure 3B). The greater mean maximum temperatures for soybean during week 10 adversely affected the expression of Vg (Figure 3C). Regardless of genetics (MG and conventional vs. glyphosate resistance cultivars), the same trends occurred for the mean maximum temperature during week 10 (Figure 3C). In addition, total precipitation values at week 10 were negatively correlated with Vg for RECM-NIR and RECM-IR across tests (Figure 3C).
With each additional cm of precipitation, the soybean Vg of yield increased by 4.72 (Mg ha−1)2 during week 8 at AMES and 9.26 (Mg ha−1)2 at RECM-NIR, both of which differed from HRREC and showed no response to precipitation (Table 4). Across all MG tests, ETREC and RECM-IR had no response (p > 0.05) for the week 8 rainfall. Precipitation at week 14 for AMES had the greatest Vg response to rainfall (10.61 Mg ha−1)2, which was not different than ETREC, but was greater than all other locations. Soybean Vg responded negatively to the week 10 maximum temperature, with ETREC and RECM-NIR being most impacted by maximum temperatures, with all other test locations not differing (Table 4).
The regression model selection for maize revealed that differences existed for MG tests and locations, as well as for precipitation during week 3 and 6 using the MG test (Table 5). Overall, precipitation was the driving variable for maize, indicating that maize is more sensitive to rain events during the growing season relative to soybean. In contrast with soybean, interactions with MG test were important explanations of Vg and there were neither interactions with maximum or minimum temperatures nor location during the growing season. The final regression model using weekly weather variables to predict maize genetic variance explained 34.1% of the variation in Vg. However, MG test and location alone accounted for 23.2% of variance in the model to predict maize genetic variance, with MG test accounting for 1.5 times more variation than location.
Precipitation during week 3 interacted the same as precipitation during week 6 with the MG test for maize Vg expression (Table 5; Figure 4A,B). For breeding and variety test programs, as well as production systems, ensuring adequate water during weeks 3 and 6 is critical, regardless of MG test and location. Maize growth and development stages during week 3 corresponded to approximately V2–V3 (depending on cultivar and MG), when plants still rely on seed energy reserves for growth but are transitioning to dependency on photosynthesis and nodal root growth (Table 3) [15]. By week 6, plants are at approximately V6–V8, when there is rapid leaf growth and stem elongation, as well as early tassel and ear shoot development.
When evaluating the Vg of yield for maize, only precipitation during weeks 3 and 6 and MG tests increased Vg (Table 6). Across week 3, the early MG test had a positive response [11.38 (Mg ha−1)2] for each cm of precipitation, which differed from the medium and late, which had no response (Table 6). Conversely, during week 6, the late MG test had a positive response [23.76 (Mg ha−1)2], which differed from the early MG test, but not the medium MG test, neither of which had a significant slope. This illustrates that during early maize growth stages, precipitation is crucial for later Vg expression among cultivars with respect to later growth stages in yield [15].

4. Conclusions

Overall, PLS excelled at bringing together combinations of weather variables (weekly maximum and minimum temperatures and precipitation) per week to develop models with high R2 values (41–59%) relative to the regression analysis (R2 = 34–44%). Further, PLS is ideal for establishing the relative importance of parameters when a multitude of parameters are included in a model; however, regression identifies which variables are most impactful on the expression of Vg and how. These results highlight the complementary use of PLS and regression analysis for identifying how the daily minimum and maximum temperatures and precipitation throughout the growing season, individually and collectively, influence Vg for yield across five locations over 14 years for maize and soybean MG tests.
For soybean, regression analysis revealed that precipitation later in the growing season (especially weeks 8 and 14; early flowering R2, and pod and seed growth, respectively) and maximum temperature (week 10; rapid pod and seed growth) were most influential on the expression of Vg. Conversely, for maize, precipitation early in the growing season (weeks 3 and 6; plants switch from seed energy to photosynthesis, and rapid vegetative growth and stem elongation, respectively) and maximum and minimum temperatures had the most influence on Vg expression. Therefore, precipitation (or supplemental in the form of irrigation), namely during the rapid vegetative development to early reproductive phase, was key for the Vg of yield in maize. As expected, increased precipitation improved genetic variance in both maize and soybean (i.e., increased Vg); however, a greater maximum temperature decreased the Vg in soybean across MG tests.
In both maize and soybean, differences in genetic variance occurred among MG tests and locations. However, for soybean, there were interactions between locations and weather variables, whereas for maize, interactions were found between MG tests and weather variables. These results have important implications for breeding and cultivar evaluation programs, which need a maximum expression of genetic differences in soybean and maize cultivars under a changing climate.

Author Contributions

Conceptualization, F.L.A.; methodology, A.M.S.; software, A.M.S.; validation, A.M.S.; formal analysis, A.M.S.; investigation, F.L.A., A.J.A. and A.M.S.; data curation, F.L.A.; writing—original draft preparation, A.J.A.; writing—review and editing, F.L.A., A.J.A. and A.M.S.; visualization, A.M.S. All authors have read and agreed to the published version of the manuscript.

Funding

This research received no external funding.

Data Availability Statement

Data are available upon request.

Acknowledgments

The authors are grateful to the years of work that went into the University of Tennessee Variety Trials at the research and education sites included in this paper. Mention of tradenames or commercial products in this publication is solely for the purpose of providing specific information and does not imply recommendation or endorsement by the U.S. Department of Agriculture.

Conflicts of Interest

The authors declare no conflict of interest.

References

  1. Dia, M.; Wehner, T.C.; Hassell, R.; Price, D.S.; Boyhan, G.E.; Olson, S.; Juarez, B. Value of locations for representing mega-environments and for discriminating yield of watermelon in the U.S. Crop Sci. 2016, 56, 1726–1735. [Google Scholar] [CrossRef]
  2. Yates, F.; Cochran, W.U. The analysis of groups of experiments. J. Agric. Sci. 1938, 28, 556–580. [Google Scholar] [CrossRef]
  3. Finlay, K.W.; Wilkinson, G.N. The analysis of adaptation in a plant breeding programme. Aust. J. Agric. Res. 1963, 14, 742–754. [Google Scholar] [CrossRef]
  4. Gollob, H.F. A statistical model which combines features of factor analysis and analysis of variance techniques. Psychometrika 1969, 196833, 73–115. [Google Scholar] [CrossRef]
  5. Aastveit, H.; Martens, H. ANOVA interactions interpreted by partial least squares regression. Biometrics 1986, 42, 829–844. [Google Scholar] [CrossRef]
  6. Talbot, M.; Wheelwright, A.V. The analysis of genotype X environment interactions by partial least squares regression. Biul. Oceny Odmian 1989, 21/22, 19–25. [Google Scholar]
  7. Vargas, M.; Crossa, J.; Sayre, K.; Reynolds, M.; Ramírez, M.E.; Talbot, M. Interpreting Genotype × Environment Interaction in Wheat by Partial Least Squares Regression. Crop Sci. 1998, 38, 679–689. [Google Scholar] [CrossRef]
  8. Vargas, M.; Crossa, J.; van Eeuwijk, F.A.; Ramírez, M.E.; Sayre, K. Using Partial Least Squares Regression, Factorial Regression, and AMMI Models for Interpreting Genotype × Environment Interaction. Crop Sci. 1999, 39, 955–967. [Google Scholar] [CrossRef]
  9. Ashworth, A.J.; Knapp, K.V.; Allen, F.L.; Saxton, A.M. Comparing yield trial locations based on their elicited expressions of genetic variance among soybean cultivars. Crop Sci. 2020, 60, 313–1324. [Google Scholar] [CrossRef]
  10. Ashworth, A.J.; Knapp, V.; Allen, F.L.; Saxton, A.M. Comparison of discriminatory effects of maize yield test locations based on their genetic variation expression among hybrids. Crop Sci. 2020, 60, 3166–3174. [Google Scholar] [CrossRef]
  11. Wang, C.; Guo, L.; Li, Y.; Wang, Z. Systematic comparison of C3 and C4 plants based on Metabolic Network Analysis. BMC Syst. Biol. 2012, 6 (Suppl. 2), S9. [Google Scholar] [CrossRef]
  12. Van der Voet, H. Comparing the predictive accuracy of models using a simple randomization test. Chemom. Intell. Lab. Syst. 1994, 25, 313–323. [Google Scholar] [CrossRef]
  13. Parra-Quijano, M.; Draper, D.; Torres, E.; Iriondo, J.M. Ecogeographical representativensess in crop wild relative ex situ collections. In Crop Wild Relative Conservation and Use; Maxted, N., Ford-Lloyd, B.V., Kell, S.P., Iriondo, J.M., Dulloo, M.E., Turok, J., Eds.; CABI: Cambridge, MA, USA, 2007; pp. 249–273. [Google Scholar]
  14. Fehr, W.R.; Caviness, C.E. Stages of Soybean Development (Iowa State University Special Report No. 80); Iowa State University: Ames, IA, USA, 1977; Available online: https://dr.lib.iastate.edu/entities/publication/58c89bfe-844d-42b6-8b6c-2c6082595ba3 (accessed on 1 October 2023).
  15. Nielson, R.L. Maize growth and Development. What Goes on from Planting to Harvest. Purdue Univ. Ext. Pub. 2000, AGRY-97-07. Available online: https://www.agry.purdue.edu/ext/pubs/agry-97-07_v1-1.pdf (accessed on 1 October 2023).
Figure 1. Partial least squares (PLS) analyses of weekly precipitation and maximum and minimum temperatures on genetic variance estimates for soybean. PLS models used all data (5 location and 14 years). Tests included CV5 (A), RR4E (B), RR4L (C), RR5E (D), and RR5L (E). Straight line represents the 0.8 importance level suggested by SAS 9.4 (i.e., variables below the line are not contributing to the model).
Agronomy 13 02752 g001
Figure 2. Partial least squares (PLS) analyses of weekly precipitation and maximum and minimum temperatures on genetic variance estimates for maize. PLS models used all data (5 location and 14 years). Early (A), Medium (B), and Late (C) tests. The straight line represents the 0.8 importance level suggested by SAS 9.4 (i.e., variables below the line are not contributing to the model).
Agronomy 13 02752 g002
Figure 3. Regression for weather variables [total precipitation week 8 (A), total precipitation week 14 (B), and mean maxim temperature week 10 (C) at important soybean growing-season time points per location (AMES, Research and Education Center at Ames Plantation in cooperation with the Hobart Ames Foundation; ETREC, East Tennessee Research and Education Center; HRREC, Highland Rim Research and Education Center; IR, irrigated; NIR, non-irrigated; RECM, Research and Education Center at Milan) spanning 14 years.
Agronomy 13 02752 g003
Figure 4. Maize regressions for important weather variables by MG (early < 114 d after planting (DAP); medium = 114–116 DAP; late > 116 DAP), summarized over 5 locations, namely AMES, Ames Research and Education Center at Ames Plantation in cooperation with the Hobart Ames Foundation (Grand Junction, TN); HRREC, Highland Rim Research and Education Center, (Springfield, TN); ETREC, East Tennessee Research and Education Center (Knoxville, TN); RECM-IR, Research and Education Center at Milan, irrigated (Milan, TN); and RECM-NIR, Research and Education Center at Milan, non-irrigated (Milan, TN) over 14 years.
Agronomy 13 02752 g004
Table 1. Percent variation (R2) explained by weather variables used in PLS models for soybean and maize genetic variance expression across five Tennessee locations c and 14 years (2002–2015) based on test maturity group.
TestAll VariablesPrecipitation OnlyMax Temperature OnlyMin Temperature Only
Soybean a
CV550.742.323.716.7
RR4E66.763.429.517.9
RR4L68.471.728.011.8
RR5E57.052.332.736.6
RR5L51.638.819.627.6
Average58.953.726.722.1
Maize b
Early53.954.620.132.0
Medium38.122.831.815.3
Late32.230.411.912.8
Average41.435.921.220.03
a RR, glyphosate tolerant; 4E, 4 early (4.0–4.5 maturity group tests); 4L, 4 late (4.6–4.9); 5E, 5 early (5.0–5.5); 5L, 5 late (5.6–5.9); CV5, conventional 5 (5.0–5.9). b Maize maturity group: early < 114 d after planting (DAP); medium = 114–116 DAP; late > 116 DAP. c AMES, Ames Research and Education Center at Ames Plantation in cooperation with the Hobart Ames Foundation (Grand Junction, TN); HRREC, Highland Rim Research and Education Center (Springfield, TN); ETREC, East Tennessee Research and Education Center (Knoxville, TN); RECM-IR, Research and Education Center at Milan, irrigated (Milan, TN); RECM-NIR, Research and Education Center at Milan, non-irrigated (Milan, TN).
Table 2. ANOVA table for regression model using weekly weather variables to predict soybean genetic variance across 14 years (2002–2015) at five Tennessee locations using five maturity group (MG) tests.
Source DF Type III SS Mean Square F Value p-Value
MG Test a418,21345533.120.016
Location420,10450263.450.009
Precipitation Wk8110,19110,1916.990.009
Precipitation Wk8 × Location416,48041202.830.025
Precipitation Wk14128,29728,29719.410.001
Precipitation Wk14 × Location4863921601.480.208
Mean maximum temperature Wk10122,84822,84815.680.001
Mean maximum temperature Wk10 × Location b422,90257263.930.004
Error251365,8471458
a 4E, 4 early (4.0–4.5 maturity group tests); 4L, 4 late (4.6–4.9); 5E, 5 early (5.0–5.5); 5L, 5 late (5.6–5.9); CV5, conventional 5 (5.0–5.9). b AMES, Ames Research and Education Center at Ames Plantation in cooperation with the Hobart Ames Foundation (Grand Junction, TN); HRREC, Highland Rim Research and Education Center (Springfield, TN); ETREC, East Tennessee Research and Education Center (Knoxville, TN); RECM-IR, Research and Education Center at Milan, irrigated (Milan, TN); RECM-NIR, Research and Education Center at Milan, non-irrigated (Milan, TN).
Table 3. Approximate growth stages for soybean and maize per week after planting for 16 weeks during the growing season.
Weeks after
Planting
SoybeanMaize
Approximate Stage of Growth 1Approximate Stage of Growth 2
1VE: germination and emergenceVE: germination and emergence
2VC: cotyledon-unifoliate leaves V1: first leaf fully emerged
3V1: one open trifoliate, nodules begin forming on roots, energy source transitions from cotyledons to photosynthesisV2: two leaves fully emerged; plant relies on seed reserves for growth
4V2–V3: 2–3 open trifoliates, lateral roots growing rapidly, nitrogen fixation underway through R6V3: three leaves, plant switches from seed reserves to photosynthesis, rapid nodal root development starts to occur
5V4–V5: 4–5 fully opened trifoliates, rapid dry matter accumulation, flower buds begin to develop in leaf axilsV4–V5: nodal roots begin to take over, number of potential leaves and ear shoots are determined
6V5–V6–R1–R2: rapid dry matter accumulation, flower bud growth, one or more open flowers at one of the two uppermost nodesV6–V7: rapid growth stage, stem elongation begins
7R2–R3: flower growth, pollination, pod growthV8–V10: steady rapid growth and dry matter accumulation, tassel and ear shoots are developing
8R2–R3: flower growth, pollination, pod growthV9–V11: rapid growth, new leaves appear every 2–3 days
9R3–R4: flower growth, pollination, pod growth and early seed developmentV11–Vnth: brace roots are forming, potential kernel number per ear and ear size are being determined
10R4–R5: rapid pod growth, seed beginning to fillVT: tasseling, plants have reached full size
11R4–R5: rapid pod growth, seed beginning to fillR1: silking, pollen shed starts
12R5–R6: rapid seed filling, nutrients and N being mobilized from plant parts to seedR1–R2: silking, pollen shed, kernel blister stage
13R5–R6: rapid seed filling, nutrients and N being mobilized from plant parts to seedR2–R3: kernel blister and milk stage, grain dry matter accumulating
14R5–R6: rapid seed filling, nutrients and N being mobilized from plant parts to seedR3: kernel milk stage, grain dry matter accumulating
15R6–R7: pods and seed are starting to mature and lose moistureR3–R4: kernel milk and dough stage, grain dry matter accumulating
16R6–R7: pods and seed are starting to mature and decrease in moistureR5: kernel dent stage, grain is decreasing in moisture
1 Adapted from Univ. of Wisconsin, Ext. Pub. A Visual Guide to Soybean Growth and Development. https://coolbean.info/library/documents/2017_Soybean_GrowthDev_Guide_FINAL.pdf, (accessed on 30 August 2023) 2.
Table 4. Regression slopes for important weekly precipitation and temperature weather variables during the growing season for soybean to predict genetic variance across 14 years (2002–2015) and five maturity groups (MG) test a and by five Tennessee locations.
SlopeEstimateStandard Errorp-Value
Precipitation Wk 8 AMES b4.72 a,c,d1.880.012
Precipitation Wk 8 ETREC1.61 abc6.590.806
Precipitation Wk 8 HRREC−0.09 b1.420.950
Precipitation Wk 8 RECM IR6.75 ab3.480.053
Precipitation Wk 8 RECM NIR9.26 ac2.960.002
Precipitation Wk 14 AMES10.61 a3.120.001
Precipitation Wk 14 ETREC5.23 ab2.760.060
Precipitation Wk 14 HRREC1.93 b2.260.395
Precipitation Wk 14 RECM IR3.18 b1.830.084
Precipitation Wk 14 RECM NIR3.09 b1.940.113
Mean maximum temperate Wk 10 AMES−3.82 abc2.740.165
Mean maximum temperate Wk 10 ETREC−12.00 b3.520.001
Mean maximum temperate Wk 10 HRREC−3.11 ac2.330.183
Mean maximum temperate Wk 10 RECM IR3.31 c3.090.284
Mean maximum temperate Wk10 RECM NIR−9.87 ab2.550.000
a 4E, 4 early (4.0–4.5 maturity group tests); 4L, 4 late (4.6–4.9); 5E, 5 early (5.0–5.5); 5L, 5 late (5.6–5.9); CV5, conventional 5 (5.0–5.9). b AMES, Ames Research and Education Center at Ames Plantation in cooperation with the Hobart Ames Foundation (Grand Junction, TN); HRREC, Highland Rim Research and Education Center (Springfield, TN); ETREC, East Tennessee Research and Education Center (Knoxville, TN); RECM-IR, Research and Education Center at Milan, irrigated (Milan, TN); RECM-NIR, Research and Education Center at Milan, non-irrigated (Milan, TN). c Tests if slope differs from zero (p < 0.05). d Slopes not sharing a letter are significantly different using the LSD procedure within a week per group (p < 0.05).
Table 5. ANOVA table for regression model using weekly weather variables to predict maize genetic variance across 14 years (2002–2015) and at five Tennessee locations using three MG tests.
SourceDFType III SSMean SquareF ValuePr > F
MG test a2309,177.40154,588.706.590.002
Location b4397,117.0299,279.264.240.003
Precipitation Wk 31125,803.35125,803.355.370.022
Precipitation Wk 3 × MG Test2267,012.58133,506.295.700.004
Precipitation Wk 61182,029.70182,029.707.770.006
Precipitation Wk 6 × MG Test2174,945.6187,472.803.730.026
Error1844,313,184.9023,441.22
a Maize maturity group: early < 114 d after planting (DAP); medium = 114–116 DAP; late > 116 DAP. b AMES, Ames Research and Education Center at Ames Plantation in cooperation with the Hobart Ames Foundation (Grand Junction, TN); HRREC, Highland Rim Research and Education Center (Springfield, TN); ETREC, East Tennessee Research and Education Center (Knoxville, TN); RECM-IR, Research and Education Center at Milan, irrigated (Milan, TN); RECM-NIR, Research and Education Center at Milan, non-irrigated (Milan, TN).
Table 6. Regression slopes for important weather variables during the growing season for maize to predict genetic variance across 14 years (2002–2015) and three maturity groups (MG) test a and by five Tennessee locations b.
ParameterEstimateStandard Errorp-Value d
Precipitation Wk 3, Early11.38 a,c,d2.82<0.001
Precipitation Wk 3, Medium1.26 b2.790.654
Precipitation Wk 3, Late−1.19 b2.820.673
Precipitation Wk 6, Early0.94 a6.190.879
Precipitation Wk 6, Medium6.75 ab6.250.282
Precipitation Wk 6, Late23.76 b6.32<0.001
a Maize maturity group: early < 114 d after planting (DAP); medium = 114–116 DAP; late > 116 DAP. b AMES, Ames Research and Education Center at Ames Plantation in cooperation with the Hobart Ames Foundation (Grand Junction, TN); HRREC, Highland Rim Research and Education Center (Springfield, TN); ETREC, East Tennessee Research and Education Center (Knoxville, TN); RECM-IR, Research and Education Center at Milan, irrigated (Milan, TN); RECM-NIR, Research and Education Center at Milan, non-irrigated (Milan, TN). c Tests if slope differs from zero (p < 0.05). d Slopes not sharing a letter are significantly different using the LSD procedure within a week per group (p < 0.05).
Disclaimer/Publisher’s Note: The statements, opinions and data contained in all publications are solely those of the individual author(s) and contributor(s) and not of MDPI and/or the editor(s). MDPI and/or the editor(s) disclaim responsibility for any injury to people or property resulting from any ideas, methods, instructions or products referred to in the content.

