Article

Effects of Three Long-Term Land Use Patterns on Soil Degradation in the Yellow River Delta: Evidence from Ecological Stoichiometry

1
National Engineering Research Center for Efficient Utilization of Soil and Fertilizer Resources, College of Resources and Environment, Shandong Agricultural University, No. 61 Daizong Street, Tai’an 271018, China
2
College of Forestry, Shandong Agricultural University, Tai’an 271018, China
*
Author to whom correspondence should be addressed.
Agronomy 2023, 13(11), 2744; https://doi.org/10.3390/agronomy13112744
Submission received: 28 September 2023 / Revised: 27 October 2023 / Accepted: 29 October 2023 / Published: 31 October 2023

Abstract

:
The irrational land use patterns in the Yellow River Delta (YRD) have resulted in an imbalance in ecological stoichiometry, leading to secondary salinization and soil degradation. However, there is limited knowledge about the long-term response of soil and enzyme stoichiometry to land use. This hampers our ability to optimize land use in the YRD to alleviate nutrient limitation and thus promote ecological stoichiometric balance. We investigated the stoichiometry of soil and enzyme carbon (C), nitrogen (N), and phosphorus (P) in three land use patterns (Alfalfa artificial grassland, AG; wheat–maize rotation field, WM; native grassland, PC) established for 19 years in the YRD. The results showed that the soil stoichiometry of the three land uses in the YRD was lower than the world and Chinese averages, indicating lower C and N levels. Nutrient limitations of soil microorganisms were C and P due to an enzyme C:N ratio greater than 1:1 and vector angle greater than 45°. The three land use patterns have different advantages in alleviating nutrient limitations in the YRD. AG promotes soil macroaggregate formation, reduces soil salt content, improves nutrient availability, and mitigates N limitation. This makes AG more conducive to improving the poor soil structure, high soil salinity, and stoichiometric imbalance in the YRD to mitigate local soil degradation and be suitable for long-term continuous cultivation. WM is beneficial for increasing soil total C content due to straw return. However, WM does not reduce soil salinity. WM is more suitable for intercropping or crop rotation to improve soil C content in the YRD. Although PC can alleviate soil microbial C limitation due to its significantly lower vector length than AG and WM, the low nutrient levels hindered its ability to alleviate local soil nutrient limitation. In conclusion, our study provides a theoretical basis for rational land use in the YRD to mitigate soil degradation.

1. Introduction

The Yellow River Delta (YRD) is a contemporary sedimentary plain that originated from the accumulation of a substantial amount of sediment [1]. It stands as one of the most extensive coastal saline-alkali lands in China’s warm temperate zone, characterized by shallow groundwater, poor soil texture, and a high evaporation–precipitation ratio [2]. In recent decades, extensive tracts of wilderness in the YRD have been reclaimed to promote agricultural development. However, this blind reclamation and irrational land use have resulted in secondary salinization and poor soil structure [3]. Salinization results in decreased availability of soil nitrogen (N) and phosphorus (P), and it disrupts ecological stoichiometry [4]. Moreover, soil salinization negatively impacts microbial abundance and diversity [5]. Studies have demonstrated that elevated soil salinity affects the desorption of soil N and P, thereby increasing the risk of N and P leaching losses [6]. Zhai et al. [7] indicated an increase in microbial P limitation with rising soil salinity. Consequently, the YRD typically experiences aboveground vegetation N limitation and microbial P limitation [8]. This causes an imbalance in ecological stoichiometry rendering the soil fragile and unstable, ultimately contributing to soil degradation [9]. Notably, the irrational land use patterns in the YRD have exacerbated ecological stoichiometric imbalances and soil degradation [10]. Such patterns encompass excessive application of chemical fertilizers, frequent soil disturbance, and irrational crop cultivation, all of which can lead to an ecological stoichiometry imbalance [11,12].
Ecological stoichiometric imbalance is a direct contributor to soil degradation. Meanwhile, the trend in ecological stoichiometry also provides a basis for changing nutrient strategies to mitigate soil degradation [13]. Ecological stoichiometry includes soil carbon (C), N, and P ratios and enzyme C, N, and P ratios. The researchers determined the nutrient limitation of above-ground vegetation and soil nutrient cycling trends by comparing soil C, N, and P ratios in the study area and globally [14]. Sinsabaugh et al. [15] found that the logarithm transformed enzyme activities for β-1,4-glucosidase (βG), β-1,4-N-acetyl-glucosaminidase (NAG), and L-leucine aminopeptidase (LAP), and phosphatase tended to be 1:1:1 at the global scale. Similarly, He et al. [16] found that soil enzyme stoichiometry exhibited consistency at both global and regional scales. This consistency allows researchers to determine soil microbial nutrient utilization strategies by examining the deviations of enzyme C, N, and P ratios from the 1:1:1 ratio. Microorganisms drive the global nutrient cycle through the production of extracellular enzymes. This process is controlled by both biological and environmental factors [17]. During natural recovery, microorganisms continuously contribute to soil nutrient cycling, eventually reaching equilibrium [18]. However, we still lack studies on the long-term effects of different land use patterns on enzyme stoichiometry in saline-alkali soils such as the YRD compared to natural recovery. This limits our ability to rationally manage the YRD to mitigate local soil degradation.
Based on the above, we used three typical land use patterns (alfalfa artificial grassland, wheat–maize rotation field, and native grassland) in the YRD for 19 years to test our two hypotheses: (1) Long-term land use in the YRD may exacerbate N and P limitation of local aboveground vegetation and soil microorganisms due to the low availability of N and P in local soils. (2) Each of the three long-term land use patterns may have its own advantages in mitigating soil degradation in the YRD due to their different nutrient strategies. Therefore, this study aims to investigate: (1) The effects of long-term land use on soil and enzyme stoichiometry in the YRD. (2) The effects of three long-term land use patterns on soil physicochemical properties and nutrient availability. Ultimately, we need to explore how to optimize land use and its mechanisms, based on the evidence of ecological stoichiometry. This provides a theoretical basis for rational land use and sustainable development of agroecosystems in the YRD.

2. Materials and Methods

2.1. Site Description

The study site is situated in the reclamation region of the YRD, Dongying City, China (37°17′36″–37°18′06″ N, 118°37′44″–118°38′13″ E). The region falls within the warm temperate zone of the continental monsoon climate. It experiences an average annual temperature of 12.1 °C and an average annual precipitation of 690 mm. Most of the rainfall occurs during the summer, making up approximately 63.9% of the total annual precipitation. Being a recently reclaimed area within the YRD, the soil primarily consists of silt particles and exhibits a light loam texture. The soil types are saline soil and fluvo-aquic soil. The basic soil physicochemical properties at 0–20 cm soil depth in 2001 were as follows: sand (2–0.02 mm), silt (0.02–0.002 mm), and clay (<0.002 mm) were 82.72%, 14.34%, and 3.05%, respectively; soil hydrogen ion concentration (pH) and electrical conductivity (EC) were 8.05 and 360.01 μs cm−1, respectively; and soil organic carbon (SOC), total nitrogen (TN), and available phosphorus (AP) were 7.94 g kg−1, 1.04 g kg−1, and 15.78 mg kg−1, respectively.
The native vegetation in the study site mainly consists of Phragmites communis (Cav.) Trin. ex Steud. and Suaeda salsa (L.) Pall. In 2001, a large part of native vegetation was reclaimed for new cultivated land [19]. The newly cultivated vegetation primarily consists of wheat (Triticum aestivum L.), maize (Zea may L.), and alfalfa (Medicago sativa L.), resulting in a total of three land use patterns (alfalfa artificial grassland: AG, wheat–maize rotation field: WM, and native grassland: PC). The winter wheat was sown in October and harvested in June next year. The fertilizer amounts applied were 240 kg N hm−2, 120 kg P2O5 hm−2, and 90 kg K2O hm−2. The summer maize was sown in mid-June and harvested in late September, and the fertilizer amounts of N, P2O5, and K2O were 225 kg hm−2, 75 kg hm−2, and 90 kg hm−2, respectively. All the wheat and maize straw was returned to the fields. The alfalfa, as leguminous forage, is an important source of green forage that is harvested four times each year: May, July, August, and October. It did not receive any fertilization.

2.2. Experimental Design and Sampling Method

In 2001, we established nine plots measuring 20 × 20 m2 for each land use type with relatively flat surfaces, similar physiographical units, and slope gradients. The distance between each plot was greater than the spatial correlation of most soil physicochemical and microbial characteristics (<13.5 m) [20].
A field survey was conducted in mid-June 2020 (after the winter wheat was harvested). This time was chosen to reduce the impact of fertilizer application on soil nutrient determination and to better demonstrate the total effect of land use patterns on the soil. Soil samples were collected using the “S” shape sampling method, with five quadrats measuring 1 × 1 m2 selected in each plot. Within each quadrat, we positioned fifteen soil sampling drills (8 cm diameter), located at the center and the four diagonal corners, at three soil depths: 0–20, 20–40, and 40–60 cm. The selection of the 20 cm depth interval was based on common tillage practices in China. Soil samples from the same layer in each plot were mixed to generate a representative soil sample. These mixed soil samples were then transported to the laboratory. After removing roots and stones, the samples were divided into two parts. One part was preserved in the refrigerator at −80 °C for enzymatic activity, ammonium nitrogen (NH4+-N), and nitrate nitrogen (NO3-N) analysis. The other part of the soil samples was screened with 0.15 mm and 2 mm sieves, respectively, after drying and crushing, to assess soil properties. Soil bulk density (BD) was measured at the 0–20, 20–40, and 40–60 cm soil depths of each quadrat, using a cutting ring with 100 cm3 volume. The undisturbed soil was collected in 0–20, 20–40, and 40–60 cm soil depths of each quadrat with aluminum boxes for the content of water stable aggregate (WSA).

2.3. Laboratory Analysis

The BD was determined by the drying method using 105 °C over oven drying for 24 h to constant weight. The content of WSA was determined using the wet sieve method with a soil aggregate analyzer (TTF-100, Shunlong experimental instrument factory, Shanghai, China). The enzyme activities were determined following the method described by Deforest et al. [21]. We determined the enzyme activities of β-1,4-glucosidase (βG), β-1,4-N-acetyl-glucosaminidase (NAG), L-leucine aminopeptidase (LAP), and alkaline phosphatase (ALP) by fluorogenic enzyme substrates. This method involves incubation in 96-well plates (25 °C, 4 h) and quantifying the enzyme activity using a microplate reader (Synergy HTX, BioTek Instruments, Inc., Wilmington, DE, USA). Soil NH4+-N and NO3-N contents were analyzed using a continuous flow injection analyzer (AA3-A001-02E, SEAL Analytical Limited, Norderstedt, Germany) after extracting 3 g of fresh soil with 25 mL of 1 mol L−1 KCl solution for 30 min. Soil pH was measured using a pH meter (Sartorius PB-10, Sartorius AG, Gottingen, Germany) at a water–soil ratio of 2.5:1. Soil EC was determined using a conductivity meter (DDS-307, Shanghai Ousto Industrial Corp., Shanghai, China) at a water–soil ratio of 5:1. Soil total carbon (TC) contents were measured using an element analyzer (ECS4024, Costech Analytical Technologies, Inc., Valencia, CA, USA) after wrapping 0.2 g of dry soil sample with tin paper. The contents of SOC and soil TN were determined by the potassium dichromate external heating method and Kjeldahl method, after weighing 0.1 g and 1 g of dry soil sample, respectively. Soil total phosphorus (TP) and soil AP contents were determined using the Mo-Sb colorimetric method with an ultraviolet spectrophotometer (UV-5500, Shanghai Metash Instruments Co., Ltd., Shanghai, China) at 700 nm wavelength. For TP analysis, 0.5 g of dry soil sample was digested with HClO4-H2SO4. For AP analysis, 2 g of dry soil sample was extracted with 40 mL of 0.5 mol L−1 NaHCO3 solution for 30 min [22].

2.4. Data Calculation

Soil C:N, C:P, and N:P were calculated by the Formulas (1)–(3)
S o i l   C : N   r a t i o = T C ÷ T N
S o i l   C : P   r a t i o = T C ÷ T P
S o i l   N : P   r a t i o = T N ÷ T P
Enzyme C:N, C:P, and N:P were calculated by the Formulas (4)–(6)
E n z y m e   C : N   r a t i o = l n   β G ÷ l n   ( N A G + L A P )
E n z y m e   C : P   r a t i o = l n   β G ÷ l n   A L P
E n z y m e   N : P   r a t i o = l n   ( N A G + L A P ) ÷ l n   A L P
The vector analysis of enzyme activity is employed to assess the relative nutrient limitation. The relatively long vector length (VL) indicates the greater C limitation of soil microorganisms, and the vector angle (VA) < 45° or > 45° indicates the relative degree of N or P limitation of soil microorganisms, respectively. The VL and VA are calculated by the Formulas (7) and (8) [23].
V L = [ ( E n z y m e   C : N   r a t i o ) 2 + ( E n z y m e   C : P   r a t i o ) 2 ] 1 2
V A = D e g r e e s { A T A N 2 [ ( E n z y m e   C : P   r a t i o ) , ( E n z y m e   C : N   r a t i o ) ] }
The mean weight diameter (MWD) is calculated by the Formula (9) [24].
M W D = i = 1 n D i × W i
where Di is the mean particle size of the i-th level aggregate (mm); Wi is the mass percentage of the i-th level aggregate (%).

2.5. Statistical Analysis

All data in this study underwent assessment for normal distribution and homogeneity of variance. To determine the effects of different land use patterns on soil physicochemical properties and enzyme activities (n = 9), one-way analysis of variance (ANOVA) followed by least significant difference post hoc tests (LSD, α = 0.05) were employed. Regression analysis was used to establish the relationship between soil stoichiometry and enzyme stoichiometry. All the analyses above were conducted using SPSS 23 (International Business Machines Corporation, Armonk, NY, USA), and the figures were generated by Origin 2018 (OriginLab, Northampton, MA, USA). For path analysis, we constructed a basic model utilizing the SPSS AMOS plug-in (International Business Machines Corporation, Armonk, NY, USA), which was based on Pearson correlation, regression analysis, Redundancy analysis (RDA) (Supplementary Materials), and theoretical knowledge. The partial least squares path model (PLS-PM) was employed to fit the data to the basic model. The path analysis model was evaluated using the non-significant chi-square test (χ2), goodness-of-fit index (GFI), and root mean square error of approximation (RMSEA). We iteratively repeated these steps and optimized the model until the χ2 and RMSEA reached their minimum values, and the GFI exceeded 0.9, indicating a satisfactory fit for the final path analysis.

3. Results

3.1. Effects of Different Land Use Patterns on Soil Physical and Chemical Properties

Among the three land uses, AG was more conducive to improving the physical structure of soils in the YRD (Table 1). Compared to WM and PC, AG significantly increased the MWD from 32.69% to 63.27%. The WSA content of AG was mainly concentrated at >0.5 mm, and the content of macroaggregates (WSA > 0.25 mm) in AG was significantly higher than that in WM and PC.
Soil pH ranged from 8.37 to 8.64 for the three land use patterns. (Table 2). Soil pH increased for all land use patterns from 2001, ranging from 3.98% to 5.84%. In two artificial land use patterns, AG and WM, AG was more beneficial in reducing soil EC by an average of 13.29%. In 0–20 cm soil depth, AG and PC decreased soil EC by 4.69% and 17.32%, respectively, compared to 2001. However, WM increased the soil EC by 18.92%. The SOC, NH4+-N, NO3-N, and AP contents were significantly higher in AG and WM than in PC. Moreover, AG was more effective than WM in increasing the contents of NH4+-N and NO3-N. Specifically, NH4+-N contents in the 20–40 cm and 40–60 cm soil depths, and NO3-N contents in the 0–20 cm soil depth of AG were significantly higher than those of WM, exhibiting increases of 9.58%, 13.36%, and 15.06%, respectively.

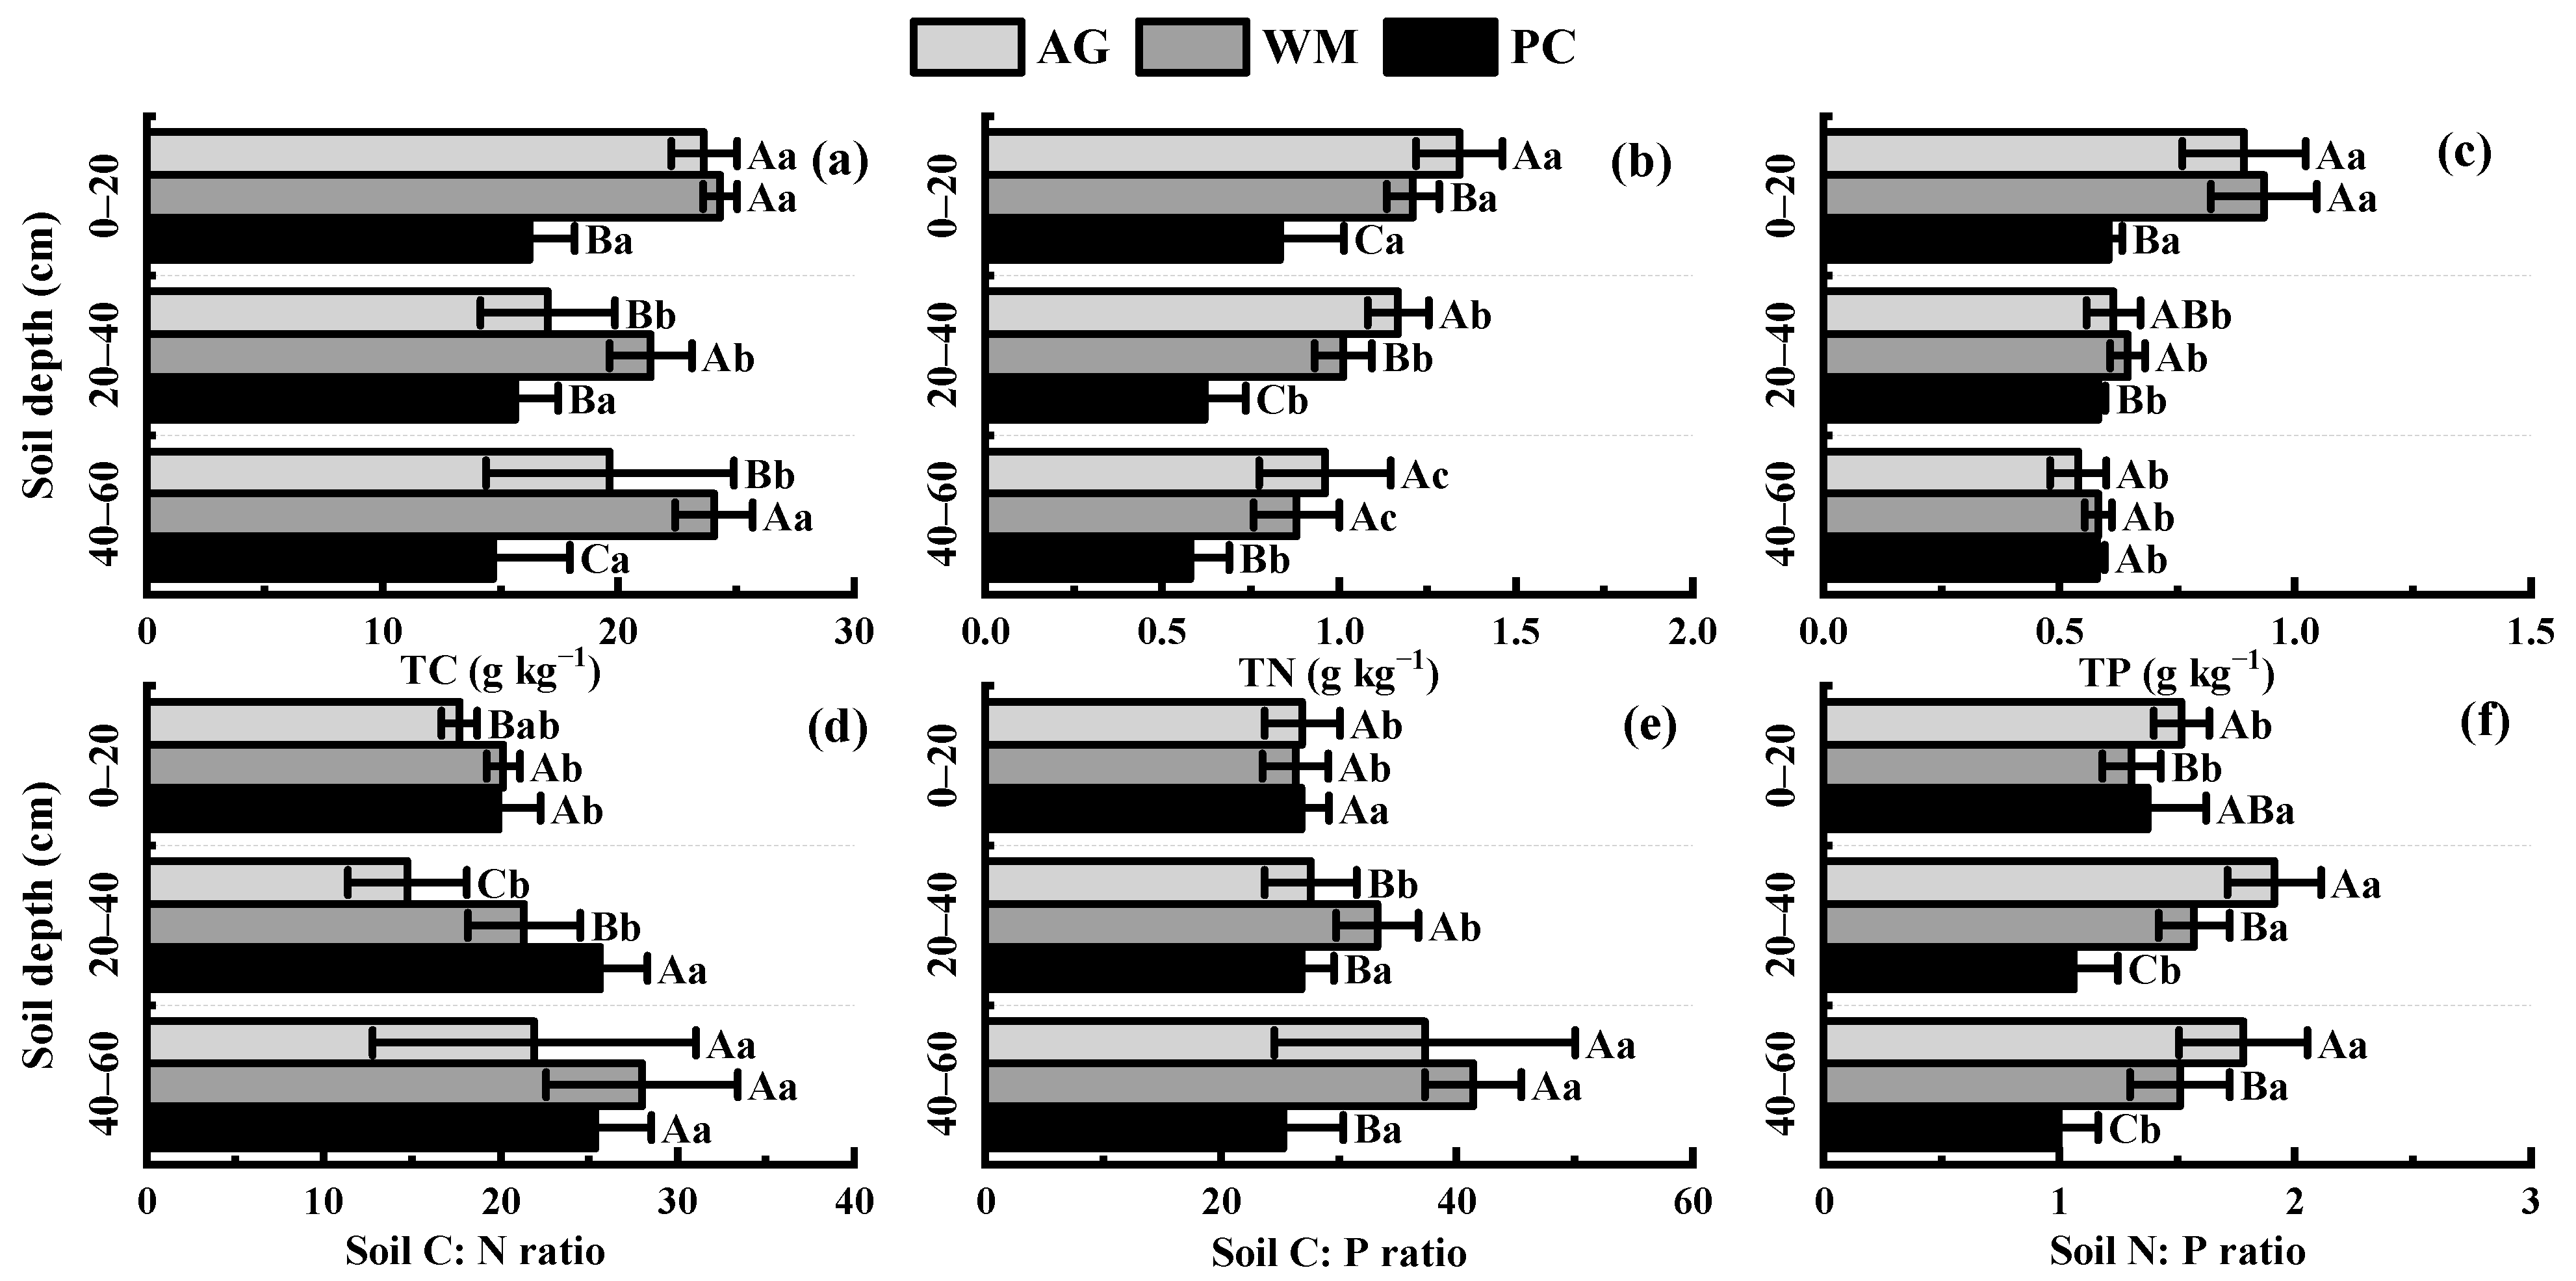
3.2. Effects of Different Land Use Patterns on Soil Stoichiometry

The WM increased TC content by an average of 17.05% and 50.05% compared to AG and PC, respectively (Figure 1). The TN content of AG was significantly higher than that of WM and PC in the 0–40 cm soil depth, with an average increase of 13.21% and 74.69%, respectively. The TP content of AG and WM in the 0–20 cm soil depth was significantly higher than that of PC, with an increase of 47.57% and 54.60%, respectively.
The mean soil stoichiometric ratios of AG, WM, and PC were 31.32:1.74:1, 34.05:1.46:1, and 26.58:1.14:1, respectively (Figure 1). Soil C:N ratios were lower in AG than in WM and PC, with significant differences at 0–40 cm soil depth. This indicates that AG has higher C mineralization than WM and PC. The soil N:P ratios of AG were significantly higher than those of WM and PC in each soil depth. This indicates that aboveground vegetation in AG is more limited by P than in WM and PC.

3.3. Effects of Different Land Use Patterns on Soil Enzyme Activity and Enzyme Stoichiometry

The βG enzyme activity of AG increased by an average of 19.40% and 108.33% compared to WM and PC, respectively (Figure 2). Similarly, the NAG enzyme activity of AG was increased by 36.93% and 49.99% above the average of WM and PC, respectively. The LAP enzyme activity of WM was significantly higher than that of AG and PC, with increases ranging from 29.85% to 61.71%. AG increased ALP enzyme activity by an average of 25.92% and 43.01% compared to WM and PC at 0–40 cm soil depth. At 40–60 cm soil depth, the ALP enzyme activity of WM was significantly higher than that of AG and PC by 63.90% and 69.74%, respectively.
The mean enzyme stoichiometric ratios of AG, WM, and PC were 0.96:0.76:1, 0.94:0.74:1, and 0.86:0.73:1, respectively (Figure 2). All land uses had enzyme C:N ratios greater than 1, enzyme C:P and N:P ratios less than 1, and VA greater than 45°. The enzyme stoichiometry showed that soil microorganisms were limited by C and P. At 0–40 cm soil depth, PC had significantly lower VL values, reduced by 8.55% and 8.32% compared to AG and WM, respectively.

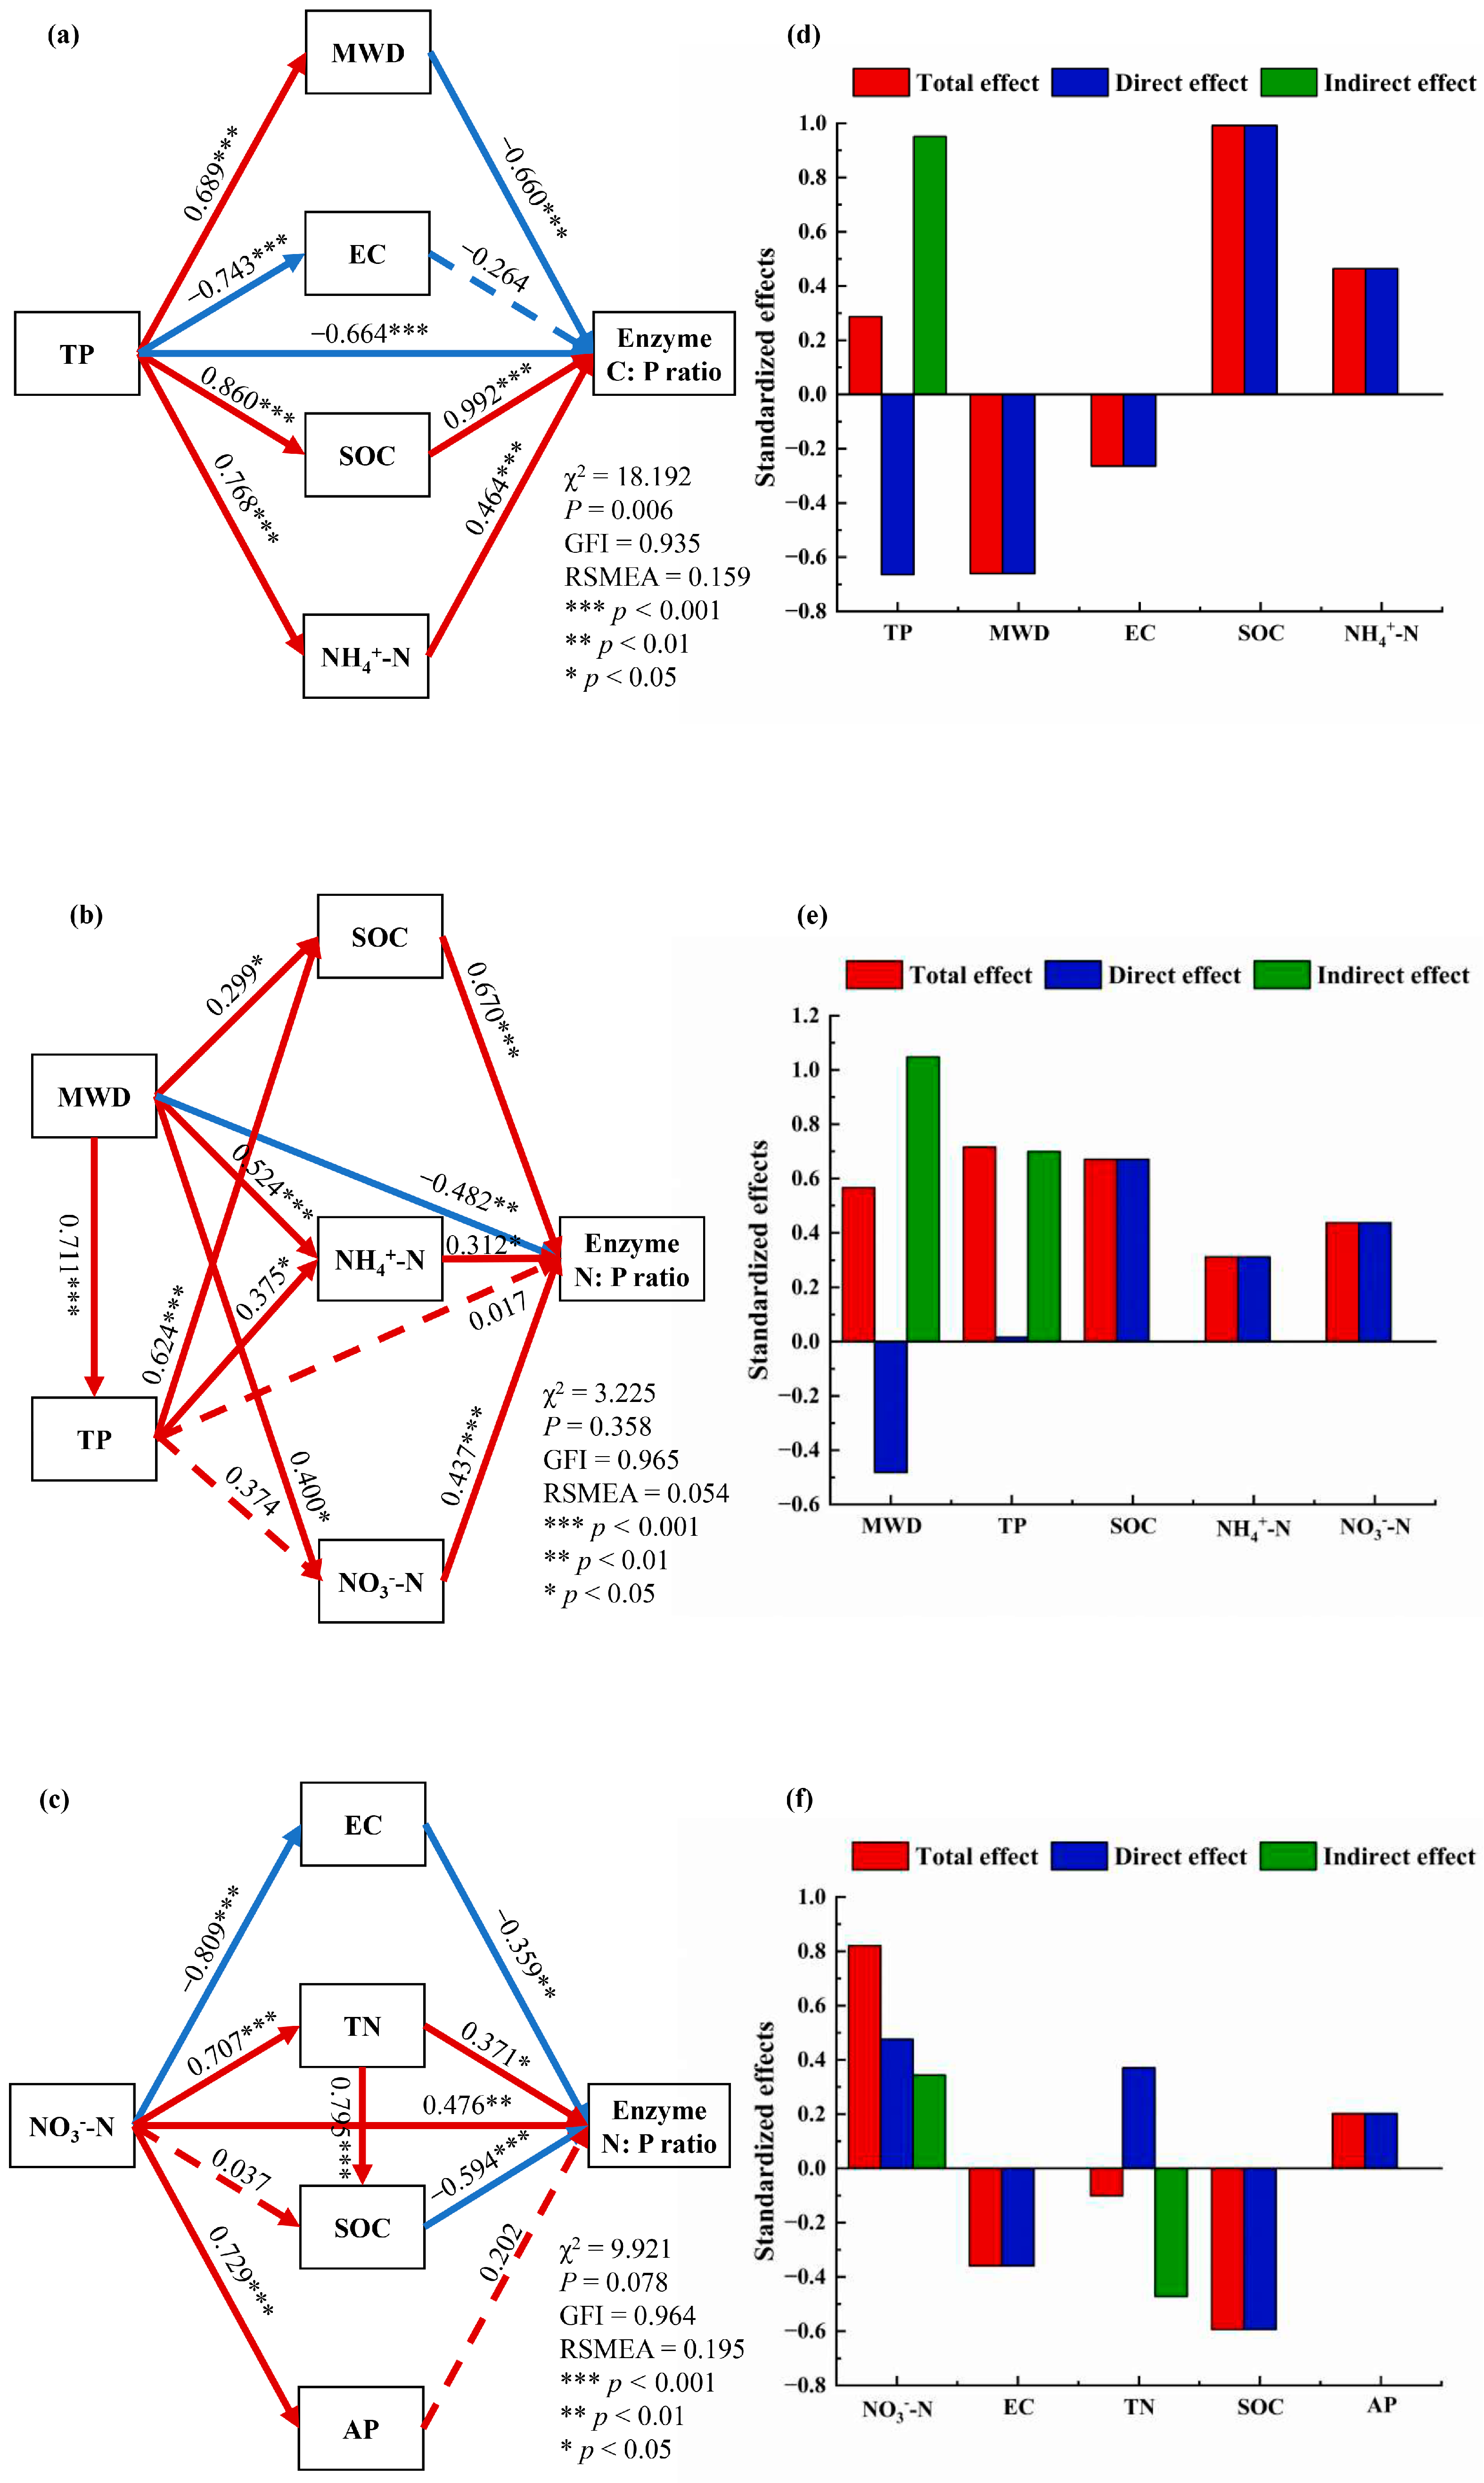
3.4. Factors Influencing Enzyme Stoichiometry in Three Land Use Patterns

Soil C:N:P ratios and enzyme C:N:P ratios were significantly correlated at 0–20, 20–40, and 40–60 cm soil depths for all three land uses (Figure 3). These findings indicate that enzyme stoichiometry is influenced by nutrient availability. Based on Figure 3 and Figure S1, we identified that the key driving factors in AG, WM, and PC are TP, TP, and WSA (2–1 mm), and NO3-N, respectively, and constructed the basic theoretical framework for path analysis. We replaced the WSA content with MWD to simplify the model.
In the AG, TP drove the ecological stoichiometric balance through a positive total effect on the enzyme C:P ratio, but its direct effect was negative (Figure 4a). This is because the increased TP caused an increased SOC and NH4+-N, leading to a positive indirect effect (Figure 4d). In the WM (Figure 4b,e), both MWD and TP showed positive total effects by driving the enzyme N:P ratio to promote ecological stoichiometric balance. Although MWD exhibited a negative direct effect on the enzyme N:P ratio, its higher positive indirect effect on the enzyme N:P ratio contributed to the overall positive total effect. In the PC, the ecological stoichiometric balance was mainly driven by the positive total, direct, and indirect effects of NO3-N on the enzyme N:P ratio (Figure 4c,f).

4. Discussion

4.1. Ecological Stoichiometry Reveals the Nutrient Limitation of Three Land Use Patterns in the YRD

Ecological stoichiometry is an important tool for exploring vegetation and soil microbial nutrient limitations, including soil and enzyme stoichiometry. The soil C:N:P ratio is a vital indicator reflecting vegetation nutrient limitations. This study presents the average soil C:N:P ratios for AG, WM, and PC as follows: 31.32:1.74:1, 34.05:1.46:1, and 26.58:1.14:1, respectively. Comparing these ratios to the global grassland soil stoichiometry (C:N:P = 169:12:1), the global farmland soil stoichiometry (C:N:P = 64:5:1), and the average soil stoichiometry of China (C:N:P = 60:5:1), it is evident that the three land use patterns of the YRD exhibit lower levels of soil C and N [25,26]. The soil N:P ratio serves as a crucial indicator of nutrient limitations in aboveground vegetation. When the soil N:P ratio is below 14, the aboveground vegetation becomes N-limited [27]. The increasing soil N:P ratio indicates that the P limitation on aboveground vegetation is also increasing [12]. In our study, the soil N:P ratios followed the order AG > WM > PC and were all below 14. Therefore, the aboveground vegetation growth of the three land use patterns in the YRD was limited by N, with AG being more limited by P compared to WM and PC.
The enzyme stoichiometry is used to indicate the nutritional needs of microorganisms and converges to 1:1:1 globally [15]. Following the perspective that microorganisms optimize the allocation of resources to obtain the most limited resources, a higher investment in enzyme activity for C, N, or P implies an increased demand for the respective nutrient [23]. In this study, soil microorganisms of the three land uses were mainly limited by C and P. The direct reason for the C limitation of soil microorganisms in the YRD is the reduction of vegetation biomass due to salinization, which causes a reduction in soil C input. The indirect reason is the loss of soil C and N due to poor physical structure, leading to a decrease in soil C content and stability [28]. Soil P mainly comes from the weathering of primary minerals and cannot be acquired largely from soil [29]. Moreover, in saline-alkali soil, the adsorption of calcium and magnesium ions and the consumption of plants will lead to the decline of P bioavailability [22]. These factors explain the general limitation of soil microorganisms by P in the YRD.
Overall, nutrient limitation in the YRD is caused by the complex combination of processes. First, salinization reduces soil C input and stability, which leads to soil microbial C limitation. Second, low C levels reduce the energy source for microbes to carry out N and P mineralization. This caused the YRD to show lower soil C:N and C:P ratios than the world and Chinese average soil stoichiometry, reducing soil N and P availability [30]. Similarly, soil N:P ratios in the YRD were lower than world and Chinese averages and below 14, resulting in above-ground vegetation being more N-limited. Finally, plants, especially alfalfa, compete with soil microorganisms for P utilization. This makes the enzyme C:P and N:P ratios greater than 1, and the greatest limiting factor for microorganisms becomes P [31]. Therefore, our hypothesis 1 is verified.

4.2. Response of Soil Nutrients and Their Availability to Land Use Patterns

Studying the impact of different land use patterns on soil nutrient content and their availability, considering the nutrient limitation of the YRD, is crucial for mitigating local soil degradation [32]. Among the three land use patterns, WM was more conducive to increasing soil TC content, AG was more conducive to promoting soil C mineralization, and PC was more conducive to alleviating soil microbial C limitation. This is because reasonable N management and straw return can promote soil C sequestration in the WM [33,34]. AG has low soil C input due to frequent mowing, which leads to low soil TC content [35]. Conversely, AG promotes an increase in BG enzyme activity and soil macroaggregates, and TC in macroaggregates is more susceptible to decomposition by microorganisms [36]. This enables AG to promote soil TC decomposition and accelerate soil C turnover. The research showed that soil microorganisms promote enzyme stoichiometry convergence to 1:1:1 in the long-term absence of anthropogenic disturbances, which makes the PC beneficial for mitigating soil microbial C limitation [37,38].
In this study, AG was beneficial in increasing soil N content and its availability compared to WM and PC. These findings align with previous research conclusions. [39]. Leguminous forage, such as alfalfa, contributed approximately 40–70 kg N hm−2 per quarter [40], and continuous cultivation of alfalfa promotes N mineralization and enhances N availability [39]. P plays a crucial role in the energy transformation of rhizobia, making leguminous forages such as alfalfa require more P than traditional crops [41]. However, the TP content of AG was not significantly different from that of WM but significantly higher than that of PC in 0–20 cm soil depth. This is attributed to the root system of alfalfa, which promotes P migration from deeper to shallower soil depths [42]. Meanwhile, AG was conducive to increasing soil P effectiveness in the 0–20 cm soil depth. This is because alfalfa increases soil microbial biomass and competes with soil microorganisms for P acquisition, resulting in more ALP being produced [43].
We also found that different land uses indirectly affect soil nutrients and their availability by altering soil EC values and aggregates. This similarly led to differences in the soil degradation mitigation by different land uses. This is because macroaggregates are thought to play an important role in improving soil stability and nutrient retention [44]. Soil EC significantly affects the soil microbial abundance and activity, which influences soil nutrient cycling [45]. In this study, AG significantly increased MWD compared to other land uses. This is because AG has more root biomass and root exudates, which can provide an important binder for soil aggregates and promote soil macroaggregate formation [46]. This makes AG have higher nutrient availability. WM had a negative effect on soil EC in the YRD. The reason is that N fertilizer application causes a large accumulation of nitrate ions, which dissociates the cations on the soil colloids into the soil solution, thereby increasing soil salinity [47]. AG and PC were more beneficial in reducing soil EC, but this was due to different reasons. AG reduces soil evaporation and inhibits salt accumulation from groundwater sources due to higher ground cover [48]. In contrast, PC is because Phragmites communis (Cav.) Trin. ex Steud. and Suaeda salsa (L.) Pall. can reduce soil salt content by storing excess salts in their stems or leaves [49]. This enables AG and PC to provide environmental conditions for increasing soil microbial abundance and activity, thus indirectly improving soil nutrient cycling. Hypothesis 2 of this study was verified, i.e., different land use patterns have different advantages to alleviate nutrient limitation in the YRD.

4.3. Ecological Stoichiometry Guides Land Use Patterns in the YRD

There was a significant linear correlation between soil stoichiometry and enzyme stoichiometry in this study. This indicates that the enzyme stoichiometry of land use patterns in the YRD depends on and is driven by nutrients [50]. According to RDA analysis (Figure S1), the main driving factors of community variation in AG, WM, and PC were TP, TP, and WSA (2–1 mm), and NO3--N, respectively. Based on the above results, we constructed a path analysis model to analyze the potential mechanisms for optimizing land use.
We found that TP, the community driver of AG, drives stoichiometric balance through a positive total effect on enzyme C:P ratio, due to the enzyme C:P ratios of AG being less than 1. Three mechanisms are regulating this process. First, the increase in TP promotes the development of alfalfa rhizobia and root systems [51]. The greater biomass and exudates from the alfalfa root system contribute to soil aggregate stabilization and the formation of macroaggregates [46]. Meanwhile, the extensive root system facilitates the leaching of salts [52]. These processes collectively increase microbial abundance, stimulate extracellular enzyme synthesis, and promote stoichiometric balance [53]. Secondly, alfalfa competes with soil microorganisms for P acquisition [54]. TP increases the otherwise limited substrate, which can reduce the difficulty of P acquisition by soil microorganisms and thus reduce the enzyme C:P ratio [23]. Finally, the increase in P will incline soil microorganisms to acquire other nutrients that are difficult to obtain, such as C and N. This is especially true for C, since soil microbes in the YRD are limited by C and P. This ultimately leads to a positive indirect effect of TP on the enzyme C:P ratio.
The community drivers of WM, MWD, and TP drive stoichiometric balance through positive indirect effects on the enzyme N:P ratio. The increase in MWD improves the soil physical structure and reduces N loss, which has a positive indirect effect on the enzyme N:P ratio [55]. However, the increase in MWD at low nutrient levels makes soil microorganisms more inclined to utilize SOC, which has a negative indirect effect on the enzyme N:P ratio [56]. Although MWD has a negative effect on the enzyme N:P ratio of WM, this is only a short-term effect at low nutrient levels. Therefore, we do not recommend frequent soil disturbance in the wheat–maize rotation, as it can lead to the destruction of mycelium and reduced fungal biomass, ultimately resulting in increased soil degradation [57,58]. The direct effect of TP on the enzyme N:P ratio is minimal, and its primary role is to alleviate microbial P limitation, thereby increasing the enzyme N:P ratio [16]. The community driver of PC, NO3-N, drives stoichiometric balance through positive direct and indirect effects on the enzyme N:P ratio, and the direct effect is greater than the indirect effect. Yang et al. [59] demonstrated that soil N and P levels in naturally restored grassland are low and the nutrient limitation of soil microorganisms shifts from P to N with increasing restoration years. Thus, optimizing the PC requires mitigating the N limitation.

5. Conclusions

In summary, AG is suitable for long-term cultivation in the YRD to mitigate local soil degradation. It facilitates the reduction of salinity content, improves soil structure, increases microbial abundance, and enhances nutrient availability, which is more conducive to the ecological stoichiometry balance in the YRD. However, it is important to artificially increase soil phosphorus content and appropriately reduce mowing frequency to optimize the benefits of AG. WM can increase soil carbon sequestration, but frequent soil disturbance leads to lower MWD. Meanwhile, WM cannot improve the salinity issues of the YRD. Consequently, it may not be the ideal approach for mitigating soil degradation in the region. Instead, it can be considered as part of a crop rotation or intercropping strategy to enhance soil C sequestration, with careful attention given to minimizing soil disturbance. PC has the advantage of alleviating microbial C limitation due to the absence of anthropogenic disturbance. However, PC typically exhibits low nutrient levels, necessitating the artificial enhancement of soil N content. Therefore, naturally restored grasslands in the YRD are not recommended for mitigating soil degradation. In the future, we need to further investigate the effects of the composite agricultural model on ecological stoichiometry. Meanwhile, we need to pay more attention to the effects of different agricultural models on soil pH, salinity, and physical structure to provide a better theoretical basis for mitigating soil degradation in the YRD.

Supplementary Materials

The following supporting information can be downloaded at: https://www.mdpi.com/article/10.3390/agronomy13112744/s1, Supplementary materials have been submitted with the manuscript, including Figure S1: Redundancy analysis (RDA) showing the relationships between enzyme activity and enzyme stoichiometry with soil physicochemical properties and soil stoichiometry and Table S1: Soil physicochemical property data.

Author Contributions

B.K.: conceptualization, data curation, formal analysis, investigation, writing—original Draft, writing—review and editing. T.Z.: investigation. Y.M.: investigation. S.J. (Sen Jia): investigation. C.L.: investigation, writing—review and editing. F.W.: investigation. Z.D.: investigation, resources. S.J. (Shuying Jiao): funding acquisition, project administration, resources, supervision, writing—review and editing. Y.L.: funding acquisition, project administration, resources. L.S.: investigation, resources. All authors have read and agreed to the published version of the manuscript.

Funding

This study was supported by the Natural Science Foundation of Shandong Province, China (ZR2020MC173), National Key Research and Development Project of China (2017YFD0800602, 2018YFD0800403), and Forestry Science and Technology Innovation Project of Shandong Province (2019LY005–03).

Data Availability Statement

The data presented in this study are available in Supplementary Material.

Conflicts of Interest

The authors declare no conflict of interest.

References

  1. Song, C.J.; Song, J.R.; Wu, Q.; Shen, X.J.; Hu, Y.W.; Hu, C.H.; Li, W.H.; Wang, Z.H. Effects of applying river sediment with irrigation water on salinity leaching during wheat-maize rotation in the Yellow River Delta. Agric. Water Manag. 2023, 276, 108032. [Google Scholar] [CrossRef]
  2. Zhang, X.J.; Wang, G.Q.; Xue, B.L.; Zhang, M.X.; Tan, Z.X. Dynamic landscapes and the driving forces in the Yellow River Delta wetland region in the past four decades. Sci. Total Environ. 2021, 787, 147644. [Google Scholar] [CrossRef] [PubMed]
  3. Cui, Q.; Xia, J.B.; Yang, H.J.; Liu, J.T.; Shao, P.S. Biochar and effective microorganisms promote Sesbania cannabina growth and soil quality in the coastal saline-alkali soil of the Yellow River Delta, China. Sci. Total Environ. 2021, 756, 143801. [Google Scholar] [CrossRef]
  4. Li, Y.F.; Li, Q.Y.; Liu, H.S.; Li, S.J.; Wang, Y.J.; Liu, Y. Ecological stoichiometry-based study of the influence of soil saline-alkali stress on nutrient homeostasis in L. chinensis. Ecotoxicol. Environ. Saf. 2018, 165, 243–249. [Google Scholar] [CrossRef] [PubMed]
  5. Li, Y.; Kang, E.; Song, B.; Wang, J.; Zhang, X.; Wang, J.; Li, M.; Yan, L.; Yan, Z.; Zhang, K.; et al. Soil salinity and nutrients availability drive patterns in bacterial community and diversity along succession gradient in the Yellow River Delta. Estuar. Coast. Shelf Sci. 2021, 262, 107621. [Google Scholar] [CrossRef]
  6. Tully, K.L.; Weissman, D.; Wyner, W.J.; Miller, J.; Jordan, T. Soils in transition: Saltwater intrusion alters soil chemistry in agricultural fields. Biogeochemistry 2019, 142, 339–356. [Google Scholar] [CrossRef]
  7. Zhai, Z.F.; Luo, M.; Yang, Y.; Liu, Y.X.; Chen, X.; Zhang, C.W.; Huang, J.F.; Chen, J. Trade-off between microbial carbon use efficiency and microbial phosphorus limitation under salinization in a tidal wetland. Catena 2022, 209, 105809. [Google Scholar] [CrossRef]
  8. Meng, L.; Qu, F.Z.; Bi, X.L.; Xia, J.B.; Li, Y.Z.; Wang, X.H.; Yu, J.B. Elemental stoichiometry (C, N, P) of soil in the Yellow River Delta nature reserve: Understanding N and P status of soil in the coastal estuary. Sci. Total Environ. 2021, 751, 141737. [Google Scholar] [CrossRef]
  9. Jin, Q.; Wang, C.; Sardans, J.; Vancov, T.; Fang, Y.Y.; Wu, L.Q.; Huang, X.T.; Gargallo-Garriga, A.; Wang, W.Q. Effect of soil degradation on the carbon concentration and retention of nitrogen and phosphorus across Chinese rice paddy fields. Catena 2022, 209, 105810. [Google Scholar] [CrossRef]
  10. Ma, D.L.; Huang, Q.J.; Liu, B.Z.; Zhang, Q. Analysis and Dynamic Evaluation of Eco-Environmental Quality in the Yellow River Delta from 2000 to 2020. Sustainability 2023, 15, 7835. [Google Scholar] [CrossRef]
  11. Muhammad, Q.; Huang, J.; Waqas, A.; Muhammad, A.; Li, D.C.; Zulqarnain, H.K.; Gao, J.S.; Liu, S.J.; Zhang, H.M. Linkages between ecoenzymatic stoichiometry and microbial community structure under long-term fertilization in paddy soil: A case study in China. Appl. Soil Ecol. 2021, 161, 103860. [Google Scholar] [CrossRef]
  12. Xiao, L.; Liu, G.B.; Li, P.; Xue, S. Ecological stoichiometry of plant-soil-enzyme interactions drives secondary plant succession in the abandoned grasslands of Loess Plateau, China. Catena 2021, 202, 105302. [Google Scholar] [CrossRef]
  13. Shi, L.J.; Li, Q.K.; Fu, X.L.; Kou, L.; Dai, X.Q.; Wang, H.M. Foliar, root and rhizospheric soil C:N:P stoichiometries of overstory and understory species in subtropical plantations–ScienceDirect. CATENA 2020, 198, 105020. [Google Scholar] [CrossRef]
  14. Nannipieri, P.; Trasar-Cepeda, C.; Dick, R.P. Soil enzyme activity: A brief history and biochemistry as a basis for appropriate interpretations and meta-analysis. Biol. Fertil. Soils 2018, 54, 11–49. [Google Scholar] [CrossRef]
  15. Sinsabaugh, R.L.; Lauber, C.L.; Weintraub, M.N.; Ahmed, B.; Zeglin, L.H. Stoichiometry of soil enzyme activity at global scale. Ecol. Lett. 2008, 11, 1252–1264. [Google Scholar] [CrossRef] [PubMed]
  16. He, Q.Q.; Wu, Y.H.; Bing, H.J.; Zhou, J.; Wang, J.P. Vegetation type rather than climate modulates the variation in soil enzyme activities and stoichiometry in subalpine forests in the eastern Tibetan Plateau. Geoderma 2020, 374, 114424. [Google Scholar] [CrossRef]
  17. Singh, J.; Kumar, S. Responses of soil microbial community structure and greenhouse gas fluxes to crop rotations that include winter cover crops. Geoderma 2021, 385, 114843. [Google Scholar] [CrossRef]
  18. Li, L.; Liu, Y.; Xiao, T.H.; Hou, F.J. Different responses of soil C:N:P stoichiometry to stocking rate and nitrogen addition level in an alpine meadow on the Qinghai-Tibetan Plateau. Appl. Soil Ecol. 2021, 165, 103961. [Google Scholar] [CrossRef]
  19. Jiao, S.Y.; Zhang, M.; Wang, Y.M.; Liu, J.Q.; Li, Y.Q. Variation of soil nutrients and particle size under different vegetation types in the Yellow River Delta. Acta Ecol. Sin. 2014, 34, 148–153. [Google Scholar] [CrossRef]
  20. Jiao, S.Y.; Li, J.R.; Li, Y.Q.; Jia, J.W.; Xu, Z.Y. Soil C, N, and P distribution as affected by plant communities in the Yellow River Delta, China. PLoS ONE 2019, 14, e0226887. [Google Scholar] [CrossRef]
  21. Deforest, J.L. The influence of time, storage temperature, and substrate age on potential soil enzyme activity in acidic forest soils using MUB-linked substrates and l-DOPA. Soil Biol. Biochem. 2009, 41, 1180–1186. [Google Scholar] [CrossRef]
  22. Zhang, W.; Xu, Y.D.; Gao, D.X.; Wang, X.; Liu, W.C.; Deng, J.; Han, X.H.; Yang, G.H.; Feng, Y.Z.; Ren, G.; et al. Ecoenzymatic stoichiometry and nutrient dynamics along a revegetation chronosequence in the soils of abandoned land and Robinia pseudoacacia plantation on the Loess Plateau, China. Soil Biol. Biochem. 2019, 134, 1–14. [Google Scholar] [CrossRef]
  23. Bai, X.J.; Dippold, M.A.; An, S.S.; Wang, B.R.; Zhang, H.X.; Loeppmann, S. Extracellular enzyme activity and stoichiometry: The effect of soil microbial element limitation during leaf litter decomposition. Ecol. Indic. 2021, 121, 107200. [Google Scholar] [CrossRef]
  24. Guo, M.M.; Wang, W.L.; Kang, H.L.; Yang, B.; Li, J.M. Changes in soil properties and resistance to concentrated flow across a 25-year passive restoration chronosequence of grasslands on the Chinese Loess Plateau. Restor. Ecol. 2020, 28, 104–114. [Google Scholar] [CrossRef]
  25. Cleveland, C.C.; Liptzin, D. C:N:P stoichiometry in soil: Is there a “Redfield ratio” for the microbial biomass? Biogeochemistry 2007, 85, 235–252. [Google Scholar] [CrossRef]
  26. Zheng, S.M.; Xia, Y.H.; Hu, Y.J.; Chen, X.B.; Rui, Y.C.; Gunina, A. Stoichiometry of carbon, nitrogen, and phosphorus in soil: Effects of agricultural land use and climate at a continental scale. Soil Tillage Res. 2021, 209, 104903. [Google Scholar] [CrossRef]
  27. Xi, G.; Jiang, Y.F. Spatial characteristics of ecological stoichiometry and their driving factors in farmland soils in Poyang Lake Plain, Southeast China. J. Soils Sediments 2019, 19, 263–274. [Google Scholar] [CrossRef]
  28. Zhang, K.; Xia, J.B.; Su, L.; Gao, F.L.; Cui, Q.; Xing, X.S.; Dong, M.M.; Li, C.R. Effects of microtopographic patterns on plant growth and soil improvement in coastal wetlands of the Yellow River Delta. Front. Plant Sci. 2023, 14, 1162013. [Google Scholar] [CrossRef]
  29. Zhang, W.; Liu, W.C.; Xu, M.P.; Deng, J.; Han, X.H.; Yang, G.H.; Feng, Y.Z.; Ren, G.X. Response of forest growth to C:N:P stoichiometry in plants and soils during Robinia pseudoacacia afforestation on the Loess Plateau, China. Geoderma 2019, 337, 280–289. [Google Scholar] [CrossRef]
  30. Fei, C.; Zhang, S.R.; Feng, X.H.; Ding, X.D. Organic material with balanced C-nutrient stoichiometry and P addition could improve soil P availability with low C cost. J. Plant Nutr. Soil Sci. 2021, 184, 573–584. [Google Scholar] [CrossRef]
  31. Ji, L.; Tian, C.J.; Kuramae, E.E. Phosphorus-mediated succession of microbial nitrogen, carbon, and sulfur functions in rice-driven saline-alkali soil remediation. Soil Biol. Biochem. 2023, 184, 109125. [Google Scholar] [CrossRef]
  32. Fu, Z.Y.; Wang, P.; Sun, J.K.; Lu, Z.H.; Yang, H.J.; Liu, J.T.; Xia, J.B.; Li, T. Composition, seasonal variation, and salinization characteristics of soil salinity in the Chenier Island of the Yellow River Delta. Glob. Ecol. Conserv. 2020, 24, e01318. [Google Scholar] [CrossRef]
  33. Zhao, Y.; Liang, C.; Shao, S.; Li, J.; Xie, H.T.; Zhang, W.; Chen, F.S.; He, H.B.; Zhang, X.D. Interactive effects of elevated CO2 and nitrogen fertilization levels on photosynthesized carbon allocation in a temperate spring wheat and soil system. Pedosphere 2021, 31, 191–203. [Google Scholar] [CrossRef]
  34. Chen, Q.Y.; Liu, Z.J.; Zhou, J.B.; Xu, X.P.; Zhu, Y.J. Long-term straw mulching with nitrogen fertilization increases nutrient and microbial determinants of soil quality in a maize–wheat rotation on China’s Loess Plateau. Sci. Total Environ. 2021, 775, 145930. [Google Scholar] [CrossRef]
  35. Wang, Y.B.; Wang, D.L.; Shi, B.K.; Sun, W. Differential effects of grazing, water, and nitrogen addition on soil respiration and its components in a meadow steppe. Plant Soil 2020, 447, 581–598. [Google Scholar] [CrossRef]
  36. Yu, P.J.; Liu, S.W.; Han, K.X.; Guan, S.C.; Zhou, D.W. Conversion of cropland to forage land and grassland increases soil labile carbon and enzyme activities in northeastern China. Agric. Ecosyst. Environ. 2017, 245, 83–91. [Google Scholar] [CrossRef]
  37. Topa, D.; Cara, I.G.; Jitareanu, G. Long term impact of different tillage systems on carbon pools and stocks, soil bulk density, aggregation and nutrients: A field meta-analysis. Catena 2021, 199, 105102. [Google Scholar] [CrossRef]
  38. Xiao, L.; Liu, G.B.; Li, P.; Li, Q.; Xue, S. Ecoenzymatic stoichiometry and microbial nutrient limitation during secondary succession of natural grassland on the Loess Plateau, China. Soil Tillage Res. 2020, 200, 104605. [Google Scholar] [CrossRef]
  39. Li, Q.; Zhou, D.W.; Denton, M.D.; Cong, S. Alfalfa monocultures promote soil organic carbon accumulation to a greater extent than perennial grass monocultures or grass-alfalfa mixtures. Ecol. Eng. 2019, 131, 53–62. [Google Scholar] [CrossRef]
  40. Sanginga, N. Role of biological nitrogen fixation in legume based cropping systems; a case study of West Africa farming systems. Plant Soil 2003, 252, 25–39. [Google Scholar] [CrossRef]
  41. Wang, L.L.; Xie, J.H.; Luo, Z.Z.; Niu, Y.N.; Coulter, J.A.; Zhang, R.Z.; Li, L.L. Forage yield, water use efficiency, and soil fertility response to alfalfa growing age in the semiarid Loess Plateau of China. Agric. Water Manag. 2021, 243, 106415. [Google Scholar] [CrossRef]
  42. Song, X.; Fang, C.; Yuan, Z.Q.; Li, F.M.; Sardans, J.; Penuelas, J. Long-term alfalfa (Medicago sativa L.) establishment could alleviate phosphorus limitation induced by nitrogen deposition in the carbonate soil. J. Environ. Manag. 2022, 324, 116346. [Google Scholar] [CrossRef] [PubMed]
  43. Zhang, X.C.; Dippold, M.A.; Kuzyakov, Y.; Razavi, B.S. Spatial pattern of enzyme activities depends on root exudate composition. Soil Biol. Biochem. 2019, 133, 83–89. [Google Scholar] [CrossRef]
  44. Zhang, Y.; Shengzhe, E.; Wang, Y.N.; Su, S.M.; Bai, L.Y.; Wu, C.X.; Zeng, X.B. Long-term manure application enhances the stability of aggregates and aggregate-associated carbon by regulating soil physicochemical characteristics. Catena 2021, 203, 105342. [Google Scholar] [CrossRef]
  45. Haj-Amor, Z.; Araya, T.; Kim, D.G.; Bouri, S.; Lee, J.; Ghiloufi, W.; Yang, Y.R.; Kang, H.; Jhariya, M.K.; Banerjee, A.; et al. Soil salinity and its associated effects on soil microorganisms, greenhouse gas emissions, crop yield, biodiversity and desertification: A review. Sci. Total Environ. 2022, 843, 156946. [Google Scholar] [CrossRef] [PubMed]
  46. Hazra, K.K.; Nath, C.P.; Singh, U.; Praharaj, C.S.; Kumar, N.; Singh, N.P. Diversification of maize-wheat cropping system with legumes and integrated nutrient management increases soil aggregation and carbon sequestration. Geoderma 2019, 353, 308–319. [Google Scholar] [CrossRef]
  47. Wang, Y.; Shi, W.J.; Jing, B. Optimizing brackish water and nitrogen application regimes for soil salinity, yield, fertilizer and water productivity of a mulched drip irrigated cotton cropping system. Field Crops Res. 2023, 302, 109097. [Google Scholar] [CrossRef]
  48. Kakeh, J.; Gorji, M.; Mohammadi, M.H.; Asadi, H.; Khormali, F.; Sohrabi, M. Effect of biocrusts on profile distribution of soil water content and salinity at different stages of evaporation. J. Arid Environ. 2021, 191, 104514. [Google Scholar] [CrossRef]
  49. Guo, R.; Bai, Z.Z.; Zhou, J.; Zhong, X.L.; Gu, F.X.; Liu, Q.; Li, H.R. Tissue physiological metabolic adaptability in young and old leaves of reed (Phragmites communis) in Songnen grassland. Plant Physiol. Biochem. 2018, 128, 99–105. [Google Scholar] [CrossRef]
  50. Qiu, X.C.; Peng, D.L.; Tian, H.X.; Wang, H.B.; Liu, X.; Cao, L.; Li, Z.; Cheng, S. Soil ecoenzymatic stoichiometry and microbial resource limitation driven by thinning practices and season types in Larix principis-rupprechtii plantations in North China. For. Ecol. Manag. 2021, 482, 118880. [Google Scholar] [CrossRef]
  51. He, H.H.; Peng, Q.; Wang, X.; Fan, C.B.; Pang, J.Y.; Lambers, H.; Zhang, X.C. Growth, morphological and physiological responses of alfalfa (Medicago sativa) to phosphorus supply in two alkaline soils. Plant Soil 2017, 416, 556–584. [Google Scholar] [CrossRef]
  52. Xia, J.B.; Ren, J.Y.; Zhang, S.Y.; Wang, Y.H.; Fang, Y. Forest and grass composite patterns improve the soil quality in the coastal saline-alkali land of the Yellow River Delta, China. Geoderma 2019, 349, 25–35. [Google Scholar] [CrossRef]
  53. Blagodatskaya, E.; Khomyakov, N.; Myachina, O.; Bogomolova, I.; Blagodatsky, S.; Kuzyakov, Y. Microbial interactions affect sources of priming induced by cellulose. Soil Biol. Biochem. 2014, 74, 39–49. [Google Scholar] [CrossRef]
  54. Shao, S.; Zhao, Y.; Zhang, W.; Hu, G.Q.; Xie, H.T.; Yan, J.H.; Han, S.J.; He, H.B.; Zhang, X.D. Linkage of microbial residue dynamics with soil organic carbon accumulation during subtropical forest succession. Soil Biol. Biochem. 2017, 114, 114–120. [Google Scholar] [CrossRef]
  55. Han, Y.W.; Jia, Y.F.; Wang, G.A.; Tan, Q.Q.; Liu, X.J.; Chen, C.J. Coupling of soil carbon and nitrogen dynamics in drylands under climate change. CATENA 2023, 221, 106735. [Google Scholar] [CrossRef]
  56. Bhattacharyya, R.; Rabbi, S.M.F.; Zhang, Y.Q.; Young, I.M.; Jones, A.R.; Dennis, P.G.; Menzies, N.W.; Kopittke, P.M.; Dalal, R.C. Soil organic carbon is significantly associated with the pore geometry, microbial diversity and enzyme activity of the macro-aggregates under different land uses. Sci. Total Environ. 2021, 778, 146286. [Google Scholar] [CrossRef] [PubMed]
  57. Li, J.W.; Liu, Y.L.; Hai, X.Y.; Shangguan, Z.P.; Deng, L. Dynamics of soil microbial C:N:P stoichiometry and its driving mechanisms following natural vegetation restoration after farmland abandonment. Sci. Total Environ. 2019, 693, 133613. [Google Scholar] [CrossRef] [PubMed]
  58. Morugán-Coronado, A.; Pérez-Rodríguez, P.; Insolia, E.; Soto-Gómez, D.; Fernández-Calviño, D.; Zornoza, R. The impact of intercropping, tillage and fertilizer type on soil and crop yield in fruit orchards under Mediterranean conditions: A meta-analysis of field studies. Agric. Ecosyst. Environ. 2020, 329, 107867. [Google Scholar] [CrossRef]
  59. Yang, Y.; Liang, C.; Wang, Y.Q.; Cheng, H.; An, S.S.; Chang, S.X. Soil extracellular enzyme stoichiometry reflects the shift from P- to N-limitation of microorganisms with grassland restoration. Soil Biol. Biochem. 2020, 149, 107928. [Google Scholar] [CrossRef]
Figure 1. Effects of different land use patterns on TC (a), TN (b), TP (c), C:N ratio (d), C:P ratio (e), and N:P ratio (f). The lengths of the bars represent average values. The length of the error bars represents the standard deviation. Different uppercase letters indicate significant differences among different land use patterns within the same soil depth (p < 0.05). Different lowercase letters indicate significant differences among different soil depths within the same land use patterns (p < 0.05). TC: soil total carbon. TN: soil total nitrogen. TP: soil total phosphorus. C: carbon. N: nitrogen. P: phosphorus. AG: alfalfa artificial grassland. WM: wheat–maize rotation field. PC: native grassland.
Agronomy 13 02744 g001
Figure 2. Effects of different land use patterns on βG (a), NAG (b), LAP (c), ALP (d), enzyme C:N ratio (e), enzyme C:P ratio (f), enzyme N:P ratio (g), vector length (h) and vector angle (i). The lengths of the bars represent average values. The length of the error bars represents the standard deviation. Different uppercase letters indicate significant differences among different land use patterns within the same soil depth (p < 0.05). Different lowercase letters indicate significant differences among different soil depths within the same land use patterns (p < 0.05). βG: β-1,4-glucosidase. NAG: β-1,4-N-acetyl-glucosaminidase. LAP: L-leucine aminopeptidase. ALP: alkaline phosphatase. C: carbon. N: nitrogen. P: phosphorus. AG: alfalfa artificial grassland. WM: wheat–maize rotation field. PC: native grassland.
Agronomy 13 02744 g002
Figure 3. Link between soil stoichiometry and enzyme stoichiometry in different land use patterns. The fitting curves of C:N ratio and enzyme C:N ratio at 0–20 cm, 20–40 cm, and 40–60 cm were shown as (a), (b), and (c), respectively. The fitting curves of the C:P ratio and enzyme C:P ratio at 0–20 cm, 20–40 cm, and 40–60 cm were shown as (d), (e), and (f) respectively. The fitting curves of C:N ratio and enzyme C:N ratio at 0–20 cm, 20–40 cm, and 40–60 cm were shown as (g), (h), and (i), respectively. C: carbon. N: nitrogen. P: phosphorus.
Agronomy 13 02744 g003
Figure 4. Pathway analysis revealed the influence of major drivers in AG (a,d), WM (b,e), and PC (c,f) on enzyme stoichiometry. The red and blue arrows indicate the positive and negative effects, respectively. The solid and dashed lines indicate significant (at least p < 0.05) and insignificant (p > 0.05) correlations, respectively. The numbers near the arrows are the standard path coefficients. *, ** and *** indicate significant correlations at the 0.05, 0.01, and 0.001 levels, respectively. χ2: chi-square; P: non-significant chi-square test p-value; GFI: goodness of fit index; RSMEA: root mean square error of approximation.
Agronomy 13 02744 g004
Table 1. Effects of different land use patterns on soil physical properties.
Soil Depth (cm)Land Use PatternsBD
(g cm−3)
Mass Fraction of WSA (%)MWD
(mm)
>2 mm2–1 mm1–0.5 mm0.5–0.25 mm<0.25 mm
0–20AG1.12 ± 0.10
Ba
27.75 ± 6.57
Ab
21.88 ± 1.51
Aa
20.13 ± 2.47
Ba
11.68 ± 4.45
Ba
17.86 ± 4.33
Ba
1.38 ± 0.19
Aa
WM1.12 ± 0.08
Ba
12.27 ± 4.61
Ba
16.71 ± 2.73
Bb
26.13 ± 2.18
Aa
20.69 ± 2.97
Aa
24.20 ± 2.14
Ba
0.92 ± 0.11
Bb
PC1.46 ± 0.03
Aa
20.88 ± 6.68
ABa
14.71 ± 1.84
Bab
12.87 ± 1.52
Ca
13.48 ± 2.09
Ba
38.07 ± 3.78
Aa
1.04 ± 0.17
Ba
20–40AG1.12 ± 0.01
Ba
36.48 ± 9.00
Aa
22.33 ± 3.38
Aa
15.40 ± 3.86
Bb
10.44 ± 4.34
Ba
15.36 ± 2.19
Cab
1.60 ± 0.24
Aa
WM1.16 ± 0.02
Ba
16.12 ± 6.55
Ba
15.25 ± 1.61
Bb
24.83 ± 4.43
Aa
20.81 ± 3.84
Aa
23.01 ± 3.24
Ba
1.01 ± 0.18
Bab
PC1.43 ± 0.02
Ab
19.62 ± 3.73
Ba
12.50 ± 1.99
Bb
14.10 ± 1.77
Ba
13.26 ± 4.22
ABa
40.52 ± 2.10
Aa
0.98 ± 0.10
Ba
40–60AG1.10 ± 0.04
Ba
33.18 ± 9.61
Aab
21.33 ± 2.90
Aa
19.07 ± 5.82
Bab
12.36 ± 3.02
Aa
14.06 ± 3.00
Bb
1.52 ± 0.26
Aa
WM1.11 ± 0.03
Ba
15.76 ± 5.00
Ba
22.13 ± 4.32
Aa
27.78 ± 3.19
Aa
16.81 ± 2.33
Ab
17.51 ± 2.52
Bb
1.10 ± 0.11
Ba
PC1.47 ± 0.01
Aa
18.35 ± 4.68
Ba
16.25 ± 4.32
Aa
14.65 ± 3.12
Ba
14.83 ± 0.69
Aa
35.92 ± 7.03
Aa
1.00 ± 0.14
Ba
Note: Data are presented as mean ± standard deviation. Different uppercase letters indicate significant differences in different land use patterns within the same soil depth (p < 0.05). Different lowercase letters indicate significant differences in different soil depths within the same land use patterns (p < 0.05). AG: alfalfa artificial grassland. WM: wheat–maize rotation field. PC: native grassland. BD: soil bulk density. WSA: soil water stable aggregate. MWD: mean weight diameter.
Table 2. Effects of different land use patterns on soil chemical properties.
Soil Depth (cm)Land Use PatternspHEC
(μs cm−1)
SOC
(g kg−1)
NH4+-N
(mg kg−1)
NO3-N
(mg kg−1)
AP
(mg kg−1)
0–20AG8.51 ± 0.08
Aa
343.11 ± 84.83
ABb
11.13 ± 1.29
Aa
13.12 ± 0.96
Aa
28.57 ± 3.10
Aa
32.27 ± 10.51
Aa
WM8.52 ± 0.15
Aa
428.12 ± 104.06
Ac
9.98 ± 0.75
Aa
12.21 ± 1.34
Aa
24.83 ± 1.13
Ba
27.95 ± 10.46
Aa
PC8.37 ± 0.13
Bb
297.65 ± 43.79
Bc
6.47 ± 1.30
Ba
5.22 ± 0.32
Ba
10.75 ± 0.35
Ca
6.85 ± 2.48
Ba
20–40AG8.53 ± 0.12
Aa
479.02 ± 115.97
Aa
9.23 ± 1.02
Ab
11.21 ± 1.03
Ab
23.59 ± 3.07
Ab
19.97 ± 8.48
Ab
WM8.56 ± 0.06
Aa
511.89 ± 73.86
Ab
7.57 ± 0.66
Ab
10.23 ± 0.37
Bb
20.96 ± 3.33
Ab
17.15 ± 7.00
Ab
PC8.64 ± 0.11
Aa
425.34 ± 72.49
Ab
4.64 ± 1.06
Bb
4.63 ± 0.68
Cb
7.60 ± 0.25
Bb
3.60 ± 0.71
Bb
40–60AG8.56 ± 0.06
Aba
535.49 ± 43.56
Ba
7.50 ± 1.35
Ac
9.67 ± 0.57
Ac
17.12 ± 0.65
Bc
10.44 ± 3.28
Ac
WM8.50 ± 0.07
Ba
619.75 ± 75.88
Aa
6.11 ± 0.89 Ac8.53 ± 0.33
Bc
18.75 ± 1.67
Ac
9.04 ± 2.92
Ac
PC8.64 ± 0.13
Aa
561.75 ± 88.78
ABa
4.89 ± 0.61
Bb
3.65 ± 0.71
Cc
6.35 ± 0.35
Cc
3.13 ± 0.50
Bb
Note: Data are presented as mean ± standard deviation. Different uppercase letters indicate significant differences in different land use patterns within the same soil depth (p < 0.05). Different lowercase letters indicate significant differences in different soil depths within the same land use patterns (p < 0.05). AG: alfalfa artificial grassland. WM: wheat–maize rotation field. PC: native grassland. pH: hydrogen ion concentration. EC: soil electrical conductivity. SOC: soil organic carbon. NH4+-N: ammonium nitrogen. NO3-N: nitrate nitrogen. AP: soil available phosphorus.
Disclaimer/Publisher’s Note: The statements, opinions and data contained in all publications are solely those of the individual author(s) and contributor(s) and not of MDPI and/or the editor(s). MDPI and/or the editor(s) disclaim responsibility for any injury to people or property resulting from any ideas, methods, instructions or products referred to in the content.

