Article

Identification of Advantaged Genes for Lodging Resistance-Related Traits in the Temperate geng Group (Oryza sativa L.) Using a Genome-Wide Association Study

1
Shenzhen Branch, Guangdong Laboratory for Lingnan Modern Agriculture, Agricultural Genomics Institute at Shenzhen, Chinese Academy of Agricultural Sciences, Shenzhen 518120, China
2
State Key Laboratory of Crop Gene Resources and Breeding, Institute of Crop Sciences, Chinese Academy of Agricultural Sciences, Beijing 100081, China
3
State Key Laboratory of Crop Stress Adaptation and improvement, School of Life Sciences, Henan University, Kaifeng 475004, China
4
Shenzhen Research Institute of Henan University, Shenzhen 518000, China
*
Authors to whom correspondence should be addressed.
These authors contributed equally to this work.
Agronomy 2023, 13(11), 2711; https://doi.org/10.3390/agronomy13112711
Submission received: 5 September 2023 / Revised: 16 October 2023 / Accepted: 23 October 2023 / Published: 27 October 2023
(This article belongs to the Section Crop Breeding and Genetics)

Abstract

:
With the endless growth of the population and development of the economy and living standards, a high yield with good grain quality has become the prime objective of breeding. However, lodging is a major factor leading to a significant decline in rice (Oryza sativa L.) production and quality. We conducted genome-wide association analysis to detect quantitative trait loci (QTL)-related lodging resistance, using 395 temperate geng accessions. A total of 50 QTL affecting the six traits were detected, using 1,438,279 high-quality single nucleotide polymorphism markers. Five important QTL clusters were detected affecting the lodging resistance-related traits. The ten candidate genes were detected by performing gene differential expression analysis and haplotype analysis. Among them, LOC_Os07g48570 (OsDof-23) for qLA7.2, qSA7.2 and qPR7.3, LOC_Os08g29110 (wp2) for qLA8 and qSA8, and LOC_Os11g36440 (MHZ5) for qPR11 and qBR11.1 were considered the most likely candidate genes based on functional annotations. The results may facilitate the breeding of rice varieties resistant to lodging, to overcome the adverse effects of climate change.

1. Introduction

Rice (Oryza sativa L.) is one of the most important cereal crops and a staple food for more than 3.5 billion people worldwide, especially in Asia [1]. With the endless growth of the population and development of the economy and living standards, a high yield with good grain quality has become the prime objective of breeding [2,3]. Among various biotic and abiotic stresses, lodging is a major factor leading to significant reductions in food yield and quality through reduced photosynthesis and nutrient transport [4,5]. The mechanical strength and cross-section characteristics of the stem evaluated by pushing resistance (PR) and breaking resistance (BR) per panicle and long axis (LA), short axis (SA), thickness (TK) and eccentricity (ET), respectively, determine the final lodging characteristics.
In the past two decades, the application of QTL mapping has greatly improved the understanding on the genetic mechanism of many complex agronomic traits. To date, various genes/QTLs governing lodging resistance-related traits have been reported. Five QTLs were reported to control the pushing strength of the lower stem, and prl5 from Kasalath on chromosome 5 had a positive effect echoed by lodging resistance to a typhoon [6]. A QTL, SCM3, was reported to control the culm morphology by affecting the strigolactone signaling pathway [7,8]. SCM2, identical to APO1, has been reported to control the culm diameter and culm morphology by encoding an F-box domain-containing protein [9,10]. In addition, sd1 was reported for short stature by encoding a GA20-2 oxidase in the gibberellin synthesis pathway, resulting in lodging resistance [11,12]. Compared with wild-type Nipponbare, the base internode of the ckx2 mutant was thickened, resulting in increased lodging resistance [13,14]. These cloned genes have provided considerable insight into the individual molecular basis of lodging resistance.
The mechanical strength and cross-section characteristics of the stem are closely related to the lodging resistance and yield. Up to now, rice researchers have widely used genome-wide association studies (GWAS) to investigate important complex traits in agriculture [15,16,17,18,19,20]. And several QTLs/genes related to lodging resistance have been cloned by GWAS [8]. In this research, a genome-wide association study (GWAS) was conducted for the PR, BR, LA, SA, TK and ET, using 395 temperate geng (japonica) accessions. This study clearly aimed to explore the genomic regions and candidate genes related to lodging resistance in the whole rice genome and screen breeding materials that could be used for molecular marker-assisted selection (MAS). Our results may facilitate the breeding of rice varieties resistant to lodging to overcome the adverse effects of climate change.

2. Materials and Methods

2.1. Materials and Phenotypic Investigation

A total of 395 temperate geng (Geng_Tem) accessions were selected from the 1275 rice accessions collected by the Institute of Genetics and Developmental Biology (IDGB) in 2020, including 316 from China, 47 from Japan, 12 from Russia, 1 from North Korea and 19 from unknown areas [21] (Table S1).
A field trial was conducted at Harbin Academy of Agricultural Sciences (45.8° N, 126.65° E) during April–September in 2021 and 2022. The field planting followed a randomized complete block design with two experimental replications. Each accession was planted in a plot with three rows, with eight plants in each row at a spacing of 16.7 cm × 30 cm. The field management followed the local farmers’ standard practices.
At the full-ripe stage, five uniform plants in the middle of each accession were selected. Plants were cut off at a 40 cm height, the prostrate tester (Daiki Rika Kogyo Co., Tokyo, Japan) was set perpendicularly at the middle of the plant (20 cm), and the pushing resistance per panicle (PR) of the lower part was measured when the plants were pushed to an angle of 45° from the vertical [6]. The breaking resistance per panicle (BR) was measured when the stem snapped. The stem long axis (LA), short axis (SA) diameter and thickness (TK) were measured at 40 cm. The eccentricity (ET) of the stem cross section was calculated by 1 S A 2 L A 2 . The genetic variance (Vg) and residual variance (Ve) for each trait was investigated in this research using the R 4.2.2 package “lme4” and, then, the broad-sense heritability (H2) was calculated by Vg/(Vg + Ve) × 100%.

2.2. Genotypic Data

A total of 2,081,216 SNPs for 1275 rice accessions were reported by Li et al. [21]. Then, the genotypic data of the 395 panels used in this study were selected and the SNPs with a missing rate ≥ 20% and a minor allele frequency ≤ 5% were removed using PLINK 1.9 software [22]. Finally, 1,438,279 high-quality SNPs were selected and used for the genome-wide association study (GWAS) in this study. The effective number of independent markers (N) was calculated using GEC software [23] and the suggestive p-value thresholds of association (1/N) was 2.57 × 10⁻⁶, which was used to claim significant SNP-trait associations. A principal component analysis (PCA) and kinship matrix (K) were performed, using PLINK 1.9 software, to examine the population structure, and they were used in the following association analysis.

2.3. Genome-Wide Association Study (GWAS)

We performed a GWAS to excavate the SNPs that were significantly associated with the six measured traits (PR, BR, LA, SA, TK and ET), using the 1,438,279 SNPs and the mean trait values of the 395 accessions, using EMMA eXpedited (EMMAX) software [24]. In this study, the mixed linear model (MLM), PCA + K, was used in the association analysis. Manhattan plots were plotted by the R 4.2.2 package “CMplot” using the GWAS results (https://github.com/YinLiLin/CMplot, accessed on 5 February 2022). The chromosomal region of each QTL was determined when the significant SNP (p < 2.57 × 10⁻⁶) was located on the same linkage disequilibrium (LD) block.

2.4. Candidate Gene Identification for the Important QTL

We selected the important QTLs, simultaneously identified in both of the two years for one trait or affecting more than one trait in one year, to excavate the candidate genes affecting the target traits based on GWAS for the lodging resistance-related traits. The LD block, where the significant trait-associated SNPs were situated, was defined as the candidate region. The LDs between the SNPs were evaluated using the squared Pearson correlation coefficient (r2) calculated with “genetics” in the R 4.2.2 package. LD heatmaps surrounding the peaks in the GWAS were constructed with the R 4.2.2 package “LD heatmap” [25]. Candidate regions were estimated using an r2 ≥ 0.6 [26].
SNP annotation analysis was performed to identify the candidate genes for important QTLs. SNPs significantly associated with phenotypic values and strongly linked to these significant SNPs (r2 ≥ 0.6) were identified as candidate SNPs for each important QTL. We then annotated these candidate SNPs into the promoter region, 5′-UTR region, intron region, synonymous mutation, non-synonymous mutation, and 3′-UTR region. Finally, the genes that the non-synonymous SNPs were located in were identified as the candidate genes for each important QTL, based on the Rice Annotation Project Database [27].
Haplotype analysis of all the candidate genes was conducted, according to all the available non-synonymous SNPs located inside these genes. Haplotypes containing more than 20 rice accessions were used to analyze the significant differences in the phenotype. We further analyzed the expression pattern of the candidate genes for each important QTL using the RNA-seq database from MBKbase (https://www.mbkbase.org/rice/genotype (accessed on 8 January 2020)). Finally, the most likely candidate genes were selected for comprehensive analysis based on the significance of the haplotype analyses (analysis of variance (ANOVA)), expression pattern and their functional annotations.

3. Results

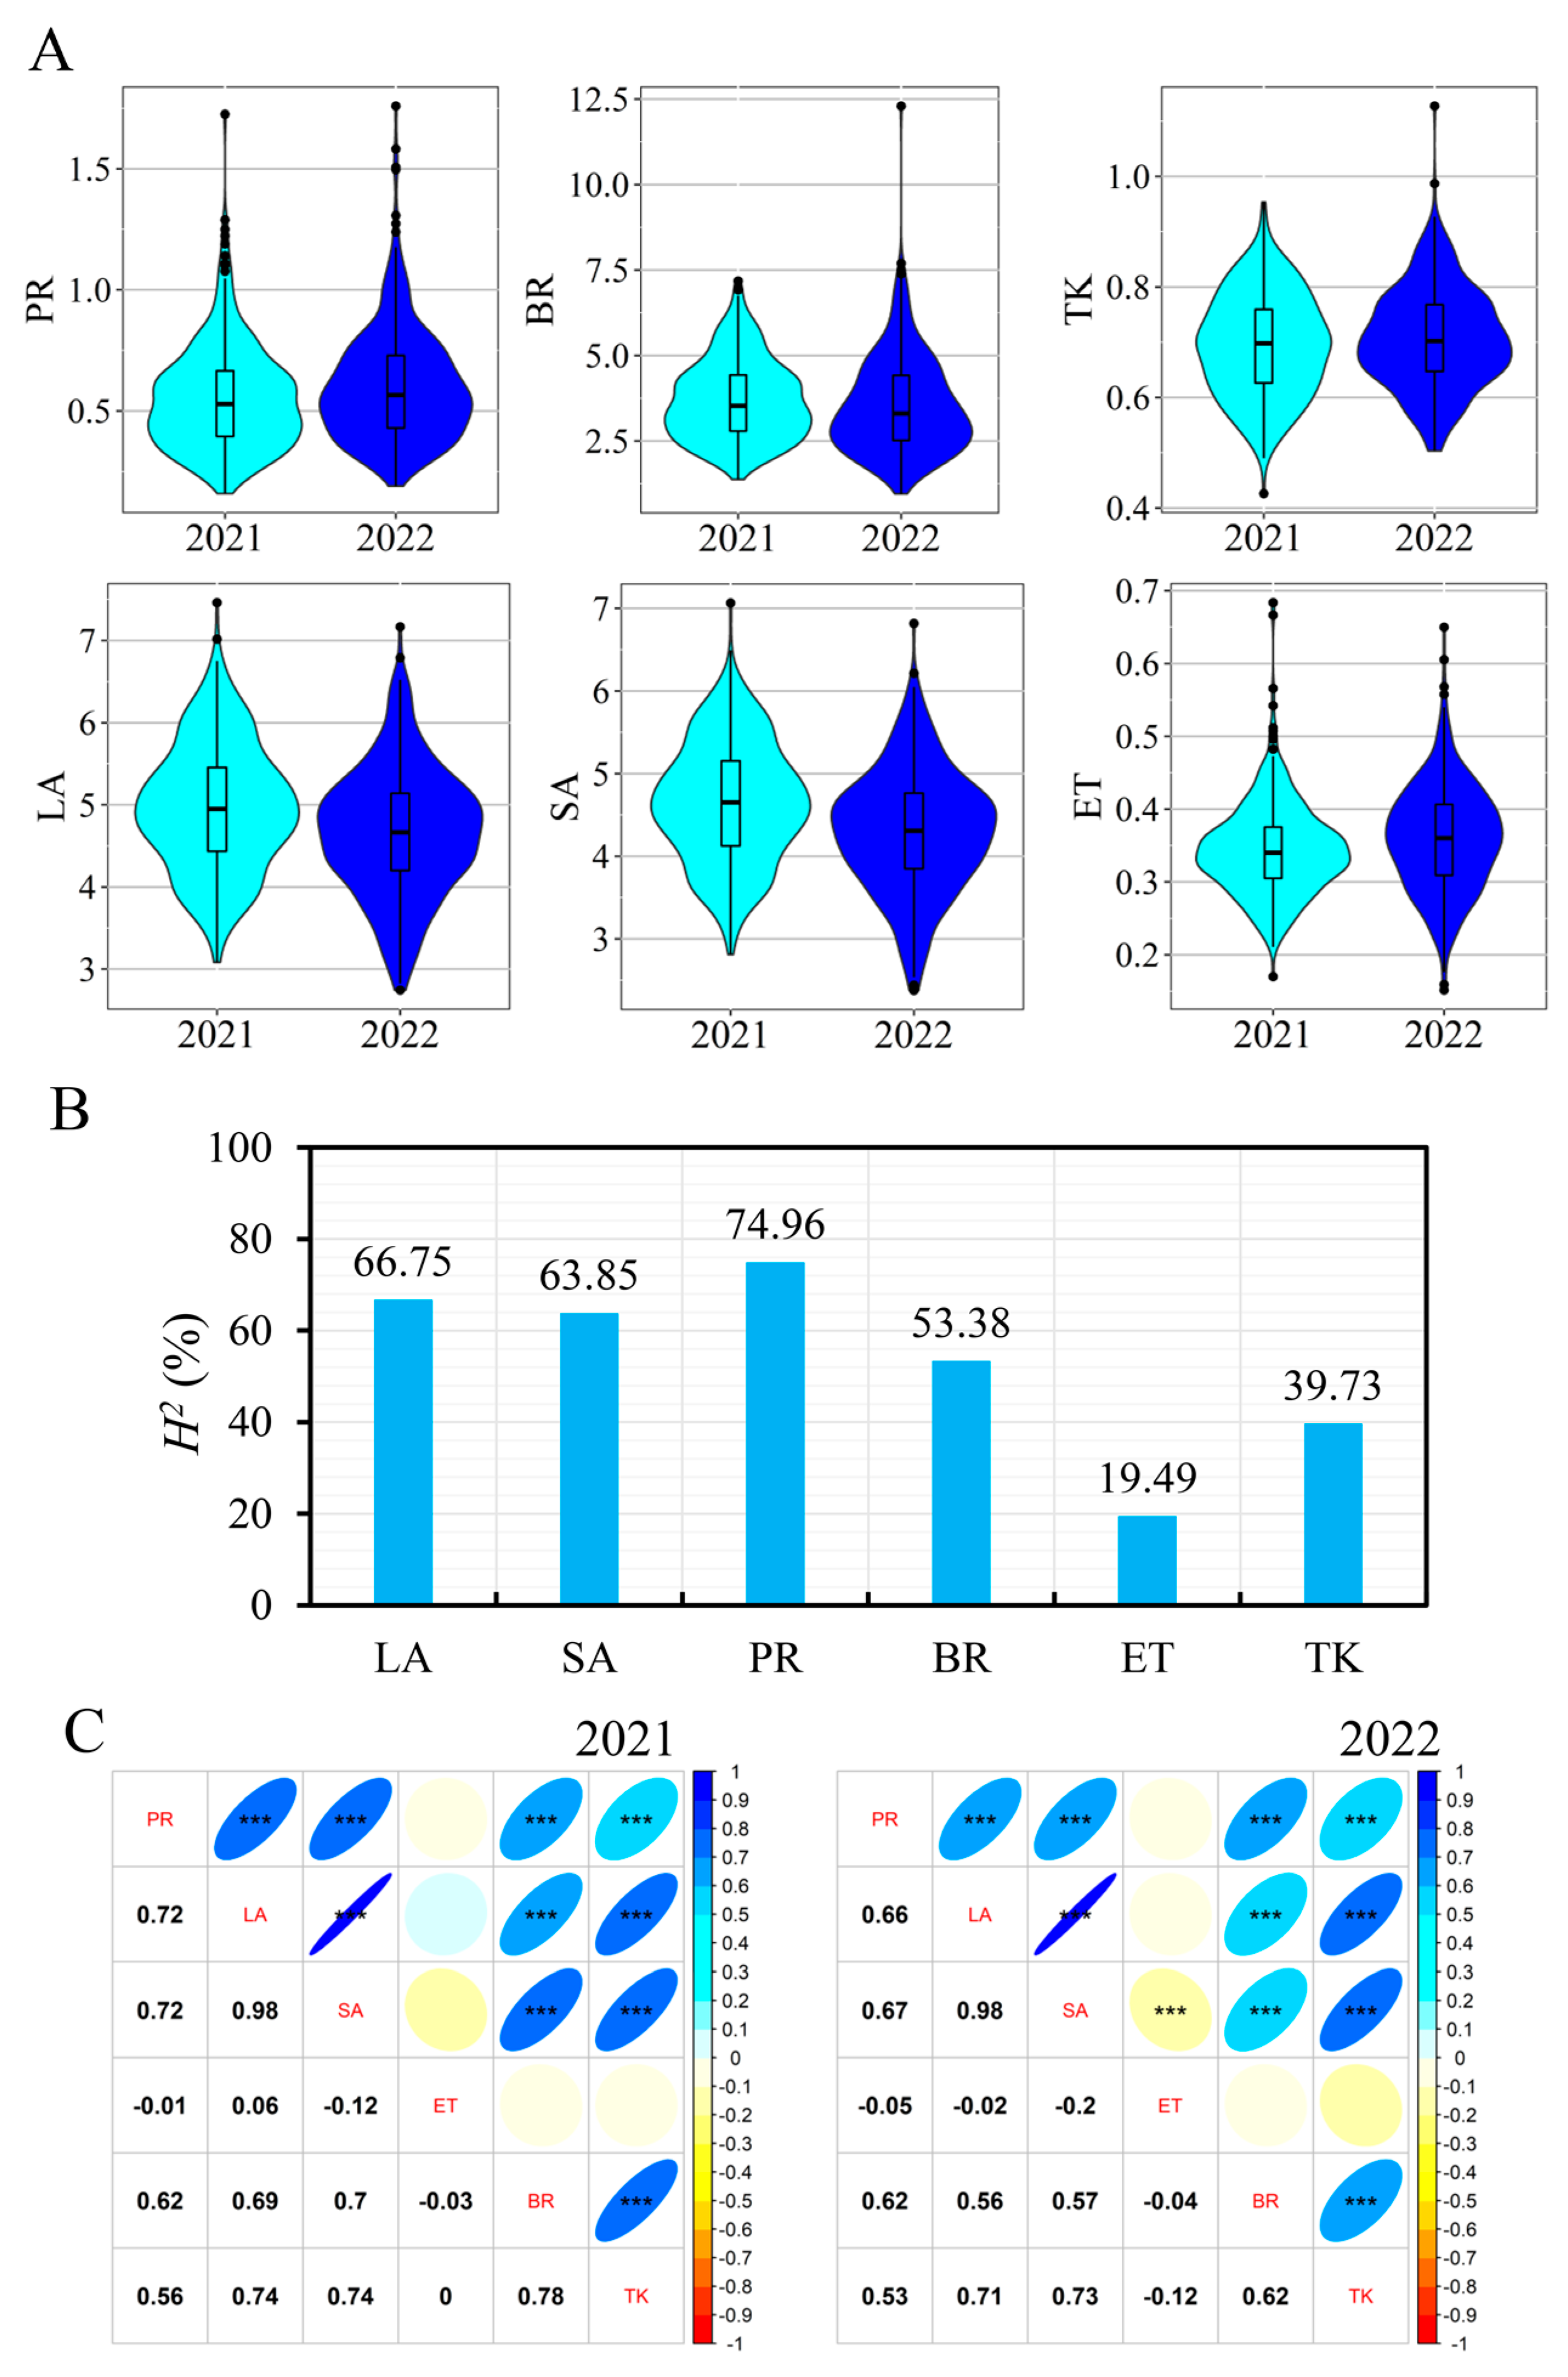
3.1. Phenotypic Date
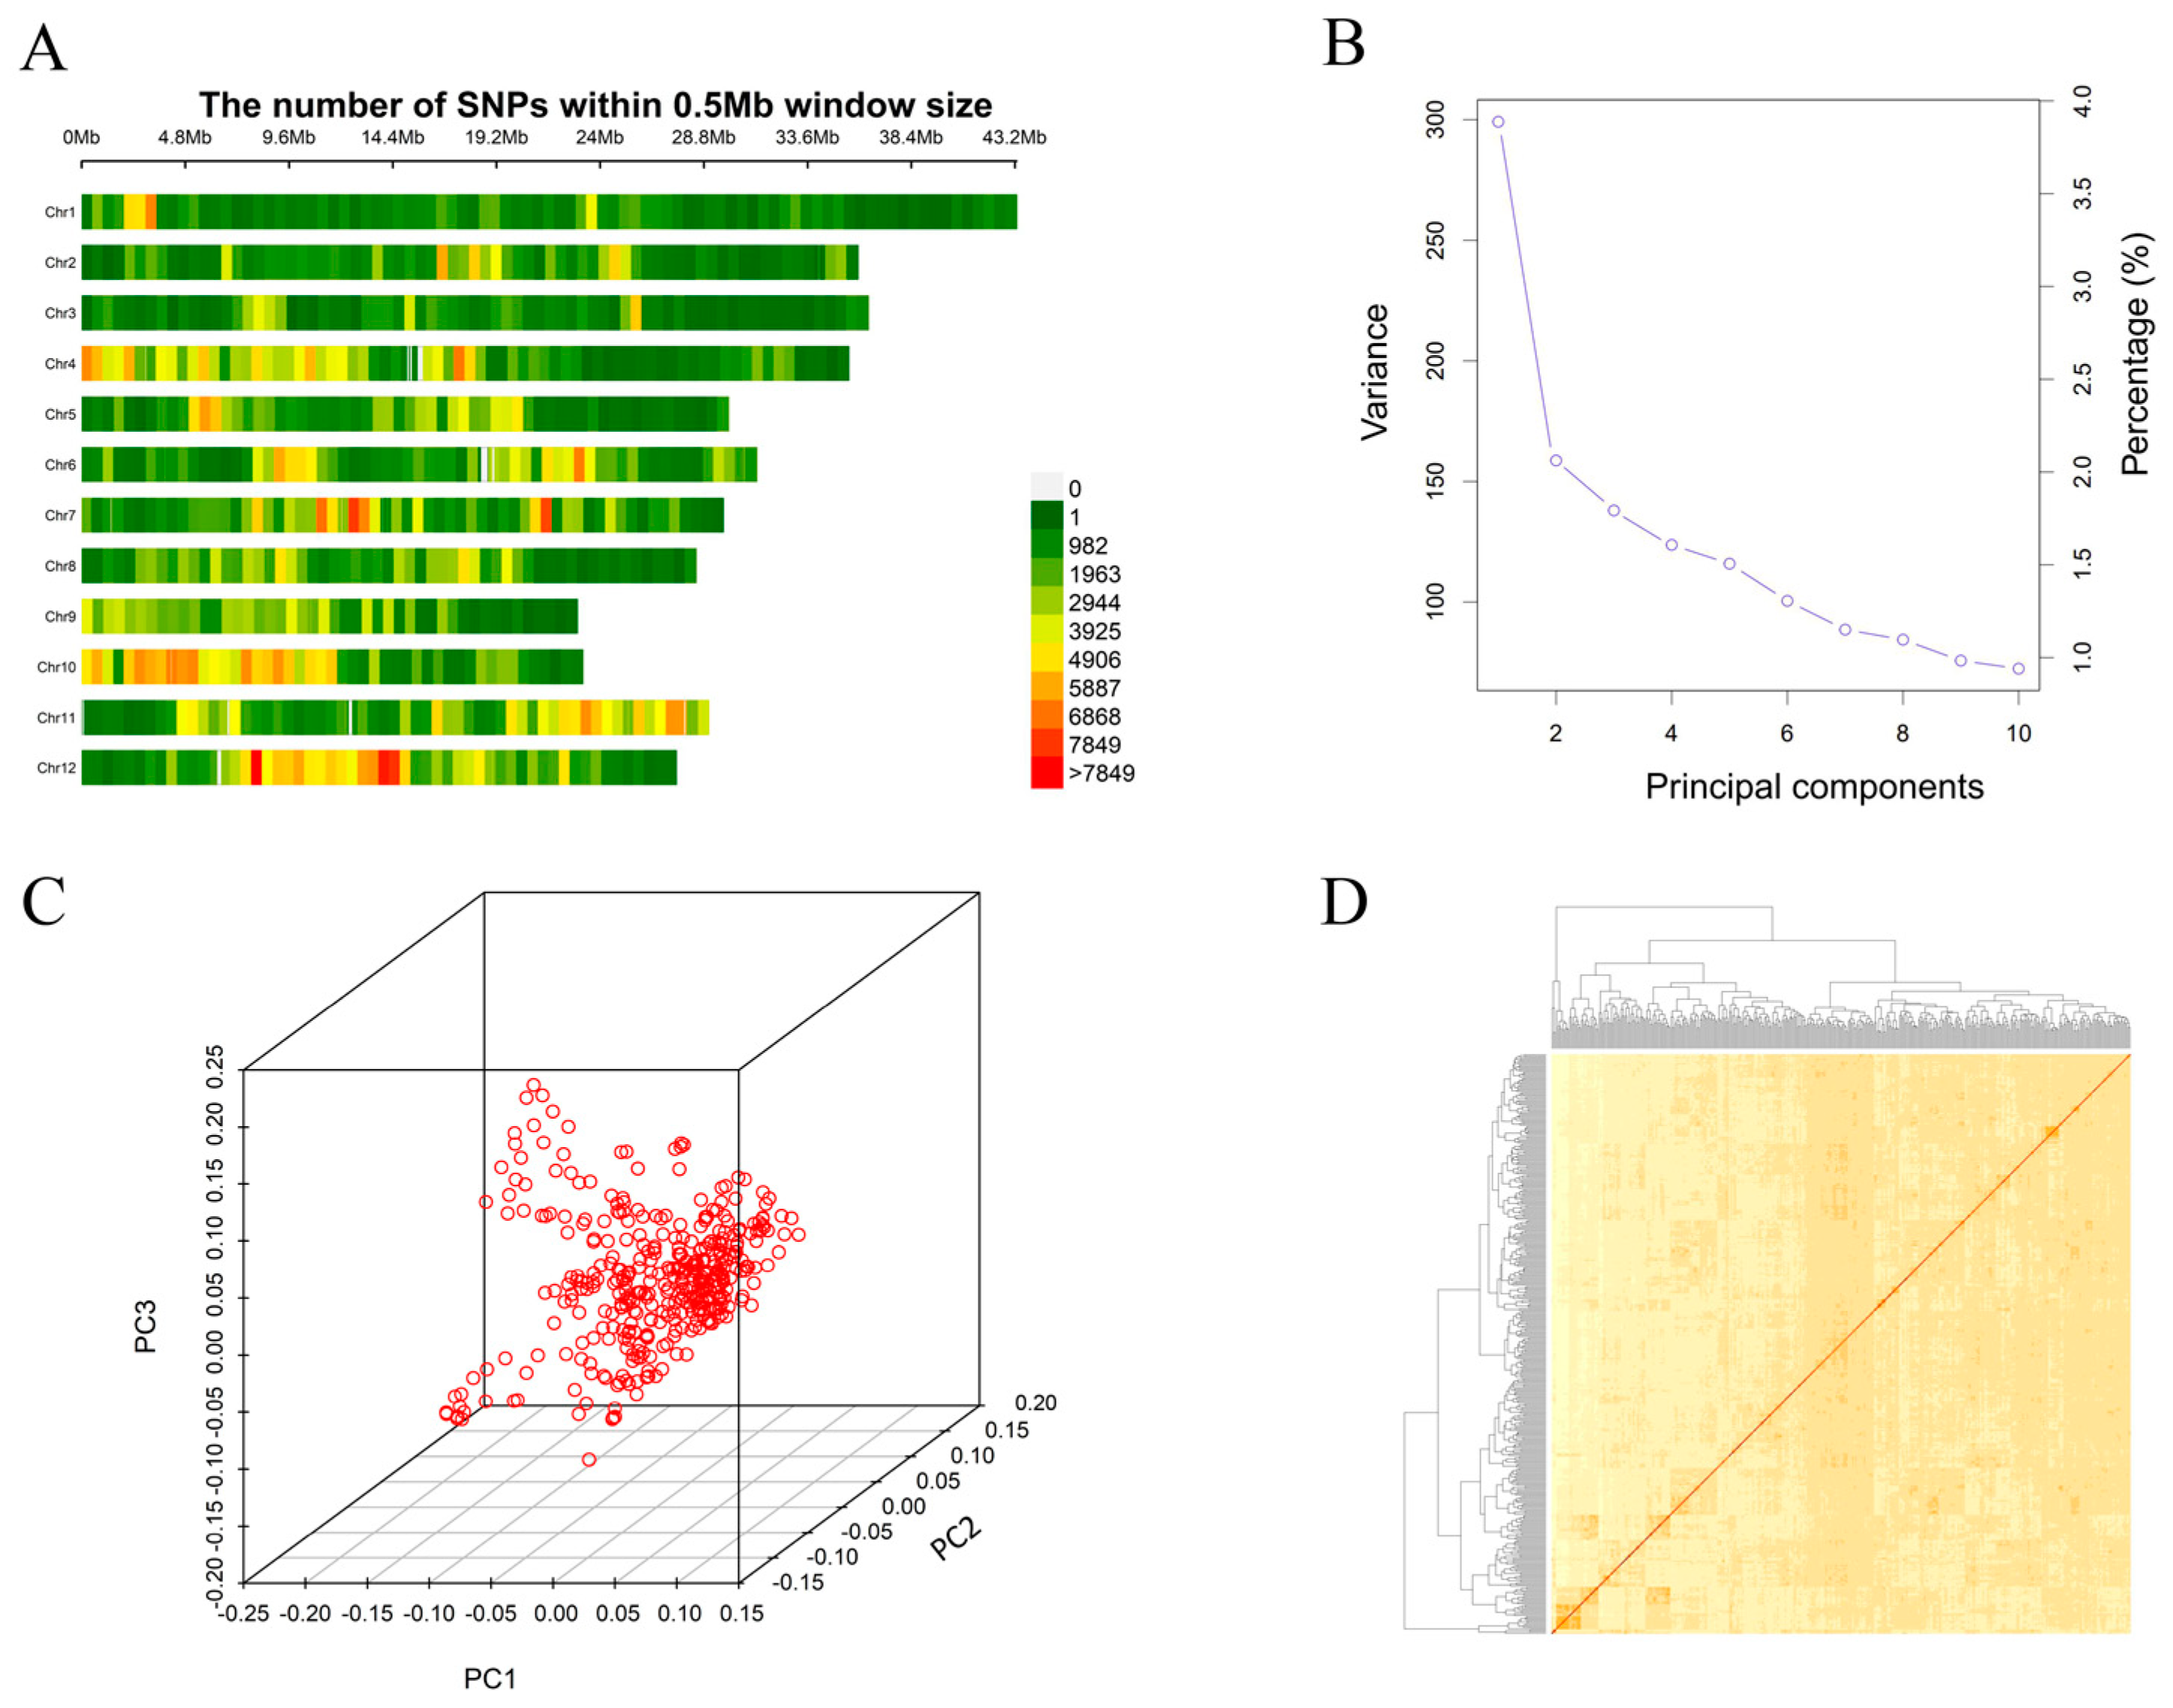
All the six measured traits showed tremendous variations in the 395 temperate geng accessions, and the phenotypic values were consistent among the two years (Figure 1A; Table S1). Then, we calculated the broad-sense heritability (H2) for each trait investigated in the research. The broad-sense heritability (H2) for the LA, SA, PR and BR were 66.75%, 63.85%, 74.96% and 53.38%, respectively, which indicated high heritability for the four traits (Figure 1B). While the TK (H2 = 39.73%) and ET (H2 = 19.49%) had moderate and low heritability, respectively.
The phenotype pairwise correlations between the measured traits were similar in the two years except between the SA and ET (Figure 1C). There were significant positive correlations among the PR, LA, SA, BR and TK in both of the two years. There was no significant correlation between A and any other measured traits, except for the SA in 2022 (Figure 1C). These results suggested that QTL might be mapped in the same regions for the traits with high correlation.

3.2. Genotypic Data

For the 1,438,279 high-quality SNPs used in this study, the number of markers per chromosome ranged from 86,883 on chromosome 9 to 163,549 on chromosome 4. The size of chromosome varied from 22.90 Mb for chromosome 9 to 43.27 Mb for chromosome 1. The whole genome size was 373.06 Mb. The average marker spacing was 259 bp, with spacing ranging from 154 bp for chromosome 10 to 483 bp for chromosome 3 (Figure 2A; Table S2).
We performed principal component analysis (PCA) and kinship index (KI) analysis to quantify the population structure of the 395 varieties. The change in the eigenvalues tended to be gentle starting from the second factor, which indicated that the explanation on the difference of the other values after the second factor was small and it was reasonable to choose only one factor as the primary factor (Figure 2B,C). There was no obvious clustering based on the K (Figure 2D). These results suggested that only one group or no obvious population structure existed in the 395 varieties, which might be due to the fact that these materials belonged to the same subpopulation (temperate geng rice).

3.3. Detection of QTL Using GWAS

A total of 50 QTLs for the six measured traits were identified using a GWAS, ranging from three QTLs for TK to 18 QTLs for PR (Table 1; Figure S1). Among them, only one QTL (qPR7.3) was detected together for the two years, and five QTL clusters (qLA7.1 and qSA7.1, qLA7.2 and qSA7.2, qLA8 and qSA8, qLA11.1 and qSA11.2, qPR11 and qPR11.1) were detected affecting more than one trait.
For PR, 18 QTLs were detected on all the chromosomes except for chromosome 9. Among them, 14 and 3 QTLs were detected only in 2021 and 2022, respectively. One QTL (qPR7.3) was detected both in 2021 and 2022. The p-value of the lead SNP was 2.75 × 10⁻⁹ and it was located on the qPR7.3 detected in both of the two years (Table 1; Figure S1).
Ten QTLs for BR were detected on chromosomes 2, 3, 5, 7, 8 and 11. Among them, only qBR2 was detected in 2021 and the p-value of the lead SNP for this QTL was 5.23 × 10⁻⁷. The other nine QTLs (qBR3, qBR5.1, qBR5.2, qBR7, qBR8, qBR10, qBR11.1, qBR11.2 and qBR11.3) were all detected in 2022, and there was no QTL detected both in 2021 and 2022 (Table 1; Figure S1).
Among the seven QTLs detected for LA on chromosomes 4, 7, 8 and 11, two QTLs (qLA7.2 and qLA11.2) and five QTLs (qLA4.1, qLA4.2, qLA7.1 qLA8 and qLA11.1) were detected in 2021 and 2022, respectively. The p-value of the lead SNP (rs11_26784624) significantly associated with LA was 2.83 × 10⁻⁷ and it was located on qLA11.2 (Table 1; Figure S1).
Only five QTLs were detected for SA on chromosomes 7, 8 and 11. Two QTLs (qSA7.2 and qSA11.1) and three QTLs (qSA7.1, qSA8 and qSA11.2) were detected in 2021 and 2022, respectively. The p-value of the five QTLs ranged from 2.01 × 10⁻⁶ for SNP rs11_17133200 in qSA11.2 to 9.63 × 10⁻⁷ for SNP rs8_17838906 in qSA8 (Table 1; Figure S1).
Seven QTLs (qET1, qET4, qET8.1, qET8.2, qET8.3, qET9 and qET11) were detected for ET on 1, 4, 8, 9 and 11. Only qET8.2 was detected in 2022 and another six QTLs were all detected in 2021. For TK, only qTK2, qTK5 and qTK10 were detected in 2021, and there was no QTL detected in 2022 (Table 1; Figure S1).
Among the 50 QTLs detected for the six measured traits in this study, qLA7.1 where the lead SNP rs7_15521491 was located in and qSA7.1 where the lead SNP rs7_15521491 was located in, belonged to the same QTL cluster. Similarly, qLA8 and qSA8, qLA11.1 and qSA11.2, and qPR11 and qBR11.1, were located in the same candidate region, respectively. The QTL qPR7.3 detected for PR in 2021 and 2022 was located in a similar candidate region to qLA7.2 and qSA7.2. These results suggested that these five QTL clusters could be considered as important candidate regions to identify candidate genes affecting the measured traits in this study (Table 1; Figure S1).

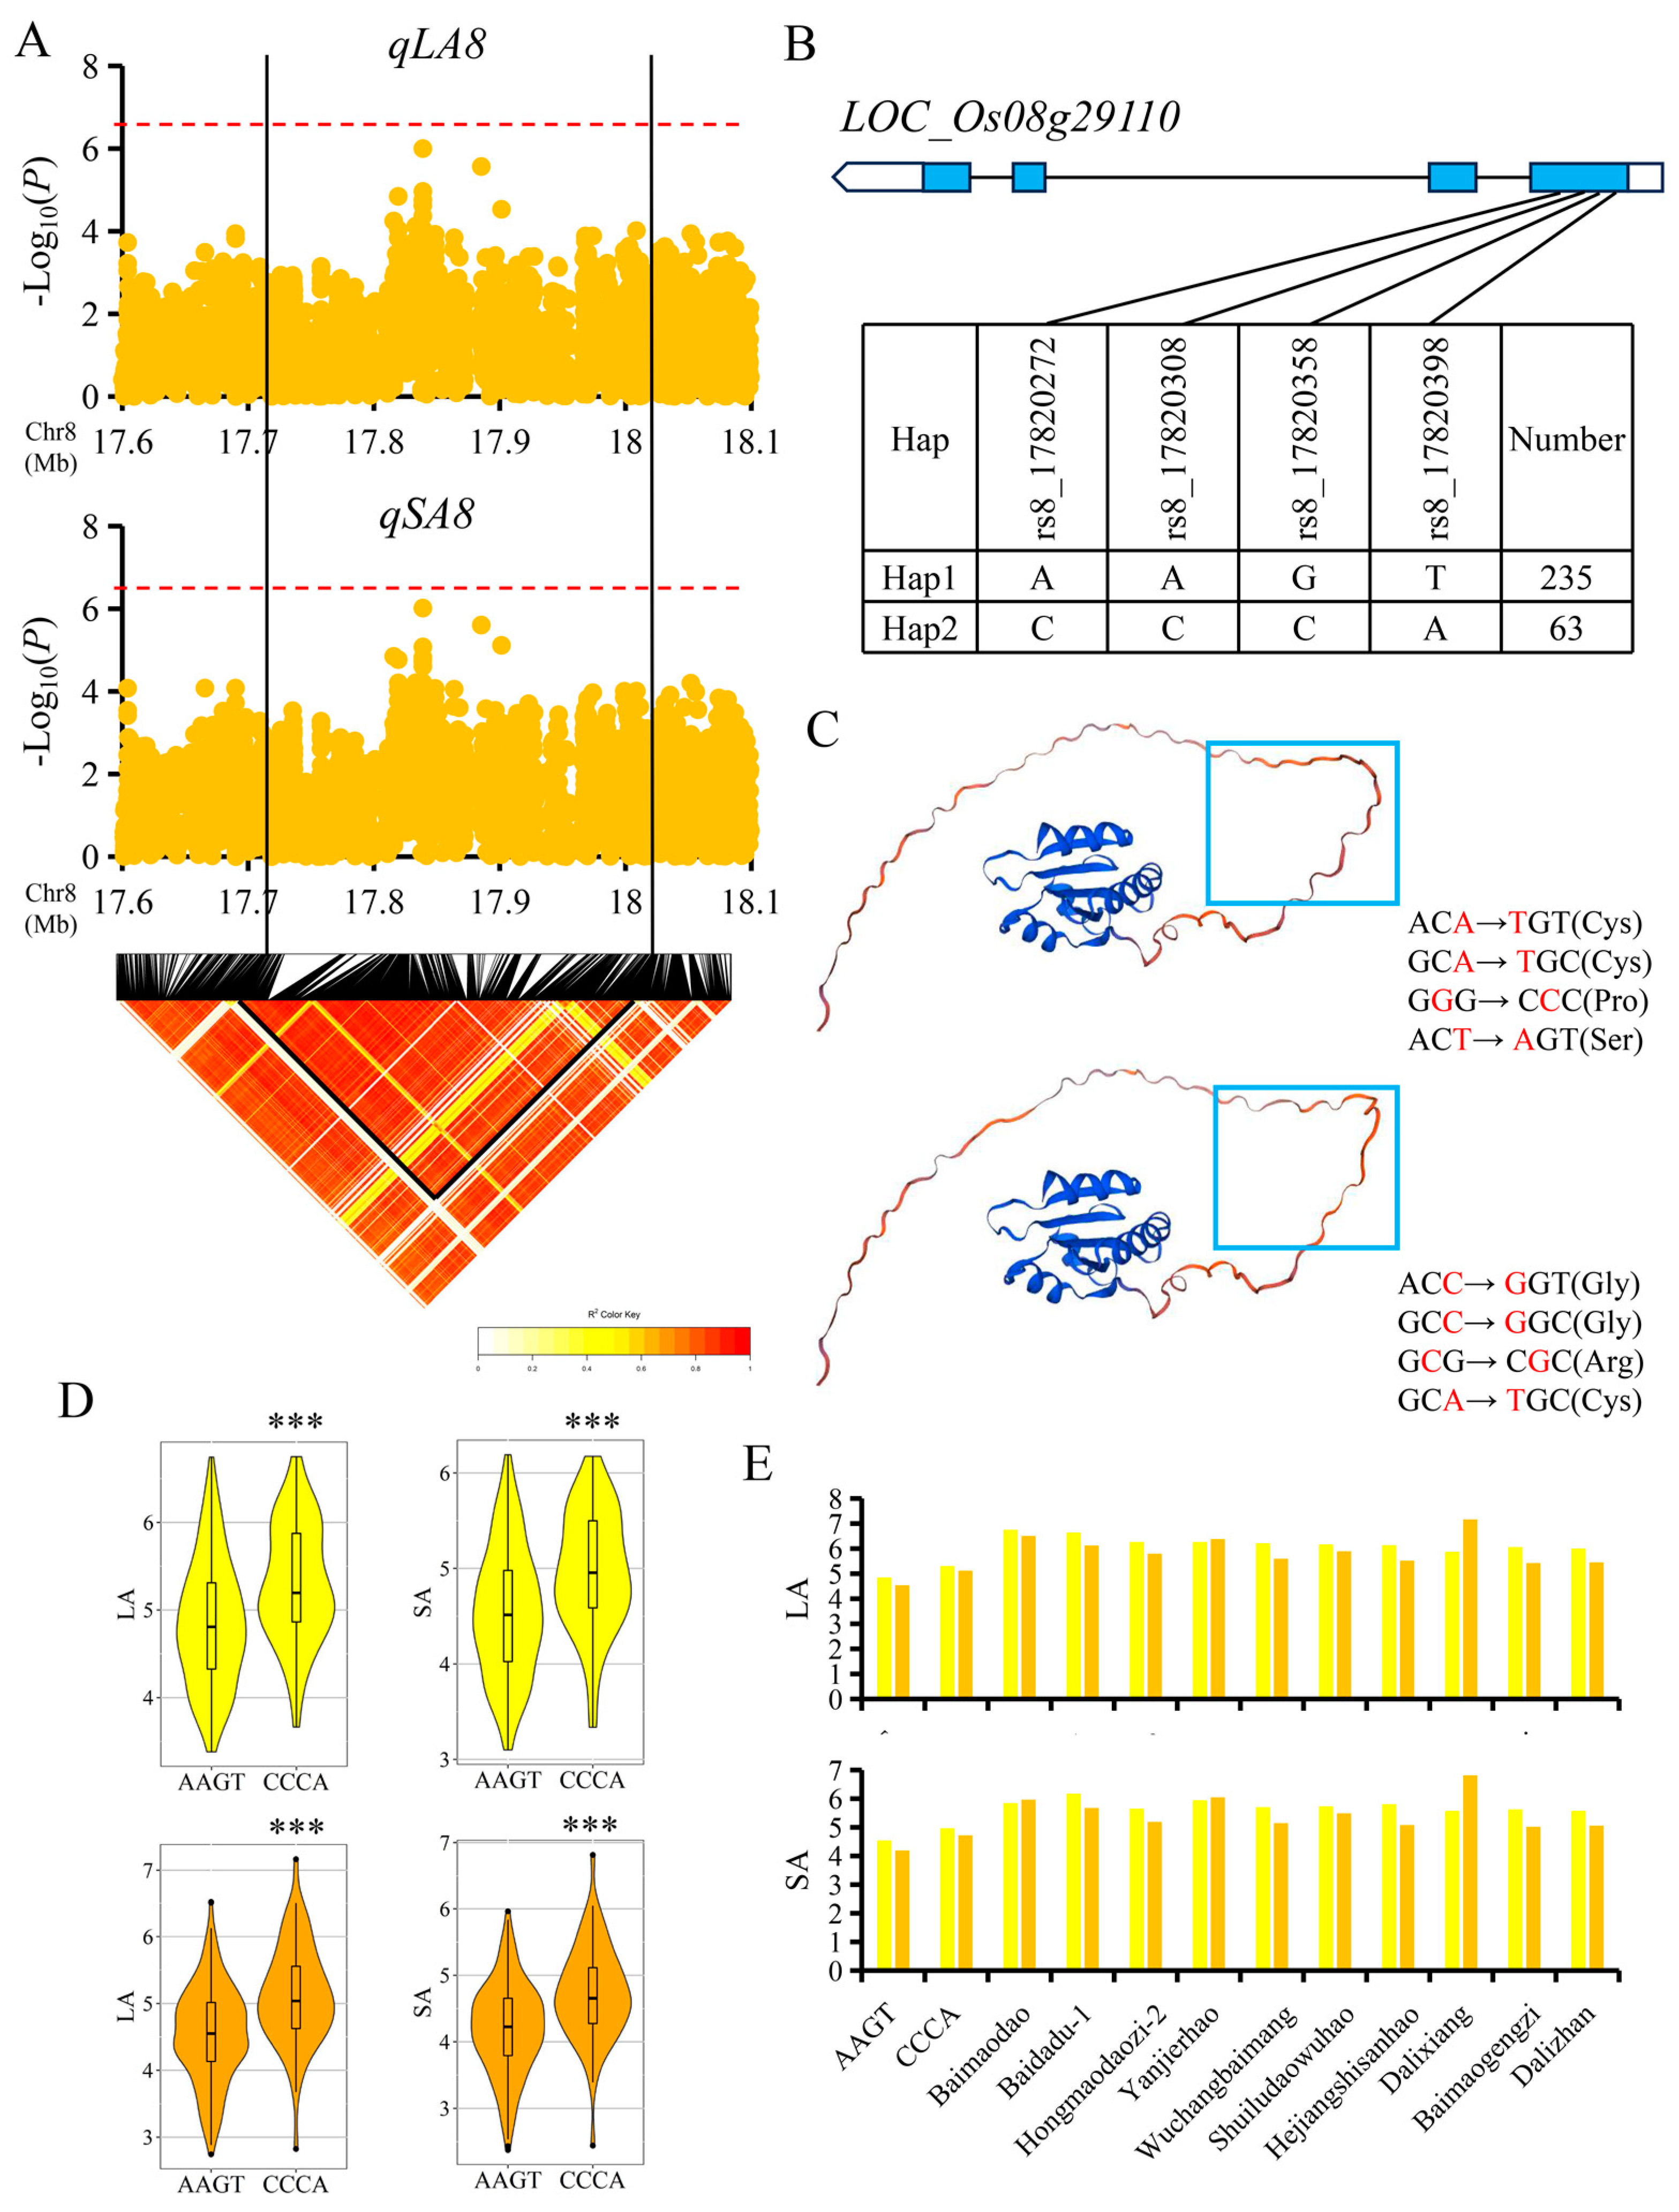
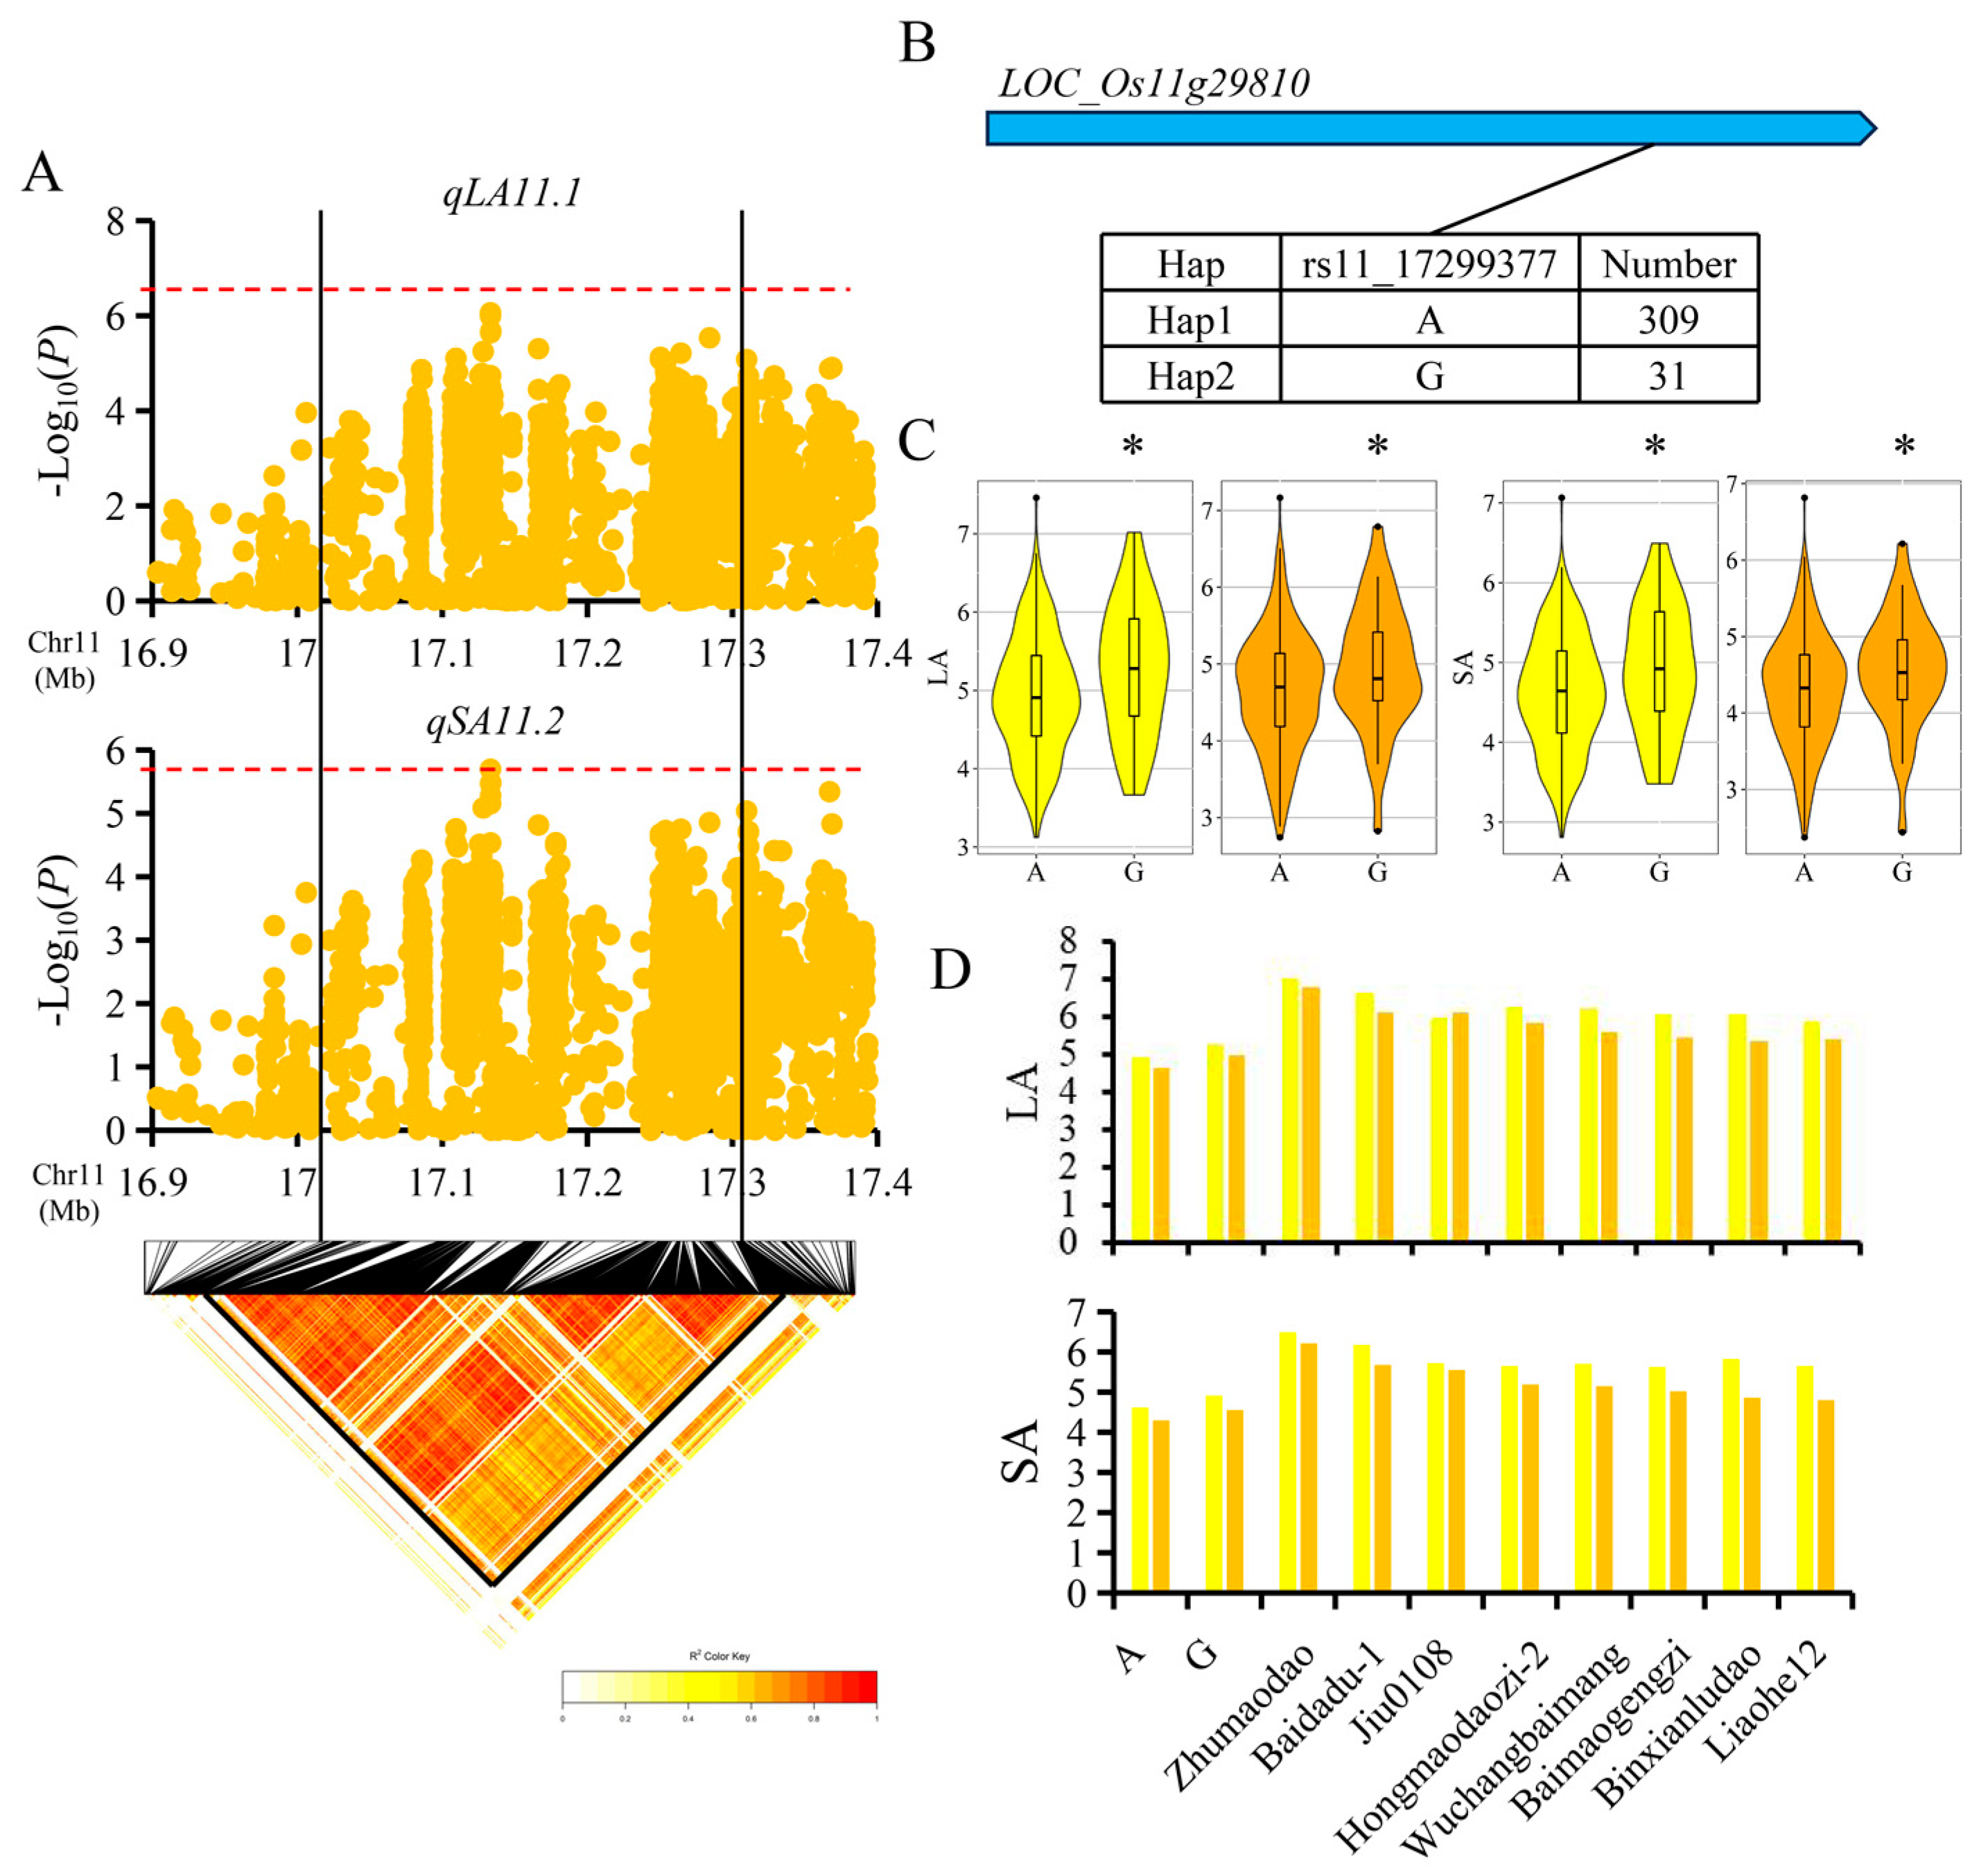
3.4. Candidate Gene Analysis for Important QTL

A QTL cluster (qLA7.1 and qSA7.1) consistently influencing LA and SA was mapped in the region of 15.40–15.68 Mb (282 kb) on chromosome 7, based on LD block analysis, containing 37 genes according to the Rice Genome Annotation Project Database (RAP-DB) (Figure S2). Only one SNP (rs7_15521491) was significantly associated with LA and SA in 2022 (Table 1; Figure S1), and there were only five SNPs (rs7_15409260, rs7_15450082, rs7_15450094, rs7_15450100 and rs7_15543215) strongly linked to rs7_15521491 (r2 > 0.6) (Table S3). Moreover, these SNPs were all located in the intron region within the genes. We were unable to determine which gene could influence LA and SA within this important QTL cluster.
There was no obvious LD block for the QTL cluster harboring qLA7.2, qSA7.2 and qPR7.3 on chromosome 7 around the lead SNP in this important QTL, based on LD block analysis (Figure 3A). The 50 SNP loci significantly associated with phenotypic values were as candidate SNP and the candidate region was identified at 28.88–29.37 Mb (497 kb) on chromosome 7 (Figure S1; Table S4). According to the SNP annotation results, the number located in the region of the promoter, 5′-UTR, CDS, intron and 3′-UTR within the genes was seven, two, five, three and two, respectively. Besides, a total of 31 SNPs were in the intergenic region (Table S4). The five SNPs (rs7_28922985, rs7_28967938, rs7_29077790, rs7_29256983 and rs7_29372749) in the CDS were all missense variants, and the five genes (LOC_Os07g48400, LOC_Os07g48440, LOC_Os07g48570, LOC_Os07g48890 and LOC_Os07g49060) where the missense variants were located were candidate genes (Table S4). Haplotype analysis demonstrated that only LOC_Os07g48890 was identified with no significant differences in the mean value of LA, SA and PR, among the different haplotypes (Figure S3). Only LOC_Os07g48570 of the left four genes was highly expressed in the stem (Figure S4). When the haplotype changed from C to T, the average phenotypic values for LA, SA and PR with haplotype C were significantly higher than those with haplotype T at the significant level 0.001 (Figure 3B,C). Finally, eight materials (Suigengbahao, Jigeng88, T188, Yanjierhao, Mudanjiang27, Beidaosanhao, Baidadu-1 and Zhumaodao) that carried the excellent haplotype C were screened out for molecular marker-assisted selection (Figure 3D).
The QTL cluster harboring qLA8 and qSA8 was identified in the region of 17.72–18.04 Mb (320 kb) on chromosome 8, based on LD block analysis (Figure 4A). Only the SNPs rs8_17838906 and rs8_17885340 were significantly associated with the measured traits LA or SA (Figure S1 and Figure 4A). A total of 2581 SNPs were strongly linked to SNP rs8_17838906 or rs8_17885340, based on the LD block analysis (Table S5). According to the SNP annotation results, the number located in the region of the promoter, 5′-UTR, CDS, intron and 3′-UTR within the genes were 229, 16, 242, 606 and 110, respectively. In addition, a total of 1378 SNPs were in the intergenic region (Table S5). Among the SNPs in the CDS region, 85 belonged to the missense variant and they were contained in 20 genes (LOC_Os08g28960, LOC_Os08g28970, LOC_Os08g28980, LOC_Os08g29040, LOC_Os08g29100, LOC_Os08g29110, LOC_Os08g29140, LOC_Os08g29150, LOC_Os08g29160, LOC_Os08g29180, LOC_Os08g29220, LOC_Os08g29230, LOC_Os08g29240, LOC_Os08g29270, LOC_Os08g29280, LOC_Os08g29340, LOC_Os08g29350, LOC_Os08g29380, LOC_Os08g29390 and LOC_Os08g29400) (Table S5). Then, we performed haplotype analysis on the 20 genes using the missense variant. The haplotype analysis demonstrated that only LOC_Os08g29280 was identified with no significant differences in the mean value for the LA and SA, among the different haplotypes (Figure S5). There were four candidate genes (LOC_Os08g28970, LOC_Os08g29110, LOC_Os08g29150 and LOC_Os08g29160) of the left 19 genes that were expressed in the stem (Figure S6). LOC_Os08g29110 was the most likely candidate gene affecting the LA and SA for this QTL cluster, according to the report that LOC_Os08g29110 (wp2) was the RNA polymerase subunit encoded by plastids [28]. There were four missense variants between Hap1 and Hap2 (Figure 4B), and when the haplotype changed from AAGT to CCCA, the structure of the protein encoded by the gene also changed (Figure 4C). The average phenotypic values for the LA and SA with haplotype CCCA were significantly higher than those with haplotype AAGT (Figure 4D). Finally, ten materials (Baimaodao, Baidadu-1, Hongmaodaozi-2, Yanjierhao, Wuchangbaimang, Shuiludaowuhao, Dalixiang, Baimaogengzi and Dalizhan) that carried the excellent haplotype CCCA were screened out for molecular marker-assisted selection (Figure 4E).
Based on the results from the LD block analysis, the QTL cluster harboring qLA11.1 and qSA11.2 was identified in the region of 17.08–17.32 Mb (235 kb) on chromosome 11 (Figure 5A). A total of 1938 SNPs were strongly linked to one of the six SNPs (rs11_17133191, rs11_17133196, rs11_17133200, rs11_17133283, rs11_17133286 and rs11_17133442) significantly associated with the LA or SA in 2022 (Figure S1 and Figure 5A), based on the LD block analysis (Table S6). According to the SNP annotation results, 171 belonged to the missense variant and they were contained in 16 genes (LOC_Os11g29420, LOC_Os11g29480, LOC_Os11g29490, LOC_Os11g29510, LOC_Os11g29520, LOC_Os11g29530, LOC_Os11g29610, LOC_Os11g29620, LOC_Os11g29630, LOC_Os11g29720, LOC_Os11g29740, LOC_Os11g29750, LOC_Os11g29790, LOC_Os11g29800, LOC_Os11g29810 and LOC_Os11g29820) (Table S6). The haplotype analysis demonstrated that only four genes (LOC_Os11g29750, LOC_Os11g29800, LOC_Os11g29810 and LOC_Os11g29820) were identified with significant differences in the mean value for both the LA and SA, among the different haplotypes (Figure S7). Only LOC_Os11g29810 was expressed in different tissues in the rice (Figure S8). There was one missense variant between Hap1 and Hap2 (Figure 5B), and the average phenotypic values for the LA and SA with haplotype G were significantly higher than those with haplotype A at the significant level 0.05 (Figure 5C). Finally, eight materials (Zhumaodao, Baidadu-1, Jiu0108, Hongmaodaozi-2, Wuchangbaimang, Baimaogengzi, Binxianludao and Liaohe12) that carried the excellent haplotype G were screened out for molecular marker-assisted selection (Figure 5D).
A QTL cluster consistently influencing the PR and BR was mapped in the region of 21.45–21.75 Mb (301 kb) on chromosome 11, based on LD block analysis, containing 44 genes according to the Rice Genome Annotation Project Database (RAP-DB) (Figure 6A). There were 1294 SNPs strongly linked to one of the three SNPs (rs11_21490514, rs11_21609754 and rs11_21609763) significantly associated with the PR or BR in 2022 (Figure S1 and Figure 6A), based on the LD block analysis (Table S7). Among the 1294 SNPs, a total of 54 belonged to the missense variant and they were located on 16 genes (LOC_Os11g36420, LOC_Os11g36430, LOC_Os11g36440, LOC_Os11g36450, LOC_Os11g36460, LOC_Os11g36470, LOC_Os11g36480, LOC_Os11g36610, LOC_Os11g36740, LOC_Os11g36760, LOC_Os11g36790, LOC_Os11g36800, LOC_Os11g36820, LOC_Os11g36840, LOC_Os11g36860 and LOC_Os11g36870), according to the SNP annotation results (Table S7). The haplotype analysis demonstrated that only seven genes (LOC_Os11g36420, LOC_Os11g36440, LOC_Os11g36450, LOC_Os11g36470, LOC_Os11g36740, LOC_Os11g36820 and LOC_Os11g36870) were identified with significant differences in the mean value for both the BR and PR, among the different haplotypes (Figure S9). LOC_Os11g36420, LOC_Os11g36440, LOC_Os11g36470 and LOC_Os11g36740 were highly expressed in the stem (Figure S10). LOC_Os11g36440 (MHZ5) encoded a carotenoid isomerase and the mhz5 mutants grown in the field showed excessive tillering, a smaller panicle, reduced main and secondary branches, a shorter internode, a longer and narrower seed grain type, shorter root length, fewer advection roots and increased lateral roots [29]. The structure of the protein was changed when the haplotype changed from AACA to TCAT (Figure 6B,C). The average phenotypic values for the BR and PR with haplotype TCAT were significantly higher than those with haplotype AACA (Figure 6D). Finally, two materials (Beidaosanhao and Jiu0108) that carried the excellent haplotype TCAT were screened out for molecular marker-assisted selection (Figure 6E).

4. Discussion

4.1. Selection of Test Materials

Lodging resistance is an important trait for the high yield and quality of rice [8,30]. At present, high-yielding rice with a large panicle type are more prone to lodging [31]. To date, a lot of research has been conducted on how to balance lodging resistance and the yield of rice, but these efforts have not been very successful because of the negative trade-offs between the stem strength and grain yield [31]. Greater strength was shown in the geng subgroup than that in the xian subgroup [19], and lodging is easily affected by the environment, especially during rain or windy conditions [8]. Diverse population structures could lead to false positive results in genome-wide association analyses (GWAS) [32]. In order to make the mapping results more accurate and select superior candidate genes or marker resources for marker-assisted selection (MAS), we chose 395 temperate geng panels (Table S1) with greater strength, which had no obvious population structure (Figure 2B–D), to perform GWAS in this research. We expected to detect candidate genes that resisted lodging but did not affect yield, resulting in a balance between the yield and lodging resistance.

4.2. Characteristics of Lodging Resistance

It was reported that the culm strength for lodging resistance could be contributed to by the stem diameter (containing the stem long axis (LA) and short axis (SA)), thickness (TK), breaking resistance (BR), and pushing resistance (PR) [33,34]. And then, we calculated the eccentricity (ET) of the stem cross section by using 1 S A 2 L A 2 as one of the indicators of lodging resistance. There was no significant correlation between the ET and the other five traits in the two years, except for the SA in 2022 (Figure 1C). In this research, the wide range and significant phenotypic diversity in the population for the measured traits showed the polygenic control of the traits (Figure 2A). Among the six lodging resistance-related traits, the LA, SA, PR and BR showed high broad-sense heritability, which indicated that these traits were less affected by the environment and that the mapping results would be more accurate. Understanding the genetic basis of these lodging traits will help to induce lodging resistance in the breeding gene pool.

4.3. Comparisons of QTL Detected in This Study with Previously Reported QTL

To date, various genes/QTLs governing lodging resistance-related traits have been reported. Among them, SCM3 was reported to control the culm morphology by affecting the strigolactones (SLs) signaling pathway. SCM3 acted on the downstream of strigolactones, encoded a transcription factor of the TCP family, inhibited the extension of lateral buds of rice, and negatively regulated the number of tillers in rice [7,8]. SCM2, identical to APO1, has been reported as being able to control the culm diameter and culm morphology by encoding an F-box domain-containing protein [9,10]. Moreover, sd1 was reported for its short stature by encoding a GA20-2 oxidase in the gibberellin synthesis pathway, resulting in lodging resistance [11,12]. Compared with wild-type Nipponbare, the base internode of the ckx2 mutant was thickened, resulting in increased lodging resistance [13,14]. These cloned genes were not mapped in this study. Among the five important QTL clusters (qLA7.1 and qSA7.1, qLA7.2, qSA7.2 and qPR7.3, qLA8 and qSA8, qLA11.1 and qSA11.2, and qPR11 and qBR11.1) detected in this research, the QTL cluster, containing qPR11 and qBR11.1, which was detected in the region of 21.45–21.75 Mb on chromosome 11, was mapped together with the previously reported QTL qPR11-11 affecting the PR, which was located on the chromosome from 21.22 Mb to 23.05 Mb [11]. The QTL cluster, containing qLA11.1 and qSA11.2, was included in the reported QTL qPR11-10 mapped on chromosome 11 from 16.65 Mb to 22.48 Mb [19]. In previous research, no candidate genes affecting lodging resistance were detected in these two QTL regions. The left three QTL clusters were newly detected in this research.

4.4. Candidate Gene Identification for Important QTL

We performed GWAS for the six lodging resistance-related traits and chose the important QTLs detected for the same trait in both the two years or for the different traits in the same year to explore the candidate genes. No QTL was detected for the ET and TK. Then, four important candidate genes (LOC_Os07g48570, LOC_Os08g29110, LOC_Os11g29810 and LOC_Os11g36440) were detected in five important QTL clusters affecting at least one of the traits, LA, SA, BR and PR, through annotation analysis of significant SNPs, haplotype analysis, gene differential expression analysis and annotation analysis of the candidate genes (Figure 3, Figure 4, Figure 5 and Figure 6; Table S8).
LOC_Os07g48570 (OsDof-23), the most likely candidate gene for the QTL cluster harboring qLA7.2, qSA7.2 and qPR7.3, was reported as a transcription factor belonging to the Dof gene families [35]. Dof proteins are a family of plant-specific transcription factors containing a particular class of zinc-finger DNA-binding domain, which play important roles in many biological processes restricted to plants. Among the 30 Dof genes found in the rice (Oryza sativa) genome, OsDof-23 had not been reported to be associated with lodging resistance [35]. As the non-synonymous SNP rs_29077790 in LOC_Os07g48570 changed from C to T, there were significant differences among different haplotypes in the LA, SA and PR for LOC_Os07g48570, suggesting that LOC_Os07g48570 probably affected the LA, SA and PR (Figure 3C). Further, we selected eight materials carrying the superior haplotype (Hap1) that could be used for molecular marker-assisted selection (Figure 3D).
LOC_Os08g29110 (wp2), the most likely candidate gene for the QTL cluster harboring qLA8 and qSA8, was reported as an RNA polymerase subunit encoded by plasmid [28]. Plastid multiple organellar RNA editing factors (MORFs) are the regulatory targets of thioredoxin z. The OsTRX z protein physically interacted with the OsMORFs in a redox-dependent manner and the redox state of a conserved cysteine in the MORF box was essential for MORF–MORF interactions [28]. In this study, when the haplotype changed from Hap1 (AAGT) to Hap2 (CCCA), the 3D structure of the proteins that they translated changed significantly (Figure 4C). And it was highly expressed in the stem (Figure S6). These results all indicated that wp2 was the most likely gene affecting the LA and SA in this candidate region. The haplotype CCCA was the superior haplotype based on the haplotype analysis results, and we selected ten materials for molecular marker-assisted selection (Figure 4D,E).
There were no related reports on LOC_Os11g29810, the candidate gene for the QTL cluster harboring qLA11.1 and qSA11.2, based on the results of the differential expression analysis and haplotype analysis (Figure S8 and Figure 5). Hence, whether it affected the LA and SA needed further verification.
LOC_Os11g36440 (MHZ5), the most likely candidate gene for the QTL cluster harboring qPR11 and qBR11.1, could encode a carotenoid isomerase and the mutation in the mhz5 blocks carotenoid biosynthesis, reduces ABA accumulation and promotes ethylene production in etiolated seedlings [29]. The MHZ5-mediated ABA pathway likely acts upstream, but negatively regulates ethylene signaling to control coleoptile growth. The mhz5 mutants grown in the field showed excessive tillering, a smaller panicle, reduced main and secondary branches, a shorter internode, a longer and narrower seed grain type, shorter root length, fewer advection roots and increased lateral roots [29]. In this study, when the haplotype changed from Hap1 (AACA) to Hap2 (TCAT), the structure of the proteins they translated changed significantly (Figure 6C). And it was highly expressed in the stem (Figure S10). These results all indicated that MHZ5 was the most likely gene affecting the PR and BR in this candidate region. The haplotype TCAT was the superior haplotype based on the haplotype analysis results, and we selected two materials (Beidaosanhao and Jiu0108) for molecular marker-assisted selection (Figure 6D,E).
To summarize, wp2, MHZ5 and OsDof-23 were the candidate genes affecting both the LA and SA, both the PR and BR, and the LA, SA and PR, respectively. But these results need to be validated by building genetically modified materials.

4.5. Application of Gene Pyramiding in Rice Breeding for Lodging Resistance

Lodging resistance is a complex quantitative trait controlled by multiple genes, and rice breeders are not able to develop superior lodging-resistant varieties by using only one strong culm gene. To develop superior lodging-resistant varieties, we need to accumulate multiple QTLs for a strong culm [36]. The QTL pyramiding method was used for accumulating beneficial QTLs by using maker-assisted selection (MAS) [37].
In this study, we further developed the pyramiding alleles carrying dominant haplotypes for the three candidate genes and evaluated the lodging resistance of the different combinations (Table S9 and Table 2). These materials could be divided into seven haplotype combinations (from PHap1 to PHap7), based on the haplotype analysis results for the three candidate genes (wp2, MHZ5 and OsDof-23). Among them, PHap1 and PHap7 carried all the superior haplotypes and none of the three candidate genes, respectively. PHap2 carried the superior haplotypes of wp2 and OsDof-23, and PHap3 carried the superior haplotypes of MHZ5 and OsDof-23. PHap4, PHap5 and PHap6 carried the superior haplotype of wp2, MHZ5 and OsDof-23, respectively (Table S9 and Table 2).
The results of polymerization showed that the panels carrying all the dominant haplotypes had the best lodging resistance and the panels carrying none of the dominant haplotypes had the worst lodging resistance (Table 2). PHap2 with the superior haplotype of wp2 and OsDof-23 showed a higher mean value for the LA and SA, but lower mean values for the BR, because both the two genes were detected in the LA and SA, but not in the BR (Table 2). Similarly, PHap3 with the superior haplotype of MHZ5 and OsDof-23 showed a higher mean value for the PR and BR (Table 2). These results demonstrated that pyramiding QTLs/genes for a strong culm improved lodging resistance in rice. And then, two (DaLiXiang and YanJi2Hao), thirteen (LongDao2Hao, BaiDaDu, HongMang, BinXianLuDao, WuChangBaiMang, BaiMaoGengZi, HeiZhanDao, DaLiZhan, LongHuaDaHongYu, DaLiDao, TangYuan6 (JingZu), GaiLiangGuoZhu and BaiZhan) and ten panels (LongGeng9Hao, LongDun102, BeiDao3Hao, JiGeng87Hao, HeXi15, CaiZhongPu, JiGeng91Hao, AoYu320, AoYu324 and LongDao10Hao) carrying PHap1, PHap2 and PHap3, respectively, were selected for molecular marker-assisted selection in rice to improve lodging resistance (Table S9 and Table 2). Furthermore, we will examine whether the yield and quality of rice are affected and we expect to improve lodging resistance, but do not wish to affect the yield and quality, resulting in a balance between the yield and lodging resistance.

5. Conclusions

We identified 50 QTL affecting the six lodging resistance−related traits using 395 temperate geng accessions via GWAS. A total of ten candidate genes of five important QTL clusters were detected by performing gene differential expression analysis and haplotype analysis. In addition, the most likely candidate genes (OsDof-23, wp2 and MHZ5) were identified based on functional annotations. And then, two, thirteen and ten panels carrying PHap1, PHap2 and PHap3, respectively, were selected for molecular marker−assisted selection in rice to improve lodging resistance. The results may facilitate the breeding of rice varieties resistant to lodging, to overcome the adverse effects of climate change.

Supplementary Materials

The following supporting information can be downloaded at: https://www.mdpi.com/article/10.3390/agronomy13112711/s1, Figure S1: Manhattan plots of genome-wide association for lodging resistance-related traits in the 395 panel. Blue dashed line in Manhattan plots represents the significant thresholds (–log10P = 5.59). Highlighted SNPs in light green are significantly harboring the measured traits. Figure S2: Candidate region analysis of the QTL cluster harboring qLA7.1 and qSA7.1 on chromosome 7. Dashed lines show the threshold to determine significant SNPs. Black lines indicate the candidate region for the peak SNP. Figure S3: Haplotype analysis for the candidate genes of the QTL cluster harboring qLA7.2, qSA7.2 and qPR7.3 in the two years. Yellow and orange indicate 2021 and 2022, respectively. Figure S4: Gene expression differential display of the candidate genes of the QTL cluster harboring qLA7.2, qSA7.2 and qPR7.3. Figure S5: Haplotype analysis for the candidate genes of the QTL cluster harboring qLA8 and qSA8 in the two years. Yellow and orange indicate 2021 and 2022, respectively. Figure S6: Gene expression differential display of the candidate genes of the QTL cluster harboring qLA8 and qSA8. Figure S7: Haplotype analysis for the candidate genes of the QTL cluster harboring qLA11.1 and qSA11.2 in the two years. Yellow and orange indicate 2021 and 2022, respectively. Figure S8: Gene expression differential display of the candidate genes of the QTL cluster harboring qLA11.1 and qSA11.2. Figure S9: Haplotype analysis for the candidate genes of the QTL cluster harboring qPR11 and qBR11.1 in the two years. Yellow and orange indicate 2021 and 2022, respectively. Figure S10: Gene expression differential display of the candidate genes of the QTL cluster harboring qPR11 and qBR11.1. Table S1: List of the 395 accessions including country of origin, variety name, PC score, lodging resistance-related traits measured in 2021 and 2022. Table S2: Distributions of markers used in GWAS on chromosomes. Table S3: Annotation analysis of SNPs which significantly harbor phenotypic values and which are strongly linked to these significant SNPs within the QTL cluster harboring qLA7.1 and qSA7.1. Table S4: Annotation analysis of SNPs which significantly harbor phenotypic values within the QTL cluster harboring qLA7.2, qSA7.2 and qPR7.3. Table S5: Annotation analysis of SNPs which significantly harbor phenotypic values and which are strongly linked to these significant SNPs within the QTL cluster harboring qLA8 and qSA8. Table S6: Annotation analysis of SNPs which significantly harbor phenotypic values and which are strongly linked to these significant SNPs within the QTL cluster harboring qLA11.1 and qSA11.2. Table S7: Annotation analysis of SNPs which significantly harbor phenotypic values and which are strongly linked to these significant SNPs within the QTL cluster harboring qPR11 and qBR11.1. Table S8: Detailed information on the candidate genes. Table S9: Analysis of the dominant haplotype polymerization for three important candidate genes, wp2, MHZ5 and OsDof-23.

Author Contributions

Conceptualization, K.C. and J.X.; methodology, D.L. and L.Z.; software, L.Z.; validation, K.C. and J.X.; formal analysis, D.L. and L.Z.; investigation, D.L., N.R., S.Z. and D.W.; resources, K.C. and J.X.; data curation, L.Z., D.L. and N.R.; writing—original draft preparation, L.Z.; writing—review and editing, L.Z. and J.X.; visualization, L.Z.; supervision, C.S., K.C. and J.X.; project administration, K.C. and J.X.; funding acquisition, J.X. and K.C. All authors have read and agreed to the published version of the manuscript.

Funding

This research was funded by Science and Technology Program of Shenzhen Municipality (JCYJ20200109150713553).

Data Availability Statement

The original contributions presented in the study are included in the article/Supplementary Materials. Further inquiries can be directed to the corresponding authors.

Conflicts of Interest

The authors declare no conflict of interest.

References

  1. Chen, T.X.; Shabala, S.; Niu, Y.N.; Cheng, Z.H.; Shabala, L.; Meinke, H.; Venkataraman, G.; Pareek, A.; Xu, J.L.; Zhou, M.X. Molecular mechanisms of salinity tolerance in rice. Crop J. 2021, 9, 506–520. [Google Scholar] [CrossRef]
  2. Wang, X.; Pang, Y.; Wang, C.; Chen, K.; Zhu, Y.; Shen, C.; Ali, J.; Xu, J.; Li, Z. New candidate genes affecting rice grain appearance and milling quality detected by genome-wide and gene-based association analyses. Front. Plant Sci. 2017, 7, 1998. [Google Scholar] [CrossRef]
  3. Murchie, E.H.; Pinto, M.; Horton, P. Agriculture and the new challenges for photosynthesis research. New Phytol. 2009, 181, 532–552. [Google Scholar] [CrossRef] [PubMed]
  4. Berry, P.M.; Sterling, M.; Spink, J.H.; Baker, C.J.; Ennos, A.R. Understanding and Reducing Lodging in Cereals. Adv. Agron. 2004, 84, 217–271. [Google Scholar] [CrossRef]
  5. Islam, M.S.; Peng, S.; Visperas, R.M.; Ereful, N.; Bhuiya, M.S.U.; Julfiquar, A. Lodging-related morphological traits of hybrid rice in a tropical irrigated ecosystem. Field Crops Res. 2007, 1, 240–248. [Google Scholar] [CrossRef]
  6. Kashiwagi, T.; Ishimaru, K. Identification and functional analysis of a locus for improvement of lodging resistance in rice. Plant Physiol. 2004, 134, 676–683. [Google Scholar] [CrossRef] [PubMed]
  7. Yano, K.; Ookawa, T.; Aya, K.; Ochiai, Y.; Hirasawa, T.; Ebitani, T.; Takarada, T.; Yano, M.; Yamamoto, T.; Fukuoka, S.; et al. Isolation of a novel lodging resistance QTL gene involved in strigolactone signaling and its pyramiding with a QTL gene involved in another mechanism. Mol. Plant 2015, 8, 303–314. [Google Scholar] [CrossRef]
  8. Meng, B.; Wang, T.; Luo, Y.; Xu, D.; Li, L.; Diao, Y.; Gao, Z.; Hu, Z.; Zheng, X. Genome-wide association study identified novel candidate loci/genes affecting lodging resistance in rice. Genes 2021, 12, 718. [Google Scholar] [CrossRef]
  9. Ookawa, T.; Hobo, T.; Yano, M.; Murata, K.; Ando, T.; Miura, H.; Asano, K.; Ochiai, Y.; Ikeda, M.; Nishitani, R.; et al. New approach for rice improvement using a pleiotropic QTL gene for lodging resistance and yield. Nat. Commun. 2010, 1, 132. [Google Scholar] [CrossRef]
  10. Rashid, M.A.R.; Zhao, Y.; Zhang, H.; Li, J.J.; Li, Z. Nucleotide diversity, Natural variation and evolution of Flexible culm-1 and Strong culm-2 lodging resistance genes in rice. Genome 2016, 59, 473–483. [Google Scholar] [CrossRef] [PubMed]
  11. Monna, L.; Kitazawa, N.; Yoshino, R.; Suzuki, J.; Masuda, H.; Maehara, Y.; Tanji, M.; Sato, M.; Nasu, S.; Minobe, Y. Positional cloning of rice semidwarfing gene, sd-1: Rice “green revolution gene” encodes a mutant enzyme involved in gibberellin synthesis. DNA Res. 2022, 9, 11–17. [Google Scholar] [CrossRef]
  12. Su, S.; Hong, J.; Chen, X.; Zhang, C.; Chen, M.; Luo, Z.; Chang, S.; Bai, S.; Liang, W.; Liu, Q.; et al. Gibberellins orchestrate panicle architecture mediated by DELLA-KNOX signalling in rice. Plant Biotechnol. J. 2021, 19, 2304–2318. [Google Scholar] [CrossRef]
  13. Tu, B.; Tao, Z.; Wang, S.; Zhou, L.; Zheng, L.; Zhang, C.; Li, X.; Zhang, X.; Yin, J.; Zhu, X.; et al. Loss of Gn1a/OsCKX2 confers heavy-panicle rice with excellent lodging resistance. J. Integr. Plant Biol. 2022, 64, 23–38. [Google Scholar] [CrossRef]
  14. Rong, C.; Liu, Y.; Chang, Z.; Liu, Z.; Ding, Y.; Ding, C. Cytokinin oxidase/dehydrogenase family genes exhibit functional divergence and overlap in rice growth and development, especially in control of tillering. J. Exp. Bot. 2022, 73, 3552–3568. [Google Scholar] [CrossRef]
  15. Huang, X.; Wei, X.; Sang, T.; Zhao, Q.; Feng, Q.; Zhao, Y.; Li, C.; Zhu, C.; Lu, T.; Zhang, Z.; et al. Genome-wide association studies of 14 agronomic traits in rice landraces. Nat. Genet. 2010, 42, 961–967. [Google Scholar] [CrossRef]
  16. Huang, X.; Zhao, Y.; Wei, X.; Li, C.; Wang, A.; Zhao, Q.; Li, W.; Guo, Y.; Deng, L.; Zhu, C.; et al. Genome-wide association study of flowering time and grain yield traits in a worldwide collection of rice germplasm. Nat. Genet. 2011, 44, 32–39. [Google Scholar] [CrossRef]
  17. Kumar, V.; Singh, A.; Mithra, S.V.; Krishnamurthy, S.L.; Parida, S.K.; Jain, S.; Tiwari, K.K.; Kumar, P.; Rao, A.R.; Sharma., S.K.; et al. Genome-wide association mapping of salinity tolerance in rice (Oryza sativa). DNA Res. 2015, 22, 133–145. [Google Scholar] [CrossRef] [PubMed]
  18. Zhai, L.; Zheng, T.; Wang, X.; Wang, Y.; Chen, K.; Wang, S.; Wang, Y.; Xu, J.; Li, Z. QTL mapping and candidate gene analysis of peduncle vascular bundle related traits in rice by genome-wide association study. Rice 2018, 11, 13. [Google Scholar] [CrossRef]
  19. Rashid, M.A.R.; Atif, R.M.; Zhao, Y.; Azeem, F.; Ahmed, H.G.M.-D.; Pan, Y.; Pan, Y.H.; Li, D.T.; Zhao, Y.; Zhang, Z.Y.; et al. Dissection of genetic architecture for tiller angle in rice (Oryza sativa. L) by multiple genome-wide association analyses. PeerJ 2022, 10, e12674. [Google Scholar] [CrossRef]
  20. Zhai, L.Y.; Wang, Y.; Yan, A.; Chen, L.Q.; Shao, K.T.; Zhang, W.Z.; Xu, J.L. Genetic bases of flow- and sink-related traits in rice revealed by genome-wide association study. Agronomy 2022, 12, 776. [Google Scholar] [CrossRef]
  21. Li, X.; Chen, Z.; Zhang, G.; Lu, H.; Qin, P.; Qi, M.; Yu, Y.; Jiao, B.; Zhao, X.; Gao, Q.; et al. Analysis of genetic architecture and favorable allele usage of agronomic traits in a large collection of Chinese rice accessions. Sci. China Life Sci. 2020, 63, 1688–1702. [Google Scholar] [CrossRef]
  22. Purcell, S.; Neale, B.; Todd-Brown, K.; Thomas, L.; Ferreira, M.A.; Bender, D.; Maller, J.; Sklar, P.; de Bakker, P.I.; Daly, M.J.; et al. PLINK: A tool set for whole-genome association and population-based linkage analyses. Am. J. Hum. Genet. 2007, 81, 559–575. [Google Scholar] [CrossRef]
  23. Li, M.X.; Yeung, J.M.Y.; Cherny, S.S.; Sham, P.C. Evaluating the effective numbers of independent tests and significant p-value thresholds in commercial genotyping arrays and public imputation reference datasets. Hum. Genet. 2011, 131, 747–756. [Google Scholar] [CrossRef]
  24. Kang, H.M.; Sul, J.H.; Service, S.K.; Zaitlen, N.A.; Kong, S.; Freimer, N.B.; Sabatti, C.; Eskin, E. Variance component model to account for sample structure in genome-wide association studies. Nat. Genet. 2010, 42, 348–354. [Google Scholar] [CrossRef] [PubMed]
  25. Shin, J.H.; Blay, S.; Mcneney, B.; Graham, J. LDheatmap: An R function for graphical display of pairwise linkage disequilibria between single nucleotide polymorphisms. J. Stat. Softw. 2006, 16, 1–9. [Google Scholar] [CrossRef]
  26. Yano, K.; Yamamoto, E.; Aya, K.; Takeuchi, H.; Lo, P.C.; Hu, L.; Yamasaki, M.; Yoshida, S.; Kitano, H.; Hirano, K.; et al. Genome-wide association study using whole-genome sequencing rapidly identifies new genes influencing agronomic traits in rice. Nat. Genet. 2016, 48, 927–934. [Google Scholar] [CrossRef] [PubMed]
  27. Sakai, H.; Lee, S.S.; Tanaka, T.; Numa, H.; Kim, J.; Kawahara, Y.; Wakimoto, H.; Yang, C.C.; Iwamoto, M.; Abe, T.; et al. Rice Annotation Project Database (RAP-DB): An integrative and interactive database for rice genomics. Plant Cell Physiol. 2013, 54, e6. [Google Scholar] [CrossRef]
  28. Wang, Y.; Wang, Y.; Ren, Y.; Duan, E.; Zhu, X.; Hao, Y.; Zhu, J.; Chen, R.; Lei, J.; Teng, X.; et al. White panicle2 encoding thioredoxin z, regulates plastid RNA editing by interacting with multiple organellar RNA editing factors in rice. New Phytol. 2021, 229, 2693–2706. [Google Scholar] [CrossRef]
  29. Yin, C.C.; Ma, B.; Collinge, D.P.; Pogson, B.J.; He, S.J.; Xiong, Q.; Duan, K.X.; Chen, H.; Yang, C.; Lu, X.; et al. Ethylene responses in rice roots and coleoptiles are differentially regulated by a carotenoid isomerase-mediated abscisic acid pathway. Plant Cell 2015, 27, 1061–1081. [Google Scholar] [CrossRef]
  30. Khush, G.S. Origin, dispersal, cultivation and variation of rice. Plant Mol. Biol. 1997, 35, 25–34. [Google Scholar] [CrossRef]
  31. Hirano, K.; Ordonio, R.L.; Matsuoka, M. Engineering the lodging resistance mechanism of post-Green Revolution rice to meet future demands. Proc. Jpn. Acad. Ser. B Phys. Biol. Sci. 2017, 93, 220–233. [Google Scholar] [CrossRef] [PubMed]
  32. Atwell, S.; Huang, Y.S.; Vilhjalmsson, B.J.; Willems, G.; Horton, M.; Al, E. Genome-wide association study of 107 phenotypes in Arabidopsis thaliana inbred lines. Nature 2010, 465, 627–631. [Google Scholar] [CrossRef] [PubMed]
  33. Ishimaru, K.; Togawa, E.; Ookawa, T.; Kashiwagi, T.; Madoka, Y.; Hirotsu, N. New target for rice lodging resistance and its effect in a typhoon. Planta 2008, 227, 601–609. [Google Scholar] [CrossRef]
  34. Hu, H.; Liu, W.; Fu, Z.; Homann, L.; Technow, F.; Wang, H.; Song, C.; Li, S.; Melchinger, A.E.; Chen, S. QTL mapping of stalk bending strength in a recombinant inbred line maize population. Theor. Appl. Genet. 2013, 126, 2257–2266. [Google Scholar] [CrossRef]
  35. Lijavetzky, D.; Carbonero, P.; Vicente-Carbajosa, J. Genome-wide comparative phylogenetic analysis of the rice and Arabidopsis Dof gene families. BMC Evol. Biol. 2003, 23, 17. [Google Scholar] [CrossRef]
  36. Ookawa, T.; Nomura, T.; Kamahora, E.; Jiang, M.; Ochiai, Y.; Samadi, A.F.; Yamaguchi, T.; Adachi, S.; Katsura, K.; Motobayashi, T. Pyramiding of multiple strong-culm genes originating from indica and tropical japonica to the temperate japonica rice. Sci. Rep. 2022, 12, 15400. [Google Scholar] [CrossRef]
  37. Ashikari, M.; Matsuoka, M. Identification, isolation and pyramiding of quantitative trait loci for rice breeding. Trends Plant Sci. 2006, 11, 344–350. [Google Scholar] [CrossRef]
Figure 1. Phenotypic analysis. (A) Phenotypic distribution of the six lodging resistance−related traits in 2021 and 2022. (B) Broad−sense heritability (H2) for the six lodging resistance−related traits. (C) Correlations between the six tested traits. The values are correlation coefficients. The areas and colors of the ellipses correspond to the absolute values of the corresponding r. Right and left oblique ellipses indicate positive and negative correlations, respectively. Values without glyphs were insignificant at the 0.05 probability level. *** represent significant correlations at p < 0.001.
Agronomy 13 02711 g001
Figure 2. Genotypic analysis. (A) The number of SNPs within 0.5 Mb window size. (B) Screen plot based on the variance of PCs. (C) PCA plot based on the screen plot in the rice diversity panel. (D) Heatmap of kinship with the tree shown on the top and left.
Agronomy 13 02711 g002
Figure 3. Candidate gene analysis of the QTL cluster harboring qLA7.2, qSA7.2 and qPR7.3 on chromosome 7. (A) Local Manhattan plot (top) and LD block (bottom) surrounding the peak SNP on chromosome 7. Dashed lines show the threshold to determine significant SNPs. Black lines indicate the candidate region for the peak SNP. (B) Exon–intron structure of LOC_Os07g48570 and DNA polymorphism in that gene. (C) Boxplots for LA, SA and PR based on the haplotypes (Hap) for LOC_Os07g48570 in the two years. *** represent significant correlations at p < 0.001. (D) Materials with excellent haplotypes. Yellow and orange indicate 2021 and 2022, respectively.
Agronomy 13 02711 g003
Figure 4. Candidate gene analysis of the QTL cluster harboring qLA8 and qSA8 on chromosome 8. (A) Local Manhattan plot (top) and LD block (bottom) surrounding the peak SNP on chromosome 8. Dashed lines show the threshold to determine significant SNPs. Black lines indicate the candidate region for the peak SNP. (B) Exon−intron structure of LOC_Os08g29110 and DNA polymorphism in that gene. (C) Protein structures translated by different haplotypes. (D) Boxplots for LA and SA based on the haplotypes (Hap) for LOC_Os08g29110 in the two years. *** represent significant correlations at p < 0.001. (E) Materials with excellent haplotypes. Yellow and orange indicate 2021 and 2022, respectively.
Agronomy 13 02711 g004
Figure 5. Candidate gene analysis of the QTL cluster harboring qLA11.1 and qSA11.2 on chromosome 11. (A) Local Manhattan plot (top) and LD block (bottom) surrounding the peak SNP on chromosome 11. Dashed lines show the threshold to determine significant SNPs. Black lines indicate the candidate region for the peak SNP. (B) Exon–intron structure of LOC_Os011g29810 and DNA polymorphism in that gene. (C) Boxplots for LA and SA based on the haplotypes (Hap) for LOC_Os011g29810 in the two years. (D) Materials with excellent haplotypes. * represent significant correlations at p < 0.05. Yellow and orange indicate 2021 and 2022, respectively.
Agronomy 13 02711 g005
Figure 6. Candidate gene analysis of the QTL cluster harboring qPR11 and qBR11.1 on chromosome 11. (A) Local Manhattan plot (top) and LD block (bottom) surrounding the peak SNP on chromosome 11. Dashed lines show the threshold to determine significant SNPs. Black lines indicate the candidate region for the peak SNP. (B) Exon–intron structure of LOC_Os011g36440 and DNA polymorphism in that gene. (C) Protein structures translated by different haplotypes. (D) Boxplots for PR and BR based on the haplotypes (Hap) for LOC_Os011g36440 in the two years. * and *** represent significant correlations at p < 0.05 and p < 0.001, respectively. Yellow and orange indicate 2021 and 2022, respectively. (E) Materials with excellent haplotypes.
Agronomy 13 02711 g006
Table 1. Summary of QTLs affecting lodging resistance-related traits detected in the two years.
TraitsQTLYearPeak SNPp-Value
PRqPR12021rs1_350166326.20 × 10−7
qPR22022rs2_246653621.43 × 10−6
qPR32021rs3_153884786.62 × 10−7
qPR4.12021rs4_307330994.20 × 10−7
qPR4.22021rs4_332122601.36 × 10−6
qPR52021rs5_34505508.12 × 10−7
qPR6.12021rs6_4193051.67 × 10−6
qPR6.22021rs6_31591241.88 × 10−6
qPR6.32022rs6_233163861.05 × 10−6
qPR6.42021rs6_305891941.75 × 10−6
qPR7.12021rs7_31364957.89 × 10−7
qPR7.22021rs7_88199011.85 × 10−7
qPR7.32021rs7_292237625.07 × 10−09
2022rs7_290706652.75 × 10−09
qPR82021rs8_263307793.70 × 10−7
qPR10.12021rs10_157655352.14 × 10−6
qPR10.22021rs10_209494947.55 × 10−7
qPR112022rs11_214905149.92 × 10−7
qPR122021rs12_202739802.05 × 10−6
BRqBR22021rs2_246793185.23 × 10−7
qBR32022rs3_149745315.80 × 10−7
qBR5.12022rs5_158091951.69 × 10−6
qBR5.22022rs5_297016302.06 × 10−6
qBR72022rs7_4007112.30 × 10−6
qBR82022rs8_81996601.16 × 10−6
qBR102022rs10_7990812.16 × 10−6
qBR11.12022rs11_216097634.02 × 10−7
qBR11.22022rs11_220213657.35 × 10−8
qBR11.32022rs11_229317299.97 × 10−7
LAqLA4.12022rs4_81914611.30 × 10−6
qLA4.22022rs4_103311011.93 × 10−6
qLA7.12022rs7_155214911.22 × 10−6
qLA7.22021rs7_292823041.88 × 10−6
qLA82022rs8_178389069.98 × 10−7
qLA11.12022rs11_171332008.64 × 10−7
qLA11.22021rs11_267846242.83 × 10−7
SAqSA7.12022rs7_155214911.51 × 10−6
qSA7.22021rs7_292823041.43 × 10−6
qSA82022rs8_178389069.63 × 10−7
qSA11.12021rs11_45133371.99 × 10−6
qSA11.22022rs11_171332002.01 × 10−6
ETqET12021rs1_23970011.86 × 10−6
qET42021rs4_112195687.19 × 10−7
qET8.12021rs8_25774893.67 × 10−7
qET8.22022rs8_96279332.48 × 10−7
qET8.32021rs8_164349248.32 × 10−7
qET92021rs9_37111774.62 × 10−7
qET112021rs11_277350877.94 × 10−7
TKqTK22021rs2_92076671.48 × 10−6
qTK52021rs5_140521092.48 × 10−6
qTK102021rs10_75808462.33 × 10−6
Table 2. Summary of dominant haplotype polymerization of three important candidate genes wp2, MHZ5 and OsDof-23.
Haplotype PyramidingCount of PanelsGenesTraits
wp2MHZ5OsDof-23PRLASABR
20212022202120222021202220212022
PHap12+++1.1901.6716.0716.7735.7606.4323.8539.783
PHap213++0.6420.5985.4515.0685.0834.6113.4932.878
PHap310++0.7840.8515.1894.7654.8524.4404.5544.193
PHap442+0.6000.6575.2325.0174.8994.6484.0594.453
PHap56+0.6440.6365.1464.8574.9124.5794.3613.610
PHap632+0.6950.7075.2324.8784.8734.4993.7963.464
PHap71640.4900.5354.7464.4434.4564.1043.4463.300
“+”: Carrying dominant haplotype of candidate genes; “−”: Not carrying dominant haplotype of candidate genes.
Disclaimer/Publisher’s Note: The statements, opinions and data contained in all publications are solely those of the individual author(s) and contributor(s) and not of MDPI and/or the editor(s). MDPI and/or the editor(s) disclaim responsibility for any injury to people or property resulting from any ideas, methods, instructions or products referred to in the content.

