Article

Exploitation of a Grafting Technique for Improving the Water Use Efficiency of Eggplant (Solanum melongena L.) Grown in a Cold Greenhouse in Mediterranean Climatic Conditions

1
National Research Council of Italy, Institute of Biomolecular Chemistry (CNR-ICB), Via P. Gaifami 18, 95126 Catania, Italy
2
Department of Agricultural Sciences, Food and Environment-Di3A, University of Catania, Via Valdisavoia 5, 95123 Catania, Italy
*
Author to whom correspondence should be addressed.
Agronomy 2023, 13(11), 2705; https://doi.org/10.3390/agronomy13112705
Submission received: 10 October 2023 / Revised: 23 October 2023 / Accepted: 25 October 2023 / Published: 27 October 2023
(This article belongs to the Section Water Use and Irrigation)

Abstract

:
Grafting techniques have been intricately associated with the optimization of water use efficiency (WUE). In this study, various eggplant (Solanum melongena L.) rootstock–scion combinations were compared under three irrigation regimes (IR): 50% deficit in water volume (IR50), a doubling of irrigation volume (IR200), and normal watering (IR100). The cultivar Black Bell (Bb) was employed as a scion, while the rootstock adopted included the F1 hybrids Energy (En) and Beaufort (Be) and one accession of S. torvum (To). The trial encompassed the evaluation of no- and self-grafted plants. Plants grown in a cold greenhouse in Sicily were assessed for their morphological parameters, as well as their fruit production and quality. The leaf analysis encompassed the evaluation of chromatic parameters and water potential. Significant variation was observed for plant height, exhibiting the lowest values in self-grafted combinations. The leaf water potential varied significantly in relation to the rootstock–scion combination employed and to the irrigation regime. Fruit quality traits displayed significant variations for chromatic parameters L* and a*, as well as for the fruit’s longitudinal and transversal diameters and the soluble solid content. The number of fruits and fruit production per plant varied significantly in relation to the rootstock–scion combination; the highest fruit production was recorded for Black Bell grafted onto S. torvum grown by IR50. The fruit weight displayed a significant interaction between the experimental factors under study. Notably, for the WUE calculated in relation to fruit production, a significant interaction between the experimental factors studied was ascertained. The highest WUE was registered for IR50, specifically for To/Bb. This research aims to develop a comprehensive water-efficient organic farming protocol for sustainable agriculture.

1. Introduction

The grafting technique for vegetable crops is a highly effective method for controlling pests and diseases and for promoting plant growth and development. This technique renders the fusion of two distinct plant genotypes at the grafting point possible, with the aim of enhancing the scion attributes of rusticity and vigor [1] This ancient practice involves the fusion of the tissues of two different plant varieties to create a single, stronger organism that can control pests and diseases better, thereby improving crop yield and produce quality [1,2,3]. Grafting is a widely adopted global practice for the management of soil-borne pests and diseases, particularly those that can substantially impact the cultivation of Solanaceae and Cucurbitaceae plant families [4,5,6].
This technique is intricately linked to water use efficiency (WUE), which is a measure that elucidates how effectively a plant utilizes water resources for producing biomass and product yield [7,8]. WUE represents the amount of water required to generate the obtained yield. It can also be evidenced by the ratio of biomass obtained under ordinary irrigation regimes, considering the amount of water consumed through plant evapotranspiration during plant growth and development processes, compared to the deficit irrigation ones. Furthermore, WUE quantifies how efficiently plants convert water into useful outputs in terms of growth and crop production [9,10]. It is a crucial parameter in agriculture and ecology because it reflects a plant’s ability to thrive in water-limited environments, which have an impact on photosynthetic activity [11,12,13]. The exploitation of the WUE trait is particularly valuable in regions where water resources are limited, or in the face of changing climate conditions where droughts are more frequent [14,15,16]. Drought stress can impact not only the quantity of crop yield but also its quality, potentially altering the production of metabolites [16,17,18]. The improvement of the crop WUE is a key objective in agricultural research as it can lead to more sustainable and resilient agricultural practices. It can reduce water waste and increase crop productivity in water-stressed areas. Consequently, both grafting techniques and strategies aimed at enhancing WUE hold significant promise for adoption in organic farming conditions, contributing to more efficient and environmentally friendly agricultural practices [19,20,21,22,23]. Within this context, organic farming needs the development of suitable genetic materials and cultivars capable of thriving under organic farming. This often requires the use of biotechnological tools [24,25].
While the primary purpose of grafting is often to combine desirable traits, such as disease resistance or improved fruit amount and quality, its connection to water use efficiency cannot be understood. One of the most critical aspects of grafting in relation to WUE is the choice of rootstock. The rootstock, often chosen for its adaptability to specific environmental conditions, plays a pivotal role in regulating water uptake and distribution within the grafted plant [26,27]. Different rootstocks can exhibit varied levels of drought tolerance, water absorption efficiency, and resistance to waterborne diseases. By carefully selecting a rootstock that suits the local climate and soil conditions, growers can optimize water utilization. Moreover, grafting can enhance a plant’s WUE by reducing the overall water demand of the plant [28,29,30]. When grafting is successful, the scion can benefit from the well-established root system of the rootstock. This means that the scion may require less water to sustain itself since it can draw upon the rootstock’s water reserves. As a result, grafted plants can thrive in conditions where non-grafted counterparts might struggle due to limited water availability [31,32].
In the present study, the tested eggplant genotypes, encompassing different combinations of rootstocks and scions (including self and non-grafted plants), were evaluated under three levels of irrigation management. The different irrigation regimes consisted of a 50% deficit in water volume (IR50), a doubling of irrigation volume (IR200), and normal watering (IR100). Hence, a primary objective of this study was to assess how plant growth and development are influenced by altering the water volume, specifically by using either half or double the normal irrigation amount. This evaluation took into account various combinations of rootstocks known for their ability to access water from deeper soil layers. Another objective of this study was to identify the most effective combinations under conditions of water deficiency, with the aim of improving water use efficiency (WUE). This study aimed to develop novel agricultural protocols specifically designed for organic farming. Bio-morphometric analysis of the plants was carried out, including the analysis of fruits’ quality traits. Moreover, leaf chromatic parameters and water potential were evaluated to determine how leaf tissue responded in accordance with the plant’s hydration status under the three distinct irrigation regimes studied.

2. Materials and Methods

2.1. Plant Material

The trial was conducted in a cold greenhouse located in Marina di Ragusa (RG, Sicily, Italy). This area was chosen for its representativeness of Sicilian greenhouse cultivation, primarily due to the presence of rot-knot nematodes. The geographical coordinates of the greenhouse were 36°47′15.5″ N, 14°33′18.6″ E.
A split-plot experimental design was employed with four replicates for each combination of the two experimental factors under consideration. The first experimental factor concerned the various genotypes (GEs), which were represented by the distinct rootstock–scion combinations, and the second experimental factor encompassed the irrigation regime (IR), involving the adoption of three distinct watering levels. As concerns the evaluated GE, the eggplant cultivar Black Bell (Bb) from the seed company PetoSeed was employed as the scion in each combination. The rootstock utilized included the interspecific tomato hybrid F1 Beaufort (Be), the intraspecific tomato hybrid F1 Energy (En), and one accession of the wild species Solanum torvum belonging to the GenBank of vegetables of the Dipartimento di Agricoltura, Alimentazione e Ambiente (Di3A) of the Catania University. In addition to the previously mentioned combinations, the auto-grafted and the non-grafted plants of the cv Black Bell were also evaluated (Bb/Bb and Bb, respectively). Consequently, all the rootstock–scion combinations tested were To/Bb, Be/Bb, En/Bb, the self-grafted Bb/Bb, and the non-grafted Bb.
Sowing was conducted in cellular trays, and the plantlets were transplanted during the second decade of October 2021. All grafting combinations were executed using the oblique cutting method in a specialized nursery. The transplanting occurred within a cold greenhouse that had previously hosted tomato (Solanum lycopersicum) cultivation in the growing season before the trial. The plants were cultivated at the crop density of 2 plants m−2 (0.5 m × 1.0 m). Plants were characterized using the morphological traits reported in Table 1, with their respective codes and units of measure.
During the growing cycle, plants were characterized for their bio morphometric parameters at 21, 42, and 84 days after transplanting (DAT). The traits evaluated during the growing cycle were plant height (PH), the basal diameter of the rootstock and of the scion (PBDR and PBDS, respectively), and the plant diameter at the grafting point (PDGP). These traits were also evaluated at the end of the growing cycle, which was in July 2021. Furthermore, during the growing cycle, the number of days required after transplanting for the first, second, third, and fourth flowers to open was also recorded. During the trial, the leaf chromatic CIEL*a*b* parameters were registered using the colorimeter (Chroma meter CR-200, MINOLTA, Osaka, Japan). In the leaf chromatic analysis performed, L* represented lightness, a* indicated the red/green coordinate, and b* signified the yellow/blue coordinate. The average air temperature throughout the growth cycle ranged from 11.5 °C in the second decade of December 2021 to 30.5 °C at the end of June 2022. The temperatures inside were recorded using the USB data logger (Testo, 174-T, Sparta, NJ, USA).

2.2. Differential Irrigation Set-Up

The second experimental factor was the irrigation regime (IR), which consisted of a 50% deficit in water volume (IR50), a doubling of irrigation volume (IR200), and normal watering (IR100). The total amounts of water per plant provided during the growing period were 46.40 L plant−1 for IR50, 92.80 L plant−1 for IR100, and 185.81 L plant−1 for IR200 (Table 2). Different irrigation volumes were applied in different phenological stages according to the Biologische Bundesanstalt, Bundessortenamt und Chemische Industrie (BBCH) scale index. The definition of the optimal requirement of water per plant was estimated according to previous works [33,34]. Particularly, the irrigation volume employed for the control IR100 was calculated following the model of “FAO irrigation and drainage paper number 56” proposed by Allen et al. [35]. This model, which is based on the Penman–Monteith formula [36], considered crop coefficients specific to eggplant cultivation in a cold greenhouse in Sicily, along with global solar radiation. To minimize soil evaporation, plastic mulching was adopted. To ensure the scheduled water supply to the plants, a dripping irrigation system managed by timers was employed. Notably, each irrigation thesis was spatially separated from the others by a border raw.

2.3. Fruit Analysis

Fruit quality traits were assessed, including chromatic parameters (FUL*, FUa*, and FUb*, respectively), longitudinal (FLD) and transversal diameters (FTD), dry matter content (FDM), and soluble solid content (FSSC) (Table 1). Chromatic CIEL*a*b* parameters of the fruits were measured using a colorimeter (Chroma meter CR-200, MINOLTA, Japan). Among the fruit chromatic parameters analyzed, L* indicated lightness, a* was the red/green coordinate, and b* was the yellow/blue coordinate. The soluble solid content was determined using a digital refractometer (DBX-55A, ATAGO, Italy, Milan). The fruit production components registered were the number of fruits per plant (FP), the weight of individual fruit (FEW), and the total fruit production per plant (FPP) (Table 1).

2.4. Water Use Efficiency (WUE)

WUE was calculated for the fruit production per plant (FPP) in relation to the volume of water used per plant. The formula used was in accordance with a previous study [37].
WUE = FPP · IW−1
where FPP was the fruit production per plant and IW was the water volume, expressed in m3, employed for the plant. WUE was expressed in kg m−3.

2.5. Leaf Water Potential

Leaf water potential (WP) values, measured in -MPa, were recorded on three specific days corresponding to distinct phenological phases, according to the BBCH index. The first assessment took place on January 26 during the phenological phase of the third visible flower bud, with temperatures ranging from 9 to 10 °C and relative humidity levels between 80% and 90%. The second assessment occurred during the fruit development phase, specifically at the first fruit cluster stage, with temperatures ranging from 27 to 32 °C and humidity levels of 40%. Finally, the third assessment was conducted during the phenological phase of fruit ripening, with temperatures ranging from 24.5 to 26 °C. The three assessments were chronologically labeled in the manuscript as A1c, A2h, and A3i, representing the assessments conducted in cold, hot, and intermediate temperature conditions, respectively. WP measurements were performed using the Scholander pressure chamber (PMS Instrument Company, PMS-600, Albany, OR, USA).

2.6. Data Analysis

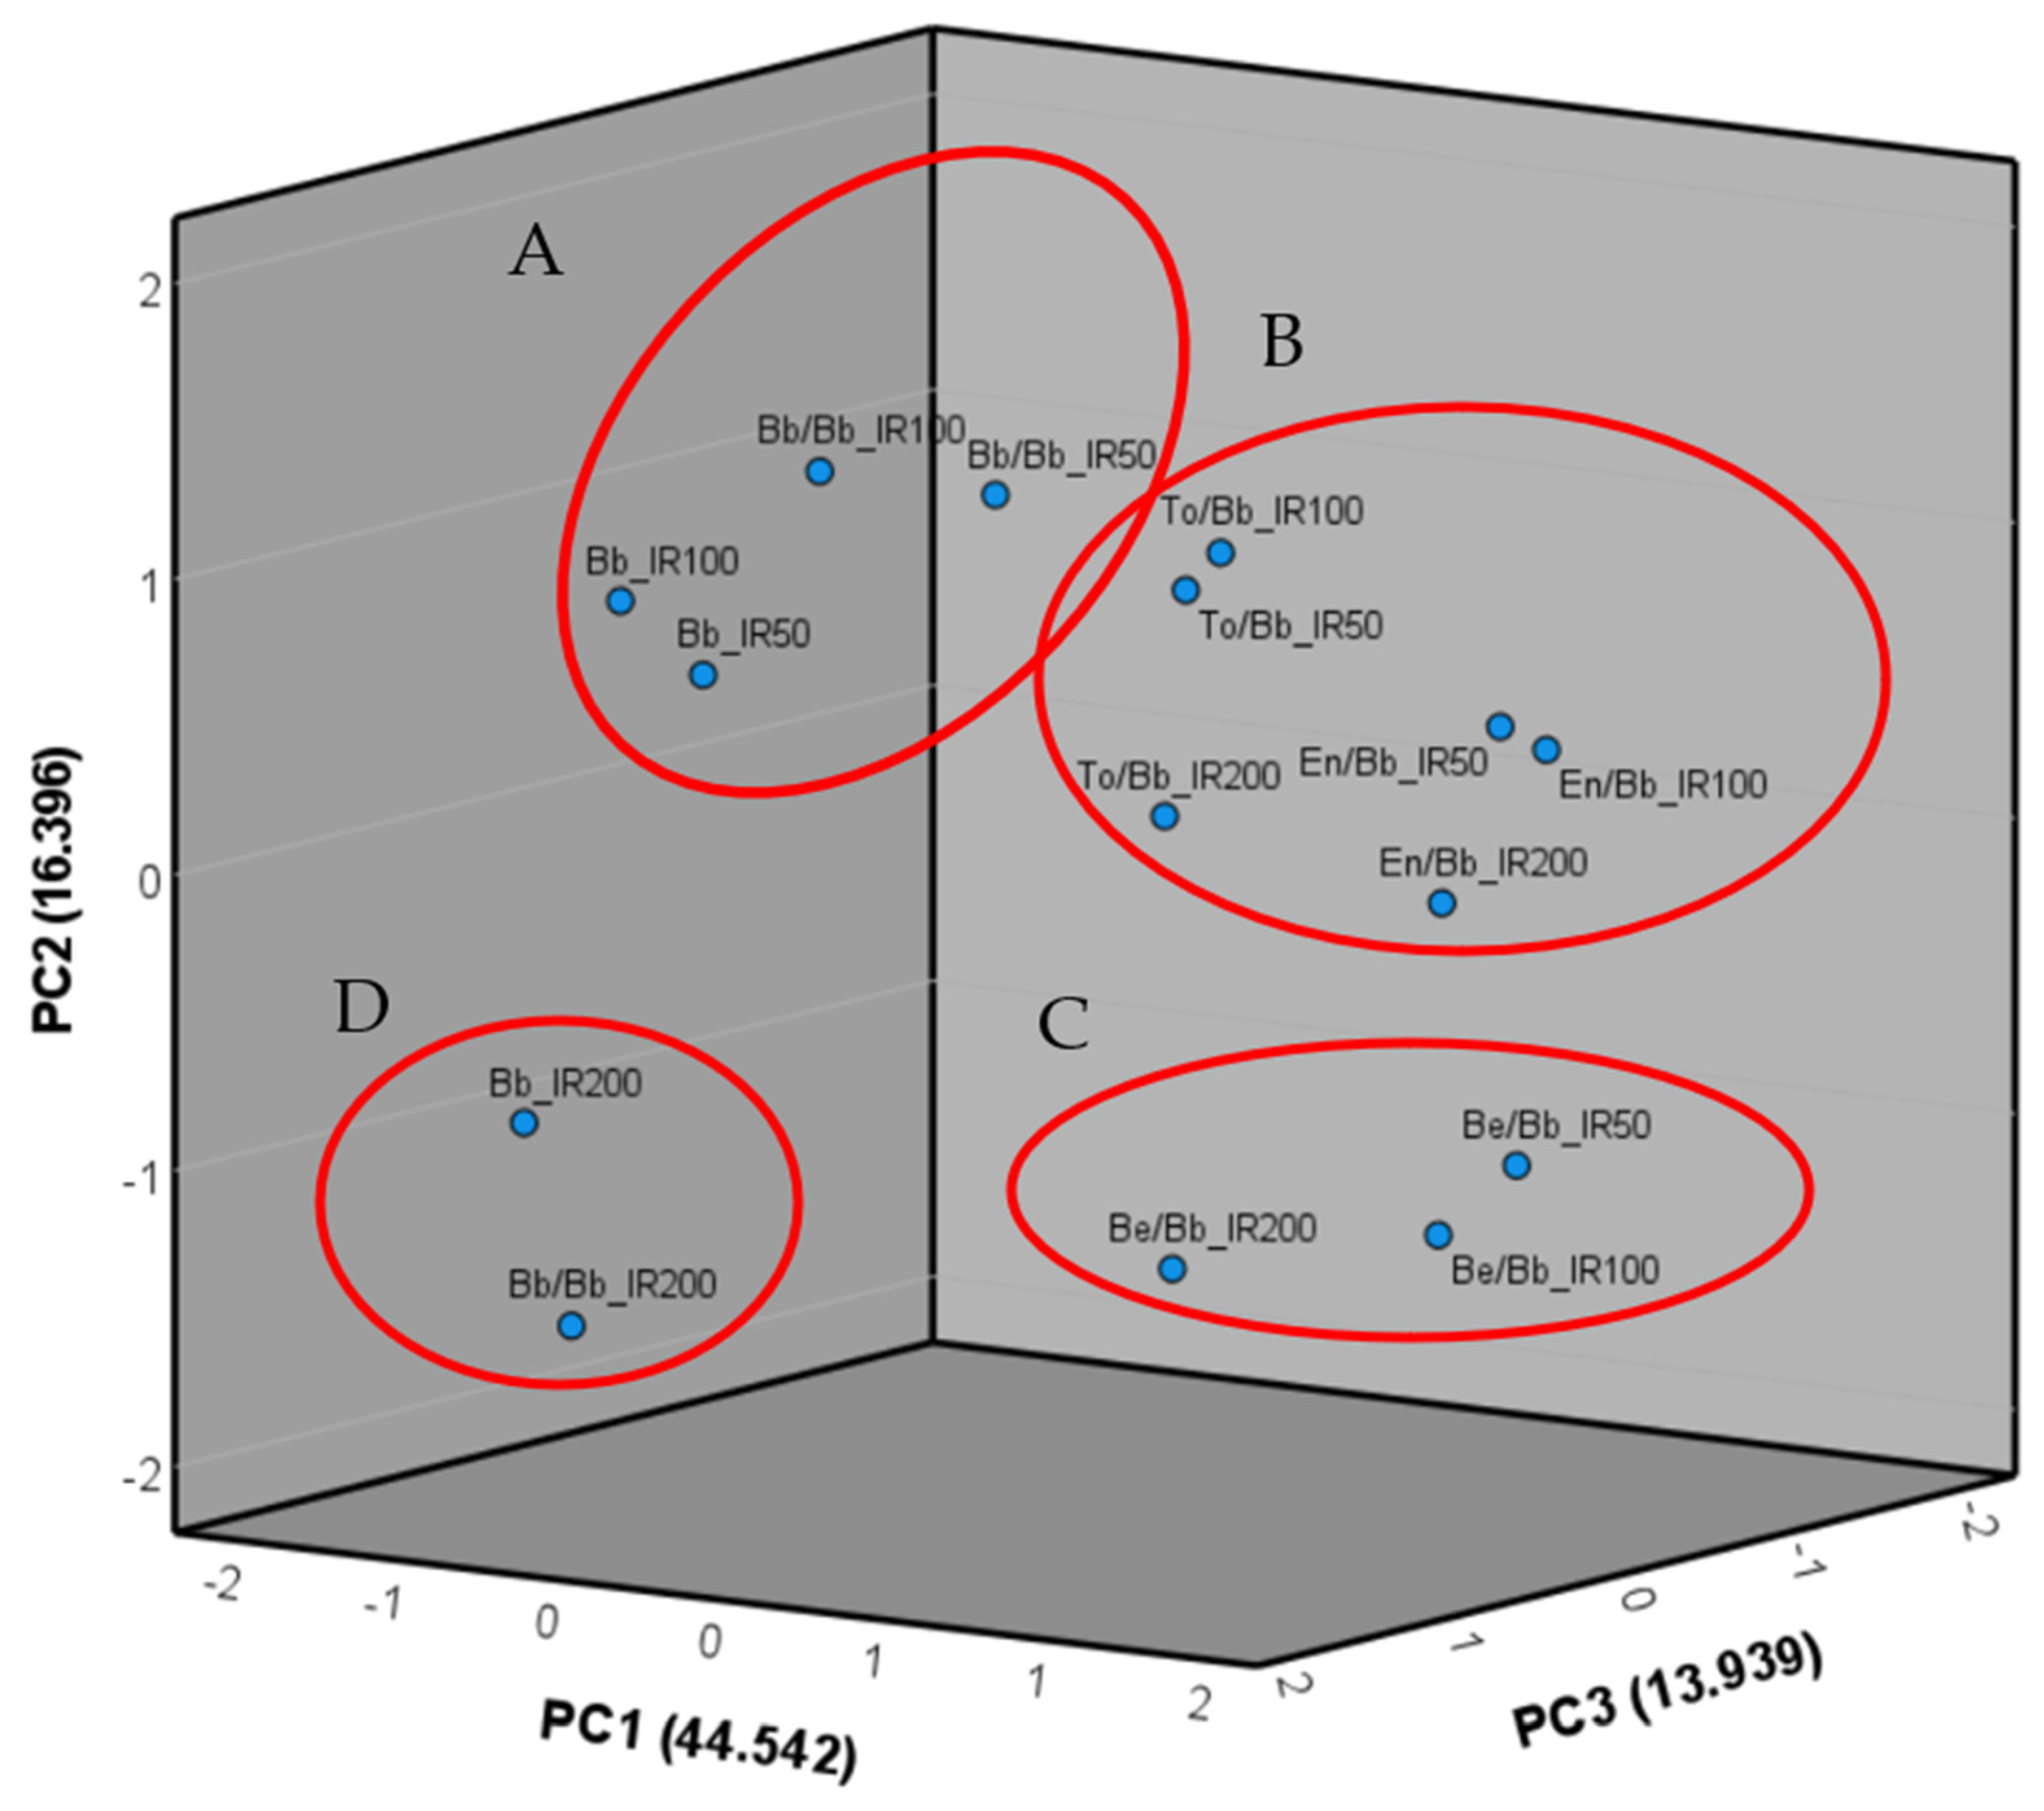
The data were subjected to analysis of variance (ANOVA) using the Newman–Keuls method, and this analysis was conducted using CoStat software version 6.4 (CoHort software, Birmingham, UK). The experimental design included the first factor consisting of four repetitions for each rootstock–scion combination (GE) and the second factor representing the three irrigation levels (IR). Tukey’s multiple comparisons test was also performed by CoStat software to assess significant differences in relation to the experimental factor studied. Subsequently, the means for each repetition were utilized to calculate Pearson’s correlations among all the examined traits, as well as to perform the principal components analysis (PCA) with the extraction of the three main components. Pearson’s correlation and the PCA were carried out using IBM SPSS version 27 software (IBM, Armonk, NY, USA).

3. Results

3.1. Plant Characterization during the Growing Cycle

Significant interactions between the genotype (GE) and the days after transplanting (DAT) were observed for the plant height (PH) recorded during the growing cycle. Similarly, there were significant interactions between the irrigation regime (IR) and the DAT for the PH (Table 3). In relation to the interaction GE × DAT, the PH ranged from 21.04 mm to 60.58 mm for Bb/Bb grown at 21 DAT and Be/Bb growth at 84 DAT, respectively. Conversely, in relation to the interaction between the irrigation regime (IR) and the DAT, the PH value spanned from 21.35 cm for plants grown in IR200 at 21 DAT to 57.86 when grown in IR50 at 84 DAT (Table 3). As a result, the findings revealed notably higher PH values in plants cultivated under IR50 and IR100 conditions compared to those under IR200 conditions. This suggests a more efficient utilization of irrigation water by plants subjected to normal watering or half the amount.
Regarding the plant basal diameter of the rootstock (PBDR), a significant interaction of GE × DAT was observed. Within this context, PBDR values ranged from 4.43 mm for Bb/Bb at 21 DAT to 18.08 mm for Be/Bb at 84 DAT (Table 3). Concerning the plant basal diameter of the scion (PBDS), it exhibited significant fluctuations among the different GEs, ranging from 6.28 mm for Bb/Bb to 9.74 mm for Bb. Furthermore, a significant variation of the PBD value in relation to the DAT was ascertained, spanning from 5.12 mm at 21 DAT to 11.15 mm at 84 DAT (Table 3).
As concerns the plant diameter at the grafting point (PDGP), significant interactions of GE × IR and GE × DAT were observed. PDGP values ranged from 6.79 mm for Bb/Bb grown under IR200 to 17.14 mm for Be/Bb grown under IR50. On the other hand, the PDGP varied from 5.32 mm to 20.97 mm for Bb/Bb at 21 DAT and Be/Bb at 84 DAT, respectively (Table 3). Overall, PDGP values exhibited significantly higher values in plants grown in IR50 and IR100 than those cultivated by IR200. These results unequivocally indicate a better management of water by plants grown with normal watering (IR100) or half the amount (IR50).

3.2. Plant Characterization at the End of the Growing Cycle

At the end of the growing cycle, a significant interaction between genotype (GE) and irrigation regime (IR) was observed for plant height (PH). In this context, PH values ranged from 118.03 cm for Bb/Bb grown under IR100 to 180.13 cm for Be/Bb grown under IR50 (Table 4). Regarding the plant basal diameter of the rootstock (PBDR), it exhibited significant variation among the evaluated genotypes, ranging from 12.42 mm for Bb/Bb to 29.27 mm for Be/Bb (Table 4). Similarly, the plant basal diameter of the scion (PBDS) also varied significantly among the different genotypes, with values ranging from 11.93 mm for Bb/Bb to 15.92 mm for To/Bb (Table 4). Furthermore, the plant diameter at the grafting point (PDGP) displayed significant variation among the genotypes, varying from 13.62 mm for Bb/Bb to 34.03 mm for Be/Bb (Table 4). Remarkably, at the end of the growth cycle, the disparities observed among the various IRs used were bridged. Specifically, similar values were recorded for PBDR, PBDS, and PDGP when comparing IR50 and IR200 with the control, IR100. The most substantial variations of the diameters recorded were observed in relation to the different rootstock–scion combinations among all the analyzed morphological traits (Figure 1).

3.3. Leaf Chromatic Parameters

The leaf chromatic parameter related to lightness (LL*) exhibited significant variation among the different rootstock–scion combinations (GE), ranging from 36.34 for To/Bb to 38.53 for Bb (Table 5). Additionally, the chromatic parameter La* displayed significant variation among the GE, with values ranging from −11.20 for To/Bb to −13.58 for Bb. Finally, the chromatic parameter Lb* showed significant variations both among the GE and among the different irrigation regimes (IR). Regarding the GE, Lb* values ranged from 14.91 for To/Bb to 21.04 for Bb. In terms of the IR, Lb* values varied from 17.47 for IR100 to 19.48 for IR200 (Table 5).

3.4. Days for the Flowers Opening

The days for the anthesis of the first flower (Fl1) exhibited significant variation among the different rootstock–scion combinations tested (GE). Specifically, Fl1 values ranged from 50.33 DAT to 79.67 DAT for Bb and Bb/Bb, respectively (Table 6). Additionally, there were notable differences in the days for the anthesis of the second flower (Fl2) across the various genotypes (Table 6). Fl2 values spanned from 70.13 DAT to 101.61 DAT for Bb and Bb/Bb, respectively. Conversely, the days for the anthesis of the third flower (Fl3) showed significant variation influenced by both the genotype and the irrigation regime (IR). In terms of genotype, Fl3 ranged from 79.54 DAT to 104.41 DAT for Bb and Bb/Bb, respectively (Table 6). In contrast, concerning the irrigation regime (IR), Fl3 values fluctuated between 87.47 DAT and 98.26 DAT for IR50 and IR200, respectively.
Finally, regarding the days for the anthesis of the fourth flower (Fl4), a significant interaction between the GE and the IR was observed. The values for Fl4 varied from 83.92 for Bb when grown under IR50 conditions to 117.68 for Bb/Bb when grown under IR200 conditions (Table 6). Overall, there was a significant reduction in the time for anthesis for Fl4 only in plants grown under IR50 conditions, indicating that the reduced water supply represented by IR50 accelerated the flowering process. Notably, the time for anthesis exhibited significant variations based on the specific rootstock–scion combinations for all the recorded flowering traits.

3.5. Fruit Quality Parameters and Production

Regarding the fruit chromatic parameter L* (FUL*), a significant variation was observed among the GE and the IR. FUL* values exhibited significant differences among the genotypes, ranging from 26.42 for En/Bb to 27.15 for Bb (Table 7). Similarly, FUL* values varied across different IRs, ranging from 26.47 for IR50 to 27.05 for IR200 (Table 7). The fruit chromatic parameter a* (FUa*) also displayed significant variations among the GE and the IR. In the different rootstock–scion combinations, FUa* ranged from 4.08 for Be/Bb to 5.46 for Bb. Conversely, concerning the IR, FUa* spanned from 4.28 for IR200 to 5.05 for IR50 (Table 7). In contrast, no significant variation was observed in the fruit chromatic parameter b* (FUb*) among the tested genotypes and the three irrigation regimes.
Moving to the fruit longitudinal diameter (FLD), its value exhibited significant variation across the GE and the IR. FLD values differed among the genotypes, ranging from 16.12 cm for Bb to 19.93 cm for En/Bb. In terms of the irrigation regime (IR), FLD ranged from 17.14 cm for IR50 to 18.67 cm for IR100 (Table 7). As concerns the fruit transversal diameter (FTD), it showed a significant variation among the GE and the IR. In relation to the GE, there were registered values from 7.90 cm to 9.42 cm for Bb and En/Bb. Contrarily, in relation to the IR, the FTD varied from 8.51 cm to 9.11 cm, respectively. For the fruit dry matter (FDM), a significant interaction between the GE and the IR was observed. Within this context, FDM values ranged from 6.54% to 7.47% for Be/Bb and Bb/Bb, both grown under IR50 (Table 7). Regarding the fruit soluble solid content (FSSC), its value significantly varied concerning both the GE and the IR. Among the genotypes, the FSSC ranged from 4.71 °Brix to 5.42 °Brix for Be/Bb and Bb, respectively.
Moreover, the FSSC varied with respect to the IR, ranging from 4.97 °Brix when grown under IR100 to 5.35 °Brix for IR100 (Table 7).
Concerning the fruit yield components, the number of fruits per plant (FP) exhibited significant variation due to both the genotype (GE) and the irrigation regime (IR). Among the genotypes, the FP ranged from 7.01 to 10.26 fruits per plant for Bb/Bb and To/Bb, respectively. In contrast, regarding the IR, the FP varied from 7.87 to 9.53 fruits per plant for IR200 and IR50, respectively (Table 8).
For the fruit weight (FWE), a significant interaction between the genotype and the irrigation regime was determined. Consequently, FWE values ranged from 296.71 g to 450.52 g for Bb and To/Bb, both grown under IR50 (Table 8). In fact, the enhanced optimization of irrigation water was evident for this parameter, specifically among those related to fruit yield components. More precisely, FWE exhibited the highest efficiency in converting water into fruit biomass under IR50 conditions.
Finally, the fruit production per plant (FPP) displayed significant variation associated with both the different rootstock–scion combinations (GE) and the three irrigation regimes (IR). Specifically, the FPP varied from 2286.31 g to 4407.61 g for Bb/Bb and To/Bb, respectively. Concerning the irrigation regime, the FPP ranged from 2877.53 g under IR200 to 3593.53 g under IR100 (Table 8).

3.6. Water Use Efficiency for the Fruit Production

The water use efficiency (WUE) ranged in IR100 from 25.26 kg m−3 to 48.04 kg m−3 for Bb/Bb and To/Bb, respectively (Table 9). On the other hand, in IR50, the WUE spanned from kg m−3 to 49.04 kg m−3 to 101.18 kg m−3 for Bb and To/Bb, respectively. Finally, as concerns IR200, the WUE varied from 10.84 kg m−3 to 21.90 kg m−3 (Table 9).

3.7. Water Potential of the Leaves

The leaf water potential (WP) exhibited significant variation among the three irrigation regimes (IR) employed. Additionally, a significant interaction between the genotype (GE) and the temperature at the assessment moment (AT) was observed. In terms of the IR, WP values ranged from −4.49 MPa for IR100 to −5.80 MPa for IR50 (Table 10). Furthermore, as a result of the GE × AT interaction, the WP varied from −0.98 MPa for En/Bb at A3i to −14.02 MPa for Bb/Bb at A2h (Table 10).

3.8. Pearson’s Correlation among Traits

As a result of the Pearson’s correlation analysis, the most correlated traits were plant height (PH), fruit weight, and production (FWE and FPP, respectively). Specifically, for the PH, a robust positive correlation with 12 traits was detected, which were FWE, FPP, PBDS, La*, FP, PDGP, PBDR, and FLD (Table 11). On the other hand, the PH was negatively correlated with FDM, FSSC, Lb*, and WP. In addition, the fruit production per plant (FPP) showed a strong correlation with 13 traits (Table 10). Specifically, it exhibited a positive correlation with FP, FEW, FLD, PH, PBDS, PDGP, PBDR, FTD, and La*. Conversely, the FPP exhibited a negative correlation with FUL*, Lb*, FDM, and FUb*. Finally, the FWE was correlated with a total of 14 traits. Within this context, it displayed a positive correlation with FPP, PH, FLD, PDGP, FP, PBDR, La*, PBDS, and FTD. Conversely, the FWE was negatively correlated with Lb*, FUL*, FDM, WP, and FSSC (Table 11).

3.9. PCA Analysis

The first component extracted (PC1) was positively correlated with PH, PBDR, FWE, FPP, PDGP, FLD, FP, and FTD. On the other hand, it showed a negative correlation with FDM, FSSC, Lb*, and FUL* (Table 12). Moreover, the second component extracted (PC2) was positively correlated with WP and FUa*, while it was negatively correlated with FUb*. As concerns the third component (PC3), it exhibited a strong positive correlation with La* and PBDS and a negative correlation with LL* (Table 12).
The PCA plot allowed the distribution of the genotypes in the three dimensions. Within this context, four groups (A, B, C, and D) were well distinguished based on their interactions with the PCA axes, which are represented by the three extracted components PC1, PC2, and PC3. Group A encompasses the combination of Bb/Bb and Bb grown under IR50 and IR100. Particularly, these combinations differ for the higher values registered for the yield components (FP, FWE, and FPP) in comparison to the counterpart cultivated at IR200 (Figure 2). Conversely, group B included the genotypes showing the highest yield, which were all the combinations encompassing To/Bb and En/Bb. Furthermore, group C is represented by the combination Be/Bb grown in all the irrigation regimes (IR), which is well clustered due to its highest values of plant diameter at the grafting point (PDGP). Finally, group D was composed of the non-grafted and self-grafted genotypes grown by IR200 (Figure 2). This group was characterized by the worst agronomic performance recorded.
PC1 summarized the 44.452% of the total phenotypic variability. As a result, combinations To/Bb (C), En/Bb (D), and Be/Bb (E) under IR50, IR100, and IR200 were positioned along the first axis. This was due to their high values in vegetative traits such as PH and PBDR, as well as production-related traits like FWE, FPP, FLD, FP, and FTD. In contrast, the second component represented 16.396% of the total variability. Within this context, group B included the non-grafted Bb and the self-grafted Bb/Bb, both grown under IR200. Notably, this group was characterized by the lowest values of FPP. Group A was characterized by high values of WP and FUa* (Figure 2).

4. Discussion

The primary focus of this research was to determine the optimal rootstock–scion combination in response to varying irrigation levels. In line with this objective, this study aimed to identify the most effective combination capable of thriving with half the usual amount of water, enhancing water use efficiency (WUE) in agriculture, and ensuring optimal agronomic performance. Within this context, the combinations evaluated included the rootstock hybrids F1 Beaufort and Energy, which were already evaluated for their agronomic performance [38,39]. Beaufort F1 showed a robust agronomic performance but a low affinity when grafted with eggplant. On the other hand, Energy F1 showed less vigor in comparison to the interspecific rootstock but high mineral uptake.
In our study, the combination of the Black Bell cultivar grafted onto the Beaufort F1 rootstock (Be/Bb) exhibited the highest vegetative growth, as evidenced by parameters like plant height (PH), rootstock basal diameter (PBDR and PBDS), and grafting point diameter. This outcome aligns with previous studies where the Beaufort F1 rootstock has typically shown incompatibility with various eggplant cultivars, resulting in excessive vegetative development [40,41,42]. Conversely, the combination of the S. torvum rootstock with the Black Bell scion (To/Bb) displayed substantial vegetative traits, particularly a notable increase in scion basal diameter (PBDS). This can be attributed to the strong compatibility between S. torvum tissues, ensuring an efficient vascular connection capable of transferring nutrients and water without causing grafting imbalances [43,44,45].
The combination involving the self-grafted combinations consistently exhibited low values of plant height. This can be attributed to the longer tissue regeneration time of self-grafted plants compared to non-grafted ones. Specifically, self-grafted plants use a rootstock typically chosen for its production-related characteristics. Consequently, after the grafting stress, they may have greater difficulty in regenerating tissues and especially in forming a robust root system. In contrast, F1 hybrid rootstocks like Beaufort, Energy, and S. torvum have been selected precisely for their strong adaptability, facilitated by their powerful root systems. Within this context, in line with previous studies [46,47], it can be postulated that self-grafted plants require a prolonged adaptation period to achieve the same level of growth performance as their non-grafted counterparts. As a result of these hypotheses, self-grafted plants probably require more time to mitigate the issue of the grafting activity and to regenerate tissues at the grafting point. Building upon our thesis, in a previous work [48], the self-grafted combinations showed the lowest fruit yield in comparison to the self-rooted and the grafted plants.
It is noteworthy that the non-grafted Black Bell (Bb) exhibited the highest values of plant basal diameter of the scion (PBDS) at 21 and 42 days after transplanting (DAT). The larger stem diameter in non-grafted Bb can be attributed to the absence of stress caused by grafting. Conversely, Bb/Bb exhibited lower PBDS values due to self-grafting. However, after this initial period, PBDS in Bb was surpassed by other rootstock–scion combinations, as they overcame the grafting stress and exhibited greater growth. Furthermore, PBDS significantly increased in the To/Bb combination from 21 to 84 DAT, possibly due to successful grafting compatibility, promoting optimal vegetative growth. In contrast, plants grafted onto Energy and Beaufort F1 rootstocks displayed limited scion growth despite a large diameter at the grafting point (Figure 1). This could be attributed to the vigorous water uptake by the Beaufort rootstock, resulting in phenomena such as guttation and vitrescence, which we observed in Be/Bb.
Regarding the impact of different irrigation protocols on plant height, our study revealed minimal differences between plant heights under IR50 and IR100, which aligns with the findings of a previous study [49]. This minimal height difference can be attributed to the development of a robust root system capable of reaching deeper soil layers, ensuring sufficient water and nutrient absorption. In contrast, the excessive water content in the rhizosphere under IR200 may hinder root development, resulting in shorter plants. Similar trends were observed for basal diameters (PBDR and PBDS), which showed no significant variations between deficitary (IR50) and normal (IR100) irrigation, as also noted by previous research [50].
Concerning flowering time, we observed a significant reduction in non-grafted plants compared to the self-grafted ones, which exhibited a considerable delay in flowering. Additionally, we noticed a significant reduction in flowering time for the deficitary irrigation regime IR50, as compared to IR100 and IR200. This can be attributed to the reduced water in the flower tissue that led the flower to a faster fruit-setting process. The significant reduction in flowering time for IR50 could have substantial advantages in terms of early fruit production.
Regarding fruit quality traits, grafted plants produced longer fruits compared to the non-grafted ones. This is likely due to grafting enabling a more efficient transport of water and nutrients to the reproductive organs. Specifically, the combinations with the S. torvum and Energy F1 rootstocks (To/Bb and En/Bb) showed the highest values for both fruit longitudinal and transversal diameters (FLD and FTD, respectively). However, there was no significant variation in FLD and FTD between the IR50 and IR100 conditions. Reduced values were observed only for IR200, which could be attributed to oxygen deprivation in plants grown under IR200, where the water regime was doubled compared to normal conditions. Oxygen deprivation is typically induced by waterlogging stress and significantly affects physiological and developmental processes, ultimately impacting biomass production [51,52].
Regarding the soluble solid content (FSSC), non-grafted plants exhibited significantly higher values. This could be attributed to the lower water uptake capacity of the non-grafted root system compared to the rootstock’s, which might result in a dilution effect on the sugar content in fruits. Surprisingly, we did not observe an increase in FSSC under IR50, as the deficitary water regime we applied did not induce stress during the fruit-setting process.
Furthermore, the number of fruits per plant (FP) significantly varied among the different grafting combinations. Notably, the combination with S. torvum rootstock displayed the highest FP value. This higher FP value can be attributed to the strong compatibility between S. melongena grafted onto S. torvum rootstock, as supported by various studies [42,44,53]. Additionally, under IR50 conditions, we observed the highest FP value, which is likely due to the reduced vegetative growth of IR50 plants, which addressed a faster transition to the reproductive stage.
The trend in fruit weight (FWE) mirrored that of the number of fruits per plant (FP), with the combination involving S. torvum rootstock registering the highest value. Notably, the highest FWE value was observed under normal irrigation conditions (IR100), exhibiting a significant difference from both IR50 and IR200 conditions. This difference can be attributed to the enhanced water and nutrient uptake facilitated by grafting compatibility.
Regarding water use efficiency (WUE), we noticed a significant variation due to the different irrigation regimes applied. Interestingly, all combinations subjected to reduced irrigation (IR50) displayed the highest WUE values. This characteristic led to a significant reduction in water uptake from the soil, but there was minimal impact on fruit production per plant compared to the control (IR100). Among these combinations, To/Bb exhibited the highest WUE value, which is possibly attributed to the strong compatibility between the rootstock and scion, optimizing nutrient and water conversion into fresh produce. Additionally, the robust root system of the rootstock allowed for more effective exploration of soil layers, enhancing water absorption.
Conversely, our research revealed a notable decrease in WUE values for plants cultivated with double the amount of water (IR200). This can be attributed to the challenges plants face in water absorption due to reduced oxygen availability in waterlogged conditions.
Regarding the physiological analysis of water potential (WP), the highest values observed at A2h suggest that plants were transitioning to the reproductive phase, with resources being allocated to reproductive organs. Furthermore, this value was recorded when plants were under stress, as this assessment was conducted within a temperature range of 27 °C to 32 °C.
Notably, Bb/Bb exhibited the highest water potential values at A2h DAT, while the grafting combinations with the rootstocks Energy F1 and S. torvum showed lower values due to their better grafting compatibility. Conversely, lower water potential values were recorded at A3i DAT, likely reflecting the differentiation of floral buds, as confirmed by flower observations. On the other hand, the higher water potential in IR50 may be explained by the increased pressure required for water to exit the leaves. This higher pressure requirement can be attributed to the reduced water content inside the leaf tissue, which is possibly related to the plants’ efforts to support reproductive growth.
In light of these findings, it becomes imperative to conduct additional assessments that include the modulation of substrate temperature. This is necessary to overcome the limitation posed by the grafting incompatibility observed with the rootstocks F1 Energy and Beaufort. These particular rootstocks resulted in an excessive growth of the Black Bell cultivar used as the scion in the experiment.

5. Conclusions

The utilization of grafting techniques to ensure the application of the appropriate water volume for supporting plant growth and development processes has been strongly associated with the improvement of water use efficiency (WUE). In the current study, the significant affinity between S. torvum used as a rootstock and the eggplant cultivar Black Bell used as a scion was confirmed. This affinity was consistent across all irrigation regimes applied. Importantly, we observed a significant interaction between the rootstock–scion combinations and the irrigation regime, particularly in relation to water use efficiency (WUE) concerning the fruit production per plant. Notably, the highest WUE was observed under the IR50 irrigation regime, which involved replenishing 50% of evapotranspiration. Furthermore, significant differences in WUE were also observed among the various rootstock–scion combinations, with lower values for the non-grafted and self-grafted plants. It is worth highlighting that this study serves as a foundation for developing new strategies to enhance water use efficiency, especially in regions with limited water resources, where rootstocks can play a crucial role in accessing water from deeper soil layers.

Author Contributions

Conceptualization, S.A. and F.B.; methodology, S.A. and F.B.; software, S.T.; validation, S.T., F.B. and S.A.; formal analysis, S.T.; investigation, S.A.; resources, F.B.; data curation, S.T.; writing—original draft preparation, S.A. and S.T.; writing—review and editing, S.T.; visualization, S.A., D.A., G.F.R., S.T. and F.B.; supervision, F.B.; project administration, F.B.; funding acquisition, F.B. All authors have read and agreed to the published version of the manuscript.

Funding

This research received no external funding.

Data Availability Statement

The data presented in this study are available upon request from the corresponding author.

Conflicts of Interest

The authors declare no conflict of interest.

References

  1. Melnyk, C.W. Plant Grafting: Insights into Tissue Regeneration. Regeneration 2017, 4, 3–14. [Google Scholar] [CrossRef] [PubMed]
  2. Bartusch, K.; Melnyk, C.W. Insights Into Plant Surgery: An Overview of the Multiple Grafting Techniques for Arabidopsis Thaliana. Front. Plant Sci. 2020, 11, 613442. [Google Scholar] [CrossRef] [PubMed]
  3. Rasool, A.; Mansoor, S.; Bhat, K.M.; Hassan, G.I.; Baba, T.R.; Alyemeni, M.N.; Alsahli, A.A.; El-Serehy, H.A.; Paray, B.A.; Ahmad, P. Mechanisms Underlying Graft Union Formation and Rootstock Scion Interaction in Horticultural Plants. Front. Plant Sci. 2020, 11, 590847. [Google Scholar] [CrossRef] [PubMed]
  4. King, S.R.; Davis, A.R.; Zhang, X.; Crosby, K. Genetics, Breeding and Selection of Rootstocks for Solanaceae and Cucurbitaceae. Sci. Hortic. 2010, 127, 106–111. [Google Scholar] [CrossRef]
  5. Keatinge, J.D.H.; Lin, L.-J.; Ebert, A.W.; Chen, W.Y.; Hughes, J.d.’A.; Luther, G.C.; Wang, J.-F.; Ravishankar, M. Overcoming Biotic and Abiotic Stresses in the Solanaceae through Grafting: Current Status and Future Perspectives. Biol. Agric. Hortic. 2014, 30, 272–287. [Google Scholar] [CrossRef]
  6. Lee, J.-M.; Kubota, C.; Tsao, S.J.; Bie, Z.; Echevarria, P.H.; Morra, L.; Oda, M. Current Status of Vegetable Grafting: Diffusion, Grafting Techniques, Automation. Sci. Hortic. 2010, 127, 93–105. [Google Scholar] [CrossRef]
  7. Blum, A. Effective Use of Water (EUW) and Not Water-Use Efficiency (WUE) Is the Target of Crop Yield Improvement under Drought Stress. Field Crops Res. 2009, 112, 119–123. [Google Scholar] [CrossRef]
  8. Medrano, H.; Tomás, M.; Martorell, S.; Flexas, J.; Hernández, E.; Rosselló, J.; Pou, A.; Escalona, J.-M.; Bota, J. From Leaf to Whole-Plant Water Use Efficiency (WUE) in Complex Canopies: Limitations of Leaf WUE as a Selection Target. Crop J. 2015, 3, 220–228. [Google Scholar] [CrossRef]
  9. Zegada-Lizarazu, W.; Zatta, A.; Monti, A. Water Uptake Efficiency and Above- and Belowground Biomass Development of Sweet Sorghum and Maize under Different Water Regimes. Plant Soil 2012, 351, 47–60. [Google Scholar] [CrossRef]
  10. Kørup, K.; Lærke, P.E.; Baadsgaard, H.; Andersen, M.N.; Kristensen, K.; Münnich, C.; Didion, T.; Jensen, E.S.; Mårtensson, L.; Jørgensen, U. Biomass Production and Water Use Efficiency in Perennial Grasses during and after Drought Stress. GCB Bioenergy 2018, 10, 12–27. [Google Scholar] [CrossRef]
  11. Fullana-Pericàs, M.; Conesa, M.À.; Pérez-Alfocea, F.; Galmés, J. The Influence of Grafting on Crops’ Photosynthetic Performance. Plant Sci. 2020, 295, 110250. [Google Scholar] [CrossRef] [PubMed]
  12. Flexas, J.; Niinemets, Ü.; Gallé, A.; Barbour, M.M.; Centritto, M.; Diaz-Espejo, A.; Douthe, C.; Galmés, J.; Ribas-Carbo, M.; Rodriguez, P.L.; et al. Diffusional Conductances to CO2 as a Target for Increasing Photosynthesis and Photosynthetic Water-Use Efficiency. Photosynth. Res. 2013, 117, 45–59. [Google Scholar] [CrossRef] [PubMed]
  13. Liu, E.K.; Mei, X.R.; Yan, C.R.; Gong, D.Z.; Zhang, Y.Q. Effects of Water Stress on Photosynthetic Characteristics, Dry Matter Translocation and WUE in Two Winter Wheat Genotypes. Agric. Water Manag. 2016, 167, 75–85. [Google Scholar] [CrossRef]
  14. Yu, L.; Gao, X.; Zhao, X. Global Synthesis of the Impact of Droughts on Crops’ Water-Use Efficiency (WUE): Towards both High WUE and Productivity. Agric. Syst. 2020, 177, 102723. [Google Scholar] [CrossRef]
  15. Yang, S.; Zhang, J.; Han, J.; Wang, J.; Zhang, S.; Bai, Y.; Cao, D.; Xun, L.; Zheng, M.; Chen, H.; et al. Evaluating Global Ecosystem Water Use Efficiency Response to Drought Based on Multi-Model Analysis. Sci. Total Environ. 2021, 778, 146356. [Google Scholar] [CrossRef]
  16. Ben Ammar, H.; Arena, D.; Treccarichi, S.; Di Bella, M.C.; Marghali, S.; Ficcadenti, N.; Lo Scalzo, R.; Branca, F. The Effect of Water Stress on the Glucosinolate Content and Profile: A Comparative Study on Roots and Leaves of Brassica Oleracea L. Crops. Agronomy 2023, 13, 579. [Google Scholar] [CrossRef]
  17. Jogawat, A.; Yadav, B.; Chhaya; Lakra, N.; Singh, A.K.; Narayan, O.P. Crosstalk between Phytohormones and Secondary Metabolites in the Drought Stress Tolerance of Crop Plants: A Review. Physiol. Plant 2021, 172, 1106–1132. [Google Scholar] [CrossRef]
  18. Yadav, B.; Jogawat, A.; Rahman, M.S.; Narayan, O.P. Secondary Metabolites in the Drought Stress Tolerance of Crop Plants: A Review. Gene Rep. 2021, 23, 101040. [Google Scholar] [CrossRef]
  19. Branca, F.; Argento, S. Evaluation of Saffron Pluriannual Growing Cycle in Central Sicily. Acta Hortic. 2010, 850, 153–158. [Google Scholar] [CrossRef]
  20. Schwarz, D.; Rouphael, Y.; Colla, G.; Venema, J.H. Grafting as a Tool to Improve Tolerance of Vegetables to Abiotic Stresses: Thermal Stress, Water Stress and Organic Pollutants. Sci. Hortic. 2010, 127, 162–171. [Google Scholar] [CrossRef]
  21. Kumar, P.; Rouphael, Y.; Cardarelli, M.; Colla, G. Vegetable Grafting as a Tool to Improve Drought Resistance and Water Use Efficiency. Front. Plant Sci. 2017, 8, 01130. [Google Scholar] [CrossRef] [PubMed]
  22. Treccarichi, S.; Cali, R.; Amari, M.; Mortada, A.; Felis, M.D.; Achkar, N.; Branca, F. New Tools for Organic Plant Nutrition: Microbial and Aminoacid Treatments for Organic Seed Production of Broccoli (Brassica Oleracea Var. Italica Plenk). Acta Hortic. 2023, 1365, 81–90. [Google Scholar] [CrossRef]
  23. Argento, S.; Melilli, M.G.; Branca, F. Enhancing Greenhouse Tomato-Crop Productivity by Using Brassica Macrocarpa Guss. Leaves for Controlling Root-Knot Nematodes. Agronomy 2019, 9, 820. [Google Scholar] [CrossRef]
  24. Le Campion, A.; Oury, F.-X.; Heumez, E.; Rolland, B. Conventional versus Organic Farming Systems: Dissecting Comparisons to Improve Cereal Organic Breeding Strategies. Org. Agric. 2020, 10, 63–74. [Google Scholar] [CrossRef]
  25. Purnhagen, K.P.; Clemens, S.; Eriksson, D.; Fresco, L.O.; Tosun, J.; Qaim, M.; Visser, R.G.F.; Weber, A.P.M.; Wesseler, J.H.H.; Zilberman, D. Europe’s Farm to Fork Strategy and Its Commitment to Biotechnology and Organic Farming: Conflicting or Complementary Goals? Trends Plant Sci. 2021, 26, 600–606. [Google Scholar] [CrossRef]
  26. Cantero-Navarro, E.; Romero-Aranda, R.; Fernández-Muñoz, R.; Martínez-Andújar, C.; Pérez-Alfocea, F.; Albacete, A. Improving Agronomic Water Use Efficiency in Tomato by Rootstock-Mediated Hormonal Regulation of Leaf Biomass. Plant Sci. 2016, 251, 90–100. [Google Scholar] [CrossRef]
  27. Aloni, B.; Karni, L.; Deventurero, G.; Levin, Z.; Cohen, R.; Katzir, N.; Lotan-Pompan, M.; Edelstein, M.; Aktas, H.; Turhan, E.; et al. Physiological and Biochemical Changes at the Rootstock-Scion Interface in Graft Combinations between Cucurbita Rootstocks and a Melon Scion. J. Hortic. Sci. Biotechnol. 2008, 83, 777–783. [Google Scholar] [CrossRef]
  28. Martínez-Ballesta, M.C.; Alcaraz-López, C.; Muries, B.; Mota-Cadenas, C.; Carvajal, M. Physiological Aspects of Rootstock–Scion Interactions. Sci. Hortic. 2010, 127, 112–118. [Google Scholar] [CrossRef]
  29. Savvas, D.; Öztekin, G.B.; Tepecik, M.; Ropokis, A.; Tüzel, Y.; Ntatsi, G.; Schwarz, D. Impact of Grafting and Rootstock on Nutrient-to-Water Uptake Ratios during the First Month after Planting of Hydroponically Grown Tomato. J. Hortic. Sci. Biotechnol. 2017, 92, 294–302. [Google Scholar] [CrossRef]
  30. Gregory, P.J.; Atkinson, C.J.; Bengough, A.G.; Else, M.A.; Fernández-Fernández, F.; Harrison, R.J.; Schmidt, S. Contributions of Roots and Rootstocks to Sustainable, Intensified Crop Production. J. Exp. Bot. 2013, 64, 1209–1222. [Google Scholar] [CrossRef]
  31. Tribulato, A.; Noto, G.; Argento, S. Soilless Culture on Quality Production in Lily. Acta Hortic. 2003, 614, 749–754. [Google Scholar] [CrossRef]
  32. Asins, M.J.; Albacete, A.; Martínez-Andújar, C.; Celiktopuz, E.; Solmaz, İ.; Sarı, N.; Pérez-Alfocea, F.; Dodd, I.C.; Carbonell, E.A.; Topcu, S. Genetic Analysis of Root-to-Shoot Signaling and Rootstock-Mediated Tolerance to Water Deficit in Tomato. Genes 2020, 12, 10. [Google Scholar] [CrossRef] [PubMed]
  33. Ertek, A.; Şensoy, S.; Küçükyumuk, C.; Gedik, İ. Determination of Plant-Pan Coefficients for Field-Grown Eggplant (Solanum melongena L.) Using Class A Pan Evaporation Values. Agric. Water Manag. 2006, 85, 58–66. [Google Scholar] [CrossRef]
  34. Ji, T.; Guo, X.; Wu, F.; Wei, M.; Li, J.; Ji, P.; Wang, N.; Yang, F. Proper Irrigation Amount for Eggplant Cultivation in a Solar Greenhouse Improved Plant Growth, Fruit Quality and Yield by Influencing the Soil Microbial Community and Rhizosphere Environment. Front. Microbiol. 2022, 13, 981288. [Google Scholar] [CrossRef]
  35. Allen, R.G.; Pereira, L.S.; Smith, M.; Raes, D.; Wright, J.L. FAO-56 Dual Crop Coefficient Method for Estimating Evaporation from Soil and Application Extensions. J. Irrig. Drain. Eng. 2005, 131, 2–13. [Google Scholar] [CrossRef]
  36. Valiantzas, J.D. Simplified Forms for the Standardized FAO-56 Penman–Monteith Reference Evapotranspiration Using Limited Weather Data. J. Hydrol. 2013, 505, 13–23. [Google Scholar] [CrossRef]
  37. Mahjoor, F.; Ghaemi, A.A.; Golabi, M.H. Interaction Effects of Water Salinity and Hydroponic Growth Medium on Eggplant Yield, Water-Use Efficiency, and Evapotranspiration. Int. Soil Water Conserv. Res. 2016, 4, 99–107. [Google Scholar] [CrossRef]
  38. Romano, D.; Paratore, A. Effects of Grafting on Tomato and Eggplant. Acta Hortic. 2001, 559, 149–154. [Google Scholar] [CrossRef]
  39. Leonardi, C.; Giuffrida, F.; Leonardi, C.; Giuffrida, F. Variation of Plant Growth and Macronutrient Uptake in Grafted Tomatoes and Eggplants on Three Different Rootstocks Variation of Plant Growth and Macronutrient Uptake in Grafted To-Matoes and Eggplants on Three Different Rootstocks. Eur. J. Hortic. Sci. 2006, 71, 97. [Google Scholar]
  40. Goto, R.; de Miguel, A.; Marsal, J.I.; Gorbe, E.; Calatayud, A. Effect of Different Rootstocks on Growth, Chlorophyll A Fluorescence and Mineral Composition of Two Grafted Scions of Tomato. J. Plant Nutr. 2013, 36, 825–835. [Google Scholar] [CrossRef]
  41. Musa, I.; Rafii, M.Y.; Ahmad, K.; Ramlee, S.I.; Md Hatta, M.A.; Oladosu, Y.; Muhammad, I.; Chukwu, S.C.; Mat Sulaiman, N.N.; Ayanda, A.F.; et al. Effects of Grafting on Morphophysiological and Yield Characteristic of Eggplant (Solanum melongena L.) Grafted onto Wild Relative Rootstocks. Plants 2020, 9, 1583. [Google Scholar] [CrossRef] [PubMed]
  42. Argento, S.; Treccarichi, S.; Melilli, M.G.; Branca, F. Grafting Compatibility and Environmental Conditions on Soilless Eggplant (Solanum Melongena) Grown in the Mediterranean Greenhouse. Horticulturae 2023, 9, 1060. [Google Scholar] [CrossRef]
  43. Gisbert, C.; Prohens, J.; Raigón, M.D.; Stommel, J.R.; Nuez, F. Eggplant Relatives as Sources of Variation for Developing New Rootstocks: Effects of Grafting on Eggplant Yield and Fruit Apparent Quality and Composition. Sci. Hortic. 2011, 128, 14–22. [Google Scholar] [CrossRef]
  44. Moncada, A.; Miceli, A.; Vetrano, F.; Mineo, V.; Planeta, D.; D’Anna, F. Effect of Grafting on Yield and Quality of Eggplant (Solanum melongena L.). Sci. Hortic. 2013, 149, 108–114. [Google Scholar] [CrossRef]
  45. Petran, A.; Hoover, E. Solanum Torvum as a Compatible Rootstock in Interspecific Tomato Grafting. J. Hortic. 2013, 103, 2376-0354. [Google Scholar] [CrossRef]
  46. Borgognone, D.; Colla, G.; Rouphael, Y.; Cardarelli, M.; Rea, E.; Schwarz, D. Effect of Nitrogen Form and Nutrient Solution PH on Growth and Mineral Composition of Self-Grafted and Grafted Tomatoes. Sci. Hortic. 2013, 149, 61–69. [Google Scholar] [CrossRef]
  47. Sánchez-Rodríguez, E.; Leyva, R.; Constán-Aguilar, C.; Romero, L.; Ruiz, J.M. How Does Grafting Affect the Ionome of Cherry Tomato Plants under Water Stress? Soil Sci. Plant Nutr. 2014, 60, 145–155. [Google Scholar] [CrossRef]
  48. Khah, E.M.; Kakava, E.; Mavromatis, A.; Chachalis, D.; Goulas, C. Effect of Grafting on Growth and Yield of Tomato (Lycopersicon esculentum Mill.) in Greenhouse and Open-Tield. J. Appl. Hortic. 2006, 8, 3–7. [Google Scholar] [CrossRef]
  49. Díaz-Pérez, J.C.; Eaton, T.E. Eggplant (Solanum melongena L.) Plant Growth and Fruit Yield as Affected by Drip Irrigation Rate. HortScience 2015, 50, 1709–1714. [Google Scholar] [CrossRef]
  50. Semida, W.M.; Abdelkhalik, A.; Mohamed, G.F.; Abd El-Mageed, T.A.; Abd El-Mageed, S.A.; Rady, M.M.; Ali, E.F. Foliar Application of Zinc Oxide Nanoparticles Promotes Drought Stress Tolerance in Eggplant (Solanum melongena L.). Plants 2021, 10, 421. [Google Scholar] [CrossRef]
  51. Bahadur, A.; Rai, N.; Kumar, R.; Tiwari, S.K.; Singh, A.K.; Rai, A.; Singh, U.; Patel, P.K.; Tiwari, V.; Rai, A.B.; et al. Grafting Tomato on Eggplant as a Potential Tool to Improve Waterlogging Tolerance in Hybrid Tomato. Veg. Sci. 2015, 42, 82–87. [Google Scholar] [CrossRef]
  52. Sarker, K.K.; Quamruzzaman, A.K.M.; Uddin, M.N.; Rahman, A.; Quddus, A.; Biswas, S.K.; Gaber, A.; Hossain, A. Evaluation of 10 Eggplant (Solanum melongena L.) Genotypes for Development of Cultivars Suitable for Short-Term Waterlogged Conditions. Gesunde Pflanzen 2023, 75, 179–192. [Google Scholar] [CrossRef]
  53. Çürük, S.; Dasgan, H.Y.; Mansuroğlu, S.; Kurt, Ş.; Mazmanoğlu, M.; Antaklı, Ö.; Tarla, G. Grafted Eggplant Yield, Quality and Growth in Infested Soil with Verticillium Dahliae and Meloidogyne Incognita. Pesqui Agropecu Bras. 2009, 44, 1673–1681. [Google Scholar] [CrossRef]
Figure 1. Variation of the plant basal diameter of the rootstock and the scion and at the grafting point in relation to the different eggplant rootstock–scion combinations employed. (a) Black Bell grafted onto S. torvum (To/Bb); (b) Black Bell grafted onto Energy F1 rootstock (En/Bb); (c) Black Bell grafted onto Beaufort F1 rootstock (Be/Bb); (d) Black Bell self-grafted (Bb/Bb); (e) Black Bell non-grafted (Bb). Of note is the grafting imbalance observed for the combinations En/Bb and Be/Bb.
Agronomy 13 02705 g001
Figure 2. PCA plot showing the genotypes distribution based on the three axes, which are represented by PC1, PC2, and PC3. The different rootstock–scion combinations, along with their respective irrigation regimes, were grouped into four categories (A, B, C, and D). Group A consisted of the self-grafted and non-grafted eggplant cultivar Black Bell, grown under both ordinary and halved irrigation regimes (IR100 and IR50, respectively). Group B included the most promising combinations in terms of yield, cultivated under all irrigation regimes (To/Bb and En/Bb). Group C comprised the Beaufort F1 rootstock grown under all irrigation regimes, characterized by grafting incompatibility with the scion Black Bell. Finally, Group D encompassed the least favorable combinations in terms of agronomic performance, consisting of non-grafted and self-grafted Black Bell plants grown with double the usual water volume (IR200).
Agronomy 13 02705 g002
Table 1. List of descriptors used with their respective codes and units of measure.
CodeTrait
PHPlant height (cm)
PBDRPlant basal diameter of the rootstock (mm)
PBDSPlant basal diameter of the scion (mm)
PDGPPlant diameter at the grafting point (mm)
LL*Leaf CIE chromatic parameter L*
La*Leaf CIE chromatic parameter a*
Lb*Leaf CIE chromatic parameter b*
Fl1, 2, 3, 4Days of anthesis from transplant (days)
FUL*Fruit chromatic parameter L*
FUa*Fruit chromatic parameter a*
FUb*Fruit chromatic parameter b*
FLDFruit longitudinal diameter (cm)
FTDFruit transversal diameter (cm)
FDMFruit dry matter (%)
FSSCFruit soluble solid content (°Brix)
FPFruits per plant (n)
fewFruit weight (g)
FPPFruits production per plant (g)
WPLeaf water potential (-MPa)
Table 2. Variation of the irrigation volume (L plant−1) in relation to the different phenological stages (according to the BBCH scale for Solanaceae) and to the different irrigation regimes applied (IR50, IR100, and IR200).
DATPhenological StageIR100IR50IR200
17–73from fourth leaves on main shoot to the fourth flower open8.104.0516.35
74–112from the fourth flower open to the 10% of the fruit ripened4.332.168.74
113–166from the 10% of the fruit ripened to the 80% of fruit ripened24.4212.2148.84
167–229from 80% of the fruit ripened to the harvested product55.9427.97111.89
TOTAL 92.8046.40185.81
Table 3. Variation of the plant growth parameter in relation to the different rootstock–scion combinations, to the different irrigation regimes (IR100, IR50, and IR200), and to the days after transplant (DAT), which were 21, 42, and 84. The analyzed traits were plant height (PH), the basal diameter of the rootstock (PBDR), the basal diameter of the scion (PBDS), and the diameter at the grafting point (PDGP).
PH PBDR PBDS PDGP
DATTo/BbEn/BbBe/BbBb/BbBb x ¯ To/BbEn/BbBe/BbBb/BbBb x ¯ To/BbEn/BbBe/BbBb/BbBb x ¯ To/BbEn/BbBe/BbBb/BbBb x ¯
IR1002121.7125.2721.9721.7124.6023.055.426.267.604.400.004.745.384.585.294.226.595.216.269.4510.135.580.006.28
4234.4341.5542.1928.3831.8135.677.659.1511.656.200.006.937.796.627.865.9210.447.739.1613.9914.507.580.009.05
8458.2563.4461.6544.7452.7856.1712.8215.9517.699.120.0011.1212.6910.1412.068.9214.2811.6213.5221.3221.7111.000.0013.51
x ¯ 38.1343.4241.9431.6136.4038.30 a8.6310.4512.316.570.007.60 a8.627.118.406.3510.448.19 a9.6514.9215.458.050.009.61 b
IR502121.4825.1922.3321.6922.4822.635.916.637.824.810.005.046.024.435.424.556.905.467.209.9110.485.600.006.64
4235.0142.6342.7428.9339.6137.797.809.4011.876.390.007.098.216.957.836.2611.598.179.0314.6315.767.960.009.48
8456.7662.5364.4149.2556.3557.8612.6115.8219.9410.180.0011.7112.9910.5213.5210.2913.0812.0814.2522.0725.1811.130.0014.53
x ¯ 37.7543.4543.1633.2939.4839.43 a8.7710.6213.217.130.007.95 a9.077.308.927.0310.528.57 a10.1615.5417.148.230.0010.22 a
IR2002120.4523.6521.6119.7121.3421.354.655.707.144.070.004.314.854.265.083.765.534.695.708.579.564.780.005.72
4230.0634.4538.9125.5429.7531.747.168.0211.035.610.006.367.055.897.455.378.906.938.6012.3214.036.890.008.37
8447.1950.4755.6637.2843.5146.8211.9716.4416.597.130.0010.4211.229.1410.927.2010.329.7612.6419.5322.258.690.0012.62
x ¯ 32.5736.1938.7327.5131.5333.30 b7.9310.0511.595.600.007.03 a7.716.437.825.448.257.13 a8.9813.4715.286.790.008.90 c
Means per genotype
PH PBDR PBDS PDGP
DATTo/BbEn/BbBe/BbBb/BbBb x ¯ To/BbEn/BbBe/BbBb/BbBb x ¯ To/BbEn/BbBe/BbBb/BbBb x ¯ To/BbEn/BbBe/BbBb/BbBb x ¯
2121.2124.7121.9721.0422.8122.35 c5.336.207.524.430.004.70 c5.414.425.264.186.345.12 c6.399.3110.055.320.006.08 c
4233.1739.5441.2827.6233.7235.07 b7.548.8611.526.070.006.80 b7.686.497.715.8510.317.61 b8.9313.6514.767.470.008.85 b
8454.0758.8160.5843.7650.8853.62 a12.4716.0718.088.810.0011.09 a12.309.9312.178.8012.5611.15 a13.4720.9723.0510.270.0013.38 a
x ¯ 36.15 b41.02 a41.28 a30.81 c35.80 b37.018.45 bc10.38 ab12.37 a6.44 c0.00 d7.538.46 a6.95 a8.38 a6.28 a9.74 a7.969.60 c14.64 b15.95 a7.69 d0.00 e8.90
Significancy of the differences by ANOVA Newman-Keuls method
PHPBDRPBDSPDGP
GE**********
IR***n.s.n.s.***
DAT**********
GE × IRn.s.n.s.n.s.*
GE × DAT******n.s.***
IR × DAT**n.s.n.s.n.s.
GE × IR × DATn.s.n.s.n.s.n.s.
***, **, and * indicate p-values ≤ 0.001, 0.01, and 0.05, respectively. Letters indicate significant differences according to the Tukey test (p < 0.05). n.s. represents not significant.
Table 4. Variation of the plant morphometric traits, analyzed at the end of the trial, in relation to the different rootstock–scion combinations and to the irrigation regimes (IR100, IR50, and IR200).
IR100 IR50 IR200
To/BbEn/BbBe/BbBb/BbBb x ¯ To/BbEn/BbBe/BbBb/BbBb x ¯ To/BbEn/BbBe/BbBb/BbBb x ¯
PH171.90136.87178.89118.03120.58145.25 a157.38143.13180.13120.79132.50146.78 a162.46144.61143.05136.88139.00145.20 a
PBDR16.6626.4430.2712.4612.9019.75 a16.2226.8529.6212.4313.0219.63 a15.4027.3727.9112.3713.1319.24 a
PBDS16.9011.2115.0213.0312.9013.81 a15.8411.9115.3811.9913.0213.63 a15.0412.6815.3111.7913.1313.59 a
PDGP18.2931.2233.8513.720.0019.42 a18.3030.8434.4413.720.0019.46 a18.2330.8033.7913.420.0019.25 a
Means per genotype
To/BbEn/BbBe/BbBb/BbBb x ¯
PH163.91 a141.53 b167.35 a125.23 c130.69 c145.74
PBDR16.09 b26.89 a29.27 a12.42 c13.02 c19.54
PBDS15.92 a11.93 b15.23 a12.27 b13.02 b13.68
PDGP18.27 b30.95 a34.03 a13.62 c0.00 d19.37
Significancy of the differences by ANOVA Newman-Keuls method
PHPBDRPBDSPDGP
GE************
IRn.s.n.s.n.s.n.s.
GE × IR***n.s.n.s.n.s.
*** indicate p-values ≤ 0.001. Letters indicate significant differences according to the Tukey test (p < 0.05). n.s. represents not significant.
Table 5. Variation of the leaf chromatic CIE parameters in relation to the different irrigation regimes (IR100, IR50, and IR200).
IR100 IR50 IR200
To/BbEn/BbBe/BbBb/BbBb x ¯ To/BbEn/BbBe/BbBb/BbBb x ¯ To/BbEn/BbBe/BbBb/BbBb x ¯
LL*37.9438.5737.6738.2639.8838.46 a35.2337.2439.7137.0937.9137.44 a35.8439.2236.2337.1637.7937.25 a
La*−11.23−13.45−11.16−12.67−12.86−12.27 a−10.53−13.55−11.44−12.72−13.81−12.41 a−11.82−12.72−13.18−11.86−13.48−12.61 a
Lb*15.3619.3714.9418.0519.6217.47 ab14.0919.3816.4319.3120.7517.99 ab15.2722.7718.4618.1722.7419.48 a
Means per genotype
To/BbEn/BbBe/BbBb/BbBbMean
LL*36.34 b38.34 a37.87 a37.50 a38.53 a37.72
La*−11.20 b−13.24 a−11.93 ab−12.42 ab−13.38 a−12.43
Lb*14.91 c20.51 a16.61 bc18.51 b21.04 a18.31
Significancy of the differences by ANOVA Newman−Keuls method
LL*La*Lb*
GE******
IRn.s.n.s.*
GE × IRn.s.n.s.n.s.
***, **, and * indicate p-values ≤ 0.001, 0.01, and 0.05, respectively. Letters indicate significant differences according to the Tukey test (p < 0.05). n.s. represents not significant.
Table 6. Variation of days of anthesis expressed in days after transplant (DAT) in relation to the first, second, third, and fourth flowers open (Fl1, Fl2, Fl3, and Fl4, respectively).
IR100 IR50 IR200
To/BbEn/BbBe/BbBb/BbBb x ¯ To/BbEn/BbBe/BbBb/BbBb x ¯ To/BbEn/BbBe/BbBb/BbBb x ¯
Fl165.1762.1351.0574.7853.0061.23 a58.5866.5050.7178.0445.6359.89 a56.1770.1352.9486.1852.3863.56 a
Fl288.2592.7584.6798.3173.3387.46 a84.5495.5877.92100.1762.5084.14 a82.5499.4285.52106.3674.5489.68 a
Fl399.0898.0496.20103.7381.6395.74 a94.7993.1778.00102.4670.2987.74 b98.46102.8896.23107.0386.7298.26 a
Fl4111.71114.96109.45117.3792.33109.16 a115.46115.4699.42110.1783.92104.88 a101.82112.29105.76117.68100.10107.53 a
Means per genotype
To/BbEn/BbBe/BbBb/BbBb x ¯
Fl159.97 bc66.25 b51.57 c79.67 a50.33 c61.56
Fl285.11 bc95.92 ab82.70 c101.61 a70.13 d87.09
Fl397.44 ab98.03 ab90.14 b104.41 a79.54 c93.91
Fl4109.66 ab114.24 a104.88 b115.07 a92.12 c107.19
Significancy of the differences by ANOVA Newman-Keuls method
Fl1Fl2Fl3Fl4
GE************
IRn.s.n.s.***n.s.
GE × IRn.s.n.s.n.s.*
*** and * indicate the p-values ≤ 0.001 and 0.05, respectively. Letters indicate significant differences according to the Tukey test (p < 0.05). n.s. represents not significant.
Table 7. Variation of the fruit quality traits in relation to the different rootstock–scion combinations and to the irrigation regimes (IR50, IR100, and IR200). The analyzed traits were the chromatic CIEL*a*b* parameters (FUL*, FUa*, and FUb*, respectively), the fruit lateral and transversal diameter (FLD and FTD), the fruit dry matter (FDM), and the soluble solid content (FSSC).
IR100 IR50 IR200
To/BbEn/BbBe/BbBb/BbBb x ¯ To/BbEn/BbBe/BbBb/BbBb x ¯ To/BbEn/BbBe/BbBb/BbBb x ¯
FUL*26.2926.3826.4826.6127.3526.62 b26.3526.4526.2826.4826.8226.47 b26.9326.4326.6927.9327.2927.05 a
FUa*5.704.344.344.965.925.05 a4.544.054.054.785.094.50 ab4.084.453.853.645.374.28 b
FUb*−0.50−0.46−0.33−0.45−0.38−0.43 a−0.48−0.49−0.41−0.50−0.46−0.47 a−0.45 a−0.50−0.39−0.24−0.30−0.38 a
FLD19.5220.3418.6216.9817.0918.51 a20.1320.1818.9317.6816.4618.67 a19.4019.2716.0316.1814.8217.14 b
FTD9.189.459.299.298.119.06 a8.989.518.949.828.299.11 a9.389.298.298.287.318.51 b
FDM6.726.736.547.476.946.88 a6.876.776.597.336.956.90 a6.856.756.886.806.856.82 a
FSSC5.265.194.755.725.835.35 a4.985.034.614.895.354.97 b4.684.894.765.055.094.89 b
Means per genotype
TraitTo/BbEn/BbBe/BbBb/BbBb x ¯
FUL*26.52 b26.42 b26.48 b27.00 ab27.15 a26.72
FUa*4.77 ab4.28 b4.08 b4.46 b5.46 a4.61
FUb*−0.47 a−0.48 a−0.38 a−0.40 a−0.38 a−0.42
FLD19.68 a19.93 a17.86 b16.94 bc16.12 c18.11
FTD9.18 a9.42 a8.84 a9.13 a7.90 b8.89
FDM6.81 b6.75 b6.67 b7.20 a6.91 ab6.87
FSSC4.97 bc5.04 abc4.71 c5.22 ab5.42 a5.07
Significancy of the differences by ANOVA Newman−Keuls method
FUL*FUa*FUb*FLDFTDFDMFSSC
GE*****n.s.************
IR****n.s.****n.s.***
GE × IRn.s.n.s.n.s.n.s.n.s.*n.s.
***, **, and * indicate p-values ≤ 0.001, 0.01, and 0.05, respectively. Letters indicate significant differences according to the Tukey test (p < 0.05). n.s. represents not significant.
Table 8. Variation of the yield components in relation to the different rootstock–scion combinations and to the different irrigation regimes (IR50, IR100, and IR200). The analyzed parameters were the number of fruits per plant (FP), the fruit weight (FWE), and the fruit production per plant (FPP), both expressed in g plant−1.
IR100 IR50 IR200
To/BbEn/BbBe/BbBb/BbBb x ¯ To/BbEn/BbBe/BbBb/BbBb x ¯ To/BbEn/BbBe/BbBb/BbBb x ¯
FP10.7010.669.387.479.469.5310.469.419.047.407.718.809.637.688.086.177.797.87
FWE417.25384.30432.21313.01320.65373.48450.52426.10439.71338.11296.71390.23422.00384.14365.19323.30304.16359.76
FPP4458.494098.064029.392344.223037.473593.53 a4694.874027.113961.862500.622275.453491.98 a4069.482962.442950.522014.092391.102877.53 b
Means per genotype
To/BbEn/BbBe/BbBb/BbBb x ¯
FP10.26 a9.25 ab8.83 ab7.01 c8.32 bc8.73
FWE429.92 a398.18 b412.37 ab324.81 c307.17 c374.49
FPP4407.61 a3695.87 b3647.26 b2286.31 c2568.01 c3321.01
Significancy of the differences by ANOVA Newman-Keuls method
FPFWEFPP
GE*********
IR*******
GE × IRn.s.**n.s.
*** and ** indicate p-values ≤ 0.001 and 0.01. Letters indicate significant differences according to the Tukey test (p < 0.05). n.s. represents not significant.
Table 9. Water use efficiency (WUE), expressed in kg m−3, calculated for fruit production (FPP). It was calculated through the ratio between the fruit production per plant (kg) and the liter of irrigation water (IW), expressed in m3.
To/BbEn/BbBe/BbBb/BbBb x ¯
IR10048.0444.1643.4225.2632.7338.72 b
IR50101.1886.7985.3853.8949.0475.26 a
IR20021.9015.9415.8810.8412.8715.49 c
Means per genotype
To/BbEn/BbBe/BbBb/BbBb x ¯
WUE57.04 a48.96 b48.23 b30.00 c31.55 c43.15
Significancy of the differences by ANOVA Newman-Keuls method
WUE
GE***
IR***
GE × IR***
*** indicates p-value ≤ 0.001. Letters indicate significant differences according to the Tukey test (p < 0.05).
Table 10. Variation of the water potential (WP) expressed in -MPa in relation to the different rootstock–scion combinations, to the different irrigation regimes (IR100, IR50, and IR200), and to the temperature during the assessment (AT). The WP was registered at cold, hot, and intermediate temperatures (A1c, A2c, and A3i, respectively).
ATTo/BbEn/BbBe/BbBb/BbBb x ¯
IR100A1c3.90 ± (0.55)2.19 ± (0.46)2.24 ± (0.84)3.95 ± (0.90)4.09 ± (0.33)3.27 ± (0.97)
A2h10.20 ± (2.75)7.38 ± (2.56)4.80 ± (2.17)14.58 ± (3.35)15.03 ± (2.49)10.40 ± (4.45)
A3i2.68 ± (0.92)1.60 ± (0.82)1.05 ± (0.26)2.10 ± (0.18)3.50 ± (2.42)2.19 ± (0.95)
x ¯ 5.59 ± (4.04) c3.72 ± (3.18) d2.70 ± (1.92) e6.88 ± (6.74) b7.63 ± (6.65) a5.29 ± (4.46) b
IR50A1c4.59 ± (1.00)2.65 ± (1.12)2.86 ± (1.07)4.53 ± (1.18)5.10 ± (0.67)3.95 ± (1.11)
A2h8.73 ± (4.25)13.68 ± (2.00)7.30 ± (4.44)13.43 ± (6.92)12.13 ± (6.54)11.05 ± (2.88)
A3i5.5 ± (1.36)4.5 ± (2.45)1.25 ± (0.21)4.68 ± (1.96)5.53 ± (4.05)4.29 ± (1.76)
x ¯ 6.27 ± (2.18) b6.94 ± (5.91) ab3.80 ± (3.13) c7.55 ± (5.10) a7.59 ± (3.94) a6.43 ± (4.00) a
IR200A1c3.76 ± (0.54)1.75 ± (0.35)1.64 ± (0.35)4.10 ± (0.58)4.00 ± (0.48)3.05 ± (1.24)
A2h11.93 ± (1.15)11.00 ± (2.28)7.43 ± (4.25)14.08 ± (1.25)10.95 ± (3.43)11.08 ± (2.40)
A3i3.23 ± (1.07)1.95 ± (1.23)0.63 ± (0.22)2.8 ± (1.12)2.78 ± (1.11)2.28 ± (1.03)
x ¯ 6.30 ± (4.78) b4.9 ± (5.28) d3.23 ± (3.67) e7.23 ± (6.59) a5.91 ± (4.41) c5.47 ± (4.87) b
Means per genotype
To/BbEn/BbBe/BbBb/BbBb x ¯
A1c4.08 ± (0.44)2.25 ± (0.45)2.20 ± (0.62)4.19 ± (0.30)4.40 ± (0.61)3.53 ± (1.02) b
A2h10.28 ± (1.60)6.51 ± (3.16)10.68 ± (1.48)14.02 ± (0.58)12.70 ± (2.10)10.75 ± (2.57) a
A3i3.8 ± (1.50)0.98 ± (1.58)2.68 ± (0.32)3.19 ± (1.33)3.93 ± (1.43)3.06 ± (1.13) b
x ¯ 6.05 ± (3.66) a3.24 ± (2.90) c5.18 ± (4.76) b7.13 ± (5.98) a7.01 ± (4.93) a5.78 ± (4.31)
Significancy of the differences by ANOVA Newman Keuls method
GEIRATGE × IRGE × ATIR × ATGE × IR × AT
WP*******n.s.***n.s.n.s.
Numbers in brackets represent the standard deviation. *** and * indicates p-value ≤ 0.001 and 0.05, respectively. Letters indicate significant differences according to the Tukey test (p < 0.05). n.s. represents not significant.
Table 11. Pearson’s correlation among the evaluated traits.
PHPBDRPBDSPDGPLL*La*Lb*FUL*FUa*FUb*FLDFTDFDMFSSCFPFWEFPPWP
PH1.000
PBDR0.542 *1.000
PBDS0.739 **0.1571.000
PDGP0.544 *0.906 **0.2031.000
LL*−0.1140.183−0.281−0.0381.000
La*0.684 **0.0550.687 **0.248−0.2561.000
Lb*−0.630 **−0.093−0.693 **−0.3120.434−0.835 **1.000
FUL*−0.397−0.548 *−0.352−0.599 **−0.017−0.1910.2851.000
FUa*−0.274−0.515 *0.088−0.674 **0.382−0.1270.2110.0271.000
FUb*0.023−0.099−0.100−0.2020.0390.0530.0590.767 **−0.1721.000
FLD0.469 *0.457 *0.1820.585 *−0.0550.392−0.456 *−0.679 **−0.208−0.636 **1.000
FTD0.1830.314−0.0150.562 *−0.0990.260−0.380−0.677 **−0.278−0.670 **0.771 **1.000
FDM−0.764 **−0.641 **−0.317−0.478 *−0.123−0.2970.2020.0930.287−0.245−0.3630.1041.000
FSSC−0.645 **−0.553 *−0.316−0.629 **0.390−0.3320.2700.2740.704 **−0.039−0.258−0.2430.494 *1.000
FP0.566 *0.3140.482 *0.294−0.2550.254−0.479 *−0.640 **0.025−0.552 *0.706 **0.344−0.409−0.2021.000
FWE0.839 **0.622 **0.580 *0.726 **−0.1320.588 *−0.660 **−0.659 **−0.314−0.3260.791 **0.545 *−0.608 **−0.498 *0.694 **1.000
FPP0.760 **0.479 *0.579 *0.534 *−0.2250.475 *−0.632 **−0.688 **−0.144−0.469 *0.815 **0.477 *−0.547 *−0.3690.922 **0.917 **1.000
WP−0.554 *−0.845 **−0.280−0.762 **−0.203−0.1210.1120.3390.374−0.203−0.162−0.0720.604 **0.491 *−0.060−0.563 *−0.3161.000
**, and * indicate p-values ≤ 0.01, and 0.05, respectively.
Table 12. Matrix of the three components extracted for the principal component analysis (PCA).
TraitPC1PC2PC3
PH0.842−0.2770.306
PBDR0.703−0.367−0.529
PBDS0.588−0.0020.621
PDGP0.797−0.259−0.467
LL*−0.1980.021−0.378
La*0.6070.0000.620
Lb*−0.669−0.125−0.576
FUL*−0.691−0.4440.351
FUa*−0.4010.5550.301
FUb*−0.327−0.7920.344
FLD0.7910.446−0.207
FTD0.5600.491−0.385
FDM−0.6100.495−0.045
FSSC−0.6210.5130.090
FP0.6860.4300.167
FWE0.9720.0550.060
FPP0.8940.2730.151
WP−0.6470.5020.217
Variance (%)44.54216.39613.939
Disclaimer/Publisher’s Note: The statements, opinions and data contained in all publications are solely those of the individual author(s) and contributor(s) and not of MDPI and/or the editor(s). MDPI and/or the editor(s) disclaim responsibility for any injury to people or property resulting from any ideas, methods, instructions or products referred to in the content.

