Article

Effects of Drip Tape Layout and Flow Rate on Water and Nitrogen Distributions within the Root Zone and Summer Maize Yield in Sandy Tidal Soil

1
Shandong Provincial Key Laboratory of Dryland Farming Technology, College of Agronomy, Qingdao Agricultural University, Qingdao 266109, China
2
College of Resources and Environment, Qingdao Agricultural University, Qingdao 266109, China
*
Authors to whom correspondence should be addressed.
Agronomy 2023, 13(11), 2689; https://doi.org/10.3390/agronomy13112689
Submission received: 26 August 2023 / Revised: 18 October 2023 / Accepted: 24 October 2023 / Published: 25 October 2023
(This article belongs to the Section Water Use and Irrigation)

Abstract

:
Drip tape layout and flow rate are crucial variables that impact the effects of drip fertigation. To investigate the influence of drip tape layout and flow rate on the soil water and nitrogen transport in summer maize in sandy tidal soil, field experiments were conducted for two years. Two drip tape layouts were set: one tape serving for two crop rows (N) and one tape serving for each crop row (E), with two levels of drip flow rate, i.e., high (2 L/h; H) and low (1.3 L/h; L). The results show that under the same drip tape layout, the lower the drip emitter flow rate, the more upright the shape of wetted soil volume. The maximum vertical and horizontal water transport distance under NL treatment was higher than that under NH, EH, and EL treatments. After surface drip fertigation, nitrate nitrogen accumulated near and at the edge of the wetted soil volume. In 2020, under NL treatment, nitrate nitrogen transported to a 55 cm soil layer, which was 22.22%, 71.42%, and 57.14% deeper than that under NH, EH, and EL treatments, respectively. In 2021, nitrate nitrogen could transport to a 60 cm soil layer in both NL and NH treatments. The maximum concentration of ammonium nitrogen was nearby the emitter. Under NL treatment, ammonium nitrogen was transported to 48 and 60 cm soil layers below the emitter in 2020 and 2021, respectively, which was deeper than that observed under NH, EH, and EL treatments. The soil inorganic nitrogen residue of the NL was lower than that of the NH, EH, and EL treatments. Compared with NH, EH, and EL treatments, the two-year maize yield under NL treatment increased by 11.09%, 13.47%, and 8.66% on average, respectively. NL treatment exhibited the highest water use efficiency and nitrogen fertilizer productivity. Therefore, NL treatment (one drip tape serving for two rows with 1.3 L/h flow rate) could promote the absorption of water and nutrients, reduce inorganic nitrogen residue, and to obtain high maize yield in sandy tidal soil.

1. Introduction

Maize is an important food crop, and stable production of maize is crucial for maintaining food security [1]. The Huang-Huai-Hai Plain is the main production area for maize cultivation in China. Maize growth and yield is closely linked to water and fertilizer availability. The conventional irrigation method in this area is flood irrigation, which leads to low efficiency of water resource utilization, rapid decline in groundwater level, and severely increasing water resource shortage [2]. Meanwhile, applications of fertilizers during periods of greatest crop demand, at or near the plant roots, and in smaller and more frequent applications all have the potential to reduce losses while maintaining or improving yield and quality [3]. Under flood irrigation, it is difficult to apply fertilizer in the later growth stage of maize and it increases the risk of groundwater pollution due to the leaching of chemicals and nutrients from the crop’s root zone [4]. The low efficiency of water and fertilizer utilization is the main factor limiting the development of green ecological agriculture in the Huang-Huai-Hai Plain.
Drip fertigation, a novel and effective agricultural irrigation technology, was extensively adopted by small-scale farmers across diverse farming systems [5]. It played an essential role in uniformly distributing water and fertilizer in the root zone of crops efficiently, thus synchronizing water and fertilizer delivery compared to traditional irrigation by flood and fertilization by broadcasting N fertilizer practices. The drip-fertigated maize was found to have 24% and 72% higher N use efficiency than the border-irrigated and rain-fed conditions, respectively [6]. Li et al. reported that drip fertigation led to significant water productivity (26.4%) and nitrogen use efficiency (34.3%) compared to farmers’ practices referring to traditional irrigation [7]. Moreover, it also has the potential to achieve a higher yield and decrease nitrogen residue in soil. Wu et al. reported that drip fertigation increased maize grain yield by 41% in sandy soil and 17% in clay soil compared to conventional rain-fed practices [8]. However, it is hard to find studies specifying the optimal drip fertigation parameters in maize production.
In drip fertigation practice, the layout of drip tapes has a significant impact on the dynamics of soil water and nutrition distribution in the root zone, which further influences yield. Guo et al. showed that drip lines for two rows of plants outperformed drip lines for one row of plants for achieving higher yields and irrigation water efficiency in greenhouse tomato plants [9]. Wang et al. reported that soil moisture under two tapes for four rows was greater than that of one tape for four rows, forming a “broad and shallow” wet zone, which was beneficial for the growth of cotton [10]. Drip flow rate is also critical in drip fertigation practice. Previous studies reported that the volume of soil wetting under drip irrigation is affected by the flow rate of the drip emitter [11]. Therefore, the drip flow rate should be selected by the root distribution range of different crops; that is, the wetted soil volume should be consistent with the root distribution range. Hou et al. reported that the distribution of nitrate nitrogen in soil is similar to that of water [12]. As the drip flow rate increases, nitrate nitrogen tends to accumulate at the edge of the wetting volume. Wang et al. reported that the transport and distribution of nitrate nitrogen and ammonium nitrogen in soil were significantly affected by the flow rate of the tape emitter [13]. However, the effects of drip tape layout and flow rate on water and nitrogen distribution within the root zone and summer maize yield in sandy tidal soil are poorly understood.
The tidal soil area of the Huang-Huai-Hai Plain is important for maize production in China. The cultivation of high-yield maize requires sufficient water and nutrients. However, water and fertilizer use efficiency are both low in maize production in the tidal soil area. In this study, we aimed to develop the optimal drip fertigation technology for maize growing in tidal soil areas. The effects of different drip tape layouts and flow rates on the distribution and transport of soil water and nitrogen, aboveground dry matter accumulation, and maize yield were studied during two years. This study provided the optimal drip fertigation technology for maize in this region that can promote high maize yield, along with efficient absorption of water and nutrients and reduction in inorganic nitrogen residue.

2. Materials and Methods

2.1. Experimental Site

The field experiment was conducted from 2020 to 2021 at Jiaozhou City (36°09′ N, 120°00′ E), Shandong Province, China. The prevalent climate at this location is semi humid and warm–temperate, with 210 frost-free days a year. The soil type is categorized as a sandy tidal with 60% sand, 27% silt, and 13% clay. Before the implementation of the experiment, characteristics of the topsoil (0–20 cm) were as follows: pH 5.4, total nitrogen 0.95 g kg−1, alkali hydrolyzed nitrogen 132.05 mg kg−1, available phosphorus 37.00 mg kg−1, and available potassium 127.00 mg kg−1. The total rainfall during the summer of 2020 and 2021 was 647.2 and 412.69 mm, respectively.
The status and variations in precipitation among years were assessed using the drought coefficient method, with the following formula [2]:
DI = (PM)/σ
where P is the annual precipitation of maize growth stages (mm); M is the average precipitations of maize growth from 1986 to 2021(398.75 mm); σ is the standard error for annual precipitations between years (140.43); DI is the drought index and is used to distinguish the wet (DI > 0.35), normal (−0.35 ≤ DI ≤ 0.35), and dry (DI < −0.35) years. The DI is 1.734 and 0.097 in 2020 and 2021. Therefore, 2020 was the wet year, and 2021 was the normal year.

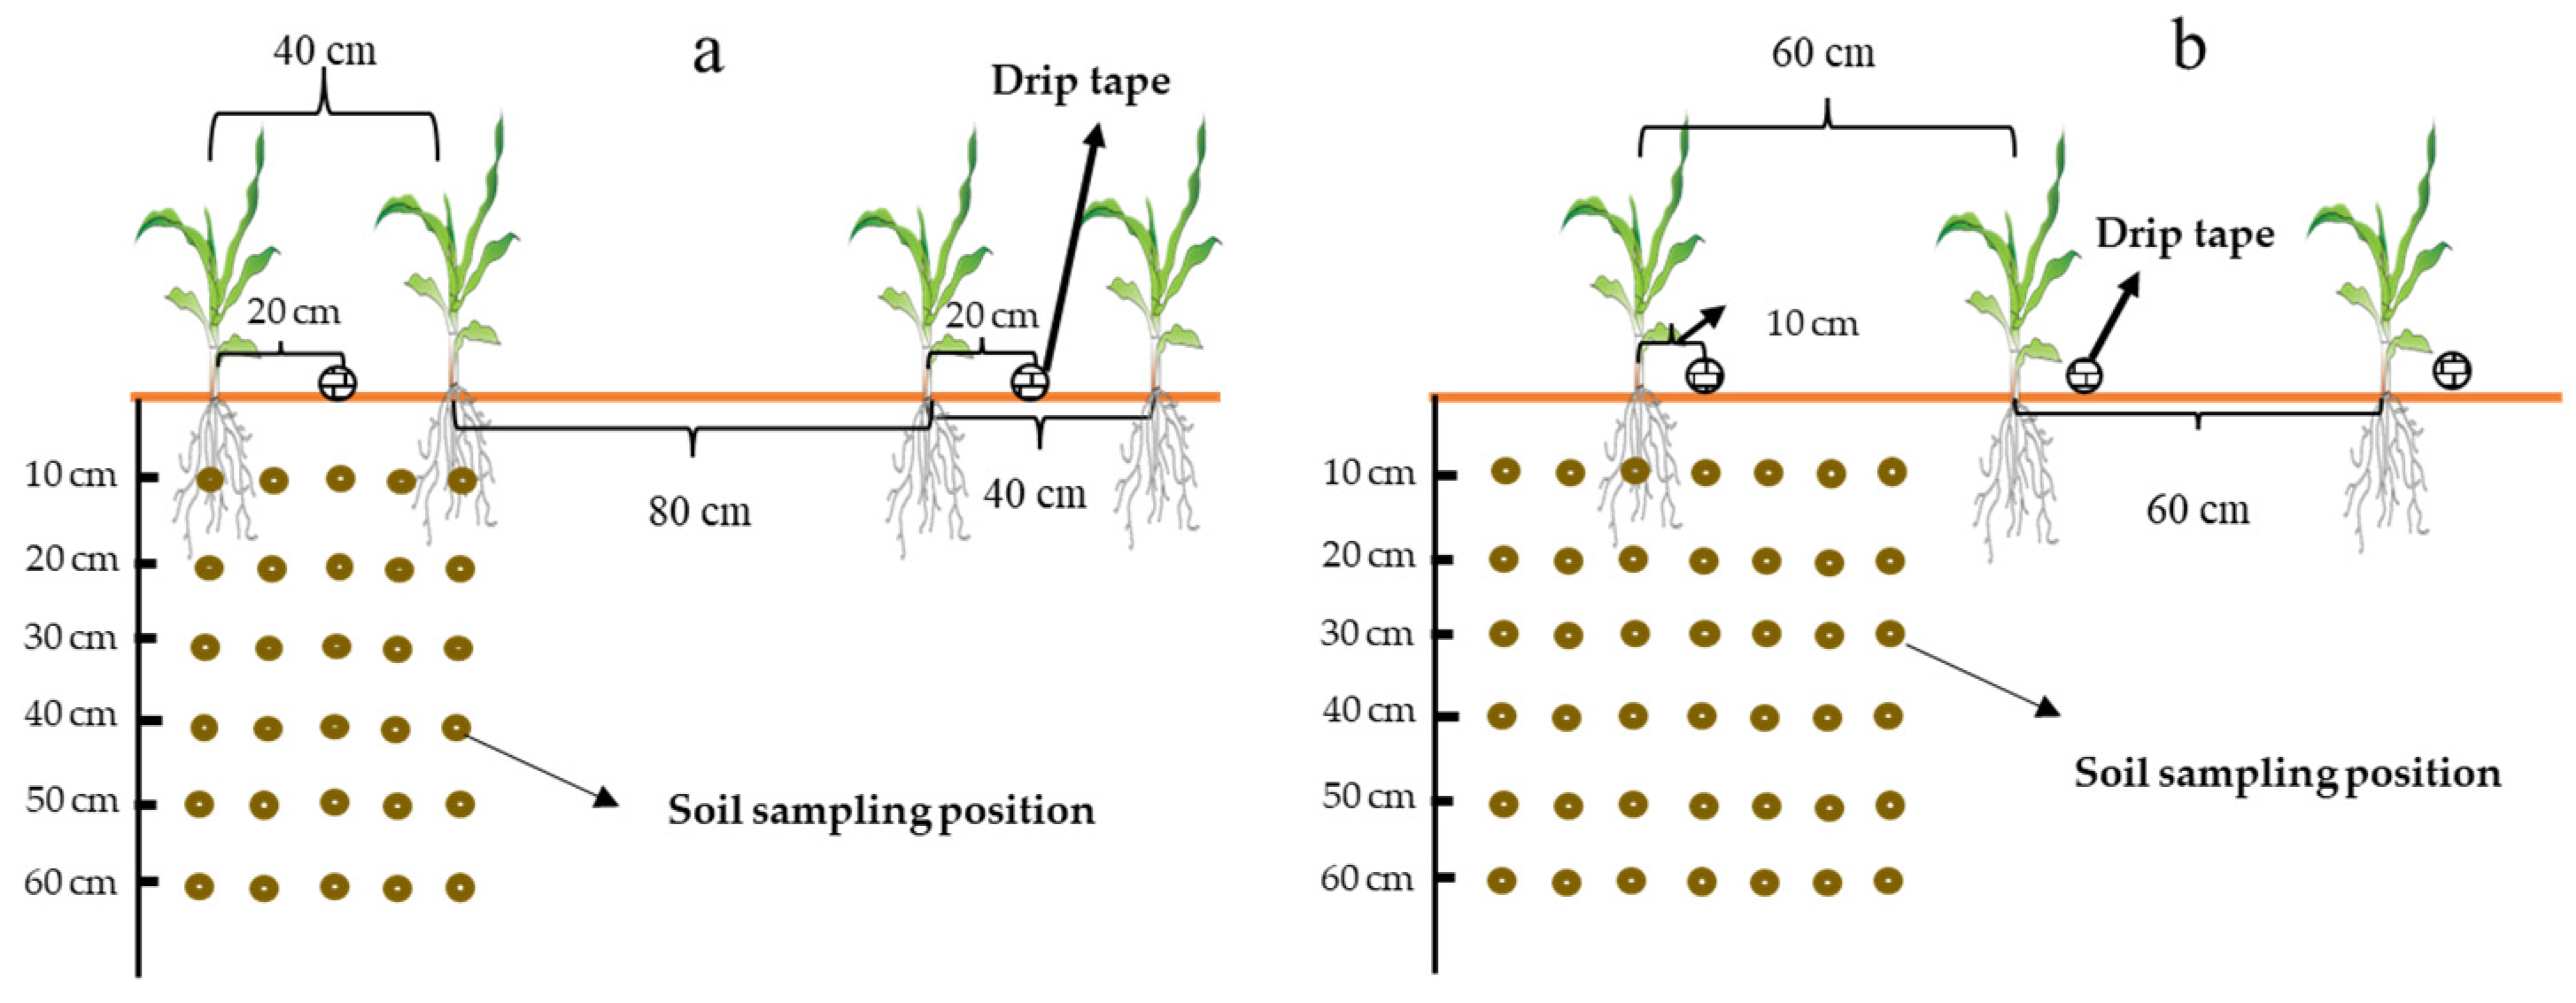
2.2. Experimental Design and Field Management

The field experiment was conducted using a split-plot design with three replicates. The main plot was applied with drip tape layouts, including one tape serving for two crop rows (N) and one tape serving for each crop row (E); the subsidiary plots were applied with two different drip flow rates: 2 L/h (H) and 1.3 L/h (L). The specific treatment is shown in Table 1. The area of each subsidiary plot was 240 m2 (9.6 m × 25 m), with a 1 m wide isolation area preventing water penetration between contiguous plots. The drip tapes were arranged between the narrow rows for N treatment and laid 10 cm on one side of the maize for E treatment (Figure 1). Drip tape with a flat dripper was used, and the distance between the drip emitters was 30 cm. Each plot was independently installed using a drip irrigation field control system and water meter to control the irrigation quota. The summer maize variety Zhengdan958 was planted with sowing density of 67,500 plants per hectare. Maize was planted on 21 June in both experimental years, and harvested on 15 October in 2020 and 3 October in 2021.
Nitrogen (N), phosphate (P2O5), and potassium (K2O) fertilizers were supplied at 150, 75, and 75 kg ha−1, respectively. During the maize growth period, nitrogen fertilizer (35% of total N with urea and diammonium phosphate) was applied as basal fertilizer plus topdressing by a fertigation system (25% and 40% at V12 and VT stages, respectively, using urea). P2O5 and K2O fertilizers (diammonium phosphate and potassium chloride, respectively) were applied as basal fertilizer. The field management measures, including regular weeding and pesticide application to control insects, were the same for all treatments following the local recommended practices.

2.3. Soil Water, Ammonium Nitrogen, and Nitrate Nitrogen Contents

Soil samples were collected before fertigation and three days after fertigation at the silking stage (0–60 cm below the soil surface) and maturity stage (0–100 cm below the soil surface) using an auger in both years. In each plot, sites near the drip emitter were randomly selected. A drip emitter (aligned with plant) was as the center of the soil samples. The samples in a horizontal direction were divided into seven sections (0, 0–10 cm, right–10 cm, right–20 cm, right–30 cm, left–10 cm, left–20 cm, and left–30 cm) for the tape layout under N treatment, and the soil samples from the same positions on both sides were mixed evenly. There were five sections (0, right–10 cm, right–20 cm, left–10 cm, and left–20 cm) for the tape layout under E treatment, and the plant was located 10 cm from the drip emitter (Figure 1).
The sampling points in vertical directions were located every 10 cm from the soil surface. Each soil sample was divided into two parts to determine soil moisture content and ammonium nitrogen and nitrate nitrogen content, respectively. Each treatment was repeated three times, with an average value of three points. Soil moisture content was determined using the gravimetric method (oven dry basis). To determine ammonium nitrogen (NH4+-N) and nitrate nitrogen (NO3-N) contents, fresh soil samples were added to 0.01 mol L−1 calcium chloride and shaken for 1 h. After filtration, the NO3-N and NH4+-N contents from the extracts were immediately measured using a continuous flow analyzer (AA3, Bran and Luebbe, Norderstedt, Germany).
The mineral nitrogen accumulation (kg ha−1) was calculated as follows:
Mineral nitrogen accumulation (kg ha−1) = T × BD × mineral N content × 0.1
where T (cm) is the soil thickness; BD (g cm−3) is the soil bulk density; mineral nitrogen content (mg kg−1) is the sum of the NO3-N and NH4+-N; and 0.1 is the conversion coefficient.

2.4. Dry Matter

At the silking stage (R1) and maturity stage (R6), three uniform plants were collected from each treatment, respectively. The plants were divided into stem, leaf, bract cob, tassel, corn cob, and grains. They were then dried at 105 °C for 30 min to inactivate the enzyme, followed by drying at 75 °C until a constant weight was achieved. These dried samples were used to determine the dry matter of the plant.

2.5. Grain Yield and Nitrogen–Water Efficiencies

At the maize maturity stage, two central rows (6 m long) were harvested. The cobs were hung in mesh bags in a ventilated area, allowed to dry naturally, and further weighed. The number of rows, number of grains in the rows, and 1000-grain weight were evaluated. The yield was recorded at 14% grain moisture. Partial factor productivity of N fertilizer was applied (kg ha−1) (PFPN, kg kg−1) [14] and WUE were calculated according to the following formulae:
PFPN (kg kg−1) = Y/FN
where Y is the grain yield (kg ha−1); FN is the total applied amount of nitrogen fertilizers (kg ha−1).
Seasonal evaporate-transpiration (Eta) was estimated using the water balance approach [15].
Eta = P + I + U − D − R − ∆W
where Eta is the cropping water consumption (mm), P is precipitation (mm); I is irrigation (mm); U is the underground water recharge (mm); D is the deep leakage amount (mm); R is the runoff amount (mm); and ∆W is the soil water change at different growth stages (mm). ∆W = Wf − Wi, Wi is the change in the soil water storage in the profile at sowing and Wf represents the soil water storage in the profile at harvest. The groundwater table was deep (> 40 m) in the test area, and the terrain was flat with little rainfall. In addition, the wetting depth of drip irrigation was shallow. Thus, U, R, and D can be ignored. Thus,
Eta = P + I − ∆W.
The water use efficiency can be calculated using the following equation [16]:
WUE (kg m−3) = Y/Eta,
where Y is grain yield; Eta is total irrigation water during the growth period.

2.6. Statistical Analysis

The raw data were input using Microsoft Excel 2016. Statistical analyses were performed using SPSS 25.0 (SPSS Inc., Chicago, IL, USA). Means were compared using Duncan’s new multiple range method test at p < 0.05. All graphics were drawn using Sigma plot 12.5 (Systat Software, Inc., San Jose, CA, USA).

3. Results

3.1. Weather and Irrigation

Daily precipitation during the experimental periods is given in Figure 2. Table 2 indicates the meteorological index of summer maize at different growth stages in 2020 and 2021. During maize growth stages, the maximum temperature was 34.4 °C and 34.8 °C in 2020 and 2021, the minimum temperature was 8.4 °C and 18.2 °C in 2020 and 2021, respectively. The active accumulated temperature (≥10 °C) was 2660.2 °C d and 2538.2 °C d in 2020 and 2021, respectively. The total rainfall was 647.2 mm and 412.7 mm in 2020 and 2021, respectively.
The amount of irrigation mainly depended on the soil moisture. In 2020, the irrigation applications were 75 m3 ha−1 at the V12 stage and 70 m3 ha−1 at the VT stage. In 2021, irrigation applications were 87 m3 ha−1 at the V12 stage and 85 m3 ha−1 at the VT stage.

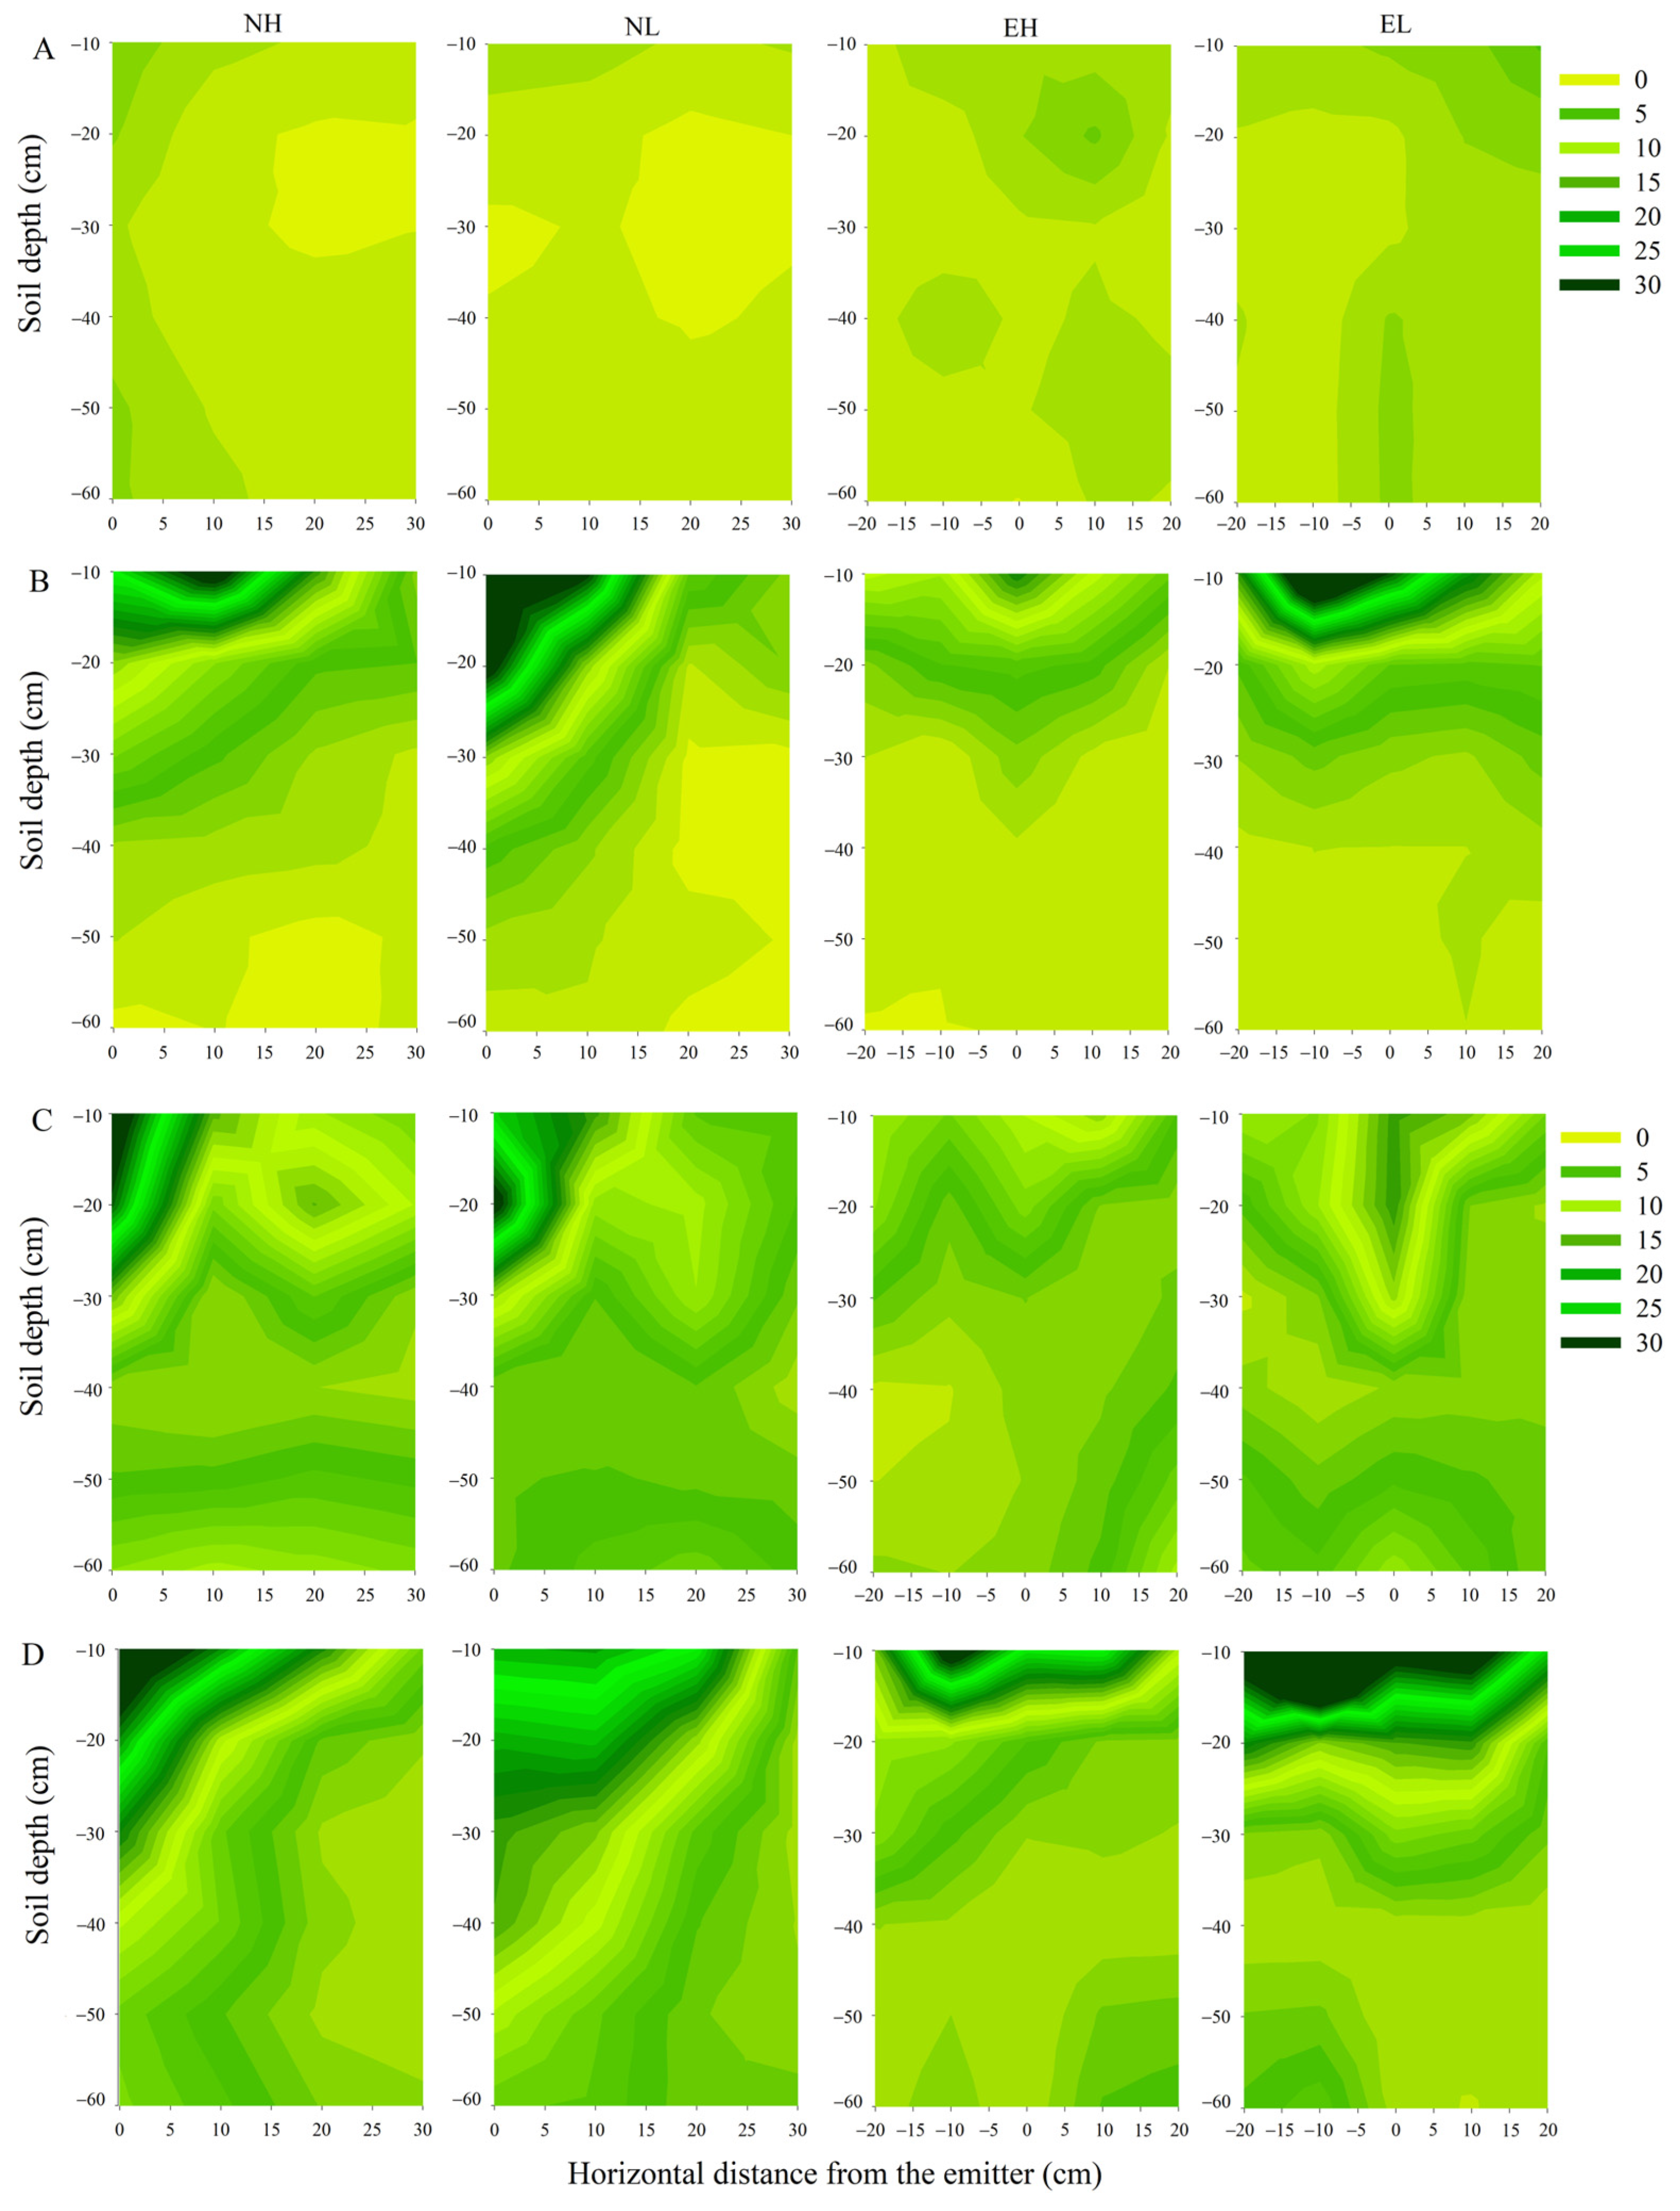
3.2. Soil Water Distribution

After surface drip irrigation, the wetting pattern in each treatment was similar to ellipsoid (Figure 3). Under the same drip tape layout, the lower the emitter flow rate, the more upright the shape of wetted soil volume was. With an average of three replications per treatment, the maximum vertical water transport distance was 21–28 and 28–40 cm in 2020 and 2021, respectively, and was 22–40 and 21–36 cm for H and L treatments, respectively. It was 23–40 and 21–30 cm for N and E treatments, respectively. The maximum vertical water transport distance was deeper under NL treatment than under NH, EH, and EL treatments, with an average two-year increase by 14.59%, 37.92%, and 28.64%, respectively. The maximum horizontal water transport distance was 40–60 and 36–46 cm in 2020 and 2021, respectively, and was 40–60 and 36–56 cm under L and H treatments, respectively. It was 38–60 and 36–44 cm under N and E treatments, respectively. The maximum horizontal water transport distance was higher under NL treatment than under NH, EH, and EL treatments, with an average two-year increase of 18.55%, 28.70%, and 23.19%, respectively.

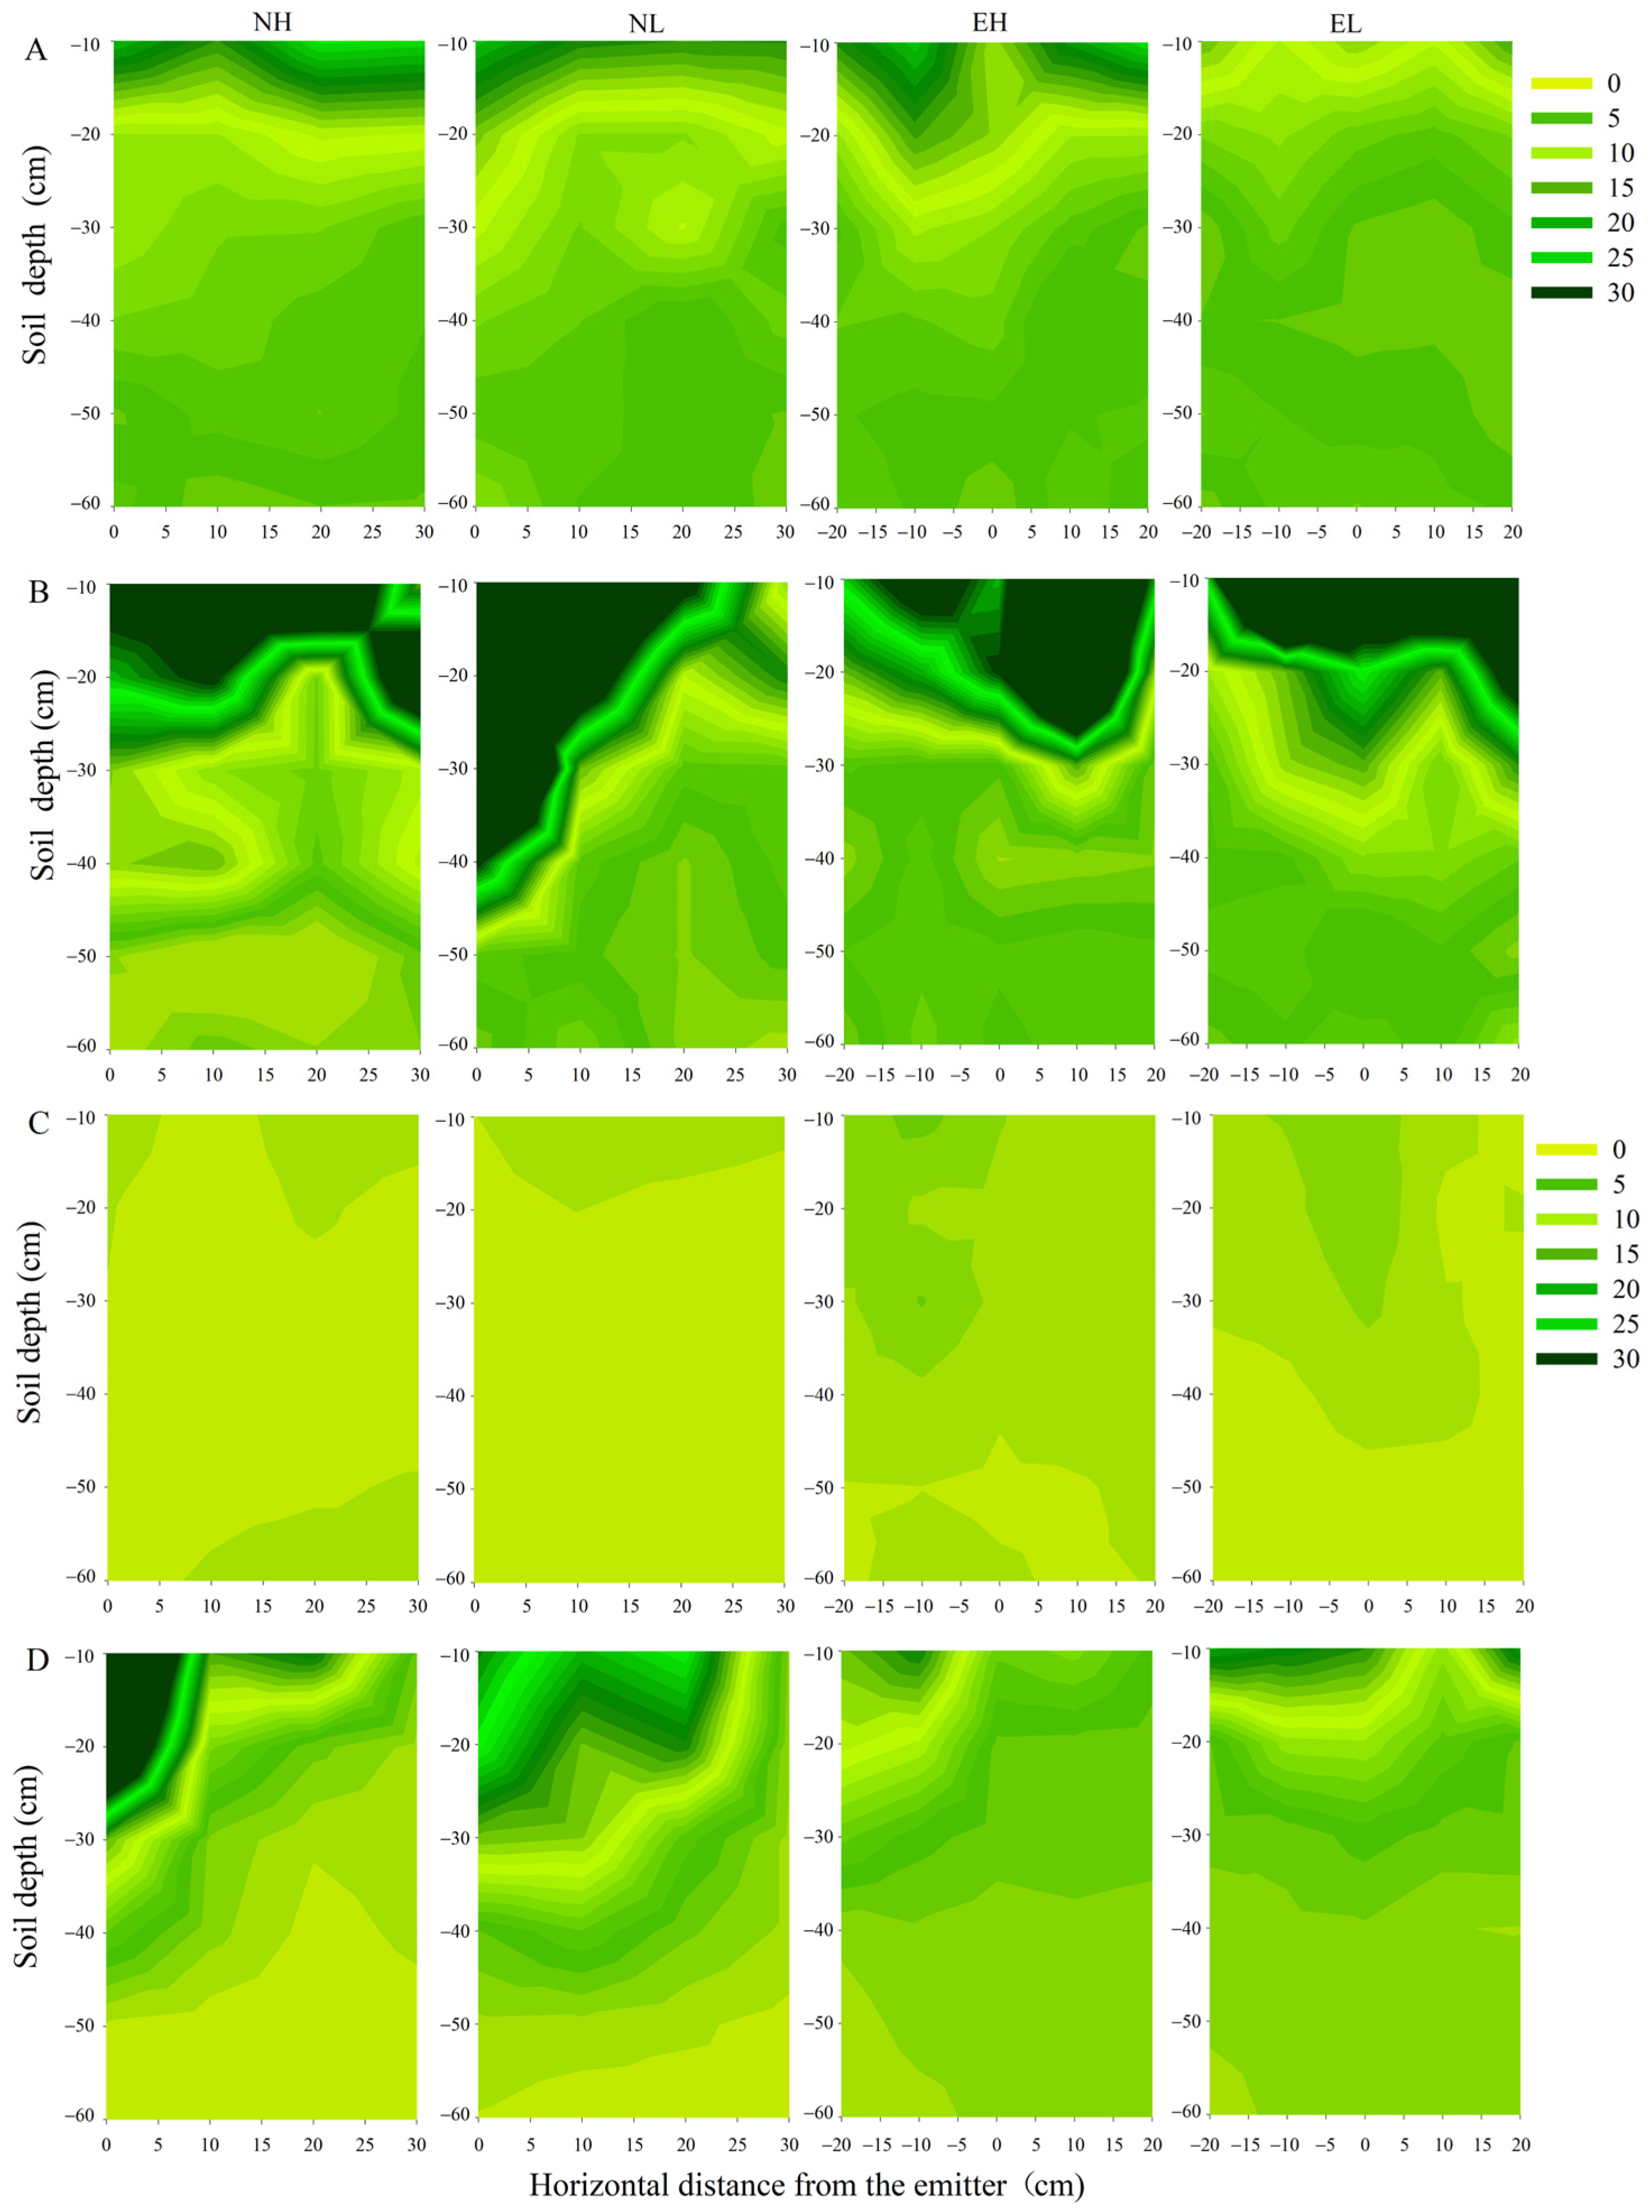
3.3. Nitrate Nitrogen Distribution

After drip fertigation (urea), the distribution of nitrate nitrogen in the soil was consistent with the water transport pattern in the wetted volume, and the shape was similar (Figure 4). Nitrate nitrogen accumulated near and at the edge of the wetted soil volume, and the concentration was higher in the topsoil (0–20 cm) and deeper soil layers. The concentration of nitrate nitrogen was highest in the 0–10 cm soil layer below the emitter. Soil nitrate nitrogen concentration in the wetted soil volume was significantly higher in 2021 than in 2020 (p < 0.05).
In terms of vertical nitrogen transport distance, in 2021, nitrate nitrogen could be transported to a 60 cm soil layer under both NL and NH treatments, whereas under EH and EL treatments, it was mainly distributed above a 40 cm soil layer. In 2020, under NL treatment, nitrate nitrogen was transported to a 55 cm soil layer, which was 22.22%, 71.42%, and 57.14% deeper than that observed under NH, EH, and EL treatments, respectively. In the horizontal direction, the maximum nitrate transport distance exceeded 40 cm for each treatment in both years, and the maximum horizontal distance was at a 0–10 cm soil profile.

3.4. Ammonium Nitrogen Distribution

After three days of drip fertigation, ammonium nitrogen accumulated in the wetted soil volume near the emitter (Figure 5). The maximum vertical and horizontal transport distances occurred near the emitter and at the soil surface profile, respectively. Concentration of ammonium nitrogen was the maximum nearby the emitter. The soil ammonium nitrogen concentration in the wetted soil volume was significantly higher in 2021 than in 2020 (p < 0.05).
In the vertical transport direction, ammonium nitrogen was transported to 48 and 60 cm soil layers below the emitter in 2020 and 2021, respectively, under NL treatment, which was 60.00%, 71.43%, and 54.84% deeper than that observed under NH, EH, and EL treatments in 2020 and 20.00%, 66.67%, and 50.00% in 2021, respectively. In terms of horizontal nitrogen transport distance, the maximum ammonium nitrogen transport distance could reach to the maize root zone under each treatment in both years. The ammonium nitrogen concentration was higher by 47.01%, 48.47%, and 46.02% in 2020 and 6.53%, 24.08%, and 18.93% in 2021 under NL treatment than under NH, EH, and EL treatments, respectively.

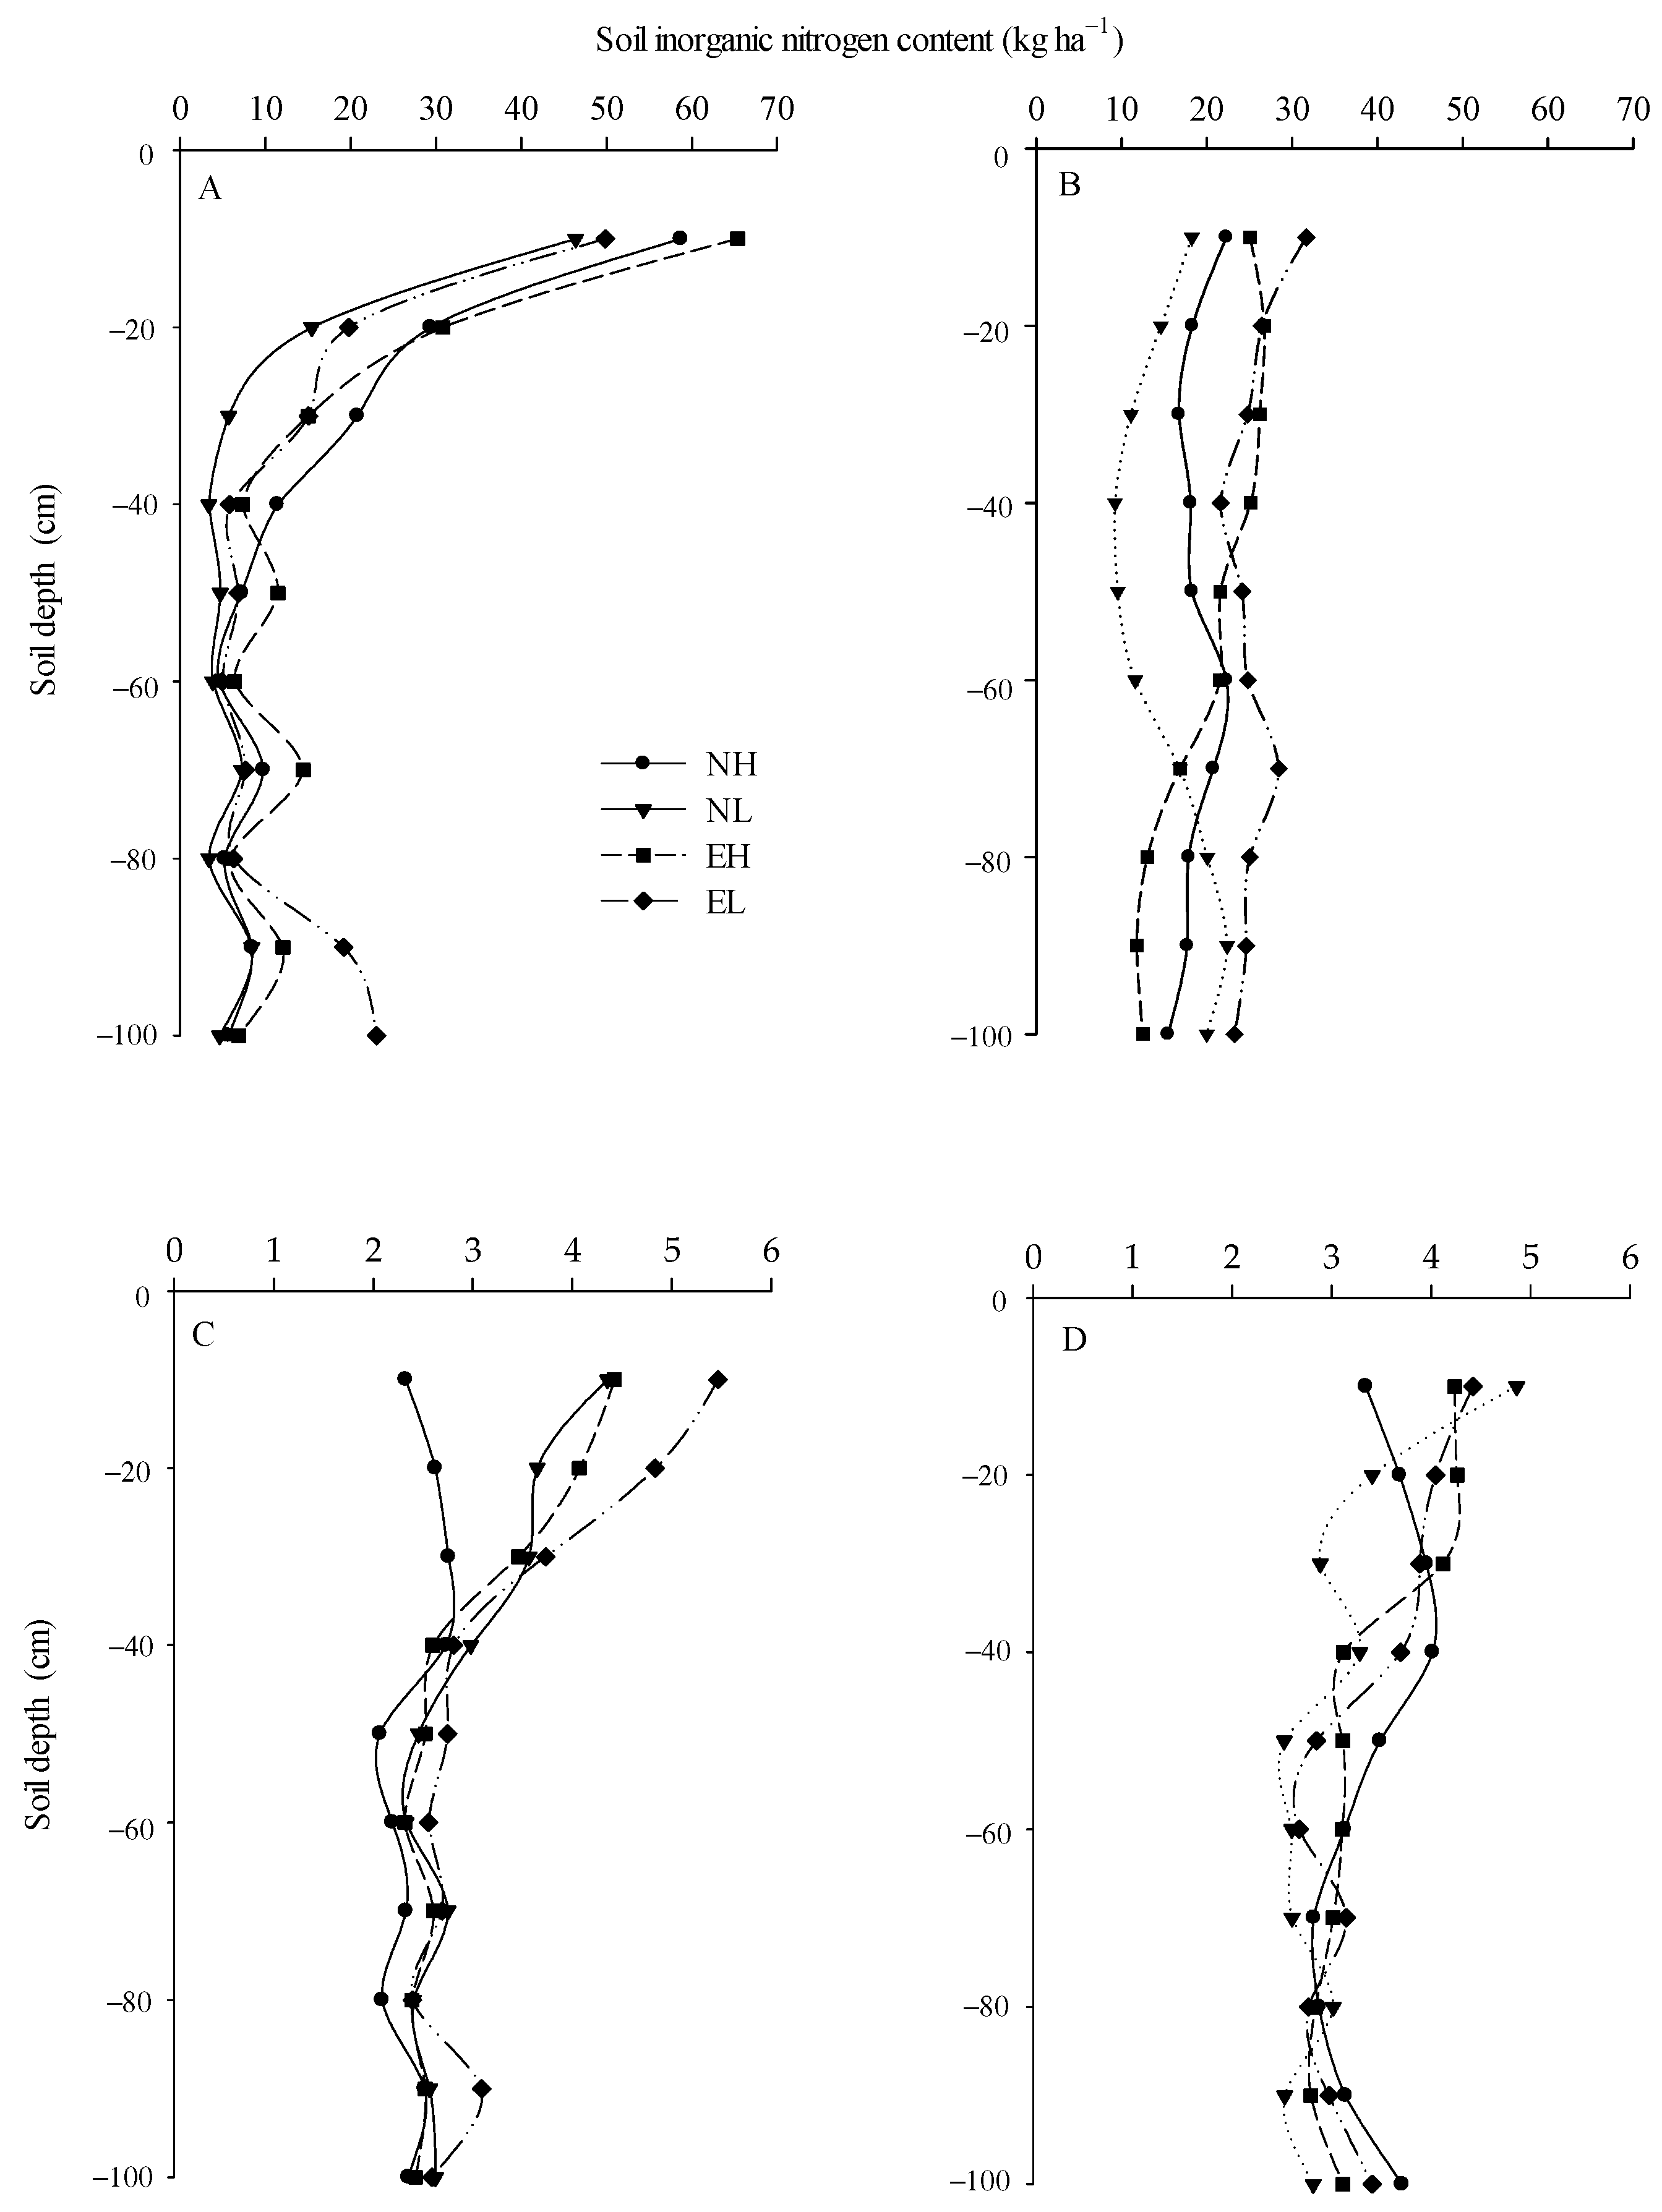
3.5. Residual Amount of Inorganic Nitrogen

In terms of residual nitrogen at the maturity stage of maize, a significant difference was observed between two years (p < 0.05) (Figure 6). In 2020, the residual amount of nitrate and ammonium nitrogen was relatively higher in the 0–40 cm soil layer than the 40–100 cm soil layer. In 2021, the residual nitrogen was more uniform in the 0–100 cm soil layer. Compared with NH, EH, and EL treatments, under NL treatment, the residual amount of nitrate nitrogen decreased by 41.10%, 40.21%, and 21.66% in the 0–40 cm soil layer and 21.21%, 43.68%, and 52.63% in the 40–100 cm soil layer in 2020 and by 18.19%, 23.37%, and 39.72% in the 0–100 cm soil layer in 2021, respectively. Compared with NH, EH, and EL treatments, under NL treatment, the residual amount of ammonium nitrogen decreased by 10.64%, 9.48%, and 9.87%, respectively.

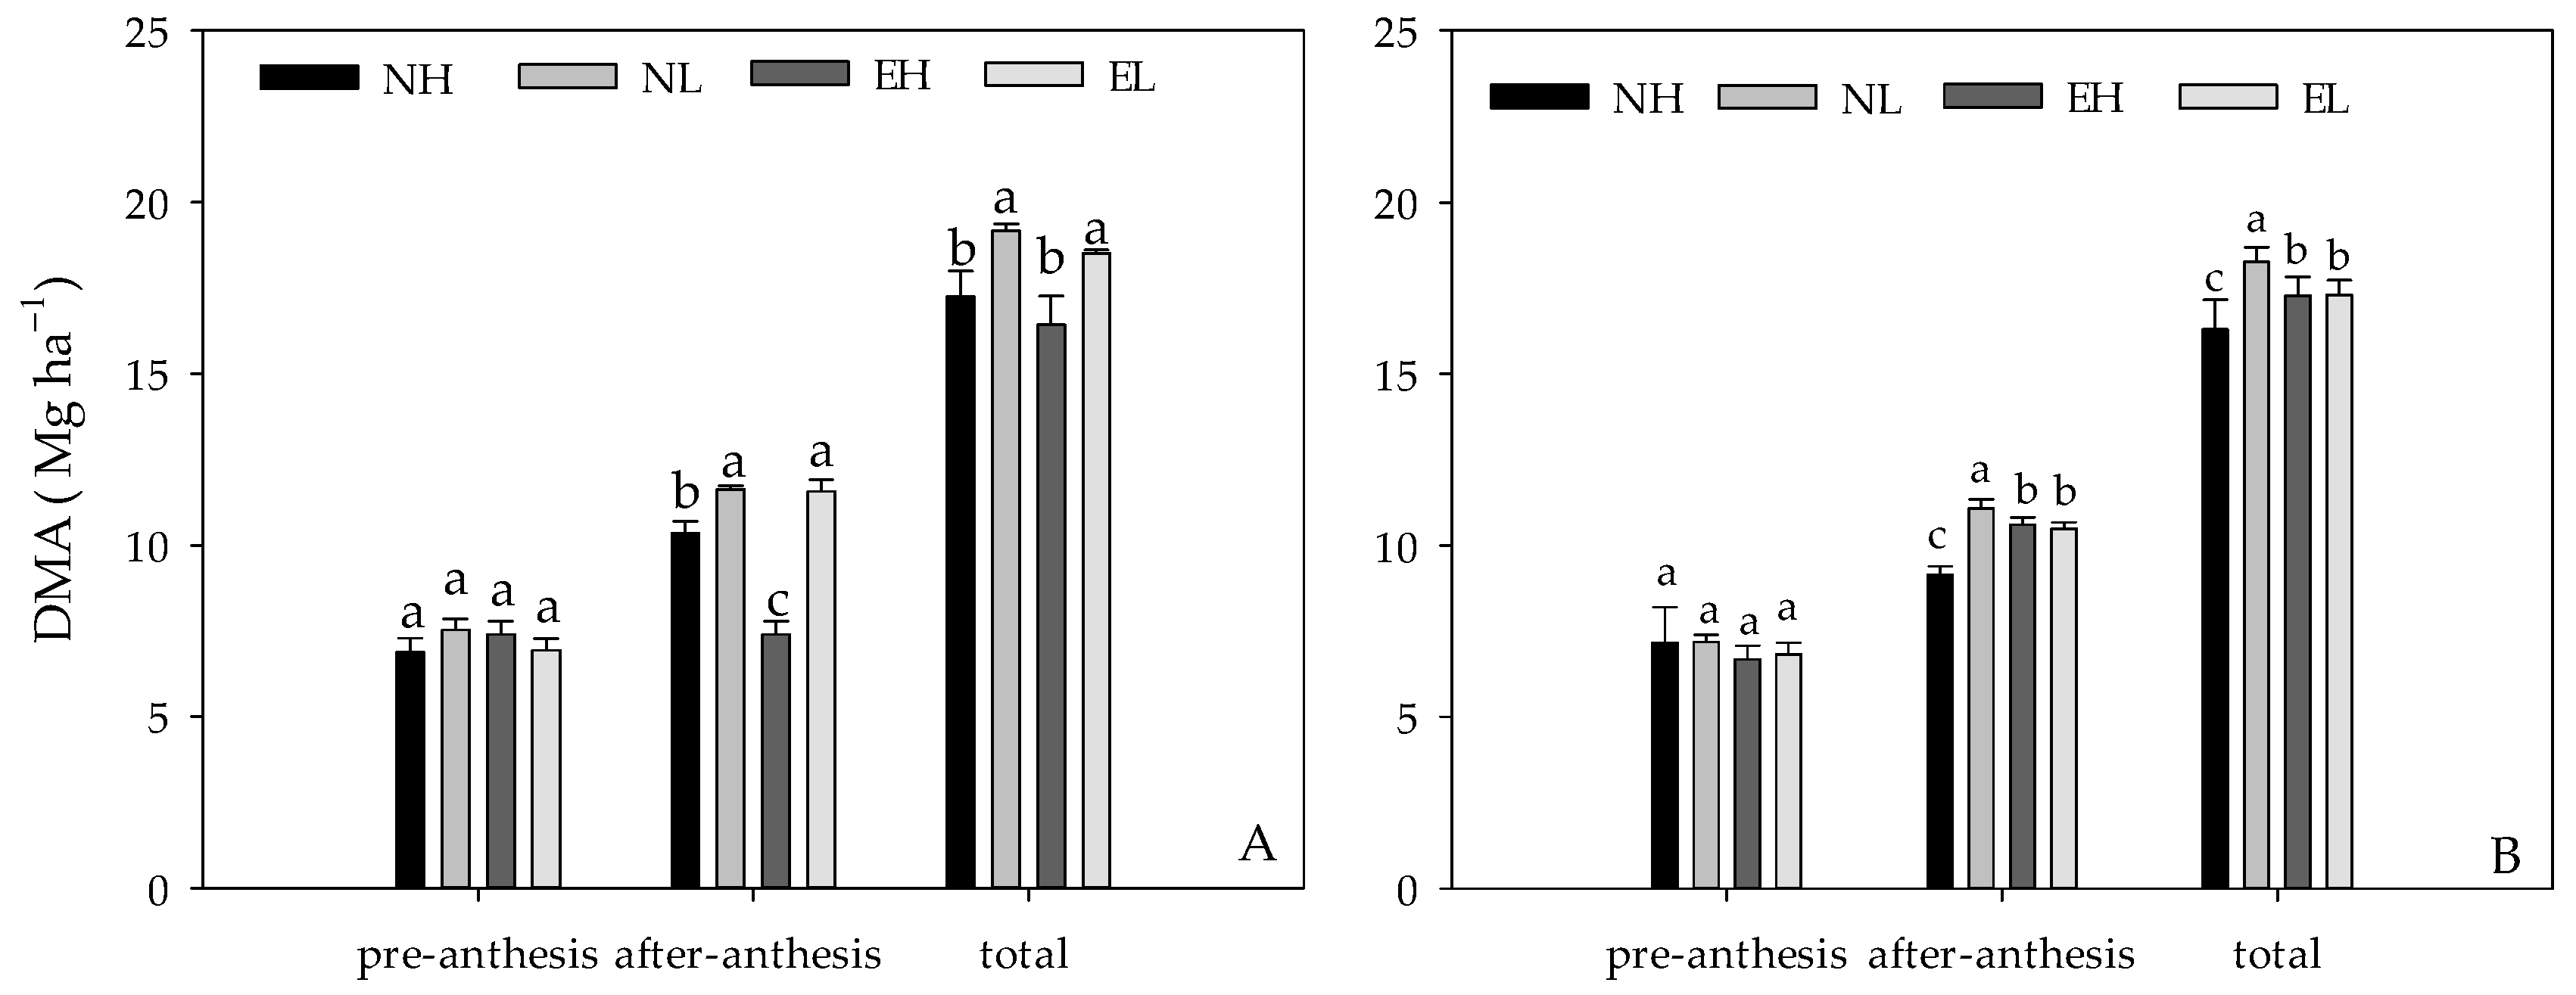
3.6. Dry Matter Accumulation (DMA)

DMA was not significantly different at pre-anthesis among the treatments between two years (Figure 7). However, it was significantly different at post-anthesis among the treatments (p < 0.05). In 2020, under NL treatment, the total aboveground DMA increased by 11.11%, 16.64%, and 3.49%, and the DMA at post-anthesis increased by 12.27%, 28.87%, and 0.47%, compared with NH, EH, and EL treatments, respectively. In 2021, under NL treatment, the total DMA increased by 12.02%, 5.74%, and 5.67% and by 21.12%, 4.55%, and 5.72% at post-anthesis, compared with NH, EH, and EL treatments, respectively.

3.7. Yield and Yield Components

No significant difference was observed in the number of ears per hectare among different treatments in either normal or wet year (Table 3). The number of kernels per ear for two years was significantly higher under NL treatment than under other treatments (p < 0.05), exhibiting increase by 7.80%, 8.67, and 8.02% in 2020 and 3.05%, 4.38%, and 6.06% in 2021, compared with NH, EH, and EL treatments, respectively. The 1000-grain weight in 2021 was significantly lower than that in 2020 (p < 0.05). The maize kernel yield was significantly higher under NL treatment than under other treatments in both years (p < 0.05), exhibiting increase by 13.80%, 17.49%, and 9.83% in 2020 and 8.38%, 9.45%, and 7.49% in 2021, compared with NH, EH, and EL treatments, respectively. Under the same treatment, the yield was significantly higher in 2020 than in 2021 (p < 0.05).

3.8. Water Use Efficiency and Nitrogen Fertilizer Partial Productivity

The WUE was significantly higher under NL treatment than under other treatments in both years with an average increase of 11.10%, 13.47%, and 8.67% compared with NH, EH, and EL treatments, respectively (p < 0.05). The PFPN was significantly higher under NL treatment than under other treatments in both years with an average increase of 6.82%, 7.94%, and 5.69% compared with NH, EH, and EL treatments, respectively (p < 0.05) (Table 4).

4. Discussion

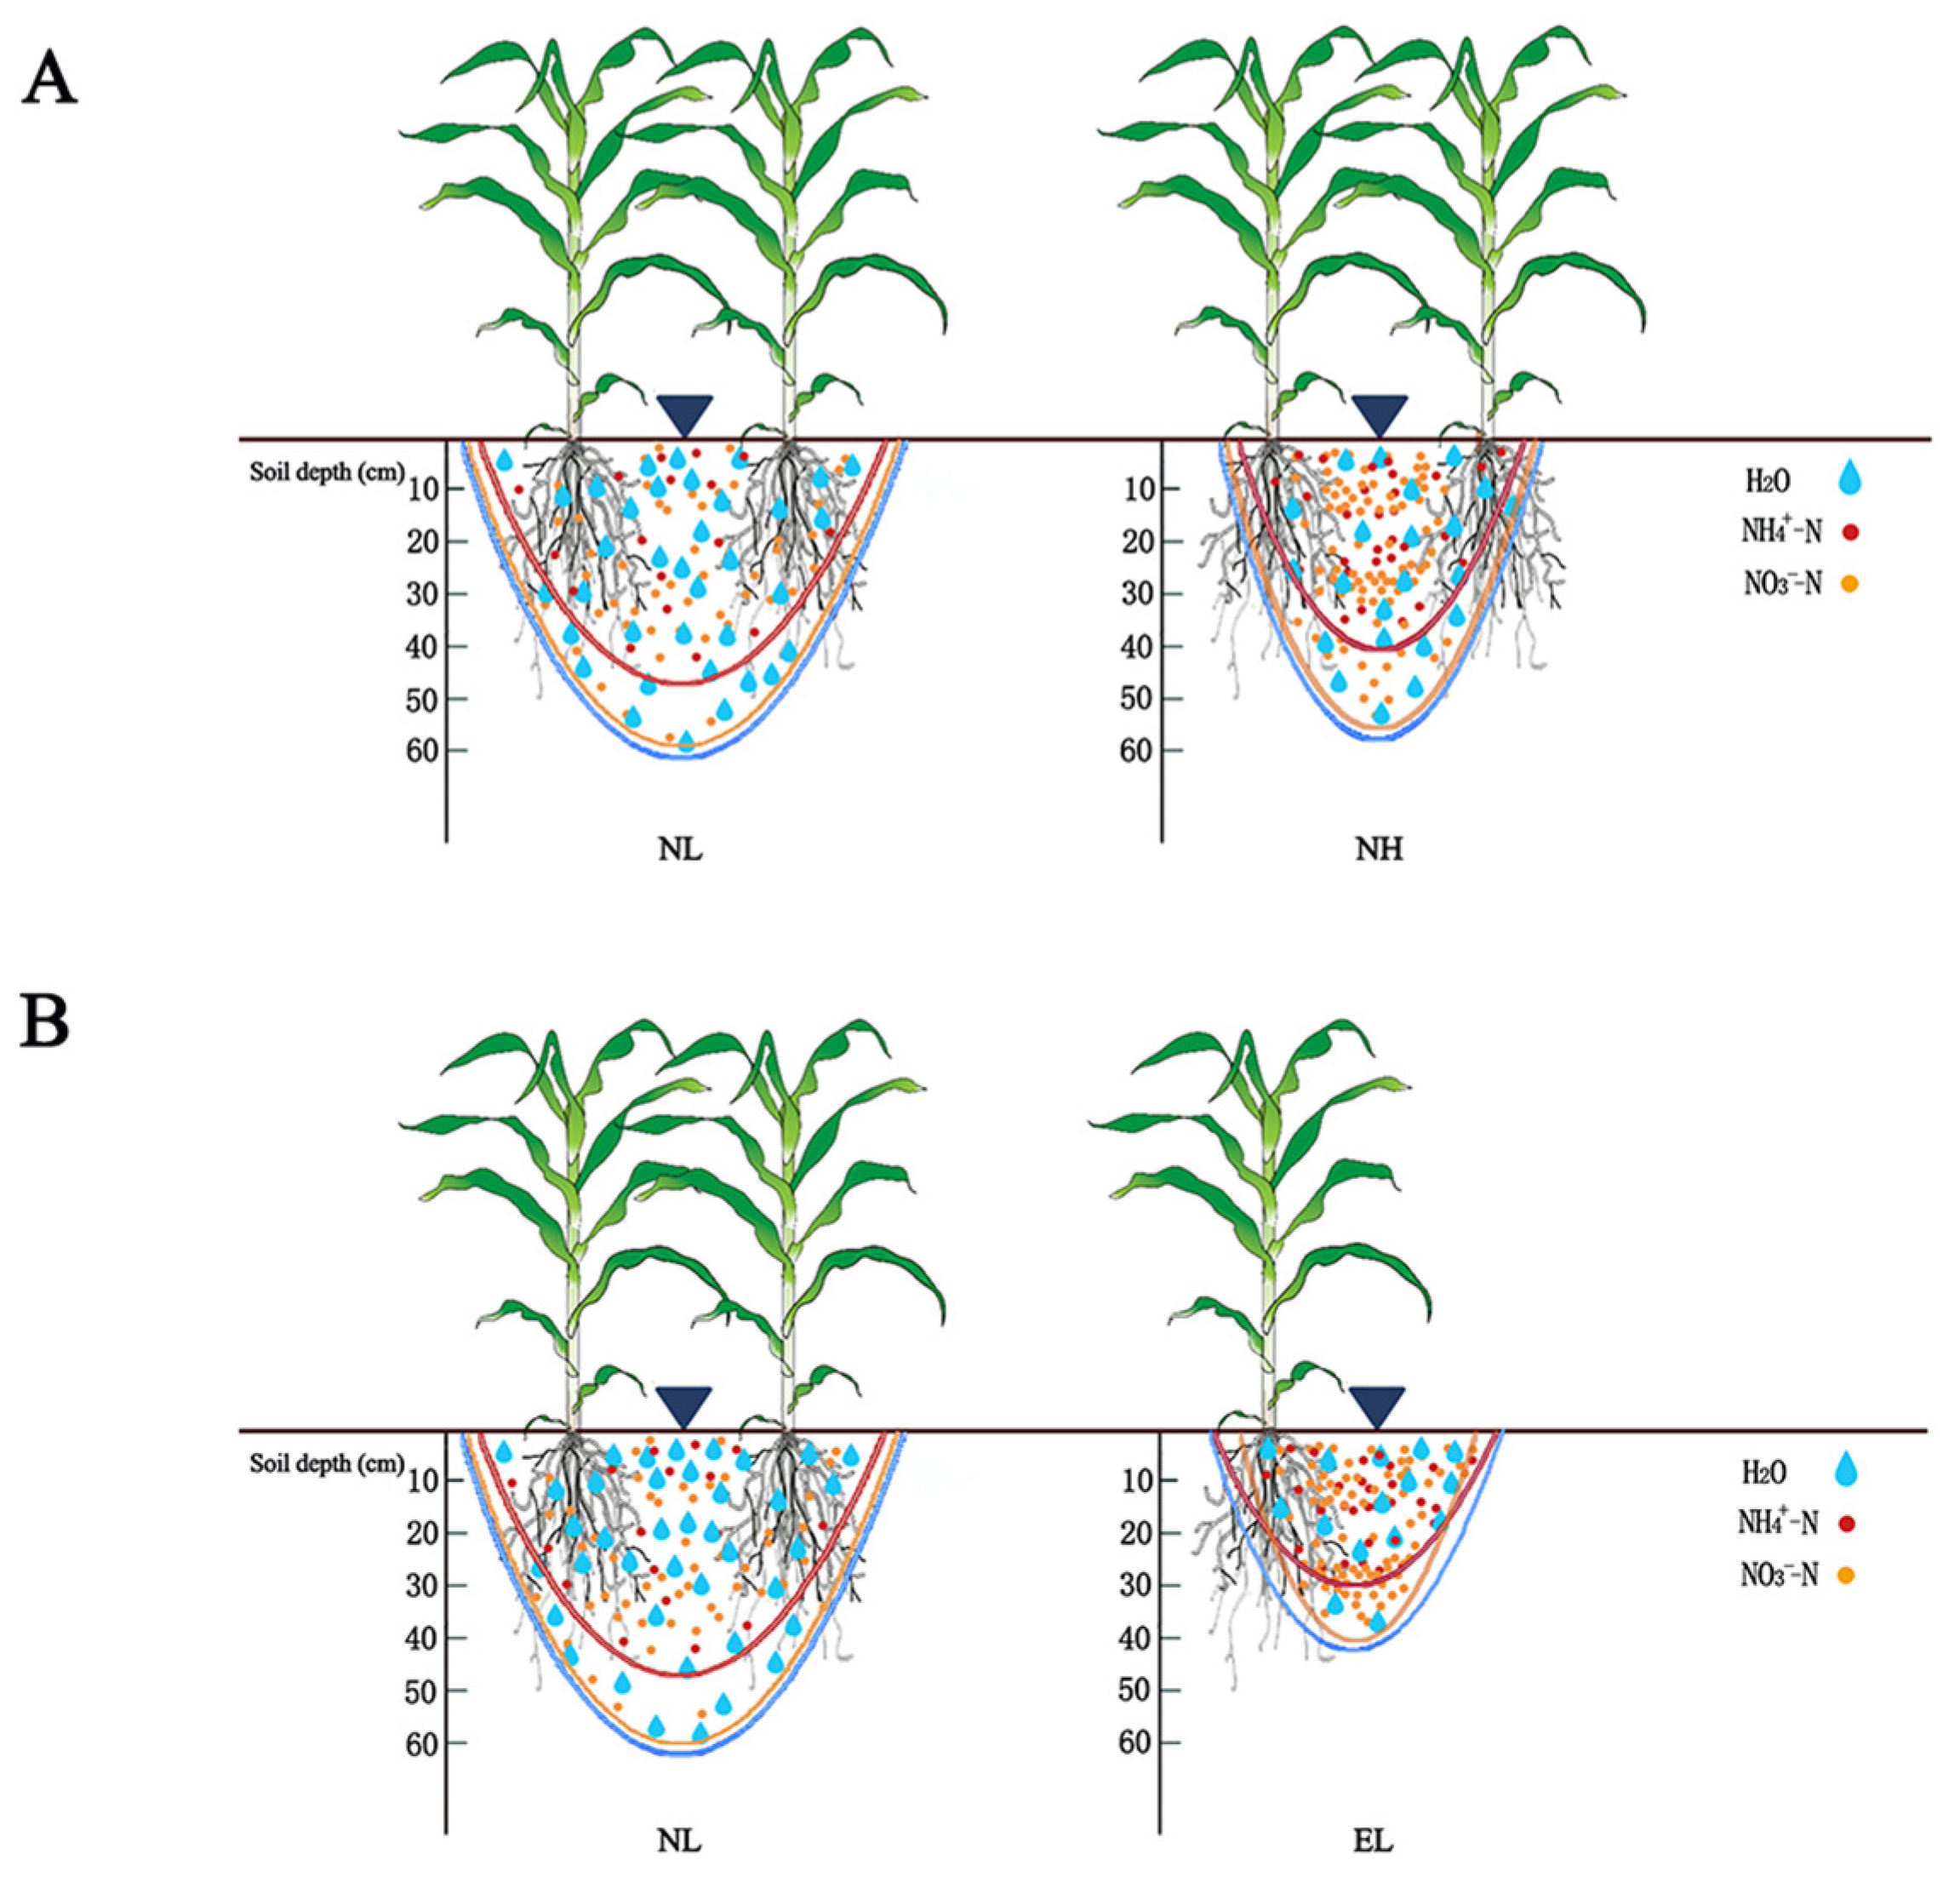
4.1. Effects of Various Drip Tape Layouts and Drip Emitter Flow Rates on Soil Water Distribution

The growth of maize requires more fertilizer and water. Many factors, such as the drip tape layout, drip flow rate, and irrigation amount and interval, can affect the soil water distribution [17,18]. In a drip irrigation system, the wetting pattern and components are crucial for optimum design and operation. Parameters such as horizontal diffusion distance, vertical infiltration distance, and wetted volume are important characteristics of soil wetting pattern [19]. Kilic reported that during initial drip irrigation, the shape of the wetting body appears as a flat semi elliptical shape. As the irrigation volume increases, the wetting pattern presents an upright semielliptical distribution [20]. Similarly, in our study, the same wetting pattern (similar to ellipsoid) was observed in each treatment.
Drip flow rate is considered one of the most important parameters in the system design and management and can significantly affect the irrigation efficiency. With the same irrigation amount, a smaller drip flow rate has greater vertical depth of the soil wetted zone than a higher drip flow rate, and a larger drip flow rate results in a wide and shallow wetted zone [21,22]. Zhang et al. reported that a drip flow rate of 1.38 L/h had 59% and 32% less soil matric potential than that of 2.0 and 3.0 L/h at a shallow soil depth (10–40 cm) and 56% and 20% higher soil matric potential than that of 2.0 and 3.0 L/h at a deep soil depth (70 cm), respectively [23]. Naglic et al. reported that higher drip flow rates resulted in extended wetting patterns in the horizontal direction, particularly in fine-textured soils [24]. In this study, the same conclusion was drawn; that is, the vertical infiltration distance was significantly deeper under the drip flow rate of 1.3 L/h than under that of 2.0 L/h, reaching a depth of 40 and 60 cm in the soil layer during wet and normal years, respectively.
The drip irrigation layout is crucial for determining the drip pipe investment; moreover, it influences irrigation water distribution in the root zone, further influencing yield. One drip tape serving for each crop row is used for greenhouse vegetables [25,26], and for wheat and maize in field [27]. Meanwhile, the practice of one drip tape servicing for two crop rows is also used in greenhouses for growing tomato and muskmelon and for maize on fields [28]. Guo et al. reported that with the same irrigation amount, one drip tape serving for two crop rows achieved higher yields and irrigation WUE than one drip tape serving for each crop row [9]. In our study, the maximum vertical and horizontal water transport distances were higher for one tape serving for two crop rows (N) (38–60 cm) than for one tape serving for each crop row (E) (36–44 cm), indicating that N treatment is more conducive for soil water diffusion and water absorption by roots.
Irrigation and fertilization under different rainfall patterns lead to differences in initial moisture content in soil due to differences in rainfall. The difference in initial moisture content can affect the water transport distance and distribution in the soil. Previous studies reported that different initial soil moisture contents have different effects on soil wetting pattern [24]. Skaggs et al. reported that in shallow subsurface drip irrigation systems, higher initial soil moisture content increased water spreading [29]. This well explained our results that the horizontal diffusion distance of soil water was higher in 2020 than in 2021.

4.2. Effects of Different Drip Tape Layout and Flow Rate on Soil Available Nitrogen Distribution and Residue

Maize predominantly uses and assimilates NO3-N and NH4+-N present in soil, and the concentration of these nutrients in the soil serves as an effective indicator of the soil’s capacity to supply nitrogen [30]. The optimal management of irrigation water through drip fertigation ensured an adequate nutrient supply for the growth and development of maize [8]. In our study, the maximum soil NO3-N and soil NH4+-N transport distance was greater under NL treatment than under other treatments in both horizontal and vertical infiltration distances. The wider and deeper infiltration of nitrogen into the root zone would encourage the maize roots to stretch to a wider and deeper soil profile, further facilitating the uptake of nutrients and ultimately increasing yield. In addition, soil nitrogen storage affects DMA and yield formation [31]. This well explained why NL treatment exhibited relatively higher DMA and yield.
The results of this study indicate that the distribution range of NO3-N and NH4+-N in soil after irrigation and fertilization is similar to the distribution of soil water. The N distribution in soil was highly correlated with soil water distribution and N acquisition by plant roots [32]. He et al. reported that soil N distribution was consistent with soil water distribution [33]. This consistency may be more conducive to the uptake of water and nutrients by roots. In addition, significant differences were observed between two years in terms of soil NO3-N and NH4+-N concentrations in the wetted soil volume. Soil NO3-N concentration was higher in 2021 than in 2020, whereas soil NH4+-N concentration exhibited the opposite trend. This may be attributed to soil moisture content, oxygen content, and other soil conditions [34].
Soil nitrate plays a critical role in crop growth. However, after harvest, nitrate can accumulate as NO3-N, which can leach into groundwater and threaten cropland ecosystems [6]. The growth of crops gradually reduces soil NO3-N as plants accumulate nitrogen [35]. In this study, soil NO3-N residue decreased below the root zone under NL treatment compared with other treatments. For all treatments, although the residual amount of soil NO3-N was relatively higher in 2020, it was mainly distributed in the 0–40 cm soil layer. This indicated lower probability of nitrogen leaching. This was consistent with the results of Yan et al., who reported that most soil NO3-N that remained above the 40 cm layer under drip irrigation can minimize the potential of nitrate leaching [36]. Hence, the use of an optimal drip irrigation system helped in minimize nitrogen leaching beyond the root zone and saved irrigation water.

4.3. Effects of Different Drip Tape Layouts and Drip Emitter Flow Rates on Maize Yield, Irrigation WUE, and PFP

Maize grain yield was significantly affected by drip tape layout and drip flow rate. Under NL treatment, two-year maize yield increased by 11.09%, 13.47%, and 8.66% on average, compared with NH, EH, and EL treatments, respectively. The notable enhancements in maize grain yields under NL treatment can be primarily attributed to the augmentation of yield components, specifically the increase in kernels per ear. This finding is consistent with the results of Wang et al., who reported that the impact of various irrigation methods on grain yield is mediated by the coordination of yield components [37]. Another reason for increased yield under NL treatment might be the increased aboveground DMA at post-anthesis, which is conducive to coordinating formation of grain yield. This was consistent with the study by Wang et al., who reported that DMA after silking is the key to increase maize yield and WUE [38].
In both years, under the same drip tape layout, the grain yield under L treatment was higher than that under H treatment. This is consistent with the study by Zhang et al., who reported that appropriate drip flow rate is critical to obtain high yield [23]. Under the same drip flow rate, higher yield was obtained under N treatment than under E treatment. This is conditionally consistent with the study by Guo et al., who reported that the drip irrigation pattern, such as one drip line for two plant rows can significantly increase tomato yield [9]. Therefore, our results demonstrate that varying drip irrigation patterns can result in distinct soil water and nitrogen distributions within the root zone, consequently influencing the uptake of water and nutrients by plants and ultimately resulting in varying grain yields.
In addition, NL treatment exhibited the highest water use efficiency (WUE) and nitrogen fertilizer productivity (PFPN). WUE is the key indicator of balance between crop water demand and artificial water input in irrigation management [39]. It is closely related to maize yield and water consumption, and is an important indicator to measure whether the water absorbed by maize from the soil is fully utilized [16]. Namely, less irrigation usually benefits WUE, but with a negative effect on yield [40,41,42]. In our study, the gap in WUE between the two years was obvious. The water use efficiency in 2021 is significantly higher than that in 2020. This is because higher yield in 2020 with more precipitation led to higher water consumption and lower WUE. Guo et al. reported that with the same irrigation amount, one drip tape serving for two crop rows achieved higher irrigation WUE than one drip tape serving for each crop row [9]. In our research, WUE under NL treatment was the highest. One possible explanation for this phenomenon is that the NL treatment could enhance the distribution of water in both horizontal and vertical directions, thereby facilitating its complete absorption and utilization by the root system.
The improvement in PEPN of maize under NL treatment was also attributed to increase in yield. This could be because NL treatment promoted N transport in soil, increasing N availability to plants and eventually resulting in an increase in PFPN. A similar trend was observed in terms of the residual amount of nitrate nitrogen under NL treatment; the residual amount of nitrate nitrogen was significantly reduced under NL treatment compared with other treatments. In summary, NL treatment created an environment with high soil nutrient availability for promoting grain yield.

5. Conclusions

Two-year field experiments demonstrated that soil water and nitrogen transport and yield of summer maize were affected by drip tape layout and drip emitter flow rate. After surface drip fertigation, the wetting pattern in each treatment was similar to ellipsoid. Under the same drip tape layout, the lower was the drip flow rate, the more upright was the shape of wetted soil volume. The maximum soil available nitrogen distribution was higher under L treatment than under H treatment (Figure 8A). Under the same drip flow rate, N treatment exhibited a higher soil wetting pattern and vertical and horizontal nitrogen transport distance than E treatment (Figure 8B). Among the four treatments, NL treatment with one drip tape serving for two rows and 1.3 L/h flow rate exhibited the highest soil wetting pattern, nitrogen transport distance, grain yield, WUE, and nitrogen fertilizer productivity.

Author Contributions

Conceptualization, Q.S., W.J. and X.S.; methodology, H.Z.; software, X.L.; validation, Z.Z. and Z.L.; formal analysis, H.Z. and P.Z.; investigation, Q.S., H.Z. and X.L.; data curation, X.S.; writing—original draft preparation, Q.S.; writing—review and editing, X.S. and W.J.; visualization, Q.S. and W.J.; supervision, H.Z.; project administration, S.L.; funding acquisition, W.J. and X.S. All authors have read and agreed to the published version of the manuscript.

Funding

This research was funded by the Shandong Modern Agricultural Industrial Technology System Construction Fund, grant number SAIT-02-06, Key Research and Development Program in Shandong Province, grant number 2018GNC2309, and Qingdao Agricultural University High-level Talents Research Foundation (663/1119019).

Data Availability Statement

All data will be made available on request to the correspondent author’s email with appropriate justification.

Conflicts of Interest

The authors declare no conflict of interest.

References

  1. Wu, J.-Z.; Zhang, J.; Ge, Z.-M.; Xing, L.-W.; Han, S.-Q.; Shen, C.; Kong, F.-T. Impact of climate change on maize yield in China from 1979 to 2016. J. Integr. Agric. 2021, 20, 289–299. [Google Scholar] [CrossRef]
  2. Xing, N.; Zhang, Y.; Wang, L. The Study on Dryland Agriculture in North China; Chinese Agriculture Press: Beijing, China, 2001. [Google Scholar]
  3. Matson, P.A.; Naylor, R.; Ortiz-Monasterio, I. Integration of environmental, agronomic, and economic aspects of fertilizer management. Science 1998, 280, 112–115. [Google Scholar] [CrossRef] [PubMed]
  4. Siyal, A.A.; Bristow, K.L.; Šimůnek, J. Minimizing nitrogen leaching from furrow irrigation through novel fertilizer placement and soil surface management strategies. Agric. Water Manag. 2012, 115, 242–251. [Google Scholar] [CrossRef]
  5. Bai, S.; Kang, Y.; Wan, S. Drip fertigation regimes for winter wheat in the North China Plain. Agric. Water Manag. 2020, 228, 105885. [Google Scholar] [CrossRef]
  6. Xu, S.; Wei, Y.; Laghari, A.H.; Yang, X.; Wang, T. Modelling effect of different irrigation methods on spring maize yield, water and nitrogen use efficiencies in the North China Plain. Math Biosci Eng 2021, 18, 9651–9668. [Google Scholar] [CrossRef] [PubMed]
  7. Li, H.; Mei, X.; Wang, J.; Huang, F.; Hao, W.; Li, B. Drip fertigation significantly increased crop yield, water productivity and nitrogen use efficiency with respect to traditional irrigation and fertilization practices: A meta-analysis in China. Agric. Water Manag. 2021, 244, 106534. [Google Scholar] [CrossRef]
  8. Wu, D.; Xu, X.; Chen, Y.; Shao, H.; Sokolowski, E.; Mi, G. Effect of different drip fertigation methods on maize yield, nutrient and water productivity in two-soils in Northeast China. Agric. Water Manag. 2019, 213, 200–211. [Google Scholar] [CrossRef]
  9. Guo, L.; Cao, H.; Helgason, W.D.; Yang, H.; Wu, X.; Li, H. Effect of drip-line layout and irrigation amount on yield, irrigation water use efficiency, and quality of short-season tomato in Northwest China. Agric. Water Manag. 2022, 270, 107731. [Google Scholar] [CrossRef]
  10. Wang, H.; Cao, H.; Jiang, F.; Wang, X.; Gao, Y. Analysis of Soil Moisture, Temperature, and Salinity in Cotton Field under Non-Mulched Drip Irrigation in South Xinjiang. Agriculture 2022, 12, 1589. [Google Scholar] [CrossRef]
  11. Elmaloglou, S.; Soulis, K.X.; Dercas, N. Simulation of Soil Water Dynamics Under Surface Drip Irrigation from Equidistant Line Sources. Water Resour. Manag. 2013, 27, 4131–4148. [Google Scholar] [CrossRef]
  12. Hou, Y.; Li, Q.; Kong, L.; Qin, Y.; Wang, M.; Yu, L.; Wang, L.; Yin, C. Effects of different slow/controlled release nitrogen fertilizers on spring maize nitrogen uptake and utilization, soil inorganic nitrogen and nitrogen balance. Sci. Agric. Sin 2018, 51, 3928–3940. [Google Scholar]
  13. Wang, H.; Wang, X.; Zhao, S. Distribution of soil water and nitrate in Lou soil under drip fertigation. Acta Agric. Boreali-Occident. Sin. 2008, 17, 309–314. [Google Scholar]
  14. Zhang, M.-m.; Dang, P.-f.; Li, Y.-z.; Qin, X.-l.; Siddique, K.H.M. Better tillage selection before ridge—Furrow film mulch can facilitate root proliferation, and increase nitrogen accumulation, translocation and grain yield of maize in a semiarid area. J. Integr. Agric. 2023, 22, 1658–1670. [Google Scholar] [CrossRef]
  15. Bandyopadhyay, K.K.; Misra, A.K.; Ghosh, P.K.; Hati, K.M.; Mandal, K.G.; Moahnty, M. Effect of irrigation and nitrogen application methods on input use efficiency of wheat under limited water supply in a Vertisol of Central India. Irrig. Sci. 2009, 28, 285–299. [Google Scholar] [CrossRef]
  16. Irmak, S.; Djaman, K.; Rudnick, D.R. Effect of full and limited irrigation amount and frequency on subsurface drip-irrigated maize evapotranspiration, yield, water use efficiency and yield response factors. Irrig. Sci. 2016, 34, 271–286. [Google Scholar] [CrossRef]
  17. Ma, S.; Tong, L.; Kang, S.; Wang, S.; Wu, X.; Cheng, X.; Li, Q. Optimal coupling combinations between dripper discharge and irrigation interval of maize for seed production under plastic film-mulched drip irrigation in an arid region. Irrig. Sci. 2021, 40, 177–189. [Google Scholar] [CrossRef]
  18. Elmaloglou, S.T.; Malamos, N. Estimation of Width and Depth of the Wetted Soil Volume Under a Surface Emitter, Considering Root Water-Uptake and Evaporation. Water Resour. Manag. 2006, 21, 1325–1340. [Google Scholar] [CrossRef]
  19. Guo, S.; Zhu, H.; Dang, T.; Wu, J.; Liu, W.; Hao, M.; Li, Y.; Syers, J.K. Winter wheat grain yield associated with precipitation distribution under long-term nitrogen fertilization in the semiarid Loess Plateau in China. Geoderma 2012, 189–190, 442–450. [Google Scholar] [CrossRef]
  20. Kilic, M. A new analytical method for estimating the 3D volumetric wetting pattern under drip irrigation system. Agric. Water Manag. 2020, 228, 105898. [Google Scholar] [CrossRef]
  21. Li, M.; Kang, S.; Sun, H. Relationships between dripper discharge and soil wetting pattern for drip irrigation. Trans. Chin. Soc. Agric. Eng. 2006, 22, 32–35. [Google Scholar]
  22. Elmaloglou, S.; Diamantopoulos, E. Soil water dynamics under surface trickle irrigation as affected by soil hydraulic properties, discharge rate, dripper spacing and irrigation duration. Irrig. Drain. 2009, 59, 254–263. [Google Scholar] [CrossRef]
  23. Zhang, Y.; Feng, S.; Wang, F.; Feng, R.; Nie, W. Effects of drip discharge flux and soil wetted percentage on drip irrigated potato growth with film mulch. Agric. Water Manag. 2022, 272, 107847. [Google Scholar] [CrossRef]
  24. Naglič, B.; Kechavarzi, C.; Coulon, F.; Pintar, M. Numerical investigation of the influence of texture, surface drip emitter discharge rate and initial soil moisture condition on wetting pattern size. Irrig. Sci. 2014, 32, 421–436. [Google Scholar] [CrossRef]
  25. Kuscu, H.; Turhan, A.; Ozmen, N.; Aydinol, P.; Demir, A.O. Optimizing levels of water and nitrogen applied through drip irrigation for yield, quality, and water productivity of processing tomato (Lycopersicon esculentum Mill.). Hortic. Environ. Biotechnol. 2014, 55, 103–114. [Google Scholar] [CrossRef]
  26. Li, Y.-J.; Yuan, B.-Z.; Bie, Z.-L.; Kang, Y. Effect of drip irrigation criteria on yield and quality of muskmelon grown in greenhouse conditions. Agric. Water Manag. 2012, 109, 30–35. [Google Scholar] [CrossRef]
  27. Firouzabadi, A.G.; Baghani, J.; Jovzi, M.; Albaji, M. Effects of wheat row spacing layout and drip tape spacing on yield and water productivity in sandy clay loam soil in a semi-arid region. Agric. Water Manag. 2021, 251, 106868. [Google Scholar] [CrossRef]
  28. Zheng, J.; Huang, G.; Jia, D.; Wang, J.; Mota, M.; Pereira, L.S.; Huang, Q.; Xu, X.; Liu, H. Responses of drip irrigated tomato (Solanum lycopersicum L.) yield, quality and water productivity to various soil matric potential thresholds in an arid region of Northwest China. Agric. Water Manag. 2013, 129, 181–193. [Google Scholar] [CrossRef]
  29. Skaggs, T.H.; Trout, T.J.; Rothfuss, Y. Drip Irrigation Water Distribution Patterns: Effects of Emitter Rate, Pulsing, and Antecedent Water. Soil Sci. Soc. Am. J. 2010, 74, 1886–1896. [Google Scholar] [CrossRef]
  30. Cheng, Y.; Zhang, T.; Hu, X.; Liu, Z.; Liang, Q.; Yan, S.; Feng, H.; Siddique, K.H.M. Drip fertigation triggered by soil matric potential reduces residual soil nitrate content and improves maize nitrogen uptake and yield stability in an arid area. Eur. J. Agron. 2023, 150, 126932. [Google Scholar] [CrossRef]
  31. Dai, Z.; Hu, J.; Fan, J.; Fu, W.; Wang, H.; Hao, M. No-tillage with mulching improves maize yield in dryland farming through regulating soil temperature, water and nitrate-N. Agric. Ecosyst. Environ. 2021, 309, 107288. [Google Scholar] [CrossRef]
  32. Jungk, A. Root hairs and the acquisition of plant nutrients from soil. J. Plant Nutr. Soil Sci. 2001, 164, 121–129. [Google Scholar] [CrossRef]
  33. He, Y.; Xi, B.; Li, G.; Wang, Y.; Jia, L.; Zhao, D. Influence of drip irrigation, nitrogen fertigation, and precipitation on soil water and nitrogen distribution, tree seasonal growth and nitrogen uptake in young triploid poplar (Populus tomentosa) plantations. Agric. Water Manag. 2021, 243, 106460. [Google Scholar] [CrossRef]
  34. Galloway, J.N.; Townsend, A.R.; Erisman, J.W.; Bekunda, M.; Cai, Z.; Freney, J.R.; Martinelli, L.A.; Seitzinger, S.P.; Sutton, M.A. Transformation of the nitrogen cycle: Recent trends, questions, and potential solutions. Science 2008, 320, 889–892. [Google Scholar] [CrossRef] [PubMed]
  35. Quan, H.; Wu, L.; Ding, D.; Yang, Z.; Wang, N.; Chen, G.; Li, C.; Dong, Q.G.; Feng, H.; Zhang, T.; et al. Interaction between soil water and fertilizer utilization on maize under plastic mulching in an arid irrigation region of China. Agric. Water Manag. 2022, 265, 107494. [Google Scholar] [CrossRef]
  36. Yan, S.; Wu, Y.; Fan, J.; Zhang, F.; Paw, U.K.T.; Zheng, J.; Qiang, S.; Guo, J.; Zou, H.; Xiang, Y.; et al. A sustainable strategy of managing irrigation based on water productivity and residual soil nitrate in a no-tillage maize system. J. Clean. Prod. 2020, 262, 121279. [Google Scholar] [CrossRef]
  37. Wang, D.; Yu, Z.; White, P.J. The effect of supplemental irrigation after jointing on leaf senescence and grain filling in wheat. Field Crops Res. 2013, 151, 35–44. [Google Scholar] [CrossRef]
  38. Wang, F.; Xie, R.; Ming, B.; Wang, K.; Hou, P.; Chen, J.; Liu, G.; Zhang, G.; Xue, J.; Li, S. Dry matter accumulation after silking and kernel weight are the key factors for increasing maize yield and water use efficiency. Agric. Water Manag. 2021, 254, 106938. [Google Scholar] [CrossRef]
  39. Wan, W.; Zhao, Y.; Wang, Z.; Li, L.; Jing, J.; Lv, Z.; Diao, M.; Li, W.; Jiang, G.; Wang, X.; et al. Mitigation fluctuations of inter-row water use efficiency of spring wheat via narrowing row space in enlarged lateral space drip irrigation systems. Agric. Water Manag. 2022, 274, 107958. [Google Scholar] [CrossRef]
  40. Abbate, P.E.; Dardanelli, J.L.; Cantarero, M.G.; Maturano, M.; Melchiori, R.J.M.; Suero, E.E. Climatic and Water Availability Effects on Water-Use Efficiency in Wheat. Crop Sci. 2004, 44, 474–483. [Google Scholar] [CrossRef]
  41. Si, Z.; Zain, M.; Mehmood, F.; Wang, G.; Gao, Y.; Duan, A. Effects of nitrogen application rate and irrigation regime on growth, yield, and water-nitrogen use efficiency of drip-irrigated winter wheat in the North China Plain. Agric. Water Manag. 2020, 231, 106002. [Google Scholar] [CrossRef]
  42. Chen, R.; Cheng, W.; Cui, J.; Liao, J.; Fan, H.; Zheng, Z.; Ma, F. Lateral spacing in drip-irrigated wheat: The effects on soil moisture, yield, and water use efficiency. Field Crops Res. 2015, 179, 52–62. [Google Scholar] [CrossRef]
Figure 1. The drip tape layout and soil sampling positions in the field experiment. (a) One tape serving for two crop rows; (b) one tape serving for each crop row.
Agronomy 13 02689 g001
Figure 2. Daily precipitation during the maize growth seasons in 2020 (A) and 2021 (B). Maize was planted on 21 June in both experimental years, and harvested on 15 October in 2020 and 3 October in 2021.
Agronomy 13 02689 g002
Figure 3. Effects of drip tape layout and drip emitter flow rate on water distribution of wetted soil volume at R1 in 2020 and 2021. The water distribution of wetted soil volume at R1 in 2020 before drip irrigation (A) and after drip irrigation (B). The water distribution of wetted soil volume at R1 in 2021 before drip irrigation (C) and after drip irrigation (D).
Agronomy 13 02689 g003
Figure 4. Effects of drip tape layout and drip emitter flow rate on nitrate distribution in 2020 and 2021. The nitrate distribution at R1 in 2020 before drip irrigation (A) and after drip irrigation (B). The nitrate distribution at R1 in 2021 before drip irrigation (C) and after drip irrigation (D).
Agronomy 13 02689 g004
Figure 5. Effect of drip tape layout pattern and drip emitter flow rate on ammonium nitrate distribution in 2020 and 2021. The ammonium nitrate distribution at R1 in 2020 before drip irrigation (A) and after drip irrigation (B). The ammonium nitrate distribution at R1 in 2021 before drip irrigation (C) and after drip irrigation (D).
Agronomy 13 02689 g005
Figure 6. Effect of drip tape layout and drip emitter flow rate on residual amount of inorganic nitrogen. The residual amount of nitrate nitrogen in 2020 (A) and 2021 (B). The residual amount of ammonium nitrogen in 2020 (C) and 2021 (D).
Agronomy 13 02689 g006
Figure 7. Effect of drip tape layout and drip emitter flow rate on dry matter accumulation (DMA) at pre-anthesis and after-anthesis and total DMA. DMA in 2020 (A) and 2021 (B). The letters indicated that the comparisons among four treatments in each stage and the total.
Agronomy 13 02689 g007
Figure 8. A conceptual paradigm explaining the effects of drip tape layout and drip emitter flow rate on soil water and nitrogen distribution while cultivating summer maize. The low (L) and high (H) drip flow rate under the same drip tape layout (A) and one tape serving for two crop rows (N) and one tape serving for each crop row (E) under the same drip flow rate (B).
Agronomy 13 02689 g008
Table 1. Treatments of drip irrigation.
TreatmentsDrip Tape LayoutDrip Flow Rate
NHone tape serving for two crop rows (40 + 80 cm)2.0 L/h
NLone tape serving for two crop rows (40 + 80 cm)1.3 L/h
EHone tape serving for each crop row (60 cm)2.0 L/h
ELone tape serving for each crop row (60 cm)1.3 L/h
Table 2. Meteorological index of summer maize at various growth stages.
Meteorological IndexYearGrowth Stage of Summer Maize
Pre-V12V12-R1R1-R6
Maximum temperature (°C)202034.432.234.0
202134.833.732.8
Minimum temperature (°C)202016.321.58.4
202118.021.118.2
Active accumulated tem-perature ≥10 °C(°C d) 20201170.3208.71281.2
20211208.4207.61122.2
Total rainfall (mm)2020420.156.9170.2
2021312.735.864.2
Table 3. Effects of drip tape layout and drip emitter flow rate on the yield and yield components of maize.
YearsTreatmentsEars Number (×104 ha−1)Kernels Number per Ear1000−Grain Weight (g)Yield
(kg ha−1)
2020NH6.85 a500 b339 a11,395 b
NL6.88 a539 a348 a12,968 a
EH6.83 a496 b333 a11,038 b
EL6.86 a499 b347 a11,807 b
2021NH6.86 a509 ab269 a8529 b
NL6.92 a525 a278 a9244 a
EH6.90 a502 ab274 a8446 b
EL6.86 a495 b276 a8600 b
Note: Different letters in the same column means the significant difference between treatments at p < 0.05 level.
Table 4. Effects of drip tape layout and drip emitter discharge rate on water use efficiency and nitrogen fertilizer partial productivity of maize under drip irrigation.
YearsTreatmentsWUE
[kg (mm−1·ha−1)]
PFPN (kg kg−1)
2020NH19.95 b75.97 b
NL22.70 a86.45 a
EH19.32 b73.59 b
EL20.67 b78.71 b
2021NH25.33 b56.86 b
NL27.46 a61.63 a
EH25.09 b56.31 b
EL25.54 b57.33 b
Note: Different letters in the same column means the significant difference between treatments at p < 0.05 level.
Disclaimer/Publisher’s Note: The statements, opinions and data contained in all publications are solely those of the individual author(s) and contributor(s) and not of MDPI and/or the editor(s). MDPI and/or the editor(s) disclaim responsibility for any injury to people or property resulting from any ideas, methods, instructions or products referred to in the content.

