Article

Efforts to Stimulate Morpho-Physio-Biochemical Traits of Maize for Efficient Production under Drought Stress in Tropics Field

by
Md. Samim Hossain Molla
1,2,
Orawan Kumdee
3,
Nattaporn Worathongchai
4,
Phanuphong Khongchiu
5,
M. Akkas Ali
6,
Md. Mazharul Anwar
2,
Arunee Wongkaew
1 and
Sutkhet Nakasathien
1,*
1
Department of Agronomy, Faculty of Agriculture, Kasetsart University, Bangkok 10900, Thailand
2
On-farm Research Division, Bangladesh Agricultural Research Institute, Gazipur 1701, Bangladesh
3
Agricultural Research and Technology Transfer Center, Faculty of Agriculture, Kasetsart University, Bangkok 10900, Thailand
4
National Corn and Sorghum Research Center, Faculty of Agriculture, Kasetsart University, Nakhon Ratchasima 30320, Thailand
5
Expert Center of Innovative Agriculture, Thailand Institute of Scientific and Technological Research, Pathum Thani 12120, Thailand
6
Crops & Natural Resources, Krishi Gobeshona Foundation, Dhaka 1215, Bangladesh
*
Author to whom correspondence should be addressed.
Agronomy 2023, 13(11), 2673; https://doi.org/10.3390/agronomy13112673
Submission received: 2 October 2023 / Revised: 17 October 2023 / Accepted: 20 October 2023 / Published: 24 October 2023

Abstract

:
Maize, a major food source for the world’s tropical regions, is often impaired by droughts under a changing climate, which creates the importance of making efforts to improve the tolerance characteristics of maize under field conditions. The experiment was conducted during the dry season of the 2020–2021 period to investigate the stimulatory effects of plant growth regulator (PGR) ethephon (2-chloroethylphosphonic acid) on the morpho-physio-biochemical traits of maize and to identify suitable application approaches for efficient production under water stress. The factorial randomized complete block design was followed for the present experiment. Ethephon was applied at the vegetative 6 leaves (V6) and/or 10 leaves (V10) stages. Seven application approaches (doses in g a.i. ha−1) of ethephon, i.e., 281 at the V6 stage (E1), 281 at the V6 stage + 281 at the V10 stage (E2), 281 at the V10 stage (E3), 562 at the V6 stage (E4), 562 at the V6 stage + 562 at the V10 stage (E5), 562 at the V10 stage (E6), and no ethephon (E7), were used for maize production. Another factor was that three water levels were used, i.e., well-watered conditions (watering every week) (W1), short water stress (no watering during 48–69 days after planting) (W2), and prolonged water stress (no watering during 48–83 days after planting) (W3). Water stress negatively affected most of the morpho-physiological traits, and in W2 and W3 conditions, the grain yield was significantly lower, i.e., 4.82 and 4.27 t ha−1, respectively, compared to W1 (5.71 t ha−1). The plant height and leaf area index at the reproductive milk stage of maize (R3) were significantly reduced by all approaches of ethephon application compared to no ethephon. However, across the water levels, E3 performed better and produced a higher grain yield (5.11 t ha−1), which was mostly seen by a higher 100-grain weight (24.52 g) and a slightly higher grain number per plant (356.12). It was also positively supported by most of the physiological and biochemical traits, as they were especially higher in the relative growth rate (25.73 mg plant−1 day−1), net assimilation rate (0.79 mg cm−2 day−1) at V6-R3, heat use efficiency (3.39 kg ha−1 °C days−1), electrolyte leakage (5.69%), and proline (28.78 µmol g−1 FW). These traits, under prolonged stress, also gave the maximum drought tolerance index by E3, i.e., the relative growth rate (1.00) and net assimilation rate (1.00) at V6 to R3, heat use efficiency (1.06), relative water content (1.00), electrolyte leakage (1.65), proline (1.88), 100-grain weight (1.01), grain yield (1.11), and water productivity (1.53). A path analysis showed that the shoot weight at R3 (1.00), the stem diameter at the R3 stage (1.00), net assimilation rate (0.95), relative water content (0.95), 100-grain weight (0.90), grain number (0.76), proline (0.75), SPAD value (0.71), and total soluble sugar (0.57) were highly positive, and electrolyte leakage (−0.84) was negatively correlated with the grain yield under prolonged water stress. The maximum positive direct effect on the grain yield was found in the shoot weight (1.05), net assimilation rate (0.68), leaf area index at R3 (0.45), SPAD (0.22), and electrolyte leakage (0.21). The ethephon application as the E3 approach was more efficient in both short and prolonged stress, especially under prolonged stress, as it showed a higher energy use efficiency (1.55) and less CO2-eq emission (3603.69) compared to the other approaches of ethephon. The subsequent efficient ethephon approaches were E1 under short water stress, E6 under prolonged water stress, where E5 performed minimally, and no application of ethephon, which exhibited the worst efficiency under water stress.

1. Introduction

Droughts are the greatest threat to crops and livestock in almost every region of the world [1,2], affecting an estimated 55 million people yearly. About 40% of the world’s population suffers from water scarcity, and by 2030, 700 million people could be at risk of being displaced due to droughts [3]. Rapid climate change impacts the rainfall intensity and amounts [4] and increases temperatures, which accelerates water evaporation and raises the risk of a drought or extended periods of droughts, particularly in the tropics [5]. The tropics are the areas of the Earth that are closest to the Equator, between the Tropics of Cancer and Capricorn, and are often hotter [6]. The tropics cover 36% of the planet’s landmass and account for 39.8% of its surface area [7,8]. Tropical countries frequently face droughts due to global climate change, and their effects become more detrimental under warm weather [9]. Southeast Asia, which is under the tropics, has experienced rising temperatures at a pace of 5 percentage points each decade beginning in 1971, with an abrupt rise from 1971 to 2005 [10], leading to an increase in droughts [11]. Due to an increase in the mean annual temperature of up to 0.85 °C and a decline in the mean annual rainfall, Thailand is prone to annual droughts; from 1989 to 2013, 29 of 72 provinces experienced drought-related damage [12,13].
In tropical regions with food insecurity, especially in Asian countries, climate change has threatened agricultural production [14]. Thailand is in the tropics, and its agricultural productivity is particularly vulnerable to climate change [15]. Maize is an important crop that can be used for food, feed, and bioenergy purposes [16]. Maize (Zea mays) is an important economic crop in Thailand [17] and is significantly impacted by droughts, which result in disproportionately high yield declines [18,19,20]. The development and productivity of maize are greatly influenced by drought stress affecting germination, vegetative growth, dry matter production, reproductive development, reproductive processes, grain yield, and grain quality [21,22,23,24,25,26]. The length and severity of the drought stress as well as the phenological stage at which the crop is affected determine how much yield is lost [27,28,29,30,31]. Inadequate accessible soil water affects the maize’s metabolic activity, biomass deposits, and photosynthetic rate by reducing the chlorophyll content in the leaves, subsequently leading to a drop in the maize yield [32,33,34,35,36]. Several studies revealed that proline, the total soluble sugar, root/shoot ratio, relative water contents, etc., are important considerations for the water stress tolerance of maize [37,38,39,40,41,42].
Ethephon, 2-chloroethyl phosphonic acid, is a synthetic bioregulator that positively absorbs and subsequently releases ethylene into plant tissues and is used to control the plant canopy size [43] or as an anti-lodging agent in maize [44,45,46,47,48,49,50]. The leaves are the site of photosynthesis, and they lose water through transpiration. A balanced leaf area is desirable under water stress conditions, which can maintain photosynthesis at a satisfactory level and can minimize water loss through transpiration [51]. Plant growth retardants, on the other hand, could be used to minimize early-season crop water use by lowering the LAI, leading to extended water availability for critical reproductive activities under drought stress [43,51,52,53,54,55,56].
Ethylene signaling regulates plant growth and development by increasing N assimilation [57,58] and senescence-dependent N mobilization [59,60] and by regulating proline production in plants under optimum or stress conditions [57,61]. Sugars have been identified as important regulatory molecules of source activity and sink strength in the context of a changing source–sink balance [62,63,64,65]. Evidence suggests that ethylene signaling plays an essential role in a plant’s response to drought stress [52,56,66,67,68]. Consequently, it is crucial to investigate if ethephon can improve drought resistance in the maize output.
The precise amount of water needed to efficiently reach the target soil moisture level is delivered during irrigation scheduling to maximize the field output. This approach conserves water and energy and reduces the environmental impacts, including fertilizer loss and energy consumption, resulting in benefits such as lower CO2 emissions, enhanced biodiversity, and reduced pollution [69,70,71]. The apparent sensitivity of the atmospheric CO2 growth rate to tropical warmth and droughts has changed significantly over the past six decades [72], and the drought associated with the severe El Nino event from 2015 to 2016 shifted tropical regions from a carbon sink to a carbon source [73,74,75,76]. Furthermore, agriculture is a major source of greenhouse gas (GHG) emissions; thus, it is critical to utilize agricultural techniques that emit fewer GHGs, lowering the carbon footprint and ultimately delaying climate change [71,77,78,79].
Considering that agriculture depends on the environment and, consequently, is susceptible to climate change, it is essential to find solutions for this sector to adapt to the changing climate [80], especially droughts. Plant growth regulators may positively affect the stress-tolerant characteristics of maize, and they may vary depending on the application frequency and concentration and the stage of plant development. It is important to determine the best application stage of the plant and dose of growth regulators to enhance the desirable stress-tolerant characteristics in maize. Therefore, the present study was undertaken at the field level to stimulate the water-stress-tolerant morpho-physio-biochemical traits of maize using suitable ethephon application approaches for efficient production under drought stress in the tropics.

2. Materials and Methods

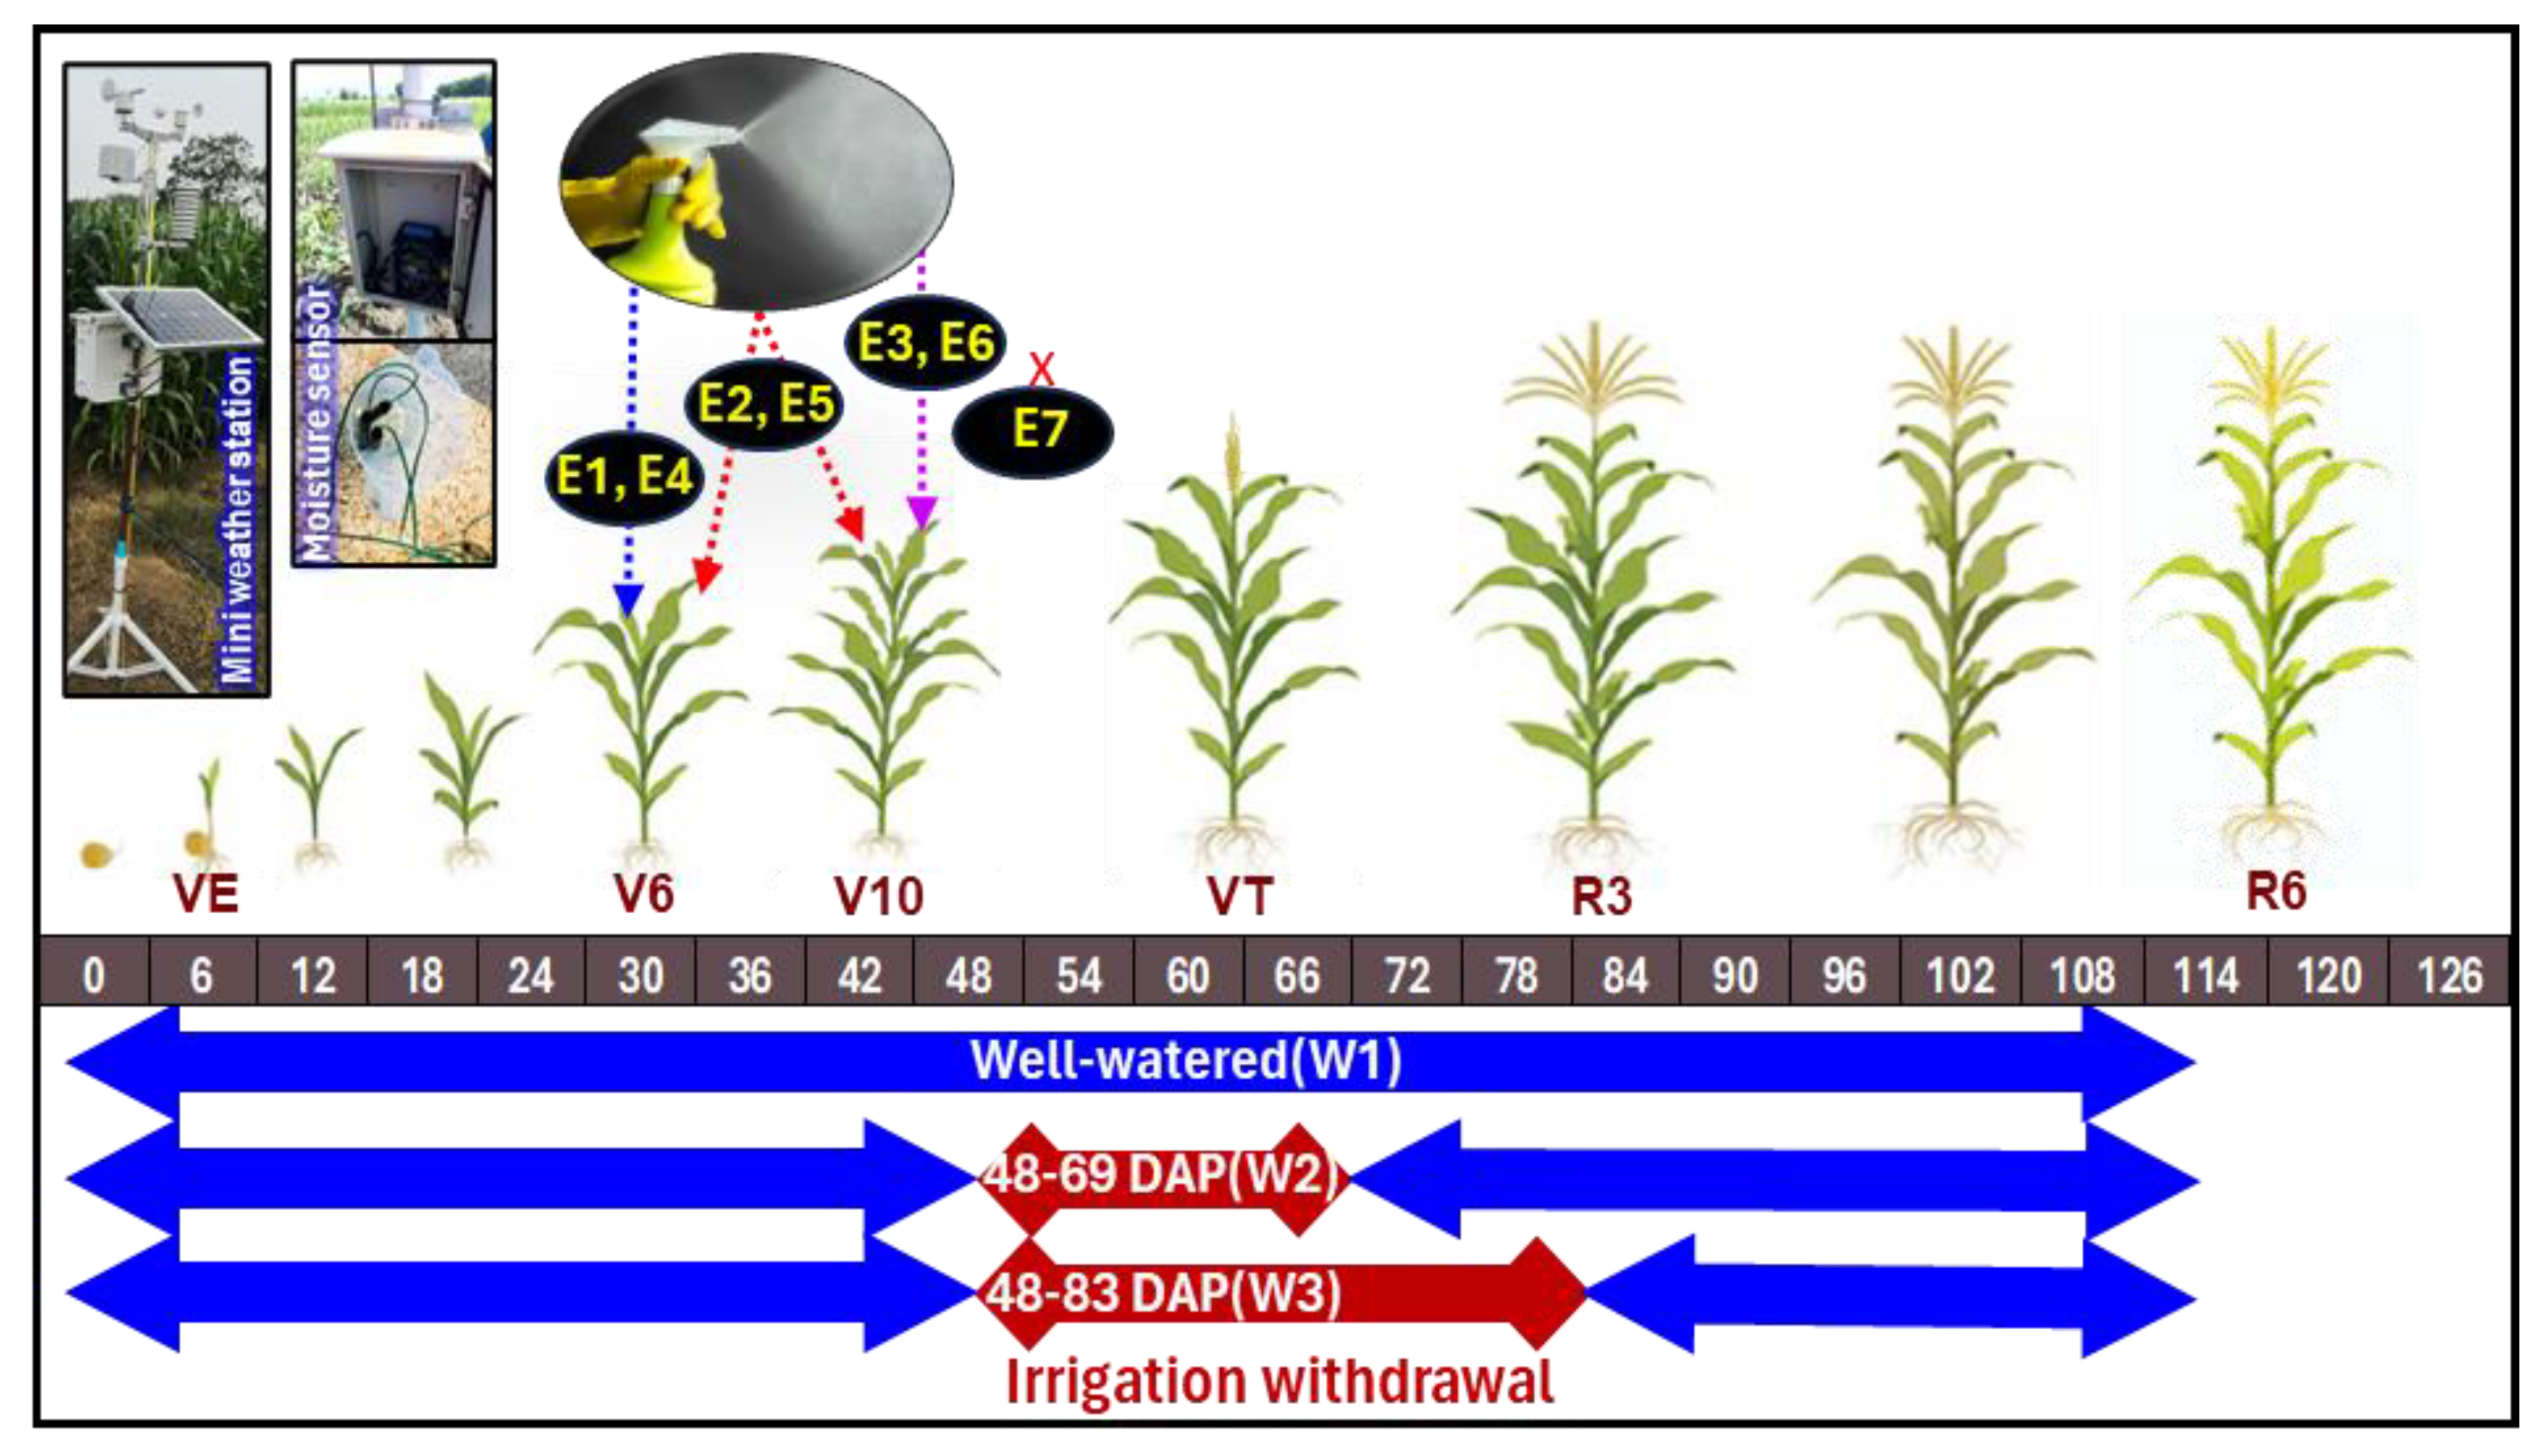
2.1. Experimental Location, Design, Treatments and Materials

The field experiment was conducted in 2020–21 at Saraburi, Thailand (14°51′01.1″ N, 101°25′37.2″ E). The vegetative 6 leaves stage (V6), vegetative 10 leaves stage (V10), vegetative tasseling stage (VT), reproductive milk stage (R3), and physiological maturity stage (R6) of maize were emphasized in data collection. The Randomized Complete Block design with factorial arrangement was used in the study with two factors and four replications. The first factor was three levels of water (W), i.e., W1: well-watered conditions (about 40 mm irrigation every week); W2: short water stress, i.e., irrigation withdrawal from 48 to 69 days after planting (DAP); and W3: prolonged water stress, i.e., irrigation withdrawal from 48 to 83 DAP. Seven ethephon (E) application approaches were the second factor, i.e., E1: ethephon @ 281 g a.i. ha−1 at V6 stage; E2: ethephon @ 281 g a.i. ha−1 at V6 + 281 g a.i. ha−1 at V10 stage; E3: ethephon @ 281 g a.i. ha−1 at V10 stage; E4: ethephon @ 562 g a.i. ha−1 at V6 stage; E5: ethephon @ 562 g a.i. ha−1 at V6 + 562 g a.i. ha−1 at V10 stage; E6: ethephon @ 562 g a.i. ha−1 at V10 stage; and E7: no ethephon (Figure 1). When working with maize and varying doses of ethephon, several investigators [43,52] observed that, in high plant population density situations, 560 g a.i. ha−1 might boost maize production; however, in normal population situations, it dropped. Therefore, in the current investigation, a similar, lower dose was examined with standard plant spacing. Ethephon52 (2-chloroethyl phosphonic acid 52% W/V SL) was used as ethephon treatment. The maize cultivar, ‘SUWAN5819’, developed by the National Corn and Sorghum Research Center, Thailand was used for the field trial. The basal fertilizer was 16:16:16 NPK @ 313 kg ha−1, while the top dressing was 46 N @ 313 kg urea ha−1 at 23 DAP. Each treatment plot size was 7.5 m × 7.5 m, and the plant spacing was 70 cm × 25 cm.

2.2. Meteorological Information of the Experimental Location

The historical long-term (1991–2020) climatic data were retrieved from the World Bank source (Figure S1a). The historical data showed that maximum rainfall occurred in August (271.52 mm), and minimum rainfall occurred in February (16.56 mm). The maximum mean temperature was recorded in April (29.36 °C), the minimum mean temperature was recorded in December (23.9 °C), and the maximum temperature was recorded in April (35.3 °C). In the present study, meteorological data on rainfall, temperature (Temp.), and relative humidity (RH) were collected during the experimental period by installing a mini weather station at the field (Figure S1b). There was little rainfall during the whole experimental period, especially during the water stress period. There was very little rainfall at 23 and 24 days after water withholding, around 13 mm each day. At the end of the maturity stage, there was further little rainfall for a few days, ranging from 0.4 to 25.48 mm per day. The maximum, minimum, and average daily temperatures (°C) ranged from 22.22 to 38.49, 12.22 to 27.22, and 16.83 to 32.44, respectively (Figure S1b).

2.3. Plant Sampling and Different Measurements

Morpho-physio-biochemical data were collected at V6, V10, VT, R3, and R6 stages. Five plants were randomly picked from each treatment plot to obtain destructive data on various attributes at various stages. By hand harvesting, grain yield was obtained from the two mid rows in the center 4 m long section on 5.6 m2 inside each plot. Data were collected on plant height at R3 (PH-R3) from plant base to topmost fully expanded leaf or base of tassel; stem diameter at R3 (SD-R3) from stem base; fully expanded green leaf area at V6, V10, VT, and R3 (FEGLA-V6, FEGLA-V10, FEGLA-VT, and FEGLA-R3) from green portion only; leaf area index at R3 (LAI-R3) from green leaves only; shoot weight at V6, V10, and R3 (SW-V6, SW-V10 and SW-R3); grain number per plant at harvest (GNP); 100-grain weight (100-GW) at harvest; grain yield at harvest (GY); relative growth rate at V6 to V10, V10 to R3, and V6 to R3 (RGR-V6V10, RGR-V10R3, and RGR-V6R3); net assimilation rate at V6 to V10, V10 to R3, and V6 to R3 (NAR-V6V10, NAR-V10R3, and NAR-V6R3); water productivity at harvest (WP); accumulated growing degree days after harvest (AGDD); heat use efficiency after harvest (HUE); SPAD value of ear leaves just after a water stress period (SPAD-JAWSP); relative senescence rate at R3 (RSR-R3); relative water content of ear leaves just after water stress period (RWC-JAWSP); electrolyte leakage of ear leaves just after a water stress period (EL-JAWSP); proline of ear leaves just after a water stress period (PrL-JAWSP); and total soluble sugar of ear leaves just after a water stress period (TSSL-JAWSP).
Leaf greenness was evaluated using SPAD value, which was measured using the Minolta SPAD 502 chlorophyll meter (Minolta, Osaka, Japan). SPAD stands for Soil Plant Analysis Development. A SPAD value is a non-destructive measurement of the relative chlorophyll content of a leaf.
Fully expanded green leaf area (FEGLA) per plant (less than 50% of leaf surface yellow or dead) was computed using the following formula [81]:
F E G L A   cm 2 plant 1 = L e n g t h × m a x i m u m   w i d t h × 0.75
Leaf area index (LAI) was calculated using the following formula, where leaf area is the one-sided green leaf area per unit ground surface area [82]:
L A I = L e a f   a r e a   /   G r o u n d   a r e a  
Relative growth rate (RGR) was determined using the following formula [83]. To determine the dry weight of plants at V6, V10, VT, and R3 stages, five plants were randomly taken from each plot. The plants were dried in an oven at 75 °C for 72 h.
R G R   mg   plant 1 day 1 = L n   W 2 L n   W 1   /   T 2 T 1  
where W1: dry weight of the plant at time T1; W2: dry weight of the plant at time T2; T1 and T2: time interval in days; and Ln: natural logarithm.
Net assimilation rate (NAR) was determined using the following formula [84]:
N A R   m g   cm 2 day 1 = W 2 W 1 T 2 T 1 × L n   L A 2 L n   L A 1 L A 2 L A 1
where W2 and W1 are the plant’s dry biomass weights at times T2 and T1, and LA2 and LA1 are the leaf areas corresponding to times T2 and T1.
Water productivity (WP) was calculated using the following [85]:
W P   k g   ha 1   m 3 = G r a i n   y i e l d   i n   kg   ha 1   /   I r r i g a t i o n   i n   m 3 + R a i n f a l l   i n   m 3
Accumulated growing degree days (AGDD) and heat use efficiency (HUE) was calculated according to [86] as follows:
A G D D   ° C   days = i = 1 n T i T b
H U E   kg   ha 1   ° C   days 1 = G r a i n   y i e l d   i n   kg   ha 1 / A G D D   i n   ° C   days
where i is the ith day after sowing, Ti is the average temperature for that day, n is the number of days in the growing season, and Tb is the base temperature, which was set to 10 °C.
Relative senescence rate (RSR) was determined using the following formula considering green leaf number at VT to R3 stages [87]:
R S R   % = G L N   t 1 G L N   t 2 t 2 t 1 × 2 G L N   t 1 + G L N   t 2
where GLN: green leaf number (<50% yellow), t1: days to VT stage, and t2: days to R3 stage.
Relative water content (RWC) was measured just before the end of the water-stressed period from ear leaves as follows [81]:
R W C   % = F r e s h   w e i g h t D r y   w e i g h t × 100 / T u r g i d   w e i g h t D r y   w e i g h t
Electrolyte leakage (EL) was measured from 0.1 g leaf discs with 20 mL of added de-ionized water and incubated at 32 °C for 2 h, and then the first conductivity measurement was performed (EC1). After autoclaving the sample for 15 min at 121 °C, the second conductivity measurement (EC2) was performed. The percentage of EL was calculated using the following formula [88]:
E L   % = E C 1 E C 2 × 100
Proline content of ear leaf (PrL) was determined following [89]. One gram of fresh sample was crushed with a mortar and pestle and homogenized with 5 mL of 3% sulfosalicylic acid. The homogenate was spun at 6000 rpm for 15 min. A total of 1 mL of supernatant was taken, and 1 mL of ninhydrin and 1 mL of acetic acid were added. This was heated in a water bath for 1 h and then incubated on ice for 5 min. Two milliliters of solution was extracted with two milliliters of toluene and vortexed rapidly. The upper phase was taken, and absorbance was measured at 520 nm with a spectrophotometer. To determine the proline content of the sample, a standard curve was constructed using pure proline.
Total soluble sugar content in leaf (TSSL) was determined following [90]. In a mortar, 0.5 g of fresh material was crushed, and 5 mL of 80% ethanol was added. The mixture was filtered using Wathman No.1 filter paper. The solution was combined with 12.5 cc of 80% ethanol. One milliliter of solution was taken, and one milliliter of anthrone was added. The mixture was heated for 10 min at 100 °C. After 5 min on ice, the response was stopped. A spectrophotometer set at 620 nm was used to measure the total soluble sugar content. The total soluble sugar content was calculated using a standard curve.
Drought Tolerance Index (DTI) was calculated [91] as follows:
D T I = y s × y p Y p 2
where ys, yp, and Yp denote the mean performance of the examined trait under water stress conditions for each ethephon level, the normal conditions for each ethephon level, and the overall mean under normal conditions for all ethephon levels, respectively. When the DTI is ≥1.0, the ethephon level is significant for stimulating the tolerance; when the DTI is <1, the ethephon level is nonsignificant for stimulating the tolerance.
The energy use efficiency was computed based on the energy equivalents of the inputs and outputs (Table S1) according to [71]. The energy approach is based on converting all production components and products utilized in the maize production process into energy units.
The CO2-eq emission was calculated while considering the CO2-eq emissions derived directly from crop management practices, materials, and machinery inputs. The total sum of the maize CO2-eq emission was calculated by following [92]:
C O 2 e q   e m i s s i o n = S U M   I R × C E
where IR denotes the input ratio and CE denotes the CO2-eq emission coefficient for each input (kg CO2-eq kg−1) (Table S2).

2.4. Statistical Analysis

ANOVA was used to analyze different data for a factorial Randomized Complete Block design. At p = 0.05, the mean values were compared using the Fisher’s Protected Least Significant Difference (LSD) approach. For analysis, the statistical tool, SPSS, for Windows, Version 16.0. (SPSS Inc., Chicago, IL, USA), MS Excel, and CropStat 7.2 were used. Path analysis was performed with only prolonged water stress data in two separate groups (morphological and physiological) to better depict the impact of water stress on maize.

3. Results

The results of the data collected during the experimental period on the environmental conditions, soil moisture tension, morpho-physio-biochemical characteristics of maize, and their interrelations, as well as the effects on the yield, drought tolerance index, and efficiency, especially energy use and CO2-eq emissions, are presented in this section.

3.1. Environmental Conditions, Soil Moisture Tension and Soil Status

Global climate change impacted the weather in Thailand. From the long-term data (Figure S1a), it was found that December and January are the relatively cool months, and March to May are the relatively hottest months. However, the present data showed that the mean temperature in January is around 20 °C (Figure S1b), whereas the long-term data showed it being around 25 °C. But the hotter month became hotter, and it was found that in March, the mean temperature was around 28–30 °C, whereas in the long-term data, it was around 24 °C. In the case of rainfall, the long-term data showed that the maximum rainfall occurred in September, followed by August and July, and the minimum rainfall occurred in December and January, whereas the present data showed that from December to March, there was no rainfall except on February 14 and 15, when very little rainfall occurred (13.6 mm each day). Figure 2 shows that these two days of rainfall occurred on the 23rd and 24th days after water withdrawal in the W2 and W3 treatments, though the water stress period was finished in the W2 treatment. However, these two days of rainfall had very little effect on the soil water tension, and it remained at 90–95 kPa in W3 (Figure 2). The soil moisture tension remained at 15 to 36 kPa in a well-watered plot. In W2, the maximum soil water tension was recorded just before the end of the water stress period, and it was 98 kPa. In W3, the maximum soil water tension was recorded to be 123 kPa just before the end of the 35-day water withdrawal period. The soil moisture tension (in kPa) was measured on a daily basis using a soil water tension sensor from a 0 to 30 cm soil depth of all water level plots (W1, W2, and W3).
The soil sample (0–30 cm depth) was gathered from the experimental site two weeks before the start of the research to be analyzed for physical and chemical qualities (Table 1). The experimental soil was silty clay with medium organic matter (OM) and nitrogen (N) contents, but it was high in phosphorus (P) and potassium (K) in the crop root zone. The pH of the soil was slightly alkaline, and the electrical conductivity (EC) was normal.

3.2. Treatment Effects on Morpho-Physio-Biochemical Traits of Maize

The individual effects of each water level and ethephon application approach, as well as their interactions, on the 27 investigated traits are shown by the results of the ANOVA given in Table 2, Table 3 and Table 4 for the morphological, physiological, and physio-biochemical traits, respectively. For the morphological traits, the influence of water levels was significant for practically all traits apart from FEGLA-V10 and SW-V10, whereas the influence of ethephon was significant for all traits apart from FEGLA-V6, SW-V6, and GNP. The interaction between the water levels and ethephon applications were significant for PH-R3, SD-R3, FEGLA-R3, LAI-R3, SW-R3, and GY. In terms of the physiological traits, both the water levels and the ethephon application approaches had significant impacts on each trait. The effect of the interaction between the water levels and ethephon application approaches was nonsignificant for RGR-V6V10 and AGDD, but significant for all other traits. All of the physio-biochemical traits were significantly affected by the water levels, as well as by the ethephon application approaches. The interaction between the water levels and ethephon applications were significant for all traits except for SPAD-JAWSP and RWC-JAWSP.

3.2.1. Morphological Traits of Maize

Plant Height (PH)

The plant height is an important morphological characteristic in maize, and the growing conditions and management approaches may have an impact on it. The PH was measured at the R3 (PH-R3) stage after the end of the water stress period. The PH-R3 was significantly affected by water levels (W), ethephon application approaches (E), and their interactions (W × E) (Table 5, Table 6 and Table 7). The plant height was measured from the base of the ground to the base of the topmost leaf. The longest plant height was measured in the well-watered (W1) treatment, followed by the short water stress (W2) treatment, and the smallest plant (12.38% lower than W1) was observed in the prolonged water stress (W3) plot. In the case of ethephon application, the highest plant height was recorded in E7, which was identical to E3 and E1. The moderate size of the plant was observed in the E4 treatment. The identically shortest plant heights were observed in E6, E5, and E2, which were 7.40, 6.79, and 6.78% lower than E7. The interaction effect showed that the plant height was decreased due to ethephon application under prolonged water stress, and it was reduced more (10.26%) in the W3E2 treatment combination.

Stem Diameter (SD)

The diameter of the stem is an important character in maize, and thicker stems are often preferred as they can protect the lodging and can encourage deeper root production, and these all are desirable under drought conditions. From the results, it was found that both short and prolonged water stress levels significantly reduced the stem diameter (SD-R3). The maximum SD-R3 was measured in W1, and it was reduced by 3.77% and 5.86% in W2 and W3, respectively. The highest SD-R3 was observed in E3, which was statistically like E1 and E7. The higher doses of ethephon had negative effects on SD-R3, and subsequently, the minimum SD-R3 was observed in E5, and it was also identical with other higher doses of ethephon like E4 and E6. However, under both water stress levels, ethephon application increased the SD, and the maximum was 7.29% and 7.49% higher in W2E3 under short water stress and prolonged water stress, respectively.

Fully Expanded Green Leaf Area (FEGLA) at V6, V10, and R3 and Leaf Area Index (LAI) at R3

Plants’ primary source of transpiration and assimilation comes from their leaves, which is crucial for maintaining balance, especially when there is a water shortage. In the present study, it was found that before starting the water stress, the fully expanded green leaf area (FEGLA) was relatively higher in the W2 plot (2.98%) at the V6 stage and in the W3 plot (0.1%) at the V10 stage than W1, but after water withholding in W2 and W3, the FEGLA was decreased compared to W1. The highest FEGLA-R3 was measured in W1, and it was 33.18% lower in W3. The highest leaf area index at the R3 stage (LAI-R3) was calculated in W1, and it was 33.48% lower in W3. Ethephon had a significant effect on the leaf area, and it was varied due to application doses with plant growth stages. Before the water withholding period and just before the ethephon application, the FEGLA-V6 was higher in E6, which was identical with the others except for E1. But after ethephon application in the E1, E2, E4, and E5 treatments at the V6 stage, subsequently, the leaf area was decreased in those plots at the V10 stage compared to the plots without ethephon application. However, after the application of ethephon at both the V6 and V10 stages as per the treatment, the highest FEGLA-R3 was measured in the E7 plot not treated with ethephon followed by E3, and it was 83.88% decreased in E5. The LAI-R3 was also higher in E7 (83.78%), followed by E3 (67.57%), compared to E5. The interaction effect showed that all levels of ethephon application decreased the LAI at the R3 stage under all water levels. The LAI maximum decreased by 43.58% in the W2E2 treatment under short water stress and by 42.67% in W3E2 under prolonged stress, compared to no ethephon application in the respective water stress levels.

Shoot Weight (SW)

The dry shoot weight was assessed to determine the plant’s production under various treatments. It was discovered that the water levels and ethephon application approaches considerably affected the SW at the V6, V10, and R3 stages. The interaction between the water levels and ethephon application approaches was significant only at the R3 stage. In the current study, it was discovered that the shoot weight (SW) in the W2 plot at the V6 stage and the W3 plot at the V10 stage was substantially greater than W1 before the water stress began, but the SW was lower after water withholding in W2 (32.37%) and W3 (42.42%) compared to W1. Due to the ethephon application doses and plant growth stages, ethephon’s impact on the SW varied and was significant. The SW-V6 was higher in E6 (14.44 g plant−1) before the water withholding period and right before the ethephon application. All other plants except for E2 displayed the same SW-V6. However, the SW in those plots at the V10 stage was lower in those plots following ethephon application in the E1 (16.34%), E2 (16.00%), E4 (28.26%), and E5 (28.56%) treatments at the V6 stage compared to the plots without ethephon application. The highest SW-R3 was found in the E3 plot, followed by E6, while it was 64.12% lower in E5 compared to E3 after the application of ethephon at both the V6 and V10 phases as per the treatment. All ethephon application amounts increased the shoot weight at the R3 stage under the W2 and W3 water levels, according to the interaction effect. When compared to no ethephon application in the corresponding water stress levels, the SW-R3 increased the maximum by 89.37% in the W2E3 treatment under short water stress and by 99.64% in the W3E3 treatment under prolonged water stress.

Grain Number Per Plant (GNP)

The grain number per plant is one of the main components of grain yield, and it was significantly affected by the water levels but was not significant under ethephon application. Prolonged water stress (W3) significantly decreased the GNP (4.42%). The identically higher GNP was counted in W1 and W2.

Hundred-Grain Weight (100-GW)

The grain weight is an important component of the grain yield of maize that may be influenced by growing conditions. In the present experiment, it is revealed that the 100-GW was remarkably impacted by the water levels and ethephon application. According to Table 7, the 100-GW considerably decreased during prolonged water stress (4.42%), was less affected by short water stress (1.08%), and reached its maximum weight under well-watered conditions. The highest 100-GW was observed in E3, which was statistically identical with the other ethephon treatments except for E5, which gave a 3.02% lower 100-GW.

Grain Yield (GY)

The grain yield, the ultimate desired trait of maize, was significantly affected by both water levels and ethephon application approaches. The highest GY was obtained from the W1 treatment, and it was severely affected and decreased by 25.22% in the W3 treatment, whereas it was moderately affected by W2. Ethephon application had a positive effect against the yield penalty under water stress. The significantly highest GY was harvested from the E3 treatment (5.96 t ha−1), followed by the E6 (5.63 t ha−1) and E1 (5.11 t ha−1) treatments. The GY was 29.27% lower in E5 compared to the E3 treatment. Across all water levels, the interaction effect demonstrated that ethephon application at all levels reduced the GY under well-watered conditions but increased under both water stress levels. When compared to no ethephon application in the corresponding water stress levels, the GY maximum increased by 53.74% in the W2E3 treatment under short water stress and by 59.50% in the W3E3 treatment under prolonged water stress.

3.2.2. Physiological Traits of Maize

Relative Growth Rate (RGR)

For a crop, a steady growth rate under water stress situations is a desirable trait. The relative growth rate of the maize plant was measured from the V6 stage to the V10 stage (RGR-V6V10), from the V10 stage to the R3 stage (RGR-V10R3), and from the V6 stage to the R3 stage (RGR-V6R3). The effects of the water levels, ethephon application, and their interactions were found to be significant at all growth stages except for the interaction effect in the V6V10 period (Table 8, Table 9 and Table 10). In the current study, it was found that before the water stress started, the relative growth rates (RGR) in the W1 and W3 plots at the V6V10 period were significantly higher than the others. However, the RGR was lower after water withholding in W2 (21.03%) and W3 (29.68%) compared to the W1 plot during the V10R3 period. The greatest RGR-R6R3 was found in W1 (26.21 mg plant−1 day−1), and it was 18.89% lower in W3. The effect of ethephon on RGR varied and was substantial depending on the ethephon doses and plant growth stages. Prior to the water withholding period, the RGR-V6V10 was identically higher in E7, E3, and E6 (42.45, 42.12, and 41.49 mg plant−1 day−1, respectively). After withholding water, the RGR-V10R3 measured higher in all ethephon-treated plots than in the non-ethephon-treated plots. The RGR-V10R3 value was 23.76% higher in E3 compared to E7. On the other hand, the RGR-V6R3 also showed the maximum value in E3, followed by E6 and E1. The interaction effect showed that all levels of ethephon application decreased the RGR at the V6R3 period under well-watered conditions but increased under both short and prolonged water stress levels. The RGR-V6R3 maximum increased by 30.68% in the W2E3 treatment under short water stress and by 32.26% in W3E3 under prolonged stress, compared to no ethephon application in the respective water stress levels.

Net Assimilation Rate (NAR)

The net assimilation rate (NAR) indicates the resource use efficiency of a plant, and a higher NAR can lead to reduced costs and environmental impacts. In the present study, the NAR of the maize plant was calculated from stage V6 to stage V10 (NAR-V6V10), stage V10 to stage R3 (NAR-V10R3), and stage V6 to stage R3 (NAR-V6R3). At all growth periods, it was discovered that the ethephon applications and water levels had substantial impacts. In the current study, it was discovered that the NAR in the W1 and W3 plots at the V6V10 period were substantially greater (2.13%) than those in the other plots before the water stress began. However, the NAR was lower in the W2 (30.30%) and W3 (40.91%) plots following water withholding than it was in the W1 plot at the V10R3 period. The NAR-R6R3 was 33.33% higher in W1 than W3. Depending on the dosages of ethephon and the stages of plant growth, the effect of ethephon on the NAR varied and was significant. The NAR-V6V10 was identically higher in E7 and E3 prior to the water restriction phase. After the water was removed, the NAR-V10R3 was found to be greater in all ethephon-treated plots than in the untreated plot. The lowest NAR-V10R3 was found in E7 (35.09% lower than E3), and the identically higher value was found in E3 and E6. The NAR-V6R3 was, however, likewise at higher values in E3 (46.30%) and E6 ((46.30%)) compared to E7. All ethephon application levels reduced the NAR during the V6R3 period under well-watered conditions but rose in both short and prolonged water stress conditions, according to the interaction effect. When compared to no ethephon application in the corresponding water stress levels, the NAR-V6R3 maximum increased by 102.85% in the W2E6 treatment under short water stress and by 129.47% in the W3E6 treatment under prolonged stress.

Water Productivity (WP)

Water productivity is a measure of how effectively a crop uses water under specific growing conditions. Both the water levels and ethephon application methods had considerable impacts on the water productivity. The maximum WP was achieved from the W3 treatment, and it was negatively impacted and lowered by W2 (5%), while W1 had a more modest impact. The yield penalty brought on by water stress was lessened by the applications of appropriate dosages of ethephon. A noteworthy finding was that the E3 treatment generated the higher WP (32.58%), followed by the E6 (24.72%) and the E1 treatments (13.48%) compared to no ethephon treatment. The WP outcome using the E5 treatment was the worst. The interaction effect showed that whereas all ethephon application levels increased the WP under short- and long-term water stress situations, they decreased the NAR under well-watered conditions. The WP maximum increased by 53.74% in the W2E3 treatment under short water stress and by 59.50% in the W3E3 treatment under prolonged stress compared to no ethephon application in the respective water stress conditions.

Accumulated Growing Degree Days (AGDD)

The AGDD is a measure of heat accumulation during a crop’s growth season that impacts the crop development rate. The water levels as well as ethephon application approaches had significant impacts on the AGDD. The W3 (1778.84 °C days) as well as the W2 (1774.20 °C days) conditions required 4.29 and 4.01% higher AGDDs, respectively, compared to W1. The ethephon application slightly decreased the AGDD, and it was found that the highest AGDD was required by E7, which was identical with E6, E3, and E1. An identically lower AGDD was required by E5 (4.27%), E4 (3.63%), and E2 (3.62%) compared to E7.

Heat Use Efficiency (HUE)

The heat use efficiency quantifies how efficiently a crop uses heat under given growing circumstances. The HUE was significantly affected by both the water levels and ethephon application strategies. The W1 was found to be more efficient in heat use, and it was 18.56% lower in W2 and 28.14% lower in W3. The ethephon application positively influenced the HUE, and it was found that the highest HUE was calculated in E3, followed by E6 and E1. Compared to E3, it was lower in E2 (23.30%), E4 (22.71%), and E7 (23.30%). According to the interaction effect, all ethephon application levels raised the HUE in both short and prolonged water stress scenarios but it was decreased under well-watered settings. For the W2E3 treatment under both short and prolonged stress, the HUE maximum increased by 59.34% and 65.30%, respectively, compared to no ethephon application.

3.2.3. Physio-Biochemical Traits of Maize

SPAD Value for Leaf Greenness just after Water Stress Period (SPAD-JAWSP)

The leaf greenness is determined by the chlorophyll concentration, which is the green pigment that is found in leaves and is responsible for photosynthesis. The leaf greenness was strongly influenced by the water deficit levels (Table 11). The SPAD value was found to be the highest in well-watered (W1) situations, and it was reduced by 16.88% in the prolonged water stress (W3) level. In general, the SPAD value declined as the water stress period increased. Across the water stress levels, the ethephon treatment had a beneficial effect on the leaf greenness, with E3 having the highest SPAD-JAWSP, which was identical with E1 and followed by E7. The SPAD-JAWSP was lower in E5 (5.89%) compared to E7 (Table 12). The interaction effect on the SPAD value of the leaves was not significant (Table 13).

Relative Senescence Rate of Leaves at R3 (RSR-R3)

The relative senescence rate of leaves in maize production is important because it controls how long the leaves stay photosynthetically active and it contributes to the grain yield. It is also connected to the effective nutrient transfer to the grain. It may be dependent on the growing conditions. The water deficit levels had considerable influences on RSR-R3. In well-watered (W1) environments, the RSR-R3 was found to be the highest, whereas it was 21.58% lower in short water stress (W2) and 20.33% lower in prolonged stress environments. In the case of the ethephon application approaches, the E5 had the highest RSR-R3, followed by E4 and E2. The RSR-R3 was observed to be lower in E7 and E1. The RSR was increased due to ethephon application under both water stress levels. There was a maximum increase of 23.78% in the W2E5 treatment under short water stress and 24.55% in the W3E5 treatment under prolonged water stress compared to no ethephon application.

Relative Water Content of Leaves Just after Water Stress Period (RWC-JAWSP)

Water deficit in plants may impede their growth and development under water stress situations; hence, it is important to check the leaf water status. The relative water content of the leaves was significantly influenced by the water levels and ethephon applications, but was nonsignificant due to their interactions. The maximum RWC-JAWSP was observed in the well-watered (W1) condition. It decreased with the increase in the water stress period. It was found to be 12.79% lower in W3 compared to W1. Ethephon application under water stress conditions enhanced the capacity of water retention in the leaves. The RWC-JAWSP was higher in E3 (12.36%) and E6 (8.83%) compared to E7.

Electrolyte Leakage just after Water Stress Period (EL-JAWSP)

Drought stress can produce electrolyte leakage (EL) in leaves, which is a crucial sign of cell membrane stability in maize to guard against nutrient leakage. As a result, the EL measurement is important. The EL-JAWSP was significantly impacted by the water levels, ethephon application approaches, and their interactions. About a 45.31% higher EL-JAWSP value was found in the prolonged water stress (W3) condition compared to the well-watered condition (W1). It diminished as the water stress period reduced. W1 had the lowest EL-JAWSP value. Under water stress situations, ethephon application decreased the leakage percentage of the leaves. E3 had the lower EL-JAWSP value (22.59%), followed by E6 (20.82%) compared to E7. The application of ethephon at all water levels resulted in a drop in the EL. In comparison to no ethephon application, there was a maximum drop of 31.59% in the W2E3 treatment under short water stress and 23.74% in the W3E3 treatment under prolonged water stress.

Proline Content in Leaf just after Water Stress Period (PrL-JAWSP)

Plants can synthesize more proline under water stress to protect cells from harm induced by water stress by stabilizing proteins and membranes. The PrL-JAWSP was measured after a water stress period and it was found that it was significantly influenced by the water levels, ethephon application approaches, and their interactions. The higher PrL-JAWSP value was measured in W2 (121.09%), followed by W3 (61.74%) compared to W1. Under water stress situations, ethephon application increased the capacity to produce more proline in the plant. E3 had the greatest PrL-JAWSP value (58.39% higher), followed by E2 (48.93% higher), E1 (48.82% higher), and E6 (48.82% higher) compared to E7. The use of ethephon resulted in an increase in proline at all water levels. In comparison to no ethephon application, there was a maximum increase of 72.65% in the W2E3 treatment under short water stress and 58.88% in the W3E3 treatment under prolonged water stress.

Total Soluble Sugar in Leaf just after Water Stress Period (TSSL-JAWSP)

Under water stress and other growing circumstances, the plants’ levels of total soluble sugar (TSS), an osmotic solute, can change. After a period of water stress, the TSSL-JAWSP was evaluated, and it was discovered that the water levels, ethephon administration approaches, and their interactions all had substantial impacts on it. The W2 had the greatest TSSL-JAWSP value (170.42% higher), followed by W3 (155.29% higher) compared to W1. The ethephon treatment boosted the plant’s ability to synthesize more TSS in conditions of water stress. The TSSL-JAWSP value was higher in E6 (133.82% higher) followed by E5 (135.70% higher) compared to E7. The interaction effect demonstrated that the use of ethephon raised the TSS at all water levels. In comparison to no ethephon application, there was a maximum increase of 85.46% in the W2E2 treatment under short water stress and 209.33% in the W3E2 treatment under prolonged water stress.

3.2.4. Correlation and Path Coefficient Analyses

The correlation and path coefficient analyses were conducted separately for the selected morphological traits and physio-biochemical traits to see their individual contributions to the grain yield.
According to the correlation analysis of six morphological variables, SW-R3, SD-R3, and 100-GW exhibited the most, second highest, and third highest positive and significant correlations with the grain yield (GY), respectively, while LAI-R3, GNP, and PH-R3 showed moderate and positive correlations (Table 14). The PH-R3 had the positive and significant correlations with LAI-R3 and GNP, but an opposite correlation was found with the 100-GW (Figure 3). The SD-R3 had positive and significant correlations with the 100-GW, SW-R3, and LAI-R3. A strong and positive correlation was observed between the LAI-R3 and GNP and also between the SW-R3 and 100-GW.
The correlation analysis of six physio-biochemical traits showed that almost all traits, i.e., NAR-V6R3, SPAD-JAWSP, RWC-JAWSP, PrL-JAWSP, and TSSL-JAWSP, were strongly and positively correlated with the grain yield except for EL-JAWSP, which was strongly and negatively correlated with the GY (Table 14). Figure 3 shows that NAR-V6R3 had a significant and positive correlation with RWC-JAWSP and TSSL-JAWSP but was negatively correlated with SPAD-JAWSP, EL-JAWSP, and PrL-JAWSP. The SPAD-JAWSP was significantly but negatively correlated with RWC-JAWSP. The RWC-JAWSP was significantly and positively correlated with PrL-JAWSP and TSSL-JAWSP but negatively correlated with EL-JAWSP. The EL-JAWSP was significantly but negatively correlated with PrL-JAWSP and TSSL-JAWSP, whereas the correlation between PrL-JAWSP and TSSL-JAWSP was positive and significant.
The path coefficient analysis is essentially a standardized partial regression coefficient and, as such, it enables one to pinpoint the direct and indirect impacts of various variables on the grain yield. In the case of morphological characteristics, SW-R3 had a high positive direct effect and LAI-R3 had a moderately positive direct effect on the GY, whereas PH-R3 and 100-GW had slightly negative direct effects on the GY. The direct effects of SD-R3 and GNP were insignificant because those were lower than 0.1. The indirect effects of the morphological traits showed that PH-R3 had a positive indirect effect on the GY via LAI-R3 and SW-R3, whereas it had a negative indirect effect on the GY via the 100-GW (Table 14). The SD-R3 had a positive indirect effect via the LAI-R3 and SW-R3 on the GY. The LAI-R3 affected the GY indirectly via PH-R3 and SW-R3. The SW-R3 had a positive indirect effect via the LAI-R3 but it was negative via the 100-GW. Both the GNP and 100-GW had positive indirect effects on the GY via the LAI-R3.
In the case of physio-biochemical traits, the NAR-V6R3, SPAD-JAWSP, RWC-JAWSP, EL-JAWSP, and TSSL-JAWSP had positive direct effects on the GY, whereas the PrL-JAWSP was nonsignificant (Figure 4). In the case of indirect effects of the physio-biochemical traits, it was found that the NAR-V6R3 had a positive indirect effect via the SPAD-JAWSP and RWC-JAWSP and a negative indirect effect via the EL-JAWSP (Table 14). The SPAD-JAWSP indirectly affected the GY via the NAR-V6R3. The RWC-JAWSP had an indirect effect via the NAR-V6R3 and SPAD-JAWSP. The EL-JAWSP affected the GY negatively via the NAR-V6R3, SPAD-JAWSP, RWC-JAWSP, and TSSL-JAWSP. The PrL-JAWSP had a positive indirect effect via the NAR-V6R3, SPAD-JAWSP, RWC-JAWSP, and TSSL-JAWSP, and a negative indirect effect via the EL-JAWSP. The TSSL- JAWSP had a positive indirect effect via the NAR-V6R3 and RWC-JAWSP.

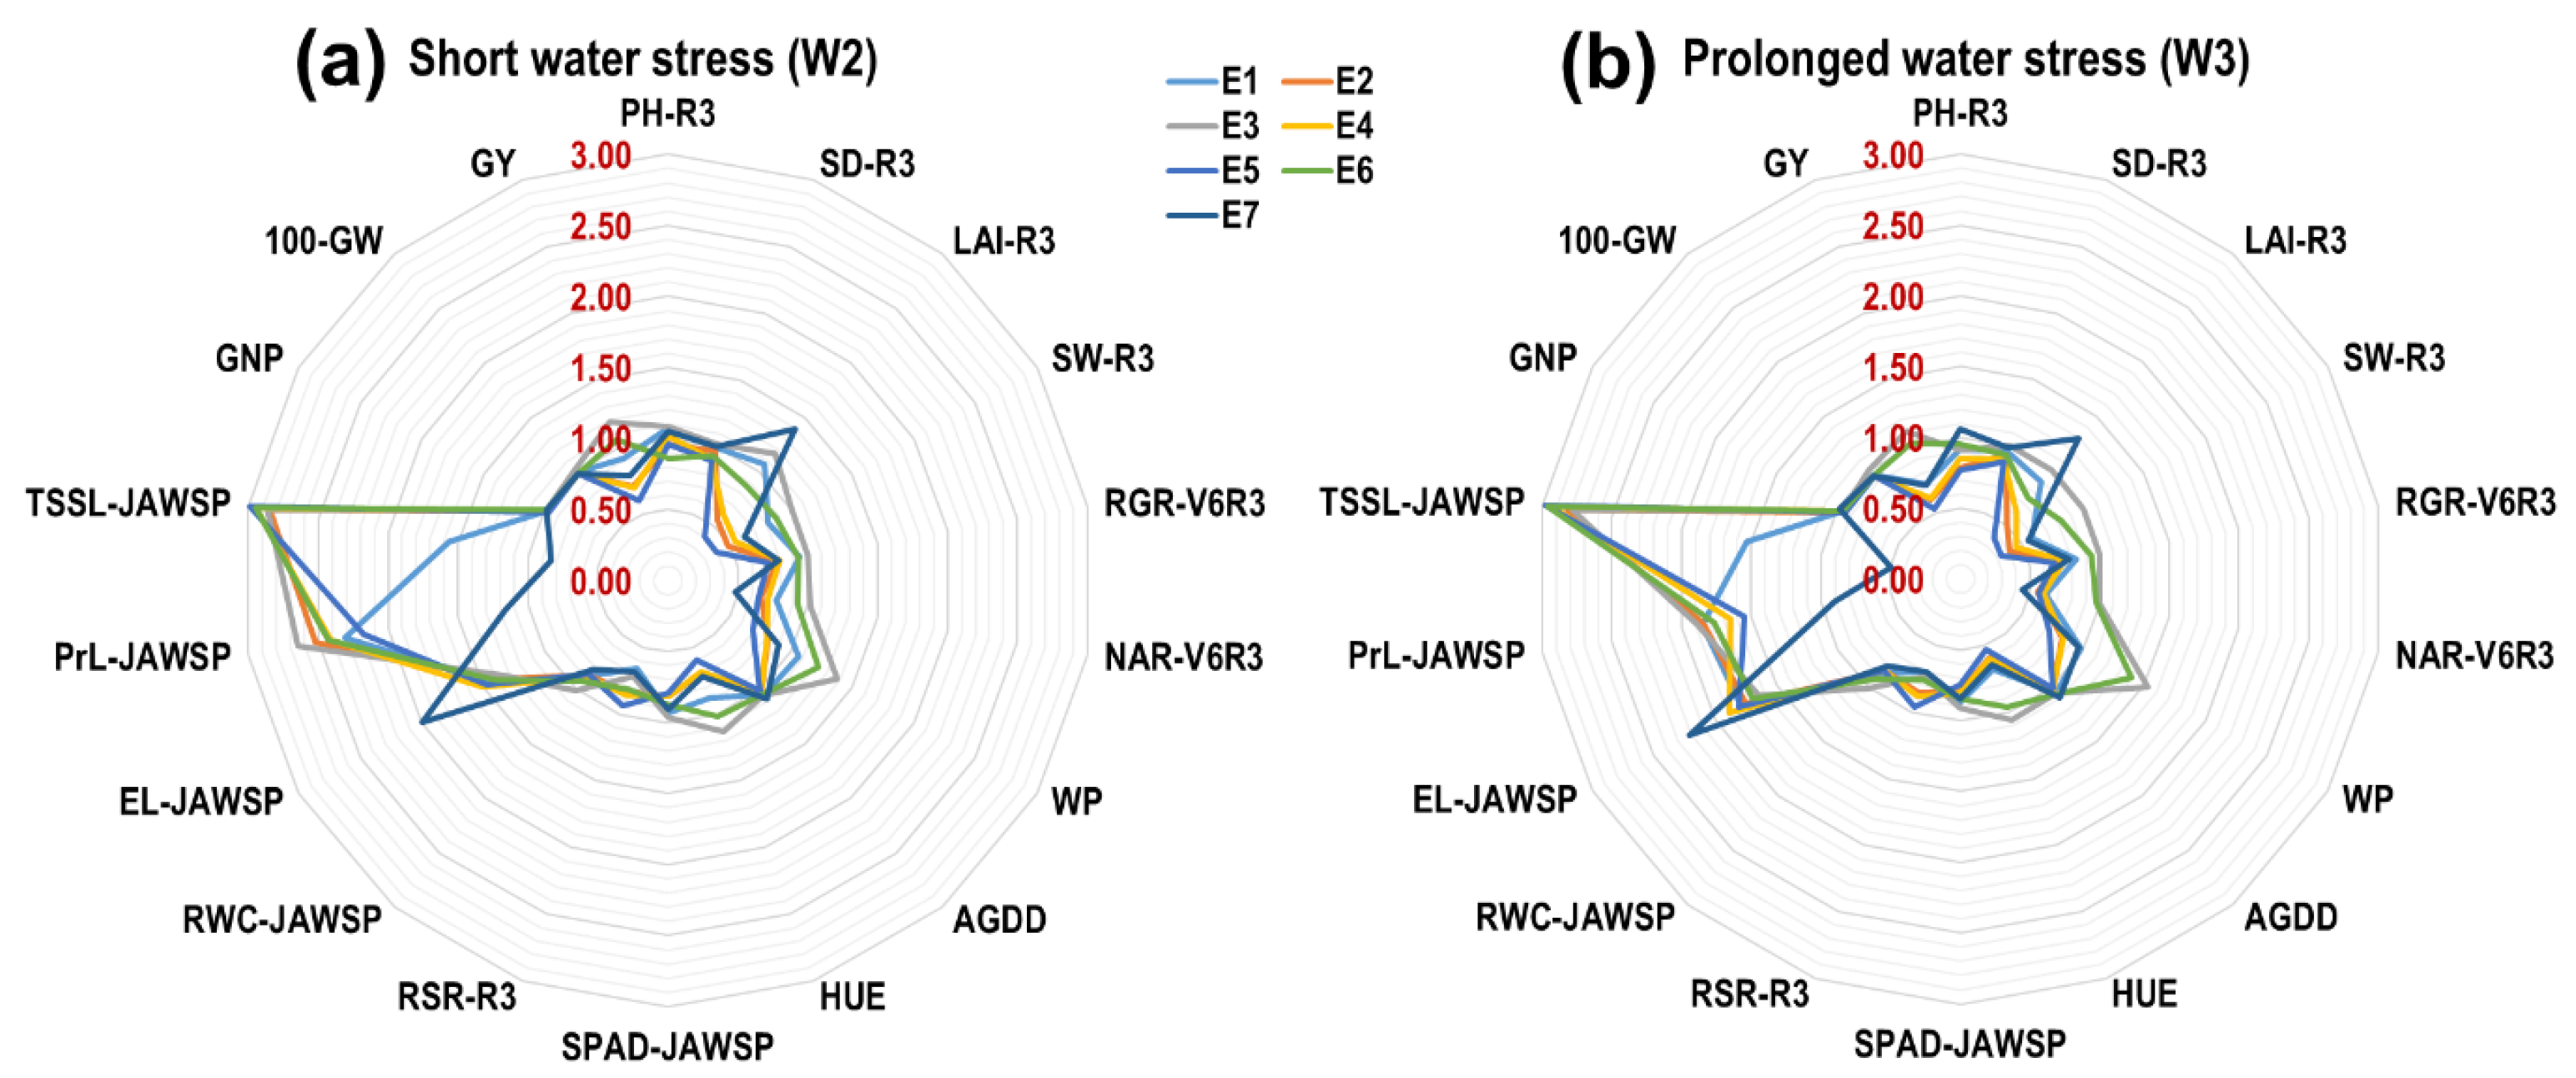
3.2.5. Drought Tolerance Index of Morpho-Physio-Biochemical Traits of Maize

The drought tolerance index (DTI) was calculated for the ethephon application approaches only across the water stress to see its capacity to stimulate the tolerance of different traits against short and prolonged droughts. It was considered that when the DTI was ≥1.0, the ethephon level was significant for stimulating the tolerance; when the DTI was <1, the ethephon level was nonsignificant for stimulating the tolerance of the different traits.
Under short water stress, the radar plot results (Figure 4a) showed that the ethephon application approach E3 effectively stimulated the maximum number of morpho-physio-biochemical traits than the other approaches. Due to having high and significant values of the DTI for the characteristics of PH-R3, SD-R3, LAI-R3, SW-R3, RGR-V6R3, NAR-V6R3, WP, HUE, RWC-JAWSP, PrL-JAWSP, GNP, 100-GW, and GY under short water stress, E3 demonstrated great drought resistance. However, the DTI value was higher in the AGDD and EL-JAWSP under E7, and higher in TSSL-JAWSP under E5.
Under prolonged water stress (Figure 4b), the trend was almost the same for the ethephon application approaches and it was found that E3 effectively stimulated the maximum number of morpho-physio-biochemical traits than the other approaches. Due to having high and significant values of the DTI for the characteristics of SD-R3, SW-R3, RGR-V6R3, NAR-V6R3, WP, HUE, RWC-JAWSP, PrL-JAWSP, 100-GW, and GY under prolonged water stress, E3 demonstrated great drought resistance. However, the DTI value was higher in the LAI-R3, AGDD, and EL-JAWSP under E7, whereas E3 was also significant in these cases.

3.3. Efficiency of Maize Production under Water Stress Using Ethephon

The changing climate calls for a maize production method that is effective. For this, it is important to concentrate on the careful utilization of inputs that maximize the output while having little environmental impact.

3.3.1. Energy Efficiency

The energy efficiency was significantly affected due to the interactions between the water levels and ethephon application approaches, and the results showed that the energy efficiency was relatively higher under well-watered situations, and as the water stress increased, the efficiency decreased (Table 15). It was found that the energy efficiency was reduced by 7.43 and 14.86% under E1, by 7.86 and 20% under E2, by 13.30 and 17.55% under E3, by 3.68 and 14.71% under E4, by 10 and 18.46% under E5, by 17.12 and 18.78% under E6, and by 43.92 and 43.68% under E7, respectively, as a result of short and protracted water stresses. However, under well-watered conditions, the identically maximum efficiencies were observed in E7 (1.89), E3 (1.88), and E6 (1.81), whereas the minimum efficiency was seen in E5 (1.30) in this group. Under the short water stress conditions, E3 (1.63) was significantly higher, and it was identical with E1 (1.59) and E6 (1.50), whereas the minimum efficiency was observed in this group in E7 (1.06). The trend of the ethephon effect in the case of prolonged water stress was nearly identical to that in the case of short water stress. However, under prolonged water stress, the maximum energy efficiency was seen in E3 (1.55), followed by E6 (1.47), and the overall poorest efficiency was observed in E7 (0.97).

3.3.2. Emission of CO2-eq

The various inputs used in the production of maize are presented in Table 16, along with the quantity of each input and the CO2-eq emissions generated for each ethephon application approach under the three water levels. N had highest input values for CO2-eq emissions, followed by diesel fuel, electricity, maize seeds, phosphorus fertilizer, potassium fertilizer, and pesticides. Due to the variations in the amount of water irrigated, electricity revealed varying CO2-eq emissions at each water level. Due to the various amounts of ethephon used, pesticides with PGR also displayed varying CO2-eq emissions in each ethephon spraying approach. In general, it was shown that the CO2-eq emissions across the ethephon levels were higher in well-watered applications, followed by short water stress conditions, and they were lower under prolonged water stress conditions. Additionally, applying ethephon increased emissions in comparison to not applying ethephon, resulting in relatively lower emissions in the no-ethephon treatments across the water levels. However, only among the ethephon-treated plots, E3 and E1 under prolonged water stress (W3) had the lowest emissions (3603.69 kg CO2-eq ha−1), while E5 under well-watered (W1) conditions had the highest emissions (3783.45 kg CO2-eq ha−1). Furthermore, the application of N fertilizers, which contributed more than other management techniques, was the main cause of CO2-eq emissions. Additionally, fuel and electricity also contributed to the CO2-eq emissions, with the other inputs having negligible impacts.

4. Discussion

The morphological, physiological, and biochemical characteristics of maize are important for understanding how crops respond to water stress. Water stress conditions are influenced by the environment and soil conditions. Effective management can alter the effects of stress on crops. Ethephon is a plant growth regulator that improved the morphological, physiological, and biochemical characteristics of maize under water stress in the present study and it was found to be a promising tool to improve the drought tolerance of maize plants.

4.1. Environmental Conditions and Soil Moisture Tension

Climate change impacts the rainfall intensity and amounts and raises the risk of droughts (2). The weather of the present experimental location during the crop growing season was slightly different than that of the long-term historical data. During the experimental year, it was observed that the cool season (November to February) became slightly cooler, but the hot season (March to May) became hotter. The rainfall pattern also differed with the long-term data, where it was found that during the experimental period, there was very little rainfall in February and no rainfall in December, January, and March, which affected the soil water level significantly and increased the soil moisture tension remarkably.

4.2. Maize Morphological Performance under Water and Ethephon Applications

The crop plant height is negatively impacted by water stress [93,94], and this might be due to soil nutrients becoming less available under stress conditions as well as the deficit of water in the plant, which hampers the production of assimilate. Water stress causes a decrease in the plant height due to a decrease in cell enlargement [95]. Additionally, under water stress conditions, the plants tended to partition more dry matter to the roots than the shoots to uptake water from deeper levels of the soil, as the water goes down under water stress conditions. Ethephon application may create ethylene signaling in plants [60] and encourage them to produce auxin more than cytokinin, which may influence root growth rather than shoot growth. For this reason, it might be that a higher dose of ethephon reduced the height of the plant, and this result is corroborated by those of [43,96]. On the other hand, ethephon may encourage the plant to produce more abscisic acid (ABA) [60], which might decrease the plant’s height. ABA inhibits plant height by reducing cell division and elongation [97] in the stem.
Ethephon treatment at an appropriate dosage enhanced the stem diameter while slightly decreasing the plant height, as confirmed by [98]. Maize with a thicker stem diameter is generally more tolerant to water stress. A thicker stem diameter indicates that the plant has a stronger vascular system, which allows it to transport water and nutrients to the leaves and other parts of the plant more efficiently [22]. Furthermore, a thicker stem diameter can aid in sustaining the weight of the plant, which is vital for preventing lodging [46].
The reduction in the leaf area under water stress might be due to the increased ABA production in the plants [60], which may encourage the generation of reactive oxygen species (ROS) that can harm cells [99]. This results in reduced plant growth and leaf expansion [96] and, subsequently, water loss, and these factors may help plants to survive under water stress. But excess ethephon doses decreased the leaf area drastically [43], which might have had negative effects on the desired level of photosynthesis and caused yield losses significantly. In contrast, an optimum dosage of ethephon helped the plant to reduce the leaf area to a level that can continue to assimilate production satisfactorily.
The shoot weight is an important trait in maize under water stress, and the application of a suitable dosage (E3) of ethephon maintained the shoot weight of the maize plant, even though the plant height was slightly lowered, which was possibly due to the thickening of the stem diameter with a good level of the leaf area. But an excess dosage of ethephon application like E5 and E2 reduced the shoot weight [97].
More grain per plant indicates a higher tolerance against drought. Water stress can cause a reduction in the grain number in maize plants. This is due to the plant reducing its reproductive growth in order to preserve water [22]. A higher ability to maintain reproductive growth during dry conditions is needed, and it was discovered that ethephon application at the E3 level could help slightly in this area. It was also noted by others, such as the authors of [51,53], that this reduction in early vegetative growth, particularly the LAI, is very likely the reason for a decrease in the early-season soil water extraction associated with ethephon treatments, which, in turn, conserved more available soil water for later growth in the season [44].
The reduction in grain weight might be due to the reductions in water and nutrient availability to the plants under drought stress, which are essential for kernel development [21]. In contrast, due to application of ethephon under water stress conditions, the grain weight was improved. This might be due to rapid plant senescence at the end of the reproductive phase under ethephon treatments, which might have helped to reduce water loss and increase the availability of nutrients to the kernels through remobilization [57,100].
Drought stress reduced the maize grain yield [27] by reducing the number of kernels per ear, the weight of individual kernels, and the duration of the grain filling period [101,102]. Due to the application of ethephon in appropriate doses and plant stages, the grain yield of maize was higher than that without ethephon application, and this finding is also supported by [43]. This might be because ethephon promotes rapid plant senescence at the end of the reproductive phase, which might help to reduce water loss and increase the availability of nutrients to the kernels [97,103,104], and ethephon might help to increase the number of kernels per ear, the individual kernel weight, more assimilated translocation [105,106], etc. Several studies have shown that ethephon can help to mitigate the negative effects of drought stress on the grain yield of maize. Ethephon application increased the grain yield of maize by 24% under drought stress [52] and by 15% under severe drought stress [107] conditions.

4.3. Maize Physiological Performance under Water and Ethephon Applications

Water stress reduced the relative growth rate of maize considerably, which was consistent with prior research [37,108,109]. Though water stress hampers the maize plant RGR, ethephon treatment might mitigate this reduction, as indicated by the current experiment. Ethephon application before water stress at the V10 stage of maize promoted plant growth during the water stress period. This might be due to the strong root system supported by a thicker stem, a higher relative water content to transport sufficient nutrients, and acceptable assimilate production through a satisfactory leaf area.
Water stress restricted the net assimilation rate [27], which could be due to a reduction in the green leaf area caused by fewer cell divisions and expansions under water stress circumstances. However, ethephon application in appropriate levels helped to retain relatively more leaf greenness, which might have contributed to enhance the NAR under drought conditions.
Ethephon application at the proper growth stage with an appropriate dosage can help to mitigate the negative effects of drought stress and improve the WP of maize. In the present study, it was found that an excess dosage reduced the WP, but a proper dosage (E3) enhanced the WP of maize under water stress conditions. Kasele et al. [52] found that ethephon application increased the WP of maize by 15% under drought stress conditions.
The accumulated growing degree days can vary due to growing conditions, especially under different water levels [110,111]. Ethephon application reduced the GDDs of maize by promoting earlier plant senescence. This is because ethephon can cause the plant to stop growing, and at the end of the reproductive phase, it starts to die earlier than it would under normal conditions.
The heat use efficiency of maize might vary depending on the growing conditions [86]. Drought stress lowered the maize HUE, which could be connected to the plant’s ability to absorb water and nutrients. This can cause slower plant growth and development, resulting in less biomass production.

4.4. Maize Physio-Biochemical Performance under Water and Ethephon Applications

The reduced capacity of the plant to absorb water and nutrients may have contributed to the decrease in the maize leaf greenness (SPAD value) caused by drought stress [29]. Drought stress can cause reactive oxygen species (ROS) to be produced [99], which can damage the leaf cells and chlorophyll, resulting in a decrease in leaf greenness. Higher ethephon dosages applied at the plant’s early growth stage similarly reduced the SPAD value [96], although an adequate dosage (E3) of ethephon at the V10 stage enhanced the SPAD value. Previous studies suggested that the ethephon application improved the SPAD values before silking [112].
Drought stress, in general, can raise the relative senescence rate (RSR) of maize plants by reducing the plant’s ability to absorb water and nutrients, resulting in a decrease in chlorophyll production and an increase in senescence [27]. But in the present study, it was found that the RSR was lower in the water-stressed plot, and this might have been due to higher recovery after re-watering followed by water stress. Kumdee et al. [37] also reported that rewatering after a water stress period enhanced the plant’s recovery rate more than a non-stressed plant. On the other hand, ethephon can help to maintain more chlorophyl in maize leaves through the promotion of water and nutrient uptake by enhancing root growth. And these situations might be the causes of the relatively less RSR in the maize compared to no ethephon application under water stress.
The relative water content (RWC) of maize under water stress conditions was decreased by insufficient soil water [27], whereas the RWC of the maize leaves under drought stress conditions was maintained via ethephon application. This could be because ethephon encourages the stomata to close, hence reducing water loss from the maize leaves [61]. Ethephon can also boost root growth in maize plants, which improves the plant’s ability to absorb water from the soil, which is necessary for RWC maintenance. Ethephon application may help to protect electrolyte leakage, which can help to retain more RWC in the maize leaves [113]. A number of studies have shown that ethephon application can help to maintain the RWC of maize leaves under drought stress conditions. For example, a study by Yu et al. [113] found that ethephon application significantly increased the RWC of maize leaves under drought stress conditions.
Ethephon application helped to reduce the electrolyte leakage of maize leaves under drought stress conditions. Ethephon can increase the stability of cell membranes [113] by increasing the production of certain proteins and enzymes that help to protect the membranes from damage. On the other hand, reactive oxygen species (ROS) produced under water stress can damage cell membranes and can lead to electrolyte leakage [99]. Ethephon can reduce oxidative stress in maize plants by increasing the production of antioxidants [105]. Ethephon also helps to enhance the root system, which can help the plant to absorb and retain more water, protecting the EL.
Proline helps to protect cells from damage via reactive oxygen species (ROS). Plants can synthesize more proline under water stress to protect cells from harm induced by water stress by stabilizing proteins and membranes [113]. In the present study, it was found that the maize plants had enhanced proline contents under water stress compared to well-watered conditions and were able to protect themselves from the damage caused by ROS. Additionally, ethephon application increased the proline content [105,113] in the maize leaves. This could be because ethephon stimulates the production of particular enzymes involved in proline biosynthesis. Zhang and Kirkham [114] found that ethephon application significantly increased the proline content in the leaves under drought stress conditions.
Water stress raised the total soluble sugar (TSS) content in the maize leaves. Ethephon application also increased the total soluble sugar content in the maize leaves. This could be due to ethephon’s ability to enhance the breakdown of starch [60] into soluble sugars. A number of studies have shown that ethephon application can further increase the total soluble sugar content in maize leaves under drought stress conditions. For example, a study by Shen et al. [115] found that ethephon application significantly increased the total soluble sugar content in maize leaves under drought stress conditions.

4.5. Correlation and Path Coefficient Analysis

The grain yield of maize was highly correlated with the 100-GW, GNP, SW-R3, SD-R3, NAR-V6R3, RWC-JAWSP, SPAD-JAWSP, and PrL-JAWSP. Several studies have shown a strong relationship between the grain yield and grain traits [116], including the EL [117] and SW [118]. A path coefficient analysis, according to Dewy and Lu [119], is simply a standardized partial regression coefficient that allows one to pinpoint the direct and indirect effects of numerous variables on the grain yield. The SW-R3, LAI-R3, NAR-V6R3, SPAD-JAWSP, RWC-JAWSP, and EL-JAWSP had strong positive direct effects on the grain yield (GY). A trait’s high direct impact on the grain yield indicates additive gene activity, according to [120]. According to Lenka and Mishra [121] in scales for path coefficients, the direct effects for SD-R3, GNP, and PrL-JAWSP were inconsequential because they were less than 0.1. Overall, a path coefficient analysis can be used to gain a better understanding of the complex relationships between droughts, ethephon, and the grain yield in maize. This information can be used to develop management strategies to improve the maize grain yield under drought stress conditions.

4.6. Drought Tolerance Index of Morpho-Physio-Biochemical Traits of Maize

According to Balba et al. [91], when the drought tolerance index (DTI) is ≥1.0, the effect is significant, and when the DTI is <1, the effect is nonsignificant for stimulating the tolerance. Ethephon can help to improve the drought tolerance of maize plants by increasing the production of certain proteins and enzymes that help to protect the plant from the effects of drought stress. Drought tolerance in plants is heavily reliant on maintaining membrane integrity and stability as well as scavenging ROS [113,122,123]. In the present study, it was observed that ethephon application through the E3 approach enhanced the DTI value of the SD-R3, SW-R3, RGR-V6R3, NAR-V6R3, WP, HUE, RWC-JAWSP, PrL-JAWSP, 100-GW, and GY under prolonged water stress.

4.7. Efficiency of Maize Production under Water Stress Using Ethephon

The energy use efficiency (EUE) can assist in lowering the environmental impact of maize production [124]. Maize production demands substantial energy inputs such as fertilizer, fuel, and irrigation. It is possible to lower the amount of energy required to produce a given amount of maize by enhancing the EUE. Ethephon application before a drought spell can improve the EUE in maize production while under drought stress by reducing the need for irrigation by increasing the plant’s ability to absorb water from the soil, improving the efficiency of fertilizer use by increasing the plant’s ability to uptake and utilize nutrients [97], and improving the efficiency of photosynthesis by increasing chlorophyll production [113]. Yet ethephon application can result in an increased maize output with lower energy inputs in addition to improving drought tolerance, increasing root growth, decreasing lodging [97,125,126], allocating more N to the grains rather than the stover [97], lowering water loss and electrolyte leakage [99,113], improving photosynthesis, and reducing stress.
Agriculture is a major source of greenhouse gas emissions, and one of the most energy-intensive agricultural activities is maize production. The use of N fertilizer, fuel, and electricity during the experiment had the biggest impacts on the CO2-eq emission. For maize cultivation, the same results were already observed [92,127]. About 60 percent of CO2-eq emissions were attributed to fertilizer application, according to one study [128], while the biggest source of CO2-eq emissions, according to another study [129], was the N fertilizer inputs. However, in the present study, due to the various applications of water and PGR, the electricity and PGR displayed varying CO2-eq emissions in each treatment. Under drought stress, using ethephon judiciously (281 g a.i. ha−1 only at the V10 stage of maize) may help to keep the CO2-eq emissions at a bearable level, because an excess dose of ethephon may lower crop production rather than contribute to a greater CO2-eq emission. However, under water stress, ethephon treatment at the optimum dosage can aid to enhance water usage efficiency in maize plants by reducing water loss and enhancing root growth. This can assist in reducing the demand for irrigation, lowering energy usage and greenhouse gas emissions. This can also improve the plant’s ability to absorb and utilize nutrients, reducing the need for fertilizer and, as a result, lowering greenhouse gas emissions related to fertilizer manufacture and application.

5. Conclusions

The application of PGR (ethephon) at the proper dosage can raise the maize grain yield and energy efficiency by enhancing the net assimilation rate, improving the relative growth rate. According to the findings of the current study, ethephon52 (2-chloroethyl phosphonic acid 52% W/V SL) at 281 g a.i. ha−1 at the V10 stage of maize had a favorable influence on the morpho-physio-biochemical characteristics of maize to endure drought conditions in the dry season. The doses and application phases of ethephon for maize plants, however, have been shown to be crucial. Ethephon should be administered at the vegetative stage before the drought spell begins, but it is important to consider the dosage because an excessive amount could severely impair the plant’s physio-biochemical activity. The dosages need to be balanced so as to shorten the plant to prevent lodging, while limiting the leaf area to a specific point, which could minimize water loss and maximize assimilate production to a satisfactory level. More enzymatic and molecular research is needed to better understand how ethephon affects maize during water stress.

Supplementary Materials

The following supporting information can be downloaded at https://www.mdpi.com/article/10.3390/agronomy13112673/s1, Figure S1. (a) Monthly climatology during the 1991–2020 period at the experimental location, Saraburi, and (b) daily weather collected by installing a mini weather station in the experimental plot during the whole crop period in 2020–21 in Saraburi, Thailand. Temp.: (temperature °C, maximum, average, and minimum) and rainfall (mm) [130]; Table S1. Energy equivalents of inputs and outputs in maize production systems; Table S2. Emission coefficient of different inputs used in maize production systems. Refs. [131,132,133,134,135,136] have cited in Table S1, Refs. [137,138,139] have cited in Table S2.

Author Contributions

The authors contributed to this work as follows: conceptualization, S.N. and M.S.H.M.; methodology, S.N., M.S.H.M., O.K. and A.W.; software, M.S.H.M. and P.K.; validation, M.S.H.M. and O.K.; formal analysis, M.S.H.M. and O.K.; investigation, O.K., P.K., N.W., M.S.H.M. and A.W.; resources, S.N.; data curation, M.S.H.M. and S.N.; writing—original draft preparation, M.S.H.M. and O.K.; writing—review and editing, M.S.H.M., S.N., A.W., O.K., P.K., M.A.A. and M.M.A.; visualization, M.S.H.M.; supervision, S.N.; project administration, S.N. and A.W.; funding acquisition, S.N. and A.W. All authors have read and agreed to the published version of the manuscript.

Funding

This work was financially supported by the Office of the Ministry of Higher Education, Science, Research and Innovation; and the Thailand Science Research and Innovation through the Kasetsart University Reinventing University Program 2022 (grant no.SFB650010/0461).

Institutional Review Board Statement

Not applicable.

Informed Consent Statement

Not applicable.

Data Availability Statement

The data presented in this study are available upon request from the corresponding authors.

Acknowledgments

The authors would like to thank the Office of the Ministry of Higher Education, Science, Research and Innovation and the Thailand Science Research and Innovation through the Kasetsart University Reinventing University Program 2022 and the Center for Advanced Studies for Agriculture and Food (CASAF), the Institute for Advanced Studies, Kasetsart University, under the Higher Education Research Promotion and National Research University Project of Thailand for Scholarship and Research Grant. We also thank the Central Laboratory of Faculty of Agriculture, Kasetsart University, Bangkok, Thailand and the National Corn and Sorghum Research Center, Faculty of Agriculture, Kasetsart University, Nakhon Ratchasima, Thailand for the use of laboratory instruments and providing facility support. All authors agreed to acknowledge this.

Conflicts of Interest

The authors declare no conflict of interest.

References

  1. Roy, R.; Núñez-Delgado, A.; Sultana, S.; Wang, J.; Battaglia, M.L.; Sarker, T.; Seleiman, M.F.; Barmon, M.; Zhang, R. Additions of optimum water, spent mushroom compost and wood biochar to improve the growth performance of Althaea rosea in drought-prone coal-mined spoils. J. Environ. Manag. 2021, 295, 113076. [Google Scholar] [CrossRef] [PubMed]
  2. Hafez, E.M.; Seleiman, M.F. Response of barley quality traits, yield and antioxidant enzymes to water-stress and chemical inducers. Int. J. Plant Prod. 2017, 11, 477–490. [Google Scholar]
  3. Drought. World Health Organization. Available online: https://www.who.int/health-topics/drought?gclid=Cj0KCQjwoK2mBhDzAIsADGbjer80j_jPw6nNlUgg0h46VgY3u1LGtbq9mQYeFl4Tw7bqmYAl1Lio4EaAra4EALw_wcB#tab=tab_1 (accessed on 25 September 2023).
  4. Duan, W.; He, B.; Nover, D.; Fan, J.; Yang, G.; Chen, W.; Meng, H.; Liu, C. Floods and Associated Socioeconomic Damages in China over the Last Century. Nat. Hazards 2016, 82, 401–413. [Google Scholar] [CrossRef]
  5. Seleiman, M.F.; Al-Suhaibani, N.; Ali, N.; Akmal, M.; Alotaibi, M.; Refay, Y.; Battaglia, M.L. Drought stress impacts on plants and different approaches to alleviate its adverse effects. Plants 2021, 10, 259. [Google Scholar] [CrossRef] [PubMed]
  6. Tropics. WIKIPEDIA. Available online: https://en.wikipedia.org/wiki/Tropics (accessed on 25 September 2023).
  7. How Much Land Is in the Tropics? GDP (God Plays Dice). Available online: http://godplaysdice.blogspot.com/2007/12/how-much-land-is-in-tropics.html (accessed on 25 September 2023).
  8. Tropics. National Geographic Encyclopedia. Available online: https://education.nationalgeographic.org/resource/tropics/ (accessed on 25 September 2023).
  9. Iglesias, A.; Garrote, L. Adaptation strategies for agricultural water management under climate change in Europe. Agric. Water Manag. 2015, 155, 113–124. [Google Scholar] [CrossRef]
  10. Caesar, J.; Alexander, L.V.; Trewin, B.; Tse-ring, K.; Sorany, L.; Vuniyayawa, V.; Keosavang, N.; Shimana, A.; Htay, M.M.; Karmacharya, J.; et al. Changes in Temperature and Precipitation Extremes over the Indo-Pacific Region from 1971 to 2005: Changes in Climate Extremes over the Indo-Pacific Region. Int. J. Climatol. 2011, 31, 791–801. [Google Scholar] [CrossRef]
  11. Villafuerte, M.Q.; Matsumoto, J. Significant Influences of Global Mean Temperature and ENSO on Extreme Rainfall in Southeast Asia. J. Clim. 2015, 28, 1905–1919. [Google Scholar] [CrossRef]
  12. Economic and Social Commission for Asia and the Pacific (ESCAP), United Nation. Ready for the Dry Years: Building Resilience to Drought in South-East Asia; United Nations Publication: Bangkok, Thailand, 2021; pp. 1–64. ISBN 978-92-1-120787-3. [Google Scholar]
  13. Zaki, M.K.; Noda, K.A. Systematic Review of Drought Indices in Tropical Southeast Asia. Atmosphere 2022, 13, 833. [Google Scholar] [CrossRef]
  14. Habib-ur-Rahman, M.; Ahmad, A.; Raza, A.; Hasnain, M.U.; Alharby, H.F.; Alzahrani, Y.M.; Bamagoos, A.A.; Hakeem, K.R.; Ahmad, S.; Nasim, W.; et al. Impact of climate change on agricultural production; Issues, challenges, and opportunities in Asia. Front. Plant Sci. 2022, 13, 925548. [Google Scholar] [CrossRef]
  15. Climate Risk Country Profile: Thailand. The World Bank Group and the Asian Development Bank. 2021. Available online: https://www.adb.org/sites/default/files/publication/722251/climate-risk-country-profile-thailand.pdf (accessed on 25 September 2023).
  16. Seleiman, M.F.; Selim, S.; Jaakkola, S.; Mäkelä, P.S. Chemical composition and in vitro digestibility of whole-crop maize fertilized with synthetic fertilizer or digestate and harvested at two maturity stages in boreal growing conditions. Agric. Food Sci. 2017, 26, 47–55. [Google Scholar] [CrossRef]
  17. Office of Agricultural Economics. Economic Data, Agricultural Product Forecasts. Available online: https://dl.parliament.go.th/backoffice/viewer2300/web/previewer.php (accessed on 14 November 2016).
  18. Hirich, A.; Fatnassi, H.; Ragab, R.; Choukr-Allah, R. Prediction of climate change impact on corn grown in the south of Morocco using the saltmed model. Irrig. Drain. 2016, 65, 9–18. [Google Scholar] [CrossRef]
  19. Khongdee, N.; Hilger, T.; Pansak, W.; Cadisch, G. Early planting and relay cropping: Pathways to cope with heat and drought. JARTS 2021, 122, 61–71. [Google Scholar] [CrossRef]
  20. Pradawet, C.; Khongdee, N.; Pansak, W.; Spreer, W.; Hilger, T.; Cadisch, G. Thermal imaging for assessment of maize water stress and yield prediction under drought conditions. J. Agron. Crop Sci. 2023, 209, 56–70. [Google Scholar] [CrossRef]
  21. Qi, Y.; Zhang, Q.; Hu, S.; Wang, R.; Wang, H.; Zhang, K.; Zhao, H.; Ren, S.; Yang, Y.; Zhao, F. Effects of High Temperature and Drought Stresses on Growth and Yield of Summer Maize during Grain Filling in North China. Agriculture 2022, 12, 1948. [Google Scholar] [CrossRef]
  22. Hama, B.M.; Mohammed, A.A. Physiological performance of maize (Zea mays L.) under stress conditions of water deficit and high temperature. Appl. Ecol. Environ. Res. 2019, 17, 1261–1278. [Google Scholar] [CrossRef]
  23. Saini, H.S.; Aspinall, D. Abnormal sporogenesis in wheat (Triticum aestivum L.) induced by short periods of high temperature. Ann. Bot. 1982, 49, 835–846. [Google Scholar] [CrossRef]
  24. Porter, J.R.; Gawith, M. Temperature and growth and development of wheat: A review. Eur. J. Agron. 1999, 10, 23–36. [Google Scholar] [CrossRef]
  25. Boyer, J.S.; Westgate, M.E. Grain yield with limited water. J. Exp. Bot. 2004, 55, 2385–2394. [Google Scholar] [CrossRef] [PubMed]
  26. Britz, S.J.; Prasad, P.V.V.; Moreau, R.A.; Allen, L.H.D., Jr.; Kremer, F.; Boote, K.J. Influence of growth temperature on amounts of tocopherols, tocotrienols and gamma-ozyzanol in brown rice. J. Agric. Food Chem. 2007, 55, 7559–7565. [Google Scholar] [CrossRef]
  27. Sah, R.P.; Chakraborty, M.; Prasad, K.; Pandit, M.; Tudu, V.K.; Chakravarty, M.K.; Narayan, S.C.; Rana, M.; Moharana, D. Impact of water deficit stress in maize: Phenology and yield components. Sci. Rep. 2020, 10, 2944. [Google Scholar] [CrossRef]
  28. He, J.; Wen, R.; Tian, S.; Su, Y.; He, X.; Su, Y.; Cheng, W.; Huang, K.; Zhang, S. Effects of drought stress and re-watering on growth and yield of various maize varieties at tasseling stage. Agric. Sci. Technol. 2017, 18, 1145–1151. [Google Scholar]
  29. Ge, T.; Sui, F.; Bai, L.; Tong, C.; Sun, N. Effects of water stress on growth, biomass partitioning, and water use efficiency in summer maize (Zea mays L.) throughout the growth cycle. Acta Physiol. Plant. 2012, 34, 1043–1053. [Google Scholar] [CrossRef]
  30. Cakir, R. Effect of water stress at different development stages on vegetative and reproductive growth of corn. Field Crop. Res. 2004, 89, 1–16. [Google Scholar] [CrossRef]
  31. Chaves, M.M.; Marôco, J.P.; Pereira, J.S.; Chaves, M.M. Understanding plant responses to drought from genes to the whole plant. Funct. Plant Boil. 2003, 30, 239–264. [Google Scholar] [CrossRef]
  32. Zhang, Z.P.; Hua, Q.I.; Zhang, Y.; Sun, S.X.; Yang, G.H. Effects of water stress on photosynthetic rate and water use efficiency of maize. Acta Agric. Boreali Sin. 2009, 24, 155–158. [Google Scholar]
  33. Ge, T.; Sui, F.; Bai, L.; Lu, Y.-Y.; Zhou, G. Effects of Different Soil Water Content on the Photosynthetic Character and Pod Yields of Summer Maize. J. Shanghai Jiaotong Univ. 2005, 23, 143–147. [Google Scholar]
  34. Bu, L.; Zhang, R.; Chang, Y.; Xue, J.; Han, M. Response of photosynthetic characteristics to water stress of maize leaf in seeding. Acta Ecol. Sin. 2010, 30, 1184–1191. [Google Scholar]
  35. Chaves, M.M.; Pereira, J.S.; Maroco, J.; Rodrigues, M.L.; Ricardo, C.P.P.; Osório, M.L.; Carvalho, I.; Faria, T.; Pinheiro, C. How Plants Cope with Water Stress in the Field? Photosynthesis and Growth. Ann. Bot. 2002, 89, 907–916. [Google Scholar] [CrossRef]
  36. Chang, J.; Yang, D.; Tan, W.; Yueshang, L.U. Effects of water stress on maize leaf photosynthesis. J. Northeast Agric. Univ. 2008, 39, 1–5. [Google Scholar]
  37. Kumdee, O.; Molla, M.S.H.; Kanavittaya, K.; Romkaew, J.; Sarobol, E.; Nakasathien, S. Morpho-Physiological and Biochemical Responses of Maize Hybrids under Recurrent Water Stress at Early Vegetative Stage. Agriculture 2023, 13, 1795. [Google Scholar] [CrossRef]
  38. Cheng, M.; Wang, H.; Fan, J.; Zhang, F.; Wang, X. Effects of soil water deficit at different growth stages on maize growth, yield, and water use efficiency under alternate partial root-zone irrigation. Water 2021, 13, 148. [Google Scholar] [CrossRef]
  39. Sinay, H.; Karuwal, R.L. Proline and total soluble sugar content at the vegetative phase of six corn cultivars from Kisar Island Maluku, grown under drought stress conditions. Int. J. Adv. Agric. Res. 2014, 2, 77–82. [Google Scholar]
  40. Lei, L.; Shi, J.; Chen, J.; Zhang, M.; Sun, S.; Xie, S.; Li, X.; Zeng, B.; Peng, L.; Hauck, A. Ribosome profiling reveals dynamic translational landscape in maize seedlings under drought stress. Plant J. 2015, 84, 1206–1218. [Google Scholar] [CrossRef] [PubMed]
  41. Bray, E.A. Plant responses to water deficit. Trends Plant Sci. 1997, 97, 1360–1385. [Google Scholar] [CrossRef]
  42. Seki, M.; Umezawa, T.; Urano, K.; Shinozaki, K. Regulatory metabolic networks in drought stress responses. Curr. Opin. Plant Biol. 2007, 10, 296–302. [Google Scholar] [CrossRef]
  43. Shekoofa, A.; Emam, Y. Plant growth regulator (ethepon) alters maize (Zea mays L.) growth: Water use and grain yield under water stress. J. Agron. 2008, 7, 41–48. [Google Scholar] [CrossRef]
  44. Cox, W.J.; Andrade, H.F. Growth, yield, and yield components of maize as influenced by ethephon. Crop Sci. 1988, 28, 536–542. [Google Scholar] [CrossRef]
  45. Gaska, J.M.; Oplinger, E.S. Yield, lodging and growth characteristics in sweet corn as influenced by ethephon timing and rate. Agron. J. 1988, 80, 722–726. [Google Scholar] [CrossRef]
  46. Norberg, O.S.; Mason, S.C.; Lowry, S.R. Ethephon influence on harvestable yield, grain quality, and lodging of corn. Agron. J. 1988, 80, 768–772. [Google Scholar] [CrossRef]
  47. Sanvicente, P.; Lazarevitch, S.; Blouet, A.; Guckert, A. Morphological and anatomical modifications in winter barley culm after late plant growth regulator treatment. Eur. J. Agron. 1990, 11, 45–51. [Google Scholar] [CrossRef]
  48. Tang, Q.; Ren, J.; Du, X.; Niu, S.; Liu, S.; Wei, D.; Zhang, Y.; Bian, D.; Cui, Y.; Gao, Z. Reduced stem nonstructural carbohydrates caused by plant growth retardant had adverse effects on maize yield under low density. Front. Plant Sci. 2022, 13, 1035254. [Google Scholar] [CrossRef] [PubMed]
  49. Gong, L.S.; Qu, S.J.; Huang, G.M.; Guo, Y.L.; Zhang, M.C.; Li, Z.H. Improving maize grain yield by formulating plant growth regulator strategies in north China. J. Integr. Agric. 2021, 20, 622–632. [Google Scholar] [CrossRef]
  50. Huang, G.M.; Liu, Y.R.; Guo, Y.L.; Peng, C.X.; Tan, W.M.; Zhang, M.C. A novel plant growth regulator improves the grain yield of high-density maize crops by reducing stalk lodging and promoting a compact plant type. Field Crop. Res. 2021, 260, 107982. [Google Scholar] [CrossRef]
  51. Shanahan, J.F.; Nielsen, D.C. Influence of growth retardants (Anti-Gibberllins) on corn vegetative growth, water use, and grain yield under different levels of water stress. Agron. J. 1987, 79, 103–109. [Google Scholar] [CrossRef]
  52. Kasele, I.N.; Nyirenda, F.; Shanahan, J.F.; Nielsen, D.C.; d’Andria, R. Ethephon alters corn growth, water use, and grain yield under drought stress. Agron. J. 1994, 86, 283–288. [Google Scholar] [CrossRef]
  53. Peltonen-Sainio, P.; Peltonen, J. Breaking uniculm growth habit of spring cereals at high latitudes by crop management. I. Leaf area index and biomass accumulation. J. Agron. Crop Sci. 1997, 178, 79–86. [Google Scholar] [CrossRef]
  54. Kochaki, A. Optimal Agronomic and Optimal Breeding in Dry Farming; Mashhad Jahad-University Publishers: Mashhad, Iran, 1997; p. 302. [Google Scholar]
  55. Rosenberg, N.J.; Blad, B.L.; Verma, S.B. Microclimate: The Biological Environment, 2nd ed.; Wiley-Interscience: New York, NY, USA, 1983; pp. 209–287. [Google Scholar]
  56. D’Andria, R.; Chiaranda, F.Q.; Lavini, A.; Mori, M. Grain yield and water consumption of ethephon-treated corn under different irrigation regimes. Agron. J. 1997, 89, 104–112. [Google Scholar] [CrossRef]
  57. Iqbal, N.; Umar, S.; Per, T.S.; Khan, N.A. Ethephon increases photosynthetic-nitrogen use efficiency, proline and antioxidant metabolism to alleviate decrease in photosynthesis under salinity stress in mustard. Plant Signal. Behav. 2017, 12, e1297000. [Google Scholar] [CrossRef]
  58. Achard, P.; Cheng, H.; De Grauwe, L.; Decat, J.; Schoutteten, H.; Moritz, T.; Van Der Straeten, D.; Peng, J.; Harberd, N.P. Integration of plant responses to environmentally activated phytohormonal signals. Science 2006, 311, 91–94. [Google Scholar] [CrossRef]
  59. Hendgen, M.; Gunther, S.; Schubert, S.; Lohnertz, O. Ethephon activates the transcription of senescence-associated genes and nitrogen mobilization in grapevine leaves (Vitis vinifera cv. Riesling). Plants 2021, 10, 333. [Google Scholar] [CrossRef]
  60. Lee, B.R.; Zaman, R.; La, V.H.; Bae, D.W.; Kim, T.H. Ethephon-induced ethylene enhances starch degradation and sucrose transport with an interactive abscisic acid-mediated manner in mature leaves of oilseed rape (Brassica napus L.). Plants 2021, 10, 1670. [Google Scholar] [CrossRef] [PubMed]
  61. Iqbal, N.; Nazar, R.; Syeed, S.; Masood, A.; Khan, N.A. Exogenously-sourced ethylene increases stomatal conductance, photosynthesis and growth under optimal and deficient nitrogen fertilization in mustard. J. Exp. Bot. 2011, 62, 4955–4963. [Google Scholar] [CrossRef] [PubMed]
  62. Lee, H.; Lee, B.R.; Islam, M.T.; La, V.H.; Park, S.H.; Bae, D.W.; Kim, T.H. Cultivar variation in hormone- and sugar-response reveals abscisic acid responsive sucrose phloem loading at the early regenerative stage is a significant determinant of seed yield in Brassica napus. Environ. Exp. Bot. 2020, 169, 103917. [Google Scholar] [CrossRef]
  63. Kasai, M. Regulation of leaf photosynthetic rate correlating with leaf carbohydrate status and activation state of Rubisco under a variety of photosynthetic source/sink balances. Physiol. Plant. 2008, 134, 216–226. [Google Scholar] [CrossRef]
  64. Durand, M.; Mainson, D.; Porcheron, B.; Maurousset, L.; Lemoine, R.; Pourtau, N. Carbon source-sink relationship in Arabidopsis thaliana: The role of sucrose transporters. Planta 2018, 247, 587–611. [Google Scholar] [CrossRef]
  65. Coruzzi, G.M.; Zhou, L. Carbon and nitrogen sensing and signaling in plants: Emerging ‘matrix effects’. Curr. Opin. Plant Biol. 2001, 4, 247–253. [Google Scholar] [CrossRef]
  66. Aharoni, A.; Dixit, S.; Jetter, R.; Thoenes, E.; van Arkel, G.; Pereira, A. The SHINE clade of AP2 domain transcription factors activates wax biosynthesis, alters cuticle properties, and confers drought tolerance when overexpressed in Arabidopsis. Plant Cell 2004, 16, 2463–2480. [Google Scholar] [CrossRef]
  67. Wan, L.; Zhang, J.; Zhang, H.; Zhang, Z.; Quan, R.; Zhou, S.; Huang, R. The transcriptional regulation of OsDERF1 in OsERF3 and OsAP 2–39 suppresses ethylene synthesis and decreases drought tolerance in rice. PLoS ONE 2011, 6, e25216. [Google Scholar] [CrossRef]
  68. Wang, Y.; Wan, L.; Zhang, L.; Zhang, Z.; Zhang, H.; Quan, R.; Zhou, S.; Huang, R. An ethylene response factor OsWR1 responsible to drought stress transcriptionally activates wax synthesis related genes and increases wax production in rice. Plant Mol. Biol. 2012, 8, 275–288. [Google Scholar] [CrossRef]
  69. Mao, Z. Environmental impact of water-saving irrigation for rice. In Irrigation Scheduling: From Theory to Practice, Proceedings of the ICID/FAO Workshop on Irrigation Scheduling, Rome, Italy, 12–13 September 1995; International Commission on Irrigation and Drainage: New Delhi, India, 1996. [Google Scholar]
  70. Hadi, M.H.S.; Darzi, M.; Ashoorabadi, E.S. Study the effects of conventional and low input production system on energy efficiency of Silybum marianum L. World Acad. Sci. Eng. Technol. 2009, 54, 364–366. [Google Scholar]
  71. Laskari, M.; Menexes, G.; Kalfas, I.; Gatzolis, I.; Dordas, C. Water Stress Effects on the Morphological, Physiological Characteristics of Maize (Zea mays L.), and on Environmental Cost. Agronomy 2022, 12, 2386. [Google Scholar] [CrossRef]
  72. Luo, X.; Keenan, T.F. Tropical extreme droughts drive long-term increase in atmospheric CO2 growth rate variability. Nat. Commun. 2022, 13, 1193. [Google Scholar] [CrossRef] [PubMed]
  73. Liu, J.; Bowman, K.W.; Schimel, D.S.; Parazoo, N.C.; Jiang, Z.; Lee, M.; Bloom, A.A.; Wunch, D.; Frankenberg, C.; Sun, Y.; et al. Contrasting carbon cycle responses of the tropical continents to the 2015–2016 El Niño. Science 2017, 358, eaam5690. [Google Scholar] [CrossRef] [PubMed]
  74. Rodenbeck, C.; Zaehle, S.; Keeling, R.; Heimann, M. History of El Niño impacts on the global carbon cycle 1957–2017: A quantification from atmospheric CO2 data. Philos. Trans. R. Soc. Lond. B Biol. Sci. 2018, 373, 20170303. [Google Scholar] [CrossRef]
  75. Wigneron, J.P.; Fan, L.; Ciais, P.; Bastos, A.; Brandt, M.; Chave, J.; Saatchi, S.; Baccini, A.; Fensholt, R. Tropical forests did not recover from the strong 2015–2016 El Niño event. Sci. Adv. 2020, 6, eaay4603. [Google Scholar] [CrossRef]
  76. Yang, H.; Ciais, P.; Wigneron, J.P.; Chave, J.; Cartus, O.; Chen, X.; Fan, L.; Green, J.K.; Huang, Y.; Joetzjer, E.; et al. Climatic and biotic factors influencing regional declines and recovery of tropical forest biomass from the 2015/16 El Niño. PNAS 2022, 119, e2101388119. [Google Scholar] [CrossRef]
  77. Zhao, X.; Pu, C.; Ma, S.T.; Liu, S.L.; Xue, J.F.; Wang, X.; Wang, Y.Q.; Li, S.S.; Lal, R.; Chen, F.; et al. Management-induced greenhouse gases emission mitigation in global rice production. Sci. Total Environ. 2019, 649, 1299–1306. [Google Scholar] [CrossRef]
  78. Shakoor, A.; Ashraf, F.; Shakoor, S.; Mustafa, A.; Rehman, A.; Altaf, M.M. Biogeochemical transformation of greenhouse gas emissions from terrestrial to atmospheric environment and potential feedback to climate forcing. Environ. Sci. Pollut. Res. 2020, 27, 38513–38536. [Google Scholar] [CrossRef]
  79. Intergovernmental Panel on Climate Change (IPCC). Software for National Gas Inventories, Intergovernmental Panel on Climate Change. Available online: https://www.ipcc-nggip.iges.or.jp/public/2006gl/ (accessed on 25 September 2023).
  80. Amnuaylojaroen, T.; Chanvichit, P.; Janta, R.; Surapipith, V. Projection of Rice and Maize Productions in Northern Thailand under Climate Change Scenario RCP8.5. Agriculture 2021, 11, 23. [Google Scholar] [CrossRef]
  81. Molla, M.S.H.; Nakasathien, S.; Sarobol, E.; Vichukit, V. Growth and physiological responses to supra-optimal nitrogen and pre-anthesis drought stress in maize. Agric. Nat. Resour. 2014, 48, 676–688. [Google Scholar]
  82. Molla, M.S.H.; Nakasathien, S.; Sarobol, E.; Vichukit, V. Effects of nitrogen and water on maize varieties under short and prolonged drought. J. Dev. Sustain. Agric. 2014, 9, 97–110. [Google Scholar] [CrossRef]
  83. Farahani, A.; Lebaschi, H.; Hussein, M.; Hussein, S.A.; Reza, V.A.; Jahanfar, D. Effects of arbuscular mycorrhizal fungi, different levels of phosphorus and drought stress on water use efficiency, relative water content and proline accumulation rate of Coriander (Coriandrum sativum L.). J. Med. Plant Res. 2008, 2, 125–131. [Google Scholar]
  84. Diaz-Lopez, E.; Aguilar-Luna, J.M.; Loeza-Corte, J.M. Net assimilation rate and agronomic efficiency of nitrogen in tartago (Ricinus communis L.) (Euphorbiaceae) in dry climate. Scientifica 2020, 2020, 7064745. [Google Scholar] [CrossRef]
  85. Zhao, J.; Marek, T.H.; Liu, K.; Harrison, M.T.; Xue, Q. Drought tolerant maize hybrids have higher yields and lower water use under drought conditions at a regional scale. Agric. Water Manag. 2022, 274, 107978. [Google Scholar] [CrossRef]
  86. Singh, J.; Hadda, M.S. Phenology and thermal indices of maize (Zea mays L.) influenced by subsoil compaction and nitrogen fertilization under semi-arid irrigated conditions. J. Appl. Nat. Sci. 2014, 6, 349–355. [Google Scholar] [CrossRef]
  87. Molla, M.S.H.; Nakasathien, S.; Ali, M.A.; Khan, A.S.M.M.R.; Alam, M.R.; Hossain, A.; Farooq, M.; El Sabagh, A. Influence of nitrogen application on dry biomass allocation and translocation in two maize varieties under short pre-anthesis and prolonged bracketing flowering periods of drought. Arch. Agron. Soil Sci. 2019, 65, 928–944. [Google Scholar] [CrossRef]
  88. Dionisio-Sese, M.L.; Tobita, S. Antioxidant responses of rice seedlings to salinity stress. Plant Sci. 1998, 135, 1–9. [Google Scholar] [CrossRef]
  89. Bates, L.S.; Waldren, R.P.; Teare, I.D. Rapid determination of free proline for water-stress studies. Plant Soil 1973, 39, 205–207. [Google Scholar] [CrossRef]
  90. Irigoyen, J.J.; Emerich, D.W.; Sanchez-Diaz, M. Water stress induced changes in concentrations of proline and total soluble sugars in nodulated alfalfa (Medicago sativa) plants. Physiol. Plant. 1992, 84, 55–60. [Google Scholar] [CrossRef]
  91. Balbaa, M.G.; Osman, H.T.; Kandil, E.E.; Javed, T.; Lamlom, S.F.; Ali, H.M.; Kalaji, H.M.; Wróbel, J.; Telesiñski, A.; Brysiewicz, A.; et al. Determination of morpho-physiological and yield traits of maize inbred lines (Zea mays L.) under optimal and drought stress conditions. Front. Plant Sci. 2022, 13, 959203. [Google Scholar] [CrossRef]
  92. Hou, L.; Yang, Y.; Zhang, X.; Jiang, C. Carbon footprint for wheat and maize production modulated by farm size: A study in the North China plain. Int. J. Clim. Change Strateg. Manag. 2021, 13, 302–319. [Google Scholar] [CrossRef]
  93. Moser, S.B.; Feil, B.; Jampatong, S.; Stamp, P. Effects of pre-anthesis drought, nitrogen fertilizer rate, and variety on grain yield, yield components, and harvest index of tropical maize. Agric. Water Manag. 2006, 81, 41–58. [Google Scholar] [CrossRef]
  94. Nabizadeh, E.; Banifazel, M.; Taherifard, E. The effects of plant growth promoting on some of traits in maize (cv. S.C.704) under drought stress condition. Eur. J. Exp. Biol. 2012, 2, 875–881. [Google Scholar]
  95. Anjum, S.A.; Xie, X.; Wang, L.C.; Saleem, M.F.; Man, C.; Lei, W. Morphological, physiological and biochemical responses of plants to drought stress. Afr. J. Agric. Res. 2011, 6, 2026–2032. [Google Scholar] [CrossRef]
  96. Li, L.L.; Gu, W.R.; Li, C.F.; Li, W.H.; Chen, X.C.; Zhang, L.G.; Wei, S. Dual application of ethephon and DCPTA increases maize yield and stalk strength. Agron. J. 2019, 111, 612–627. [Google Scholar] [CrossRef]
  97. Zhang, Y.; Wang, Y.; Liu, C.; Ye, D.; Ren, D.; Li, Z.; Zhang, M. Ethephon Reduces Maize Nitrogen Uptake but Improves Nitrogen Utilization in Zea mays L. Front. Plant Sci. 2022, 12, 762736. [Google Scholar] [CrossRef]
  98. Karimi, A.; Amirnia, R.; Tajbakhsh, M.; Eivaz, A.R.; Karimi, K. Effect of plant growth inducers on morpho-physiological traits of corn (Zea mays L). Life Sci. 2012, 9, 1683–1688. [Google Scholar]
  99. Begum, N.; Ahanger, M.A.; Su, Y.; Lei, Y.; Mustafa, N.S.A.; Ahmad, P.; Zhang, L. Improved Drought Tolerance by AMF Inoculation in Maize (Zea mays) Involves Physiological and Biochemical Implications. Plants 2019, 8, 579. [Google Scholar] [CrossRef]
  100. Kępczyńska, E.; Zielińska, S. The role of endogenous ethylene in carbohydrate metabolism of Medicago sativa L. somatic embryos in relation to their regenerative ability. J. Plant Growth Regul. 2013, 32, 191–199. [Google Scholar] [CrossRef]
  101. Golbashy, M.; Ebrahimi, M.; Khavari, K.S.; Choucan, R. Evaluation of drought tolerance of some corn (Zea mays L.) hybrids in Iran. Afr. J. Agric. Res. 2010, 5, 2714–2719. [Google Scholar]
  102. Araus Ortega, J.L.; Serret Molins, M.D.; Edmeades, G.O. Phenotyping maize for adaptation to drought. Front. Physiol. 2012, 3, 305. [Google Scholar] [CrossRef]
  103. Coque, M.; Gallais, A. Genetic variation for nitrogen remobilization and post-silking nitrogen uptake in maize recombinant inbred lines: Heritabilities and correlations among traits. Crop Sci. 2007, 47, 1787–1796. [Google Scholar] [CrossRef]
  104. Chen, Y.L.; Xiao, C.X.; Wu, D.L.; Xia, T.T.; Chen, Q.W.; Chen, F.J. Effects of nitrogen application rate on grain yield and grain nitrogen concentration in two maize hybrids with contrasting nitrogen remobilization efficiency. Eur. J. Agron. 2015, 62, 79–89. [Google Scholar] [CrossRef]
  105. Iqbal, N.; Khan, N.A.; Ferrante, A.; Trivellini, A.; Francini, A.; Khan, M.I.R. Ethylene role in plant growth and senescence: Interaction with other phytohormones. Front. Plant Sci. 2017, 8, 475. [Google Scholar] [CrossRef] [PubMed]
  106. Maillard, A.; Diquélou, S.; Billard, V.; Laîné, P.; Garnica, M.; Prudent, M.; Garcia-Mina, J.-M.; Yvin, J.-C.; Ourry, A. Leaf mineral nutrient remobilization during leaf senescence and modulation by nutrient deficiency. Front. Plant Sci. 2015, 6, 317. [Google Scholar] [CrossRef] [PubMed]
  107. Farooq, M.; Aziz, T.; Wahid, A.; Lee, D.J.; Siddique, K.H. Chilling tolerance in maize: Agronomic and physiological approaches. Crop Pasture Sci. 2009, 60, 501–516. [Google Scholar] [CrossRef]
  108. Liu, H.; Able, A.J.; Able, J.A. Priming crops for the future: Rewiring stress memory. Trends Plant Sci. 2021, 27, 699–716. [Google Scholar] [CrossRef] [PubMed]
  109. Wang, Y.; Janz, B.; Engedal, T.; Neergaard, A. Effect of irrigation regimes and nitrogen rates on water use efficiency and nitrogen uptake in maize. Agric. Water Manag. 2016, 179, 271–276. [Google Scholar] [CrossRef]
  110. Malo, M.; Ghosh, A. Studies on different agrometeorological indices and thermal use efficiencies of rice in New Alluvial Zone of West Bengal. Bull. Env. Pharmacol. Life Sci. 2018, 7, 72–78. [Google Scholar]
  111. Horvath, E.; Gombos, B.; Szeles, A. Evaluation phenology, yield and quality of maize genotypes in drought stress and non-stress environments. Agron. Res. 2021, 19, 408–422. [Google Scholar] [CrossRef]
  112. Ye, D.; Wang, Y.; Zhou, L.; Li, J.; Duan, L.; Zhang, M.; Li, Z. Effect of ethephon and nitrogen fertilizer on nitrogen uptake, nitrogen use efficiency and yield of summer maize. Acta Agron. Sin. 2015, 41, 1701–1710. [Google Scholar] [CrossRef]
  113. Yu, H.; Zhang, Y.; Xie, Y.; Wang, Y.; Duan, L.; Zhang, M.; Li, Z. Ethephon improved drought tolerance in maize seedlings by modulating cuticular wax biosynthesis and membrane stability. J. Plant Physiol. 2017, 214, 123–133. [Google Scholar] [CrossRef] [PubMed]
  114. Zhang, J.; Kirkham, M.B. Water status of drought-resistant and drought-sensitive sorghum treated with ethephon. J. Plant Growth Regulat. 1990, 9, 189–194. [Google Scholar] [CrossRef]
  115. Shen, S.; Li, B.B.; Deng, T.; Xiao, Z.D.; Chen, X.M.; Hu, H.; Zhang, B.C.; Wu, G.; Li, F.; Zhao, X.; et al. The equilibrium between sugars and ethylene is involved in shading-and drought-induced kernel abortion in maize. Plant Growth Regul. 2020, 91, 101–111. [Google Scholar] [CrossRef]
  116. Bolaños, J.; Edmeades, G.O. The importance of the anthesis-silking interval in breeding for drought tolerance in tropical maize. Field Crop. Res. 1996, 48, 65–80. [Google Scholar] [CrossRef]
  117. El-Badawy, M.; El, M.; Mehasen, S.A.S. Multivariate Analysis For Yield and Its Components In Maize Under Zinc and Nitrogen Fertilization Levels. Aust. J. Basic Appl. Sci. 2011, 5, 3008–3015. [Google Scholar]
  118. Chen, K.; Camberato, J.J.; Vyn, T.J. Maize Grain Yield and Kernel Component Relationships to Morpho-physiological Traits in Commercial Hybrids Separated by Four Decades. Crop Sci. 2017, 57, 1641–1657. [Google Scholar] [CrossRef]
  119. Dewey, D.R.; Lu, K.H. A correlation and path coefficient analysis of components of crescent wheat grass seed production. Agron. J. 1959, 51, 515–518. [Google Scholar] [CrossRef]
  120. Aslam, M.; Khan, N.A.; Mirza, M.S.; Khan, A.R. Correlation and path coefficient analysis for yield components in soybean. Pak. J. Agric. Res. 1992, 13, 20–25. [Google Scholar]
  121. Lenka, D.; Mishra, B. Path coefficient analysis of yield in rice varieties. Ind. J. Agric. Sci. 1973, 43, 376–379. [Google Scholar]
  122. Ahmadizadeh, M.; Valizadeh, M.; Zaefizadeh, M.; Shahbazi, H. Antioxidative protection and electrolyte leakage in durum wheat under drought stress condition. J. Appl. Sci. Res. 2011, 7, 236–246. [Google Scholar]
  123. Sarvajeet, S.G.; Narendra, T. Reactive oxygen species and antioxidant machinery in a biotic stress tolerance in crop plants. Plant Physiol. Biochem. 2010, 3, 909–930. [Google Scholar] [CrossRef]
  124. Poudel, S.; Bhattarai, S.; Sherpa, T.; Karki, A.; Hyun, D.; Kafle, S. The energy input-output analysis of maize production in Sundarharaincha Municipality, Morang district, Nepal. IOP Conf. Ser. Earth Environ. Sci. 2019, 301, 012027. [Google Scholar] [CrossRef]
  125. Zhang, Q.; Zhang, L.; Chai, M.; Yang, D.; van der Werf, W.; Evers, J. Use of EDAH improves maize morphological and mechanical traits related to lodging. Agron. J. 2019, 111, 581–591. [Google Scholar] [CrossRef]
  126. Zhang, W.; Yu, C.; Zhang, K.; Zhou, Y.; Tan, W.; Zhang, L. Plant growth regulator and its interactions with environment and genotype affect maize optimal plant density and yield. Eur. J. Agron. 2017, 91, 34–43. [Google Scholar] [CrossRef]
  127. Huang, X.; Chen, C.; Qian, H.; Chen, M.; Deng, A.; Zhang, J.; Zhang, W. Quantification for carbon footprint of agricultural inputs of grains cultivation in China since 1978. J. Clean. Prod. 2017, 142, 1629–1637. [Google Scholar] [CrossRef]
  128. Cheng, K.; Pan, G.; Smith, P.; Luo, T.; Li, L.; Zheng, J.; Zhang, X.; Han, X.; Yan, M. Carbon footprint of China’s crop production—An estimation using agro-statistics data over 1993–2007. Agric. Ecosyst. Environ. 2011, 142, 231–237. [Google Scholar] [CrossRef]
  129. Yan, M.; Cheng, K.; Luo, T.; Yan, Y.; Pan, G.; Rees, R.M. Carbon footprint of grain crop production in China—Based on farm survey data. J. Clean. Prod. 2015, 104, 130–138. [Google Scholar] [CrossRef]
  130. Climate Change Knowledge Portal. Thailand 1991–2020. Available online: https://climateknowledgeportal.worldbank.org/country/thailand/climate-data-historical (accessed on 25 September 2023).
  131. Lorzadeh, S.H.; Mahdavidamghani, A.; Enayatgholizadeh, M.R.; Yousefi, M. Agrochemical input application and energy use efficiency of maize production systems in Dezful, Iran. Middle East J. Sci. Res. 2011, 9, 153–156. [Google Scholar]
  132. Vural, H.; Efecan, I. An analysis of energy use and input costs for maize production in Turkey. J. Food Agric. Environ. 2012, 10, 613–616. [Google Scholar]
  133. Erdal, G.; Esengun, K.; Erdal, H.; Gunduz, O. Energy use and economical analysis of sugar beet production in Tokat province of Turkey. Energy 2007, 32, 35–41. [Google Scholar] [CrossRef]
  134. Zhelyazkova, T. Nutritive value and energy efficiency of winter pea production, treated with plant growth regulators. Trakia J. Sci. 2010, 8, 44–51. [Google Scholar]
  135. Shahin, R.; Mousavi-Avval, S.; Mohammadi, A. Modeling and sensitivity analysis of energy inputs for apple production in Iran. Energy 2010, 35, 3301–3306. [Google Scholar] [CrossRef]
  136. Yousefi, M.; Mohammadi, A. Economical analysis and energy use efficiency in alfalfa production systems in Iran. Sci. Res. Essays 2011, 6, 2332–2336. [Google Scholar] [CrossRef]
  137. Zhang, W.; Dou, Z.; Hea, P.; Jua, X.; Powlson, D.; Chadwick, D.; Norse, D.; Lu, Y.; Zhang, Y.; Wu, L.; et al. New technologies reduce greenhouse gas emissions from nitrogenous fertilizer in China. Proc. Natl. Acad. Sci. USA 2013, 110, 8375–8380. [Google Scholar] [CrossRef] [PubMed]
  138. West, T.; Marland, G. A synthesis of carbon sequestration, carbon emissions, and net carbon flux in agriculture: Comparing tillage practices in the United States. Agric. Ecosyst. Environ. 2002, 91, 217–232. [Google Scholar] [CrossRef]
  139. Zhu, Y.; Waqas, M.; Li, Y.; Zou, X.; Jiang, D.; Wilkes, A.; Qin, X.; Gao, Q.; Wan, Y.; Hasbagan, G. Large-scale farming operations are win-win for grain production, soil carbon storage and mitigation of greenhouse gases. J. Clean. Prod. 2018, 172, 2143–2152. [Google Scholar] [CrossRef]
Figure 1. Schematic view of watering (W1: well-watered conditions; W2: short water stress during 48 to 69 days after planting (DAP); W3: prolonged water stress during 48–83 DAP) and ethephon (E1: ethephon 281 g a.i. ha−1 at V6 stage; E2: ethephon 281 g a.i. ha−1 at V6 + 281 g a.i. ha−1 at V10 stage; E3: ethephon 281 g a.i. ha−1 at V10 stage; E4: ethephon 562 g a.i. ha-1 at V6 stage; E5: ethephon 562 g a.i. ha−1 at V6 + 562 g a.i. ha−1 at V10 stage; E6: ethephon 562 g a.i. ha−1 at V10 stage; E7: no ethephon) application schedule with important growth stages of maize (considering well-watered (WW) plant—VE: vegetative emergence; V6: vegetative 6 leaves stage at 30 days after planting (DAP); V10: vegetative 10 leaves stage at 42 DAP; VT: vegetative tasseling stage at 63 DAP; R3: reproductive phase 3 at 79 DAP; R6: maturity stage).
Agronomy 13 02673 g001
Figure 2. Experimental field soil moisture tension at 0–30 cm depth during the water stress period under well-watered conditions (W1), short water stress (W2), and prolonged water stress (W3) is shown at the lower part. X: no irrigation in W2; X: no irrigation in W3. The weather pattern during the water stress period is shown in the upper part.
Agronomy 13 02673 g002
Figure 3. Path diagram and association of different morphological (left side) and physio-biochemical traits (right side) under prolonged water stress. Single arrows denote the direct effect (P) on grain yield (GY); double arrows denote the correlation coefficient (r) between traits. R3: reproductive phase 3 of maize plant at 79 DAP considering WW; PH-R3: plant height at R3; SD-R3: stem diameter at R3; LAI-R3: leaf area index at R3; SW-R3: shoot weight at R3; GNP: grain number per plant; 100-GW: 100-grain weight; NAR-V6R3: net assimilation rate at V6-R3; JAWSP: just after water stress period; SPAD-JAWSP: SPAD value for leaf greenness at JAWSP; RWC-JAWSP: relative water content at JAWSP; EL-JAWSP: electrolyte leakage at JAWSP; PrL-JAWSP: proline in leaves at JAWSP; TSSL-JAWSP: total soluble sugar in leaves at JAWSP.
Agronomy 13 02673 g003
Figure 4. Radar plot showing drought tolerance index (DTI) values for 18 studied traits under 7 ethephon levels in (a) short water stress and (b) prolonged water stress. The numbers shown in red in the graphic indicate the whole DTI scale. R3: reproductive phase 3 of maize plant; V6: vegetative 6 leaves stage; V10: vegetative 10 leaves stage; PH-R3: plant height at R3; SD-R3: stem diameter at R3; LAI-R3: leaf area index at R3; SW-R3: shoot weight at R3; RGR-V6R3: relative growth rate at V6-R3; NAR-V6R3: net assimilation rate at V6-R3; WP: water productivity; AGDD: accumulated growing degree days; HUE: heat use efficiency; JAWSP: just after water stress period; SPAD-JAWSP: SPAD value for leaf greenness JAWSP; RSR-R3: relative senescence rate at R3; RWC-JAWSP: relative water content JAWSP; EL-JAWSP: electrolyte leakage JAWSP; PrL-JAWSP: proline in leaves JAWSP; TSSL-JAWSP: total soluble sugar in leaves JAWSP; GNP: grain number per plant; 100-GW: 100-grain weight; GY: grain yield.
Agronomy 13 02673 g004
Table 1. Physico-chemical properties of experimental field soil collected from depth of 0 to 30 cm.
ParameterSand
(%)
Silt
(%)
Clay
(%)
pH
(Acetate)
EC
(dS m−1)
OM
(%)
Total N
(%)
Available P
(mg kg−1)
Exchangeable K
(mg kg−1)
Value10.0037.3352.677.770.222.010.28166.00296.67
StatusSilty clay soilSlightly alkalineNormalMediumMediumVery highVery high
Table 2. Analysis of variance as it relates to water levels, ethephon, and their interaction effects on different morphological traits of maize in the field.
Source of VariancedfMean Sum Square
PH-R3
(cm)
SD-R3
(cm)
FEGLA-V6
(cm2 plant−1)
FEGLA-V10
(cm2 plant−1)
FEGLA-R3
(cm2 plant−1)
LAI-R3SW-V6
(g plant−1)
SW-V10
(g plant−1)
SW-R3
(g plant−1)
GNP
(no.)
100-GW
(g)
GY
(t ha−1)
Replication3616.30.0718,455115,975271,9880.092.6418.815711697.38.000.31
Water levels (W)211,065.8 **0.26 **41,037 **248.35 ns2615.07 **8.52 **7.16 **1.33 ns208,132 **3452.9 **18.58 **29.40 **
Ethephon (E)63400.4 **0.20 **14,951 ns271.07 **6674.07 **21.83 **1.94 ns2334.40 **98,659 **580.5 ns0.49 *30.99 **
W × E1213,384.1 **0.19 *37,202 ns38,673.0 ns5,910,228 **1.93 **4.31 ns11.45 ns71,474 **0.2 ns0.00 ns16.60 **
Error603466.60.43113,412816,2811,670,2320.5416.43133.03376010,457.949.302.06
R3: reproductive phase 3 of maize plant at 79 days after planting (DAP) considering well-watered (WW) plant; V6: vegetative 6 leaves stage at 30 DAP considering WW; V10: vegetative 10 leaves stage at 42 DAP considering WW; PH-R3: plant height at R3; SD-R3: stem diameter at R3; FEGLA-V6, FEGLA-V10, and FEGLA-R3: fully expanded green leaf area at V6, V10, and R3, respectively; LAI-R3: leaf area index at R3; SW-V6, SW-V10, and SW-R3: shoot weights at V6, V10, and R3, respectively; GNP: grain number per plant; 100-GW: 100-grain weight; GY: grain yield; * and **: significant at p < 0.05 and p < 0.01 levels, respectively; ns: nonsignificant; df: degree of freedom.
Table 3. Analysis of variance as it relates to water levels, ethephon, and their interaction effects on different physiological traits of maize in the field.
Source of VariancedfMean Sum Square
RGR-V6V10
(mg plant−1 day−1)
RGR-V10R3
(mg plant−1 day−1)
RGR-V6R3
(mg plant−1 day−1)
NAR-V6V10
(mg cm−2 day−1)
NAR-V10R3
(mg cm−2 day−1)
NAR-V6R3
(mg cm−2 day−1)
WP
(kg m−3)
AGDD
(°C days)
HUE
(kg ha−1 °C days−1)
Replication316.195.097.170.0020.010.010.0139,9640.10
Water levels (W)238.96 **661.73 **380.63 **0.005 **1.11 **1.20 **0.03 **93,870 **12.86 **
Ethephon (E)61875.72 **225.72 **197.52 **0.322 **0.35 **0.60 **1.25 **47,406 ns9.35 **
W × E1232.33 ns210.33 **115.34 **0.008 *0.33 **0.46 **0.59 **10,750 ns5.82 **
Error60116.0131.0746.150.0180.030.040.08251,8750.68
V6: vegetative 6 leaves stage of maize plant at 30 days after planting (DAP) considering well-watered (WW) plant; V10: vegetative 10 leaves stage at 42 DAP considering WW; R3: reproductive phase 3 at 79 DAP considering WW; RGR-V6V10, RGR-V10R3, and RGR-V6R3: relative growth rates at V6-V10, V10-R3, and V6-R3, respectively; NAR-V6V10, NAR-V10R3, and NAR-V6R3: net assimilation rates at V6-V10, V10-R3, and V6-R3, respectively; WP: water productivity at final harvest; AGDD: accumulated growing degree days; HUE: heat use efficiency at final harvest; * and **: significant at p < 0.05 and p < 0.01 levels, respectively; ns: nonsignificant; df: degree of freedom.
Table 4. Analysis of variance as it relates to water levels, ethephon, and their interaction effects on different physio-biochemical traits of maize in the field.
Source of VariancedfMean Sum Square
SPAD-JAWSPRSR-R3
(%)
RWC-JAWSP
(%)
EL-JAWSP
(%)
PrL-JAWSP
(µmol g−1 FW)
TSSL-JAWSP
(mg g−1 FW)
Replication325.880.0693.870.427.7452,462.9
Water levels (W)21026.69 **4.83 **2108.57 **177.23 **5266.61 **5544.07 **
Ethephon (E)6190.05 **1.18 **695.38 **22.05 **866.21 **1925.07 **
W × E1244.65 ns0.65 **196.65 ns10.80 **225.28 **4,130,239 **
Error60159.380.40588.423.1755.83470,809
JAWSP: just after water stress period; R3: reproductive phase 3 of maize plant at 79 DAP considering WW; SPAD-JAWSP: SPAD value for leaf greenness at JAWSP; RSR-R3: relative senescence rate at R3; RWC-JAWSP: relative water content at JAWSP; EL-JAWSP: electrolyte leakage at JAWSP; PrL-JAWSP: proline in leaves at JAWSP; TSSL- JAWSP: total soluble sugar in leaves at JAWSP; **: p < 0.01 levels; ns: nonsignificant; df: degree of freedom.
Table 5. The main effects of water levels on different morphological traits of maize in the field. Data presented are mean values, where LSD0.05 is the Least Significant Difference at the 0.05 significance level.
Source of VariationPH-R3
(cm)
SD-R3
(cm)
FEGLA-V6
(cm2 plant−1)
FEGLA-V10
(cm2 plant−1)
FEGLA-R3
(cm2 plant−1)
LAI-R3SW-V6
(g plant−1)
SW-V10
(g plant−1)
SW-R3
(g plant−1)
GNP
(no.)
100-GW
(g)
GY
(t ha−1)
W1219.25a2.39a1172.26b3134.625367.53a3.07a14.02b39.93275.02a363.27a24.91a5.71a
W2210.63b2.30b1207.18a3131.144455.24b2.55b14.61a40.19186.00b358.40a24.64a4.82b
W3195.09c2.25b1153.89b3134.944030.16c2.30c13.97b40.19158.35c347.90b23.81b4.27c
F test (W)******ns******ns********
LSD0.054.060.0523.2462.3689.200.060.280.804.237.060.480.10
** significant at p < 0.01; ns = nonsignificant; means within a column with the same or no letters are not significant at p < 0.05 based on the LSD test. W1: well-watered conditions; W2: short water stress during 48 to 62 days after planting (DAP); W3: prolonged water stress during 48–79 DAP; R3: reproductive phase 3 of maize plant at 79 days after planting (DAP) considering well-watered (WW) plant; V6: vegetative 6 leaves stage at 30 DAP considering WW; V10: vegetative 10 leaves stage at 42 DAP considering WW; PH-R3: plant height at R3; SD-R3: stem diameter at R3; FEGLA-V6, FEGLA-V10, and FEGLA-R3: fully expanded green leaf area at V6, V10, and R3, respectively; LAI-R3: leaf area index at R3; SW-V6, SW-V10, and SW-R3: shoot weight at V6, V10, and R3, respectively; GNP: grain number per plant; 100-GW: 100-grain weight; GY: grain yield.
Table 6. The main effects of ethephon application levels on different morphological traits of maize in the field. Data presented are mean values, where LSD0.05 is the Least Significant Difference at the 0.05 significance level.
Source of VariationPH-R3
(cm)
SD-R3
(cm)
FEGLA-V6
(cm2 plant−1)
FEGLA-V10
(cm2 plant−1)
FEGLA-R3
(cm2 plant−1)
LAI-R3SW-V6
(g plant−1)
SW-V10
(g plant−1)
SW-R3
(g plant−1)
GNP
(no.)
100-GW
(g)
GY
(t ha−1)
E1217.62ab2.35ab1159.65b3063.74b5142.09c2.94c14.09ab38.69b219.37c356.1224.52ab5.11c
E2204.78c2.31bc1193.87ab3079.82b3781.06f2.16f14.01b38.85b174.67f354.3424.43ab4.49d
E3217.92ab2.39a1173.00ab3527.48a5427.25b3.10b14.15ab45.30a260.67a357.4424.90a5.96a
E4211.98b2.26cd1176.52ab2592.77c4122.33e2.36e14.33ab33.18c185.17e355.5824.44ab4.53d
E5204.73c2.24d1175.46ab2601.95c3234.95g1.85g14.06ab33.04c158.83g353.3524.17b4.18e
E6203.58c2.30bcd1199.92a3523.98a4667.30d2.67d14.44a45.42a243.50b356.6724.44ab5.63b
E7218.64a2.33ab1166.01ab3545.22a5948.52a3.40a14.32ab46.25a202.98d352.1424.38ab4.63d
F test (W)****ns******ns****ns***
LSD0.056.210.0735.5095.25135.250.120.431.226.4610.780.640.15
* and ** mean significant at p < 0.05 and p < 0.01 levels, respectively; ns = nonsignificant; means within a column with the same or no letters are not significant at p < 0.05 based on the LSD test. E1: ethephon 281 g a.i. ha−1 at V6 stage; E2: ethephon 281 g a.i. ha−1 at V6 + 281 g a.i. ha−1 at V10 stage; E3: ethephon 281 g a.i. ha−1 at V10 stage; E4: ethephon 562 g a.i. ha−1 at V6 stage; E5: ethephon 562 g a.i. ha−1 at V6 + 562 g a.i. ha−1 at V10 stage; E6: ethephon 562 g a.i. ha−1 at V10 stage; E7: no ethephon; R3: reproductive phase 3 of maize plant at 79 days after planting (DAP) considering well-watered (WW) plant; V6: vegetative 6 leaves stage at 30 DAP considering WW; V10: vegetative 10 leaves stage at 42 DAP considering WW; PH-R3: plant height at R3; SD-R3: stem diameter at R3; FEGLA-V6, FEGLA-V10, and FEGLA-R3: fully expanded green leaf area at V6, V10, and R3, respectively; LAI-R3: leaf area index at R3; SW-V6, SW-V10, and SW-R3: shoot weight at V6, V10, and R3, respectively; GNP: grain number per plant; 100-GW: 100-grain weight; GY: grain yield.
Table 7. Interaction effects of water levels and ethephon applications on different morphological traits of maize in the field. Data presented are mean values, where LSD0.05 is the Least Significant Difference at the 0.05 significance level.
Source of VariationPH-R3
(cm)
SD-R3
(cm)
FEGLA-V6
(cm2 plant−1)
FEGLA-V10
(cm2 plant−1)
FEGLA-R3
(cm2 plant−1)
LAI-R3SW-V6
(g plant−1)
SW-V10
(g plant−1)
SW-R3
(g plant−1)
GNP
(no.)
100-GW
(g)
GY
(t ha−1)
W1E1223.11c2.39bc1177.033058.125944.34c3.40b13.8839.11278.12d362.8524.985.32ef
W1E2204.66ef2.39bc1217.793106.054398.85h2.51ef14.1139.22221.50f361.0424.895.03gh
W1E3221.21cd2.43b1157.083536.116242.67b3.57b13.8845.38317.00b364.2125.076.74ab
W1E4211.48de2.30c-g1124.872561.134429.98gh2.53e13.7832.81240.50e362.3124.904.89hi
W1E5200.38fg2.29c-g1160.242629.203769.79ij2.15hi13.8332.34203.50h360.0324.824.67ij
W1E6225.64bc2.34b-e1211.433521.315379.77de3.07c14.3545.12295.00c363.4224.906.50b
W1E7248.25a2.57a1157.383530.427407.31a4.23a14.3045.52369.50a369.0024.846.79a
W2E1231.21bc2.38bc1168.313046.105159.51ef2.95c14.2838.34221.00fg357.9924.715.62cd
W2E2225.87bc2.31b-f1188.563032.053593.63j2.05hi14.0038.51167.50i356.2024.624.55jk
W2E3234.65b2.39bc1222.583551.125388.99de3.08c14.7145.00240.50e359.3224.795.75c
W2E4230.70bc2.25d-g1248.602605.043948.50i2.26gh14.8033.39172.50i357.4624.634.65ij
W2E5229.36bc2.23efg1198.702598.343049.42l1.74jk14.4333.86148.00kl355.2124.554.16lm
W2E6182.76i2.28c-g1237.853540.214641.48g2.65de15.0945.40225.50f358.5424.635.29efg
W2E7202.84efg2.23efg1185.663545.125405.16d3.09c14.9746.84127.00n364.0524.573.74n
W3E1198.54fg2.29c-g1133.623087.014322.42h2.47efg14.1138.61159.00jk347.5123.874.38kl
W3E2183.81hi2.23efg1175.273101.353350.71k1.91ij13.9238.83135.00mn345.7723.793.90mn
W3E3197.90fg2.36bcd1139.333495.214650.09g2.66de13.8645.52224.50f348.8023.965.38de
W3E4193.76gh2.23efg1156.082612.143988.52i2.28fgh14.4233.33142.50lm346.9923.804.05m
W3E5184.47hi2.19g1167.442578.302885.64l1.65k13.9032.92125.00n344.8023.723.70n
W3E6202.33efg2.27c-g1150.483510.413980.65i2.27fgh13.8945.75210.00gh348.0423.805.10fgh
W3E7204.82ef2.20fg1155.003560.135033.11f2.88cd13.6946.40112.45o353.3923.743.37o
F test (W)***nsns****nsns**nsns**
LSD0.0510.750.12--235.990.25--11.20--0.26
* and ** mean significant at p < 0.05 and p < 0.01 levels, respectively; ns = nonsignificant; means within a column with the same or no letters are not significant at p < 0.05 based on the LSD test. W1: well-watered conditions; W2: short water stress during 48 to 62 days after planting (DAP); W3: prolonged water stress during 48–79 DAP; E1: ethephon 281 g a.i. ha−1 at V6 stage; E2: ethephon 281 g a.i. ha−1 at V6 + 281 g a.i. ha−1 at V10 stage; E3: ethephon 281 g a.i. ha−1 at V10 stage; E4: ethephon 562 g a.i. ha−1 at V6 stage; E5: ethephon 562 g a.i. ha−1 at V6 + 562 g a.i. ha−1 at V10 stage; E6: ethephon 562 g a.i. ha−1 at V10 stage; E7: no ethephon; R3: reproductive phase 3 of maize plant at 79 days after planting (DAP) considering well-watered (WW) plant; V6: vegetative 6 leaves stage at 30 DAP considering WW; V10: vegetative 10 leaves stage at 42 DAP considering WW; PH-R3: plant height at R3; SD-R3: stem diameter at R3; FEGLA-V6, FEGLA-V10, and FEGLA-R3: fully expanded green leaf area at V6, V10, and R3, respectively; LAI-R3: leaf area index at R3; SW-V6, SW-V10, and SW-R3: shoot weight at V6, V10, and R3, respectively; GNP: grain number per plant; 100-GW: 100-grain weight; GY: grain yield.
Table 8. The main effects of water levels on different physiological traits of maize in the field. Data presented are mean values, where LSD0.05 is the Least Significant Difference at the 0.05 significance level.
Source of VariationRGR-V6V10
(mg plant−1 day−1)
RGR-V10R3
(mg plant−1 day−1)
RGR-V6R3
(mg plant−1 day−1)
NAR-V6V10
(mg cm−2 day−1)
NAR-V10R3
(mg cm−2 day−1)
NAR-V6R3
(mg cm−2 day−1)
WP
(kg m−3)
AGDD
(°C days)
HUE
(kg ha−1 °C days−1)
W1.37.55a22.54a26.21a0.47a0.66a0.84a0.97b1705.72b3.34a
W236.33b17.80b22.34b0.46b0.46b0.61b0.95c1774.20a2.72b
W337.92a15.85c21.26c0.47a0.39c0.56c1.00a1778.84a2.40c
F test (W)******************
LSD0.050.740.380.470.0010.010.010.0234.640.06
** significant at p < 0.01; means within a column with the same or no letters are not significant at p < 0.05 based on the LSD test. W1: well-watered conditions; W2: short water stress during 48 to 62 days after planting (DAP); W3: prolonged water stress during 48–79 DAP; R3: reproductive phase 3 of maize plant at 79 days after planting (DAP) considering well-watered (WW) plant; V6: vegetative 6 leaves stage at 30 DAP considering WW; V10: vegetative 10 leaves stage at 42 DAP considering WW; RGR-V6V10, RGR-V10R3, and RGR-V6R3: relative growth rates at V6-V10, V10-R3, and V6-R3, respectively; NAR-V6V10, NAR-V10R3, and NAR-V6R3: net assimilation rates at V6-V10, V10-R3, and V6-R3, respectively; WP: water productivity at final harvest; AGDD: accumulated growing degree days; HUE: heat use efficiency at final harvest.
Table 9. The main effects of ethephon application levels on different physiological traits of maize in the field. Data presented are mean values, where LSD0.05 is the Least Significant Difference at the 0.05 significance level.
Source of VariationRGR-V6V10
(mg plant−1 day−1)
RGR-V10R3
(mg plant−1 day−1)
RGR-V6R3
(mg plant−1 day−1)
NAR-V6V10
(mg cm−2 day−1)
NAR-V10R3
(mg cm−2 day−1)
NAR-V6R3
(mg cm−2 day−1)
WP
(kg m−3)
AGDD
(°C days)
HUE
(kg ha−1 °C days−1)
E136.56b20.07ab24.11c0.45c0.52c0.67b1.01c1757.47ab2.91c
E236.92b17.40d22.18d0.45c0.46e0.63c0.89d1734.69b2.60d
E342.12a20.41a25.73a0.53ab0.57a0.79a1.18a1757.47ab3.39a
E430.39c19.90ab22.47d0.38d0.54b0.64c0.90d1734.69b2.62d
E530.93c18.19c21.31e0.38d0.50d0.62c0.83e1723.13b2.43e
E641.49a19.58b24.95b0.52b0.57a0.79a1.11b1762.46ab3.20b
E742.45a15.56e22.15d0.54a0.37f0.54d0.89d1800.53a2.60d
F test (W)**************ns**
LSD0.051.140.590.720.010.020.020.0352.910.09
** significant at p < 0.01; ns = nonsignificant; means within a column with the same or no letters are not significant at p < 0.05 based on the LSD test. E1: ethephon 281 g a.i. ha−1 at V6 stage; E2: ethephon 281 g a.i. ha−1 at V6 + 281 g a.i. ha−1 at V10 stage; E3: ethephon 281 g a.i. ha−1 at V10 stage; E4: ethephon 562 g a.i. ha−1 at V6 stage; E5: ethephon 562 g a.i. ha−1 at V6 + 562 g a.i. ha−1 at V10 stage; E6: ethephon 562 g a.i. ha−1 at V10 stage; E7: no ethephon; R3: reproductive phase 3 of maize plant at 79 days after planting (DAP) considering well-watered (WW) plant; V6: vegetative 6 leaves stage at 30 DAP considering WW; V10: vegetative 10 leaves stage at 42 DAP considering WW; RGR-V6V10, RGR-V10R3, and RGR-V6R3: relative growth rates at V6-V10, V10-R3, and V6-R3, respectively; NAR-V6V10, NAR-V10R3, and NAR-V6R3: net assimilation rates at V6-V10, V10-R3, and V6-R3, respectively; WP: water productivity at final harvest; AGDD: accumulated growing degree days; HUE: heat use efficiency at final harvest.
Table 10. Interaction effects of water levels and ethephon applications on different physiological traits of maize in the field. Data presented are mean values, where LSD0.05 is the Least Significant Difference at the 0.05 significance level.
Source of VariationRGR-V6V10
(mg plant−1 day−1)
RGR-V10R3
(mg plant−1 day−1)
RGR-V6R3
(mg plant−1 day−1)
NAR-V6V10
(mg cm−2 day−1)
NAR-V10R3
(mg cm−2 day−1)
NAR-V6R3
(mg cm−2 day−1)
WP
(kg m−3)
AGDD
(°C days)
HUE
(kg ha−1 °C days−1)
W1E137.4923.03bc26.57bc0.46d0.65bc0.80d0.91efg1723.123.09bcd
W1E237.0120.32e24.41de0.45d0.58d0.74ef0.86gh1688.352.98de
W1E342.8622.82bc27.73ab0.54a0.67b0.89b1.15bc1723.123.91a
W1E431.3923.38b25.34cd0.39e0.71a0.83c0.83hi1688.352.90ef
W1E530.7421.59d23.83e0.37f0.63c0.76de0.79i1688.352.77fg
W1E641.4622.04cd26.80b0.51bc0.67b0.89b1.11c1705.643.81a
W1E741.9124.58a28.82a0.53ab0.73a0.94a1.16bc1723.123.94a
W2E135.7520.56e24.28de0.44d0.53e0.68g1.11c1774.653.17bc
W2E236.6317.25hi22.00f0.45d0.46f0.63h0.90fg1757.872.59hi
W2E340.4719.67ef24.77de0.50c0.52e0.71fg1.13c1774.653.24b
W2E429.4519.27f21.77fg0.36f0.51e0.60h0.92ef1757.872.65gh
W2E530.8617.31hi20.63ghi0.39ef0.48f0.60h0.82hi1740.532.39jk
W2E639.8718.81fg23.97e0.50c0.52e0.72ef1.04d1774.652.98de
W2E741.2811.71l18.95jk0.54ab0.21i0.36k0.74j1839.232.03n
W3E136.4416.61ij21.47fgh0.45d0.39g0.54i1.02d1774.652.47ij
W3E237.1214.63k20.14ij0.45d0.35h0.52ij0.91ef1757.872.22lm
W3E343.0418.73fg24.68de0.55a0.52e0.76e1.26a1774.653.03cde
W3E430.3317.05hi20.30hi0.38ef0.39g0.50j0.95e1757.872.30kl
W3E531.2115.66j19.47ijk0.39ef0.40g0.52ij0.87fgh1740.532.13mn
W3E643.1517.89gh24.07e0.55a0.52e0.76de1.19b1807.092.82f
W3E744.1710.39m18.66k0.55a0.18j0.33k0.79i1839.231.83o
F test (W)ns***********ns**
LSD0.05-1.021.240.020.030.040.05-0.15
* and ** significant at p < 0.05 and p < 0.01 levels, respectively; ns = nonsignificant; means within a column with the same or no letters are not significant at p < 0.05 based on the LSD test. W1: well-watered conditions; W2: short water stress during 48 to 62 days after planting (DAP); W3: prolonged water stress during 48–79 DAP; E1: ethephon 281 g a.i. ha−1 at V6 stage; E2: ethephon 281 g a.i. ha−1 at V6 + 281 g a.i. ha−1 at V10 stage; E3: ethephon 281 g a.i. ha−1 at V10 stage; E4: ethephon 562 g a.i. ha−1 at V6 stage; E5: ethephon 562 g a.i. ha−1 at V6 + 562 g a.i. ha−1 at V10 stage; E6: ethephon 562 g a.i. ha−1 at V10 stage; E7: no ethephon; R3: reproductive phase 3 of maize plant at 79 days after planting (DAP) considering well-watered (WW) plant; V6: vegetative 6 leaves stage at 30 DAP considering WW; V10: vegetative 10 leaves stage at 42 DAP considering WW; RGR-V6V10, RGR-V10R3, and RGR-V6R3: relative growth rates at V6-V10, V10-R3, and V6-R3, respectively; NAR-V6V10, NAR-V10R3, and NAR-V6R3: net assimilation rates at V6-V10, V10-R3, and V6-R3, respectively; WP: water productivity at final harvest; AGDD: accumulated growing degree days; HUE: heat use efficiency at final harvest.
Table 11. The main effects of water levels on different physio-biochemical traits of maize in the field. Data presented are mean values, where LSD0.05 is the Least Significant Difference at the 0.05 significance level.
Source of VariationSPAD-JAWSPRSR-R3
(%)
RWC-JAWSP
(%)
EL-JAWSP
(%)
PrL-JAWSP
(µmol g−1 FW)
TSSL-JAWSP
(mg g−1 FW)
W148.39a2.41a89.84a4.26c16.02c1054.79c
W242.09b1.89b80.36b6.41b35.42a2852.31a
W340.22c1.92b78.35c7.79a25.91b2692.75b
F test (W)************
LSD0.050.870.041.670.120.5247.36
** significant at p < 0.01; means within a column with the same or no letters are not significant at p < 0.05 based on the LSD test. W1: well-watered conditions; W2: short water stress during 48 to 62 days after planting (DAP); W3: prolonged water stress during 48–79 DAP; R3: reproductive phase 3 of maize plant at 79 days after planting (DAP) considering well-watered (WW) plant; JAWSP: just after water stress period; R3: reproductive phase 3 of maize plant at 79 DAP considering WW; SPAD: SPAD value for leaf greenness; RSR: relative senescence rate; RWC: relative water content; EL: electrolyte leakage; PrL: proline in leaves; TSSL: total soluble sugar in leaves.
Table 12. The main effects of ethephon applications on different physio-biochemical traits of maize. Data presented are mean values, where LSD0.05 is the Least Significant Difference at the 0.05 significance level.
Source of VariationSPAD-JAWSPRSR-R3
(%)
RWC-JAWSP
(%)
EL-JAWSP
(%)
PrL-JAWSP
(µmol g−1 FW)
TSSL-JAWSP
(mg g−1 FW)
E144.92ab1.95d82.47c6.01cd27.04b2086.07e
E242.25d2.15b81.76c5.90d27.06b2458.83b
E346.10a2.01c88.19a5.69e28.78a2254.49d
E442.58cd2.17b82.19c6.21b26.38bc2349.31c
E541.40d2.26a81.43c6.11bc26.03c2587.05a
E643.74bc2.06c85.42b5.82de27.04b2566.32a
E743.99b1.91d78.49d7.35a18.17d1097.58f
F test (W)************
LSD0.051.330.072.560.190.7972.34
** significant at p < 0.01; means within a column with the same or no letters are not significant at p < 0.05 based on the LSD test. E1: ethephon 281 g a.i. ha−1 at V6 stage; E2: ethephon 281 g a.i. ha−1 at V6 + 281 g a.i. ha−1 at V10 stage; E3: ethephon 281 g a.i. ha−1 at V10 stage; E4: ethephon 562 g a.i. ha−1 at V6 stage; E5: ethephon 562 g a.i. ha−1 at V6 + 562 g a.i. ha−1 at V10 stage; E6: ethephon 562 g a.i. ha−1 at V10 stage; E7: no ethephon; JAWSP: just after water stress period; R3: reproductive phase 3 of maize plant at 79 DAP considering WW; SPAD: SPAD value for leaf greenness; RSR: relative senescence rate; RWC: relative water content; EL: electrolyte leakage; PrL: proline in leaves; TSSL: total soluble sugar in leaves.
Table 13. Interaction effects of water levels and ethephon applications on different physio-biochemical traits of maize in the field. Data presented are mean values, where LSD0.05 is the Least Significant Difference at the 0.05 significance level.
Source of VariationSPAD-JAWSPRSR-R3
(%)
RWC-JAWSP
(%)
EL-JAWSP
(%)
PrL-JAWSP
(µmol g−1 FW)
TSSL-JAWSP
(mg g−1 FW)
W1E149.382.11cd89.034.28j16.57ij610.18h
W1E247.512.49b88.374.23j17.60hi987.72g
W1E349.422.19c97.104.22j16.68i1112.19fg
W1E447.012.53b88.084.31j16.70i1173.17f
W1E546.142.68a88.024.24j15.22j1508.87e
W1E648.912.46b89.044.26j16.71i1456.89e
W1E750.372.42b89.244.31j12.70k534.50h
W2E144.251.80hi80.126.12gh35.86c2860.15c
W2E240.131.95fg79.895.92hi36.72bc3208.87a
W2E345.771.91gh84.135.76i40.68a2861.12c
W2E440.521.97efg81.036.35g37.12bc3054.08b
W2E540.052.03def79.146.31g36.74bc3140.25ab
W2E641.781.92fg84.105.97hi37.26b3111.50ab
W2E742.151.64j74.128.42b23.56g1730.23d
W3E141.121.93fg78.257.63d28.71d2787.88c
W3E239.112.00defg77.027.54de26.85e3179.90a
W3E343.101.94fg83.357.10f28.98d2790.16c
W3E440.212.02defg77.457.97c25.33f2820.68c
W3E538.012.08cde77.127.78cd26.13ef3112.04ab
W3E640.521.79i83.137.24ef27.15e3130.56ab
W3E739.451.67j72.129.31a18.24h1028.01g
F test (W)ns**ns******
LSD0.05-0.12 0.331.36125.29
** significant at p < 0.01; means within a column with the same or no letters are not significant at p < 0.05 based on the LSD test. W1: well-watered conditions; W2: short water stress during 48 to 62 days after planting (DAP); W3: prolonged water stress during 48–79 DAP; E1: ethephon 281 g a.i. ha−1 at V6 stage; E2: ethephon 281 g a.i. ha−1 at V6 + 281 g a.i. ha−1 at V10 stage; E3: ethephon 281 g a.i. ha−1 at V10 stage; E4: ethephon 562 g a.i. ha−1 at V6 stage; E5: ethephon 562 g a.i. ha−1 at V6 + 562 g a.i. ha−1 at V10 stage; E6: ethephon 562 g a.i. ha−1 at V10 stage; E7: no ethephon; JAWSP: just after water stress period; R3: reproductive phase 3 of maize plant at 79 DAP considering WW; SPAD: SPAD value for leaf greenness; RSR: relative senescence rate; RWC: relative water content; EL: electrolyte leakage; PrL: proline in leaves; TSSL: total soluble sugar in leaves.
Table 14. Indirect effects via various paths of morphological and physio-biochemical traits separately on grain yield and their correlations under prolonged water stress.
TraitIndirect Effect via Following Morphological TraitsTotal Correlation with GYTraitIndirect Effect via Following Physio-Biochemical TraitsTotal Correlation with GY
PH-R3SD-R3LAI-R3SW-R3GNP100-GWNAR-V6R3SPAD-JAWSPRWC-JAWSPEL-JAWSPPrL-JAWSPTSSL-JAWSP
PH-R3 0.000.390.370.07−0.040.67NAR-V6R3 0.140.17−0.190.070.080.95
SD-R30.04 0.190.930.00−0.161.00SPAD-JAWSP0.42 0.11−0.090.040.000.71
LAI-R30.110.00 0.260.07−0.070.83RWC-JAWSP0.680.14 −0.190.070.080.95
SW-R30.050.010.11 0.00−0.121.00EL-JAWSP−0.60−0.10−0.15 −0.09−0.11−0.84
GNP0.110.000.40−0.03 −0.010.76PrL-JAWSP0.520.100.14−0.20 0.100.75
100-GW0.030.010.200.820.00 0.90TSSL-JAWSP0.440.010.11−0.190.08 0.57
Table 15. The energy efficiency of maize as affected by the magnitude of ethephon applications under different water levels at field conditions. Data presented are mean values, where LSD0.05 is the Least Significant Difference at the 0.05 significance level.
Water LevelEnergy Efficiency
Ethephon Application Well-Watered Conditions (W1)Short Water Stress (W2)Prolonged Water Stress (W3)
E1 = 281 g a.i. ha−1 at V6 stage1.48cde1.59bc1.26fg
E2 = 281 g a.i. ha−1 at V6 + 281 g a.i. ha−1 at V10 stage1.40def1.29fg1.12h
E3 = 281 g a.i. ha−1 at V10 stage1.88a1.63b1.55bc
E4 = 562 g a.i. ha−1 at V6 stage1.36ef1.31f1.16gh
E5 = 562 g a.i. ha−1 at V6 + 562 g a.i. ha−1 at V10 stage1.30fg1.17gh1.06hi
E6 = 562 g a.i. ha−1 at V10 stage1.81a1.50bcd1.47cde
E7 = no ethephon1.89a1.06hi0.97i
F test (W)**
LSD0.050.14
** significant at p < 0.01; means among the columns with the same letters are not significant at p < 0.05 based on the LSD test. E1: ethephon 281 g a.i. ha−1 at V6 stage; E2: ethephon 281 g a.i. ha−1 at V6 + 281 g a.i. ha−1 at V10 stage; E3: ethephon 281 g a.i. ha−1 at V10 stage; E4: ethephon 562 g a.i. ha−1 at V6 stage; E5: ethephon 562 g a.i. ha−1 at V6 + 562 g a.i. ha−1 at V10 stage; E6: ethephon 562 g a.i. ha−1 at V10 stage; E7: no ethephon; a.i.: active ingredient.
Table 16. Emission factors for each input used in maize production and CO2-eq emissions (kg CO2-eq ha−1) under different water stress levels with the magnitude of ethephon application at field level.
InputsInput AmountE1E2E3E4E5E6E7
Well watered (W1)Nitrogen (N)1941610.201610.201610.201610.201610.201610.201610.20
Phosphorus (P2O5)114.569.8569.8569.8569.8569.8569.8569.85
Potassium (K2O)60.526.6226.6226.6226.6226.6226.6226.62
Pesticides and PGRE7 = 0.31; E1, E3 = 0.591; E2, E4, E6 = 0.872; E5 = 1.43410.6415.7010.6415.7025.8115.705.58
Diesel524.21378.651378.651378.651378.651378.651378.651378.65
Electricity720.1576.08576.08576.08576.08576.08576.08576.08
Seed2596.2596.2596.2596.2596.2596.2596.25
Total emission CO2-eq 3768.283773.343768.283773.343783.453773.343763.22
Short water stress (W2)Nitrogen (N)1941610.201610.201610.201610.201610.201610.201610.20
Phosphorus (P2O5)114.569.8569.8569.8569.8569.8569.8569.85
Potassium (K2O)60.526.6226.6226.6226.6226.6226.6226.62
Pesticides and PGRE7 = 0.31; E1, E3 = 0.591; E2, E4, E6 = 0.872; E5 = 1.43410.6415.7010.6415.7025.8115.705.58
Diesel524.21378.651378.651378.651378.651378.651378.651378.65
Electricity617.23493.78493.78493.78493.78493.78493.78493.78
Seed2596.2596.2596.2596.2596.2596.2596.25
Total emission CO2-eq 3685.983691.043685.983691.043701.163691.043680.93
Prolong water stress (W3)Nitrogen (N)1941610.201610.201610.201610.201610.201610.201610.20
Phosphorus (P2O5)114.569.8569.8569.8569.8569.8569.8569.85
Potassium (K2O)60.526.6226.6226.6226.6226.6226.6226.62
Pesticides and PGRE7 = 0.31; E1, E3 = 0.591; E2, E4, E6 = 0.872; E5 = 1.43410.6415.7010.6415.7025.8115.705.58
Diesel524.21378.651378.651378.651378.651378.651378.651378.65
Electricity514.36411.49411.49411.49411.49411.49411.49411.49
Seed2596.2596.2596.2596.2596.2596.2596.25
Total emission CO2-eq 3603.693608.753603.693608.753618.863608.753598.63
Disclaimer/Publisher’s Note: The statements, opinions and data contained in all publications are solely those of the individual author(s) and contributor(s) and not of MDPI and/or the editor(s). MDPI and/or the editor(s) disclaim responsibility for any injury to people or property resulting from any ideas, methods, instructions or products referred to in the content.

