Article

Field Screening of Diverse Soybean Germplasm to Characterize Their Adaptability under Long-Day Condition

1
Agricultural Biotechnology Division, National Institute for Biotechnology and Genetic Engineering College Pakistan Institute of Engineering and Applied Sciences (NIBGE-C, PIEAS), Faisalabad 38000, Pakistan
2
Federal Seed Certification and Registration Department, Islamabad 04483, Pakistan
3
Plant Breeding and Genetics Division, Nuclear Institute of Agriculture (NIA), Tando Jam 70060, Pakistan
4
School of Agricultural, Earth and Environmental Sciences, African Centre for Crop Improvement, University of KwaZulu-Natal, Pietermaritzburg 3209, South Africa
*
Authors to whom correspondence should be addressed.
Agronomy 2023, 13(9), 2317; https://doi.org/10.3390/agronomy13092317
Submission received: 9 July 2023 / Revised: 13 August 2023 / Accepted: 14 August 2023 / Published: 4 September 2023

Abstract

:
Soybean is a short-day crop, and its sensitivity to photoperiod is an important trait for its adaptability. Rapid changes in the climate on a global scale could be a threat to future food security. There is a need to increase the heat tolerance of soybean to sustain its production. The availability of global germplasm provides plant breeders with the opportunity to explore the genetic potential of the existing soybean germplasm. For this purpose, a panel of 203 soybean accessions from different global climatic zones was evaluated for adaptability under long-day conditions. Field screening of the soybean germplasm was conducted over two consecutive years, 2016 and 2017, in Faisalabad, Pakistan. This study screened 15 diverse soybean accessions that exhibited economically viable yields in both years, i.e., 1500–2200 kg/ha. Data related to plant height, node number, pods per plant, seeds per plant, seed weight per plant, hundred-grain weight, and total yield were recorded. Two soybean accessions, PI548271 (MG-IV) and PI553039 (MG-IV,) produced the highest yield in both years. The genotypic and phenotypic coefficients of variance, broad-sense heritability, and genetic advances observed in their yields were also high. These results highlight the potential pre-existing genetic variation required to improve the adaptation of soybean to long-day conditions. Some of the accessions identified in the current study could be recommended for general cultivation under long-day and high-temperature conditions.

1. Introduction

Soybean is considered a cheap source of protein and edible oil for both humans and animals all over the world [1,2,3]. Currently, the greatest soybean-producing country is Brazil, followed by the United States of America (USA), Argentina, China, and India [4]. With the rise of globalization, diets are becoming more diverse. Traditional staples are being replaced with meat and other high-value agricultural goods, i.e., vegetable protein and oil. This trend is increasing the demand for vegetable oil for food and high-protein grains for livestock feed, particularly those derived from soybean. Soybean, being one of the most significant commodities in international trade, is regarded as a good feed supplement, especially for monogastric animals, because of its high protein content and optimal amino acid composition.
In Pakistan, commercial soybean farming began in the early 1970s, and subsequently, extensive work has been conducted for variety evaluation. However, Pakistan continues to struggle to meet the domestic demand for edible oil and other soybean products, and its global share of soybean production remains insignificant. As a result, the country has to import soybean products and edible oil [5]. In 2018–2019, the production of soybean was only 0.002 million tons, whereas >2225.08 thousand tons of soybean seeds (worth PKR 123.0623 billion) and 150.91 thousand tons of soybean oil (worth PKR 14.832 billion) were imported [6]. Although Pakistan’s soil and climate are ideal for growing soybean, the lack of known cultivars adapted to Pakistan has prevented them from becoming widely used by farmers. Numerous factors contribute to the low production of soybeans in Pakistan as follows: (1) a lack of high-yielding and well-adapted cultivars suitable for different agro-ecological zones of the nation, as well as the growing seasons; (2) a lack of diverse soybean germplasm; (3) a lack of photo-insensitive soybean germplasm; and (4) competition for cultivation with already well-established crops in many regions of the country. However, there are possible locations with favorable agro-climatic conditions in which soybean can be grown.
The adaptability of soybean genotypes is influenced by their response to day length because it influences the flowering and growth habit, i.e., short or long days. Soybean can grow in varying latitudinal climates because of photoperiod sensitivity variation. For short-duration crops, decreased photoperiod sensitivity is necessary for adaptation to high latitudes and long-day periods. Soybean responds to day lengths at both the pre-flowering (vegetative and flowering periods) and post-flowering stages, such as terminal inflorescence, leaf senescence, and pod filling. The reproductive periods are increased by photoperiod sensitivity, causing delayed leaf senescence and seed maturation of soybean under long-day conditions. A wide range of temperatures can be used to cultivate soybean. Soil temperatures must be between 5 °C and 40 °C for soybean seeds to germinate, depending on the amount of rain and irrigation. About 30 °C is the ideal temperature for quick vegetative growth, whereas temperatures exceeding 40 °C have a negative impact on bloom initiation and pod retention. The high temperature of heat stress mostly hinders soybean production during the reproduction stages, but a continuous supply of water can help overcome this problem. Irrigation in the Punjab region of Pakistan is mostly carried out using one of the largest contiguous irrigation systems in the world. Thus, 90% of agricultural output comes from this source. So, the development of soybean as spring (Zaid Rabi) and autumn (Kharif) crops has enormous potential. The existing cropping pattern can incorporate soybean with diverse ecologies and a good agricultural system. The soybean growing period (mid-July to mid-November) coincides with the two major cash crops of Pakistan, i.e., cotton and rice, significantly reducing the chances of soybean acceptability to farmers [7]. To resolve this problem, a strategy to incorporate soybean into the current cropping pattern is needed. Such a strategy would need varieties that could provide an economically viable yield under long-day and high-temperature conditions to cope with the expected changes in the climate of different regions.
In both cultivated and wild species, genotypes are often genetically adapted to specific climatic conditions to ensure reproductive success [8] or high yields [9], thus it is important to choose a genotype for a particular set of environmental conditions. The growth and yield of a genotype are greatly affected by the environmental conditions under which it is grown. As a result, screening a pool of genotypes for certain environments would depend on the yield rankings [9]. Breeders have emphasized the need to create genotypes with stable yields under a range of climatic conditions and geographic variances. To break the production ceiling, it is crucial to develop new soybean varieties with high yields [10]. This requires soybean breeders to improve the yield-contributing traits in the existing germplasm or identify/develop novel genotypes. However, the yield-contributing traits are complex and polygenic [11,12]. Therefore, selecting the traits based exclusively on their heritability can occasionally result in poor decisions. In this regard, it would be more beneficial to consider genetic advancements.
Currently, the USDA soybean germplasm collection has more than 19,000 accessions of cultivated soybean from all over the world [13]. Such a diverse germplasm collection can help us identify suitable accessions for specific agroclimatic conditions. If successful, such a strategy will benefit soybean breeders and farmers in identifying and developing high-yielding soybean varieties that are adaptable to the desired environment. In this regard, limited attempts have been made in Pakistan. Therefore, the main goal of this study was to identify genotypes with a high yield potential and promote their widespread cultivation under long-day conditions. It was predicted that under local climatic conditions, the tested genotypes would provide dramatically different yields. This study will help in selecting genotypes that are most suited to long-day environmental conditions.

2. Materials and Methods

2.1. Experimental Material

A field experiment was conducted using a complete randomized block design during the spring of 2016 and 2017 at NIBGE (National Institute for Biotechnology and Genetic Engineering), Faisalabad, Pakistan (31°42′ N 73°02′ E). Seeds were sown in February 2016 and 2017, with three replications for each accession. Seedbeds were prepared by one-time plowing with a cultivator, followed by planking, and two times with a rotavator. Plants were spaced three inches apart using a dibbler during sowing. Twenty-five seeds of each accession were sown at a depth of 1–2 inches. For proper emergence, a row-to-row distance of 30 cm was maintained. Each soybean line consisted of three rows of 2.43 m. The soybean crop’s flowering cycle coincided with naturally hotter growing conditions that occurred from April to July in Faisalabad since the seeding was set for the spring. Three weeks before sowing, the area was pre-irrigated using canal water during both years so that the soil could have maximum moisture for seed emergence. Additionally, supplemental irrigation was used during the growing season. Water was supplied through canals during both years after 15 days of sowing. Rainfall recorded during this period was very low, so for in-season irrigation four times, additional water was supplied using canal water. The soybean fields were kept weed- and pest-free throughout the growing season, and no disease symptoms were observed in these trials.
The 203 soybean accessions belonging to 12 different countries, i.e., Australia, Afghanistan, Brazil, China, Canada, France, Iran, India, Korea, Japan, Pakistan, and the USA, were resourced from the Agriculture Research Service of the United States Department of Agriculture (USDA-ARS), USA (Supplementary Table S1). To screen accessions suitable for the agro-climatic conditions of Pakistan, these accessions were planted with locally adapted soybean cultivars. Commercially available fertilizers (urea, DAP, and SOP), potassium (K), phosphorus (P), and nitrogen (N) were used at ratios of 50, 60, and 25 kg/ha, respectively. At the time of seedbed preparation, half the dose of N and the full dose of K and P were applied. The second half of the N dose was applied at the flowering stage. For other agronomic practices, i.e., disease and pest control, we followed the recommendations of the Department of Agriculture, Punjab, Pakistan (https://ext.agripunjab.gov.pk/production_plans, (accessed on 12 September 2022).

2.2. Morphological Trait Evaluation

A total of nine morphological traits were studied in 2016 and 2017, and data were collected for further analysis. Days to flowering (DTF) data were recorded from the date of sowing to when 50% of plants in a row produced at least one flower, whereas days to maturity (DTM) data were recorded from the sowing date to when 95% of plants in a row reached maturity. For plant height (PH), three plants were selected from each row, and the data were measured in centimeters at maturity from the surface of the soil to the tip of the plant using a meter rod. The node number per plant (NN) was measured by counting the number of nodes on the main stem of three randomly selected plants at maturity. For seed weight per plant (SWPP), three plants were selected from each row for each accession, and the data were recorded by measuring the weight of seeds harvested from a single plant in grams. For the hundred-grain weight (HGW), the weight of 100 seeds was measured in grams using a benchtop weighing balance, and the total yield (TY) per plot was measured by weighing all of the seeds obtained from each replicate. TY data were recorded in grams per square meter and further converted into kilograms per hectare for estimating the yield of each accession on a large scale. For the number of pods per plant (PPP), three plants were selected at the time of harvesting, and the data were recorded by counting the number of pods present on each plant. The number of seeds per plant (SDPP) was measured in three plants by counting the number of seeds harvested from a single plant.

2.3. Statistical Analysis

The relative contributions of genotype (G) and genotype-by-environment interaction (GEI) effects to the phenotypic variation in all agronomic traits across environments were examined using linear mixed models [12].
y i j k = μ +   G i +   E j +   ( G E ) I J +   B k ( j ) +   ε i j k
where yijk is the phenotypic observation of the ith genotype in the jth environment, µ represents the general interception, GEij is the random interaction effect of the ith genotype and the jth environment, Bk(j) is the random effect of the kth block nested within the jth environment, and ԑijk is the residual plot error associated with the observation yijk.
Both linear mixed models were fitted using the R package’s Meta-R [14]. This function assesses the variance components of random effects using restricted maximum likelihood (REML) while determining their significance using a likelihood ratio test (LRT). It also compares a full model with all random terms with each other. The typical linear mixed model serves as the framework for BLUE and BLUP [15]. To create an array of 203 accessions for the nine traits, we first computed the Best Linear Unbiased Predictors (BLUPs) and Best Linear Unbiased Estimation (BLUEs) for each genotype, as well as the GEI terms. For examining the relationship between genotypes and traits, two interactive principle component analyses were used to create a biplot.
To evaluate the effects of different traits on genotypes, an analysis of variance (ANOVA) was conducted for all the traits. The correlation between the total yield and each trait was identified using Pearson’s correlation in the “Performance Analytics” package of the R statistical program. The “Dist” function in R was used to calculate the distance matrix of the genotypes based on phenotypic data using the “Euclidean” method [16]. The hierarchical cluster analysis was performed using the “hclust” function. The set of dissimilarities matrix produced by “dist” was used to form clusters based on the “complete” clustering method. This method finds the most similar clusters [17]. For enhanced visualization of the dendrogram, the “fviz_dend” function of the factoextra R package and ggplot2 was used.

2.4. Variability Analysis

Variability parameters, including heritability, genotypic coefficient of variance (GCV), phenotypic coefficients of variation (PCV), genotypic and phenotypic variances, and genetic advance (GA), were calculated using formulas proposed by [18].
The genotypic variance was calculated as,
δ 2 g = M S G M S E r × 100
where δ2g stands for genotypic variance, MSG refers to the mean sum of squares for genotypes, MSE stands for the mean sum of squares for error, and r refers to the number of replications.
The phenotypic variance was calculated as,
δ 2 p = δ 2 g + δ 2 e
where δ2p stands for phenotypic variance and δ2e for environmental variance, which is equal to the mean squared error.
Genotypic and phenotypic coefficients of variance were calculated as,
G C V = δ 2 g × 100 x _
P C V = δ 2 p × 100 x _
In the above equations, GCV stands for genotypic coefficient of variance, PCV stands for phenotypic coefficient of variance, δ2p stands for phenotypic variance, δ2g stands for genotypic variance, and x _ is the mean of the population.
Broad-sense heritability for all the traits was measured as,
H 2 % = σ 2 g σ 2 p × 100
In the above equation, H2 is broad-sense heritability, σ2g is genotypic variance, and σ2p is phenotypic variance.
Heritability was calculated by adjusting the scale to below 30% as low, 30–60% as moderate, and greater than 60% as high, as suggested by [19].
For calculating the genetic advance, the following formula was used:
G A = K   σ 2 g σ 2 p .   σ p h
In the above equation, K is 5% selection intensity, σ2g is genotypic variance, σ2p is phenotypic variance, h is broad-sense heritability, and σph is the phenotypic standard deviation.

3. Results

3.1. Effects of Growing Conditions on Phenotypic Variation

In Faisalabad, Pakistan, the growth conditions were consistent over the course of the experiment. In 2017, a decrease in the lowest temperature and an increase in rainfall were observed (Table 1). The climatic conditions in these two specific years were almost the same, with minor variations. For the crop cycle, the seasonal photoperiods ranged from 10.4 to 14.9 h/day. The weather information for the cropping season is provided in (Table 1). The weather data for all the experimental locations during both years were collected from https://www.worldweatheronline.com/, (accessed on 22 September 2022).

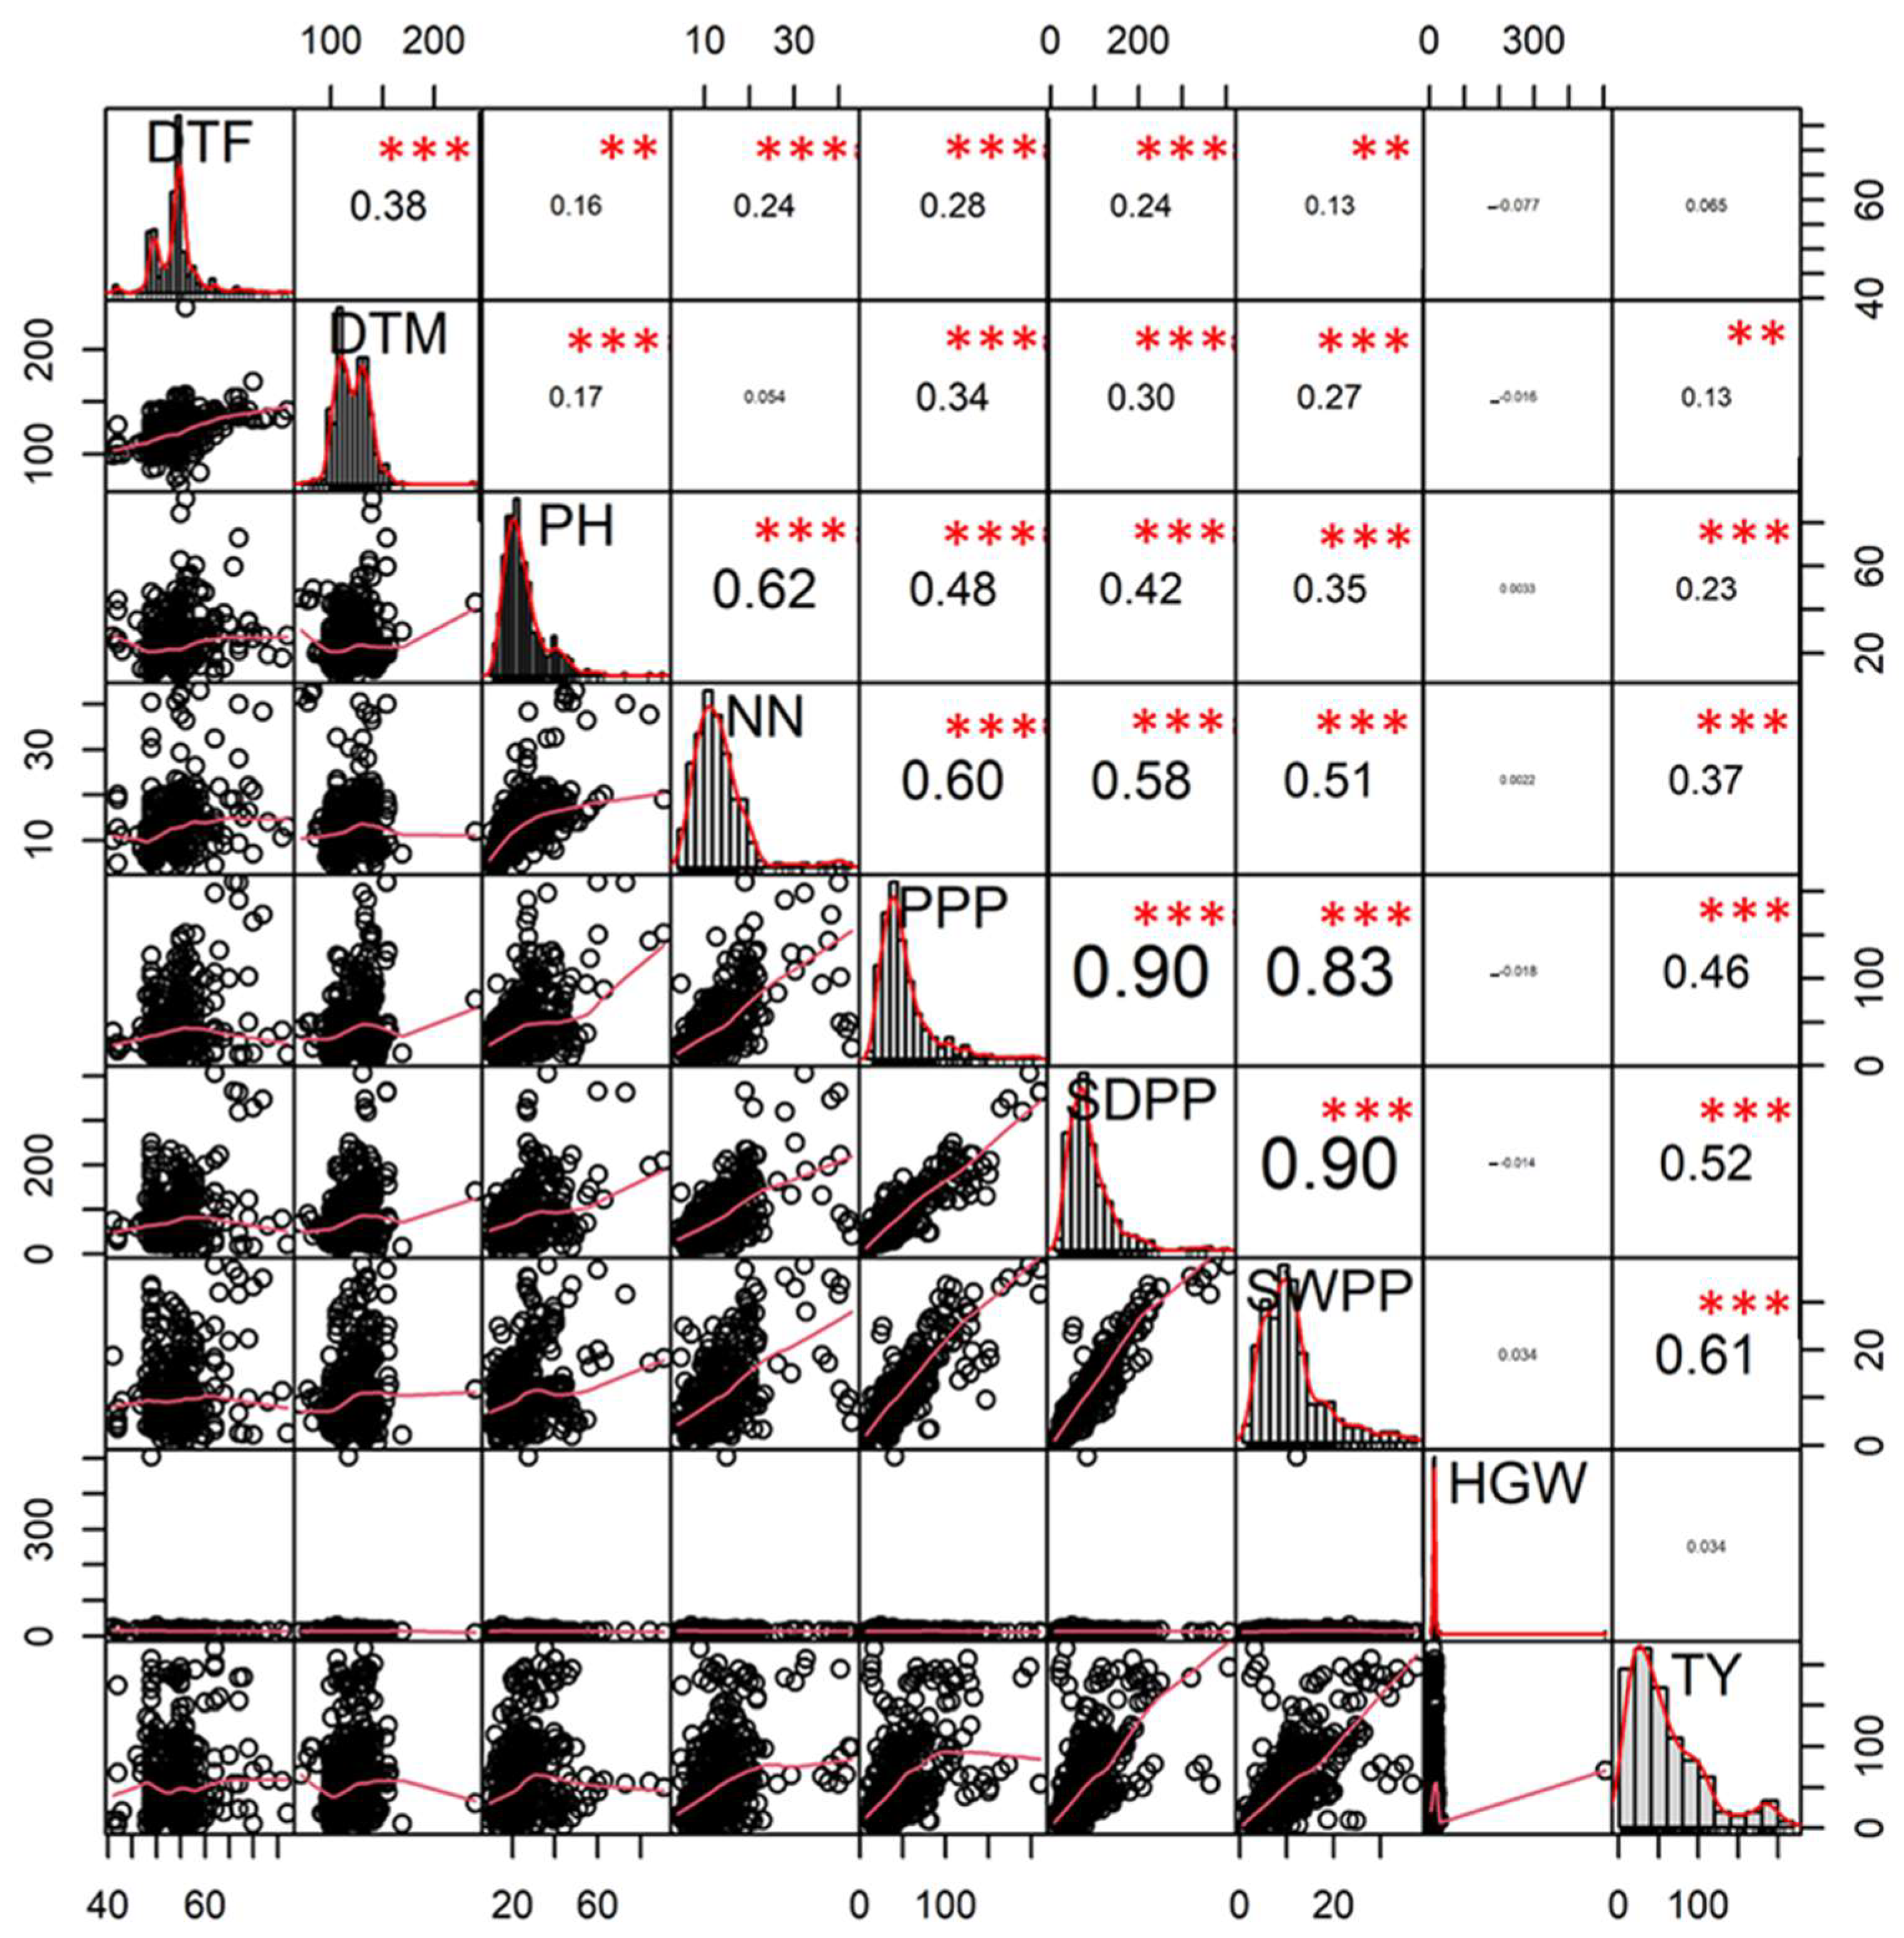
3.2. Correlation Analysis

Quantitative traits that are polygenic in nature are susceptible to environmental influence. Because of this, selecting the candidate genotypes exclusively based on yield may not be useful. To increase production or improve plant architecture, associated traits must be considered when selecting suitable genotypes. In this study, Pearson’s correlation revealed a significant correlation between the agronomic traits (Figure 1). The total yield was positively correlated with SDPP and SWPP, with a significant correlation of 0.52 and 0.61, respectively, whereas the correlation observed for the total yield with DTF, DTM, PH, and HGW was significantly low. A significantly high positive correlation (0.90) was observed between PPP and SDPP, and between SDPP and SWPP. The correlation observed between the HGW and other traits was significantly very low (Figure 1).

3.3. Analysis of Variance of Agronomic Traits

The estimated components of variance and their effects on phenotypic variation are shown in Table 2. Genotypic variance ranged from 17.29 for NN to 2157.67 for TY. The genotypic effect has a significant contribution to the phenotypic variation in all traits except for the hundred-grain weight, whereas the genotype × environment effect also showed a significant contribution to phenotypic variation for PH, NN, SWPP, SDPP, PPP, and TY (Table 2). The highest CV (coefficient of variance) of 25.77 was observed for PPP (Table 2).

3.4. Analysis of Variability, Heritability, and Genetic Advance

In the present study, GCV, PCV, H2, and GA showed a considerable amount of variation, indicating that there is enough scope for the selection of the desired germplasm based on agronomic traits (Table 3). Both PCV (77.97) and GCV (77.47) calculated for TY, PPP (63.05/72.86), and SDPP (62.22/70.09) were higher. While less distance between GCV and PCV was calculated for DTF (7.8/8.03), DTM (11.87/11.87), and HGW (4.97/18.72), it shows that the trait was less affected by environmental variation. Heritability estimated for the observed traits ranged from 64 to 99%. DTF (91%), DTM (90%), HGW (92%), and TY (99%) showed relatively higher heritability compared to PPP (80%), NN (64%), SDPP (81%), and SWPP (82%). The genetic advance calculated for TY was 977.34, which was higher than any other trait, whereas the lowest GA was observed for HGW (4.91).

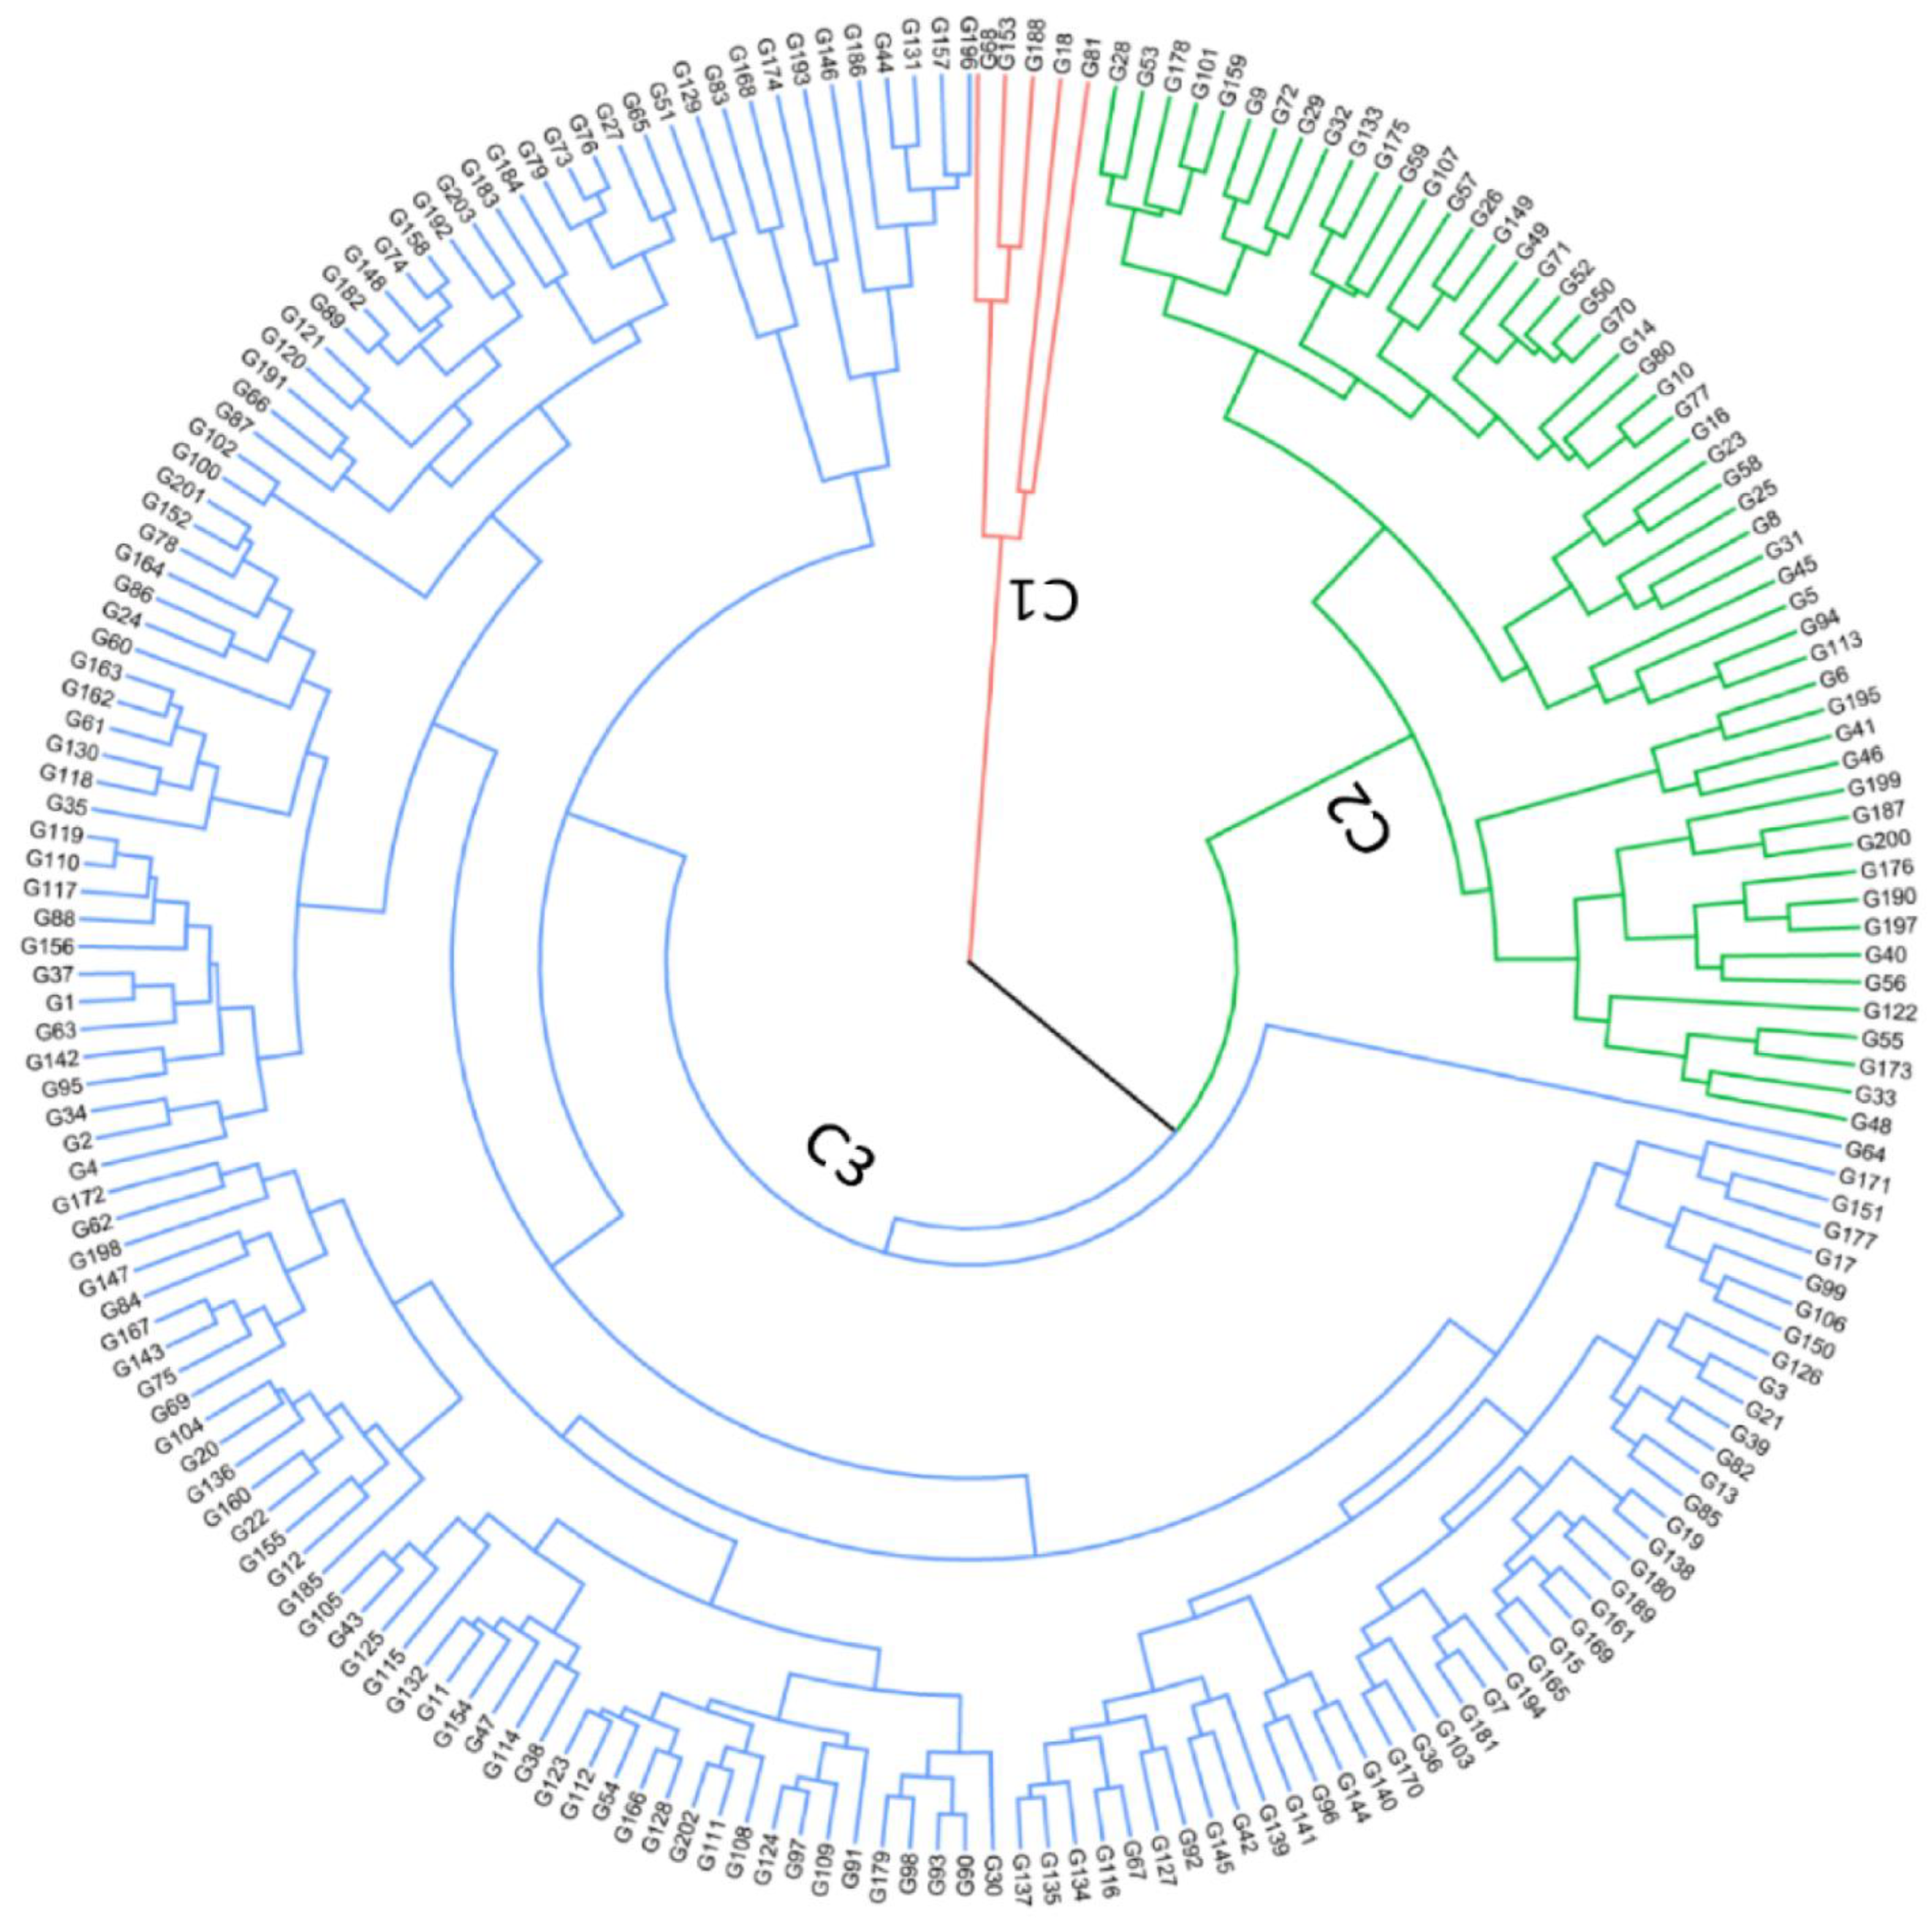
3.5. Phenotypic Variation Patterns in Germplasm Collection

The ideal biometrical tool for classifying data based on similarity is cluster analysis. The data can be divided into different and homogeneous groups. From the phylogenetic tree drawn by cluster analysis on the phenotypic data of highly correlated traits, 203 soybean genotypes were grouped into three separate clusters (Figure 2). Cluster 1 (C1) consisted of only five genotypes (three from the USA and one from Australia and Pakistan each). The genotypes in C1 showed good vegetative growth and had the highest PH and NN values, whereas group 2 (C2) consisted of 52 genotypes dominated by genotypes from the USA (35), followed by Pakistan (8), China (5), and Brazil (3), and a genotype of unknown origin. Genotypes from this group had the highest values for TY, PH, PPP, SDPP, and SWPP but the lowest values for DTF, DTM, and HGW. Cluster 3 (C3) was the largest group with the maximum number of genotypes (146). The higher numbers of genotypes in G3 were from the USA (72), followed by Pakistan (28) and China (20). Genotypes from this group had the lowest values for most of the traits but the highest values for HGW, DTF, and DTM.

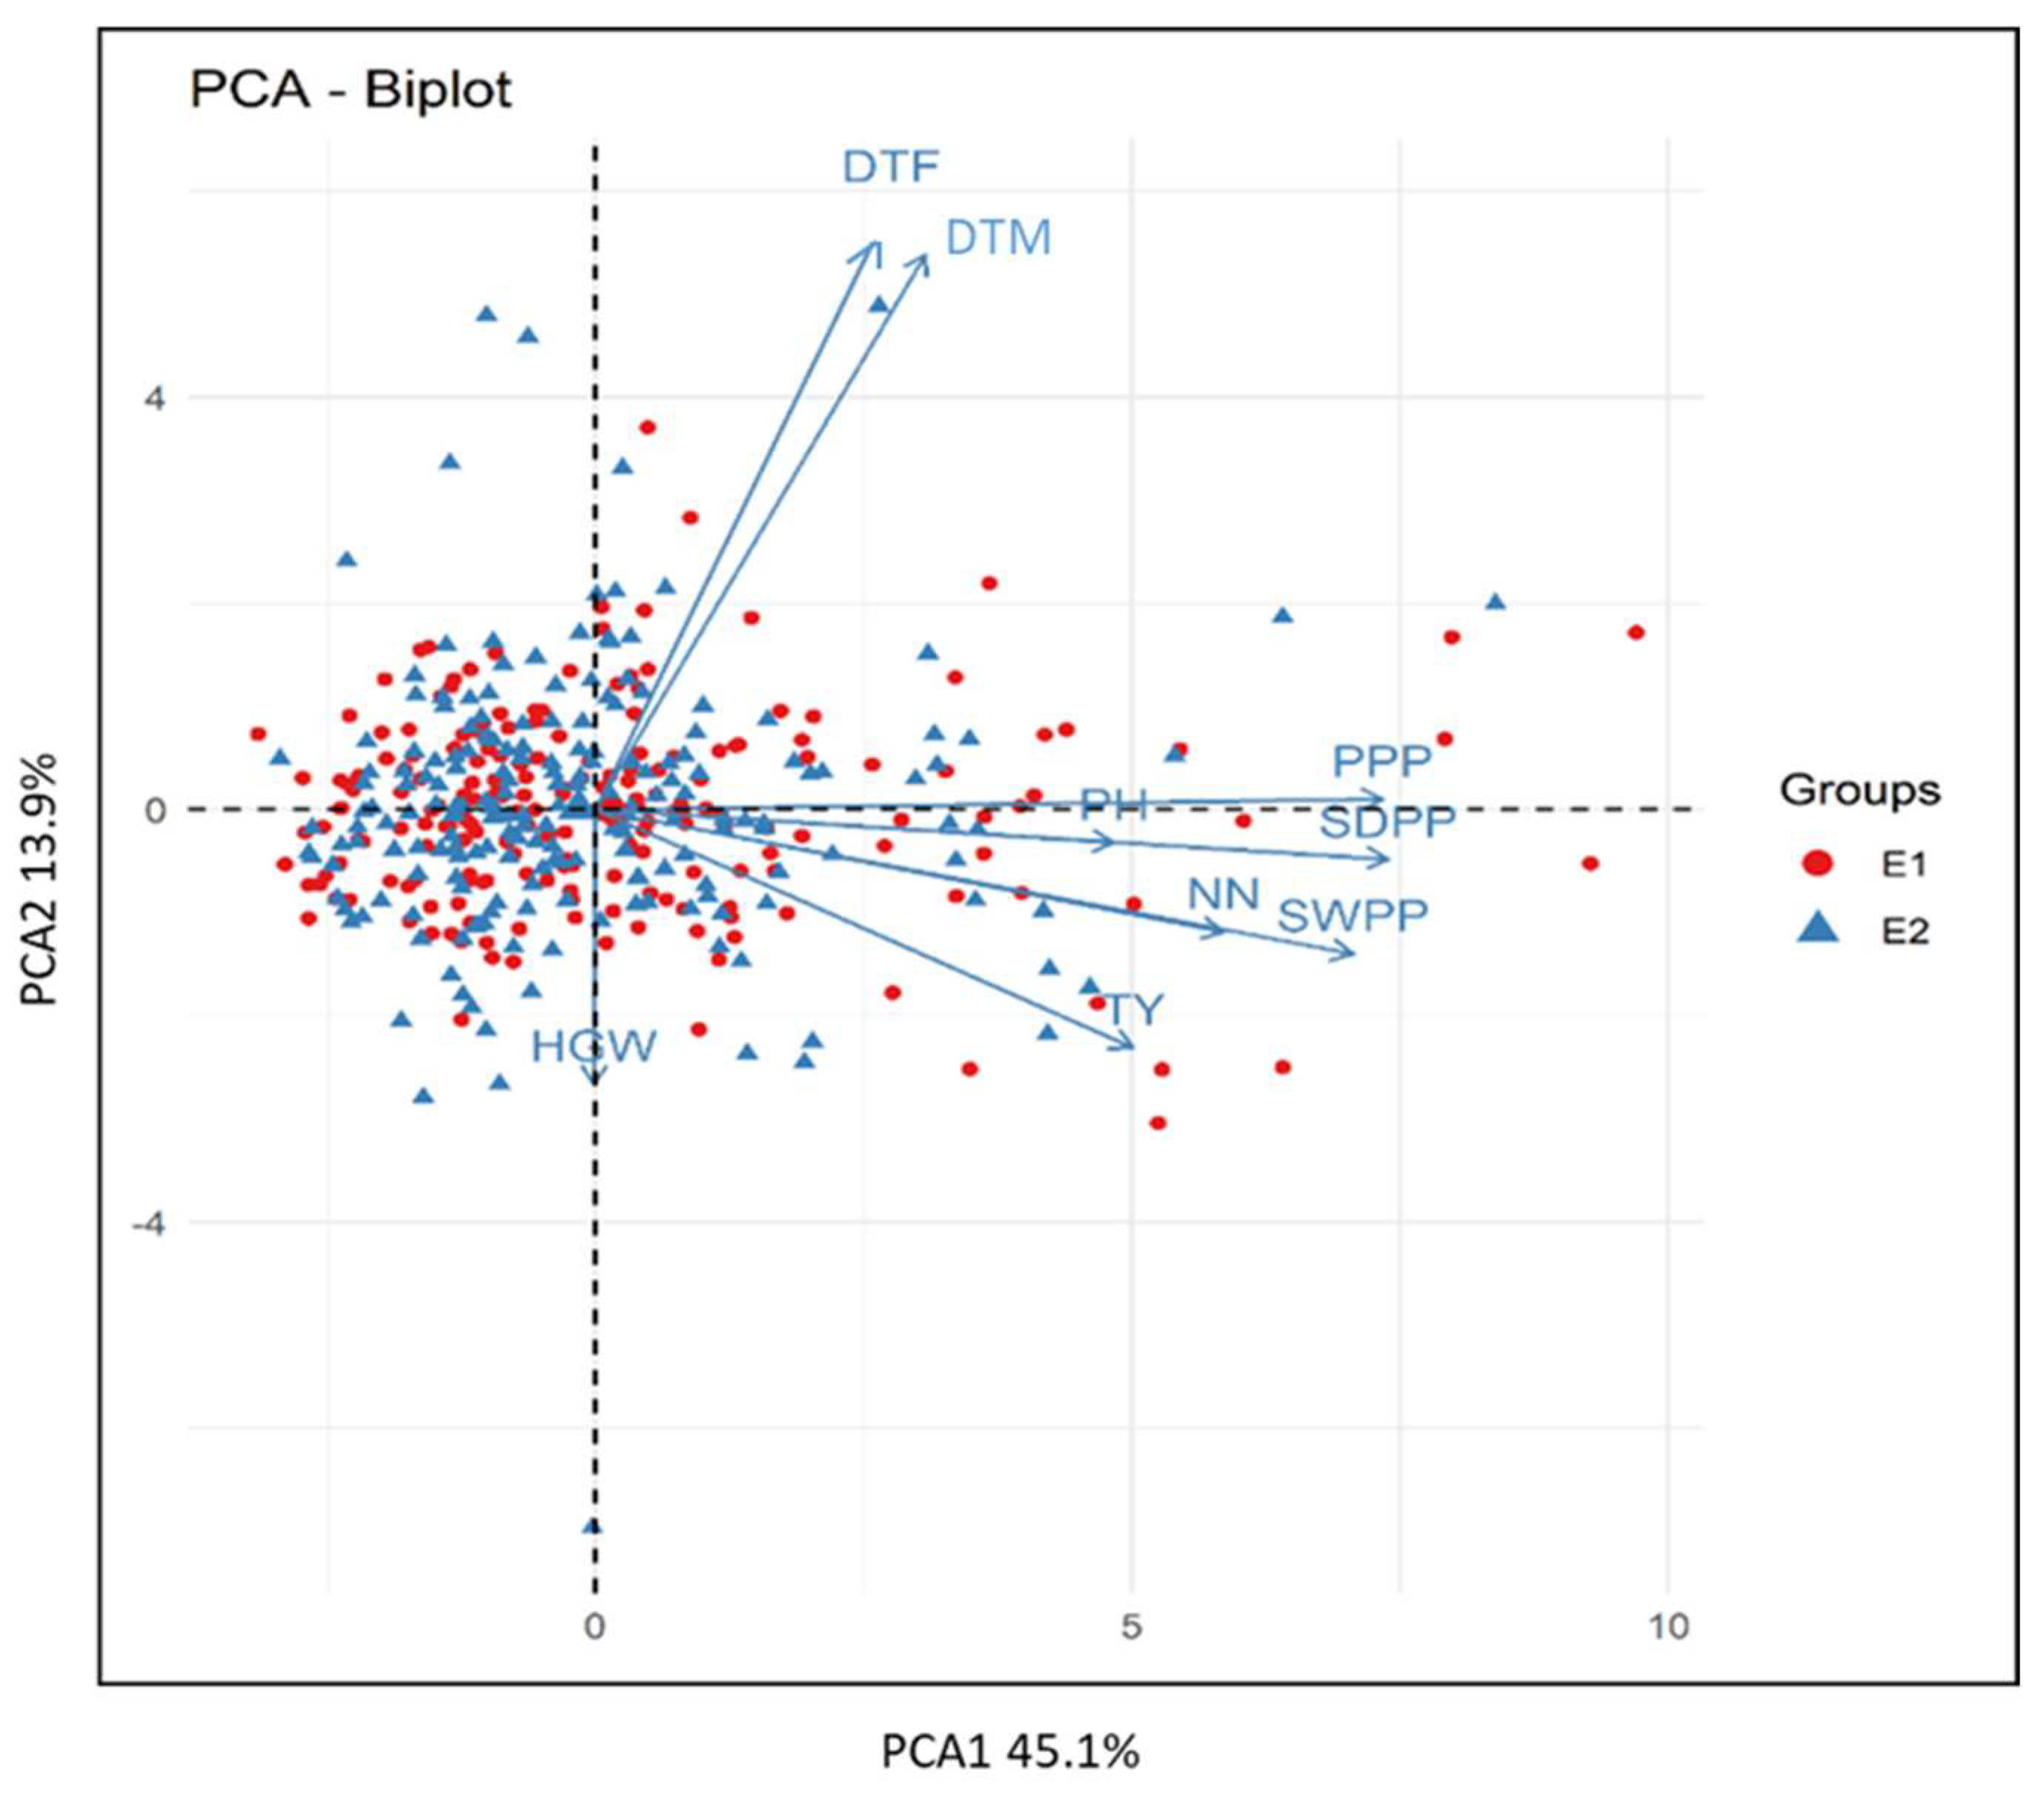
3.6. Biplot Analysis

The first two highly significant principle components accounted for 59% of the total variation and are displayed in the biplot (Figure 3). The extensive coverage of Euclidean space by the trait vector suggests that the phenotypic traits considered are strongly contrasting. The angle between TY and PH, NN, PPP, SDPP, SWPP, and HGW is an acute angle, i.e., less than 90° (Figure 3), which implies that the majority of these traits have positive associations with the evaluated genotypes. Positively correlated traits like PH, PPP, and HGW lack association because their angles are so near to 90° (Figure 3), whereas DTF and DTM were associated with TY, PH, PPP, SDPP, SWPP, and HGW with both strong and negative correlations (angles greater than 90°),
The first principal component (PC1) explained 45.1% of the total variation. As shown in Figure 3, genotypes with higher PH, NN, PPP, SDPP, SWPP, and TY were located on the right side of the biplot. The majority of these genotypes were from C2 and represent the most differentiated group (Figure 1 and Figure 2). The genotypes on the left side of PC1 showed lower values for TY and its related traits (Figure 3). Most of them were from C1 and C3 (Figure 2).

3.7. Analysis of Agronomic Traits Based on BLUPs and BLUEs

Flowering and maturity time are important morphological traits that affect crop yields. In the present study, based on the prediction models, accession PI548298 took a minimum number of days for flowering, while the maximum number of days for flowering was observed for accession PI561401 (Supplementary Table S2). Similarly, accessions Swat-18, PI644045, and PI508084 took the maximum number of days for maturity, whereas accessions PI548488, PI644045, and PI508084 were observed as early maturing lines.
For PH maximum height was predicted for accessions Faisal Soybean, PI553041, and Swat-13, whereas minimum PH was observed for accessions PI583295, PI548477, and PI643146. Based on BLUP and BLUE values for the grand mean of traits, accessions PI644053, PI553042, PI657829, and PI553041 were observed with the highest number of nodes, whereas accessions PI079693, PI548477, and Swat-16 had the lowest number of nodes (Supplementary Table S2).
In this study, PPP, SDPP, and SWPP showed a significant variation among accessions. Based on the values obtained from the prediction models, accessions PI553041 and PI657829 had the highest mean for PPP, SDPP, and SWPP, whereas accessions PI079693 and PI567208 had the lowest values for these traits (Supplementary Table S2).
Soybean accessions PI548271, PI612608, PI553039, and PI518664 were identified as high-yielding and were better adapted by a mean yield based on their BLUP and BLUE values (Table 4 and Table 5), whereas accessions PI079693, PI548348, PI438496E, Ajmeri, and Swat-31 were identified as low-yielding accessions. Differences among the ranks of accessions observed by adaptability measures highlighted the presence of crossover interaction effects. The ranking of accessions based on mixed-models predictions was ideal and should be considered for the final recommendation of the best accessions.

4. Discussion

Soybean breeders have always remained in search of germplasm, which has wide adaptability, is photo-insensitive, and could provide potential yield under long-day conditions [20]. The findings of this study demonstrate the first long-day phenotyping evaluation performed on a panel of 203 soybean accessions from the USDA germplasm collection, along with locally adapted cultivars accounting for yield and other important agronomic traits. High variability was observed among the accessions for DTF, DTM, PH, PPP, SDPP, SWPP, and TY (Table 3), which could be due to the differences in geographical regions and genetic makeup [21,22]. Genetic variation is crucial for improving soybean grain yield in Pakistan. These traits are very important for evaluating the adaptability of soybean in any particular environment, as well as their productivity [23,2425].
Our results showed that the environment played a role in the phenotypic variation for the majority of traits (Table 1), although the extent was less significant than that of the G and GE effects. This was unexpected because typically the environment contributes the highest percentage of variation. These observations are possibly due to the similar environmental conditions for the two studied years (2016 and 2017) (Table 1).
Flowering and maturity times are important characteristics of soybean that contribute to the total yield [21]. In plants, photoreceptor regulation, geographic distribution, floral meristem, and flowering time explain the maturity time [24,26,27]. The flowering time in the soybean accessions examined in this study ranged from 48 to 76 days, whereas the maturity time varied between 86 and 155 days. The accessions that produced early flowers can be considered for short-period crops. The difference in flowering and maturity time in soybean cultivars was also reported by Khan and Bashir [28], who observed that soybean genotypes took 31–39 days for flowering and 84–100 days for maturity. The difference in flowering and maturity times was mainly due to changes in the planting time. Under certain ecological conditions, the timing of flowering and maturity has a significant impact on soybean productivity [29,30]. Therefore, in North America, soybean genotypes were classified into 13 maturity groups (MG) for breeding purposes [31]. This classification made it possible to compare seed maturation trends across a wide range of environments [32]. Another fundamental trait in plants that controls the yield, degree of lodging, and efficiency in the mechanized harvest is plant height. In phenotypic selection for better adaptivity, PH can be used to screen the desired lines because it depends on environmental factors. Typically, the ideal plant height considered for soybean plants is 70–90 cm, and plants with taller or shorter heights lead to yield reduction [33,34]. In this study, the observed PH ranged from 9.33 cm to 84.33 cm which is a significant range. The variation in PH was also reported by Guzman et al. [35], who observed a maximum of 82 to 88 cm PH in three-year data. In another study, Rehman et al. [36] stated that the difference in plant height may be due to a longer photoperiod.
Yield components like PPP, SDPP, and SWPP have a significant impact on the final yield. In our study, PPP, SDPP, and SWPP were found to be positively correlated with the total yield (Figure 1). Although significant variation was observed in these traits among the accessions, the overall yield can be enhanced by increasing PPP, SDPP, and SWPP. Using yield component analysis, it is possible to examine the relationships between yield components and how they affect yield [37]. However, this is difficult because the results observed in different studies vary, e.g., PPP, SDPP, and SWPP are positively correlated with the total yield in the present study. However, significant variations among soybean genotypes for these traits were also reported in [28,38,39,40]. This variation is due to the differences in methodologies, data collection, and analysis techniques. Despite these challenges, skillfully planned and executed field studies combined with physiological understanding can offer insightful information on how traits affect yield [41]. Apart from the above-mentioned factors, seed shrinkage was also observed in most of the evaluated germplasm. However, accessions with high yields showed negligible seed shrinkage. Coradi et al. [42] reported that shrinkage is mainly due to the high temperature and low moisture at the harvesting stage, which affects the final yield by reducing the volume of the grains. HGW is another important trait that affects the final yield of soybean. The accessions that showed more HGW were bold-seeded, which can be further used for crop enhancement programs. So, genotypes have a significant effect on the total crop yield. Similar results were reported by the authors of [28,43,44], who observed significant differences in HGW for different genotypes.
The agro-morphological traits follow a complex pattern of inheritance; thus, the correlation analysis provides useful insights regarding the relationship among the traits and helps researchers understand the evolutionary constraints involved in breeding soybeans [45]. In the current study, TY was positively correlated with DTF, DTM, PH, PPP, SDPP, SWPP, and HGW, indicating that these yield components are very important in determining the total yield of soybean. Previous studies [46,47,48,49] reported a strong correlation between yield and other yield-related traits while working on the morphological variability and agronomic characteristics of soybean accessions. DTF, DTM, and PH showed positive but non-significant correlations of 0.065, 0.13, and 0.23 with TY, which is in line with the results of Rodrigues et al. [50], who found that DTF, DTM, and PH have a positive but non-significant effect on TY. But these findings were in contrast to the results of Malik et al. [43], who found a negative correlation between DTF and DTM with TY. This difference in results might be due to day length or other abiotic factors; however, we did not study abiotic stress factors and followed recommended agronomic practices. In the present study, HGW showed a low positive correlation with all of the traits. In a previous study, Iqbal et al. [51] found a highly significant and positive correlation between HGW and TY, and PPP SDPP, and SWPP, showing a slightly high positive correlation of 0.52 and 0.61 with TY. The correlation analysis of all accessions showed a positive correlation between PPP and PH, DTF, DTM, SDPP, and TY. Similar findings were also reported in previous studies [28,40,52,53,54]. Hence, based on these findings, PPP, SDPP, and SWPP showed a significant positive correlation with yield. So, these traits can be effective selection criteria for improving the seed yield [55].
In crops, phenotypic traits are mainly controlled by the genetic makeup of that crop along with the particular environment in which they grow, as well as the genotype and environment interaction [56]. Measuring heritability, phenotypic coefficient of variance, and genotypic coefficient of variance is important because observed variability can be divided into heritable and non-heritable measures. In the present study, genotypic variance, phenotypic variance, and heritability showed considerable variation, indicating that there is enough scope for the selection of the desired germplasm based on agronomic traits (Table 3). PCV observed for all the traits was slightly higher than GCV, which indicated that the variation observed was not only due to genotypes but also due to environmental influence. Earlier, Aditya et al. [46] also observed a significant variation in yield-attributing traits. They reported that both the PCV and GCV observed for TY and PPP were significantly higher. In the present study, both PCV (77.97) and GCV (77.47) were calculated for TY, PPP (63.05/72.86), and SDPP (62.22/70.09), which were found to be higher, as suggested in the findings by Gohil et al. [57] and Akram et al. [58], who estimated higher values of GCV and PCV for PPP and SWPP. Less distance between GCV and PCV was calculated for DTF (7.8/8.03), DTM (11.87/11.87), and HGW (4.97/18.72), indicating that these traits were less affected by environmental variation. Previous studies [46,59,60] also reported less distance between GCV and PCV for DTF and DTM. In the present study, we observed higher values of GA and heritability for TY, which is more beneficial for selecting the best individual as compared to heritability alone. Neelima et al. [61] also observed similar results, indicating that it is not always possible to have higher values for both heritability and genetic advances for a particular trait. A trait with a higher value for heritability may be due to the additive gene effect and may be easily improved by selection [57]. A higher value of GA and heritability is helpful for breeders to identify the suitable characteristics for selection based on phenotypic traits ([62,63,64,65,66]. So, using the phenotypic performance of these traits for selection would be successful in achieving significant improvement in crops.

5. Conclusions

In conclusion, significant phenotypic variability was observed among 203 genotypes for the examined agronomic traits under the agro-climatic long-day conditions in Faisalabad. The phenotypic correlations between PPP, SDPP, and SWPP showed that these traits are important indices for selecting suitable cultivars. Accessions PI548271 (MG IV) and PI553039 (MG VI) showed better yields (kg/ha) in both years. These lines are recommended for further field testing in multi-location yield trials under diverse climatic conditions. These soybean lines could be potential candidate lines for cultivation under long-day and high-temperature conditions.

Supplementary Materials

The following supporting information can be downloaded at: https://www.mdpi.com/article/10.3390/agronomy13092317/s1, Supplementary Table S1: List of accessions along with maturity group and origin. Supplementary Table S2: Analysis of agronomic traits based on BLUPs and BLUEs.

Author Contributions

M.A., G.R., Z.M. and R.R. conceived and designed the project. R.R., S.U.R., M.H. and G.R. were involved in field evaluation studies. R.R. and M.R. analyzed the data. R.R. wrote the manuscript with input from S.U.R. and M.R. and feedback from all the authors. M.R. and H.S. provided technical inputs and revised the manuscript critically. All authors have read and agreed to the published version of the manuscript.

Funding

This research received no external funding.

Data Availability Statement

Not applicable.

Acknowledgments

The authors acknowledge the Agriculture Research Services of the United States Department of Agriculture (USDA-ARS), USA, for providing soybean germplasm and the Punjab Agricultural Research Board (PARB), Lahore, for their financial support.

Conflicts of Interest

The authors declare no conflict of interest.

References

  1. Xu, B.J.; Chang, S. A comparative study on phenolic profiles and antioxidant activities of legumes as affected by extraction solvents. J. Food Sci. 2007, 72, S159–S166. [Google Scholar] [CrossRef]
  2. Raza, G.; Ahmad, N.; Hussain, M.; Zafar, Y.; Rahman, M. Role of genetics and genomics in mitigating abiotic stresses in soybeans. In Environmental Stresses in Soybean Production; Elsevier: Amsterdam, The Netherlands, 2016; pp. 205–228. [Google Scholar]
  3. Rani, R.; Raza, G.; Tung, M.H.; Rizwan, M.; Ashfaq, H.; Shimelis, H.; Razzaq, M.K.; Arif, M. Genetic diversity and population structure analysis in cultivated soybean (Glycine max [L.] Merr.) using SSR and EST-SSR markers. PLoS ONE 2023, 18, e0286099. [Google Scholar] [CrossRef] [PubMed]
  4. Faostat, F. New Food Balances. 2021. Available online: http://www.fao.org/faostat (accessed on 20 August 2023).
  5. Ali, L.; Mi, J.; Shah, M.; Shah, S.J.; BiBi, K. The potential socio-economic impact of china Pakistan economic corridor. Asian Dev. Policy Rev. 2017, 5, 191–198. [Google Scholar] [CrossRef]
  6. Mustafa, H.S.B.; Sarwar, S.; Aftab, M.; Hassan, A. Crop Diversification Through Soybean Cultivation in Punjab; Oilseeds Research Institute: Faisalabad, Pakistan, 2021. [Google Scholar]
  7. Khurshid, H.; Baig, D.; Jan, S.; Arshad, M.; Khan, M. Miracle crop: The present and future of soybean production in Pakistan. MOJ Biol. Med. 2017, 2, 189–191. [Google Scholar] [CrossRef]
  8. Baig, D.; Khurshid, H.; Arshad, M.; Jan, S.A.; Khan, M.A.; Nawaz, N. 1. Evaluation of Soybean genotypes for yield and other economically important traits under rainfed condition. Pure Appl. Biol. 2018, 7, 1–7. [Google Scholar] [CrossRef]
  9. Asad, S.A.; Wahid, M.A.; Farina, S.; Ali, R.; Muhammad, F. Soybean production in Pakistan: Experiences, challenges and prospects. Int. J. Agri. Biol. 2020, 24, 995–1005. [Google Scholar]
  10. Han, Y.; Zhao, X.; Liu, D.; Li, Y.; Lightfoot, D.A.; Yang, Z.; Zhao, L.; Zhou, G.; Wang, Z.; Huang, L. Domestication footprints anchor genomic regions of agronomic importance in soybeans. New Phytol. 2016, 209, 871–884. [Google Scholar] [CrossRef]
  11. Song, Q.; Hyten, D.L.; Jia, G.; Quigley, C.V.; Fickus, E.W.; Nelson, R.L.; Cregan, P.B. Fingerprinting soybean germplasm and its utility in genomic research. G3 Genes Genom. Genet. 2015, 5, 1999–2006. [Google Scholar] [CrossRef]
  12. Arif, A.; Parveen, N.; Waheed, M.Q.; Atif, R.M.; Waqar, I.; Shah, T.M. A comparative study for assessing the drought-tolerance of chickpea under varying natural growth environments. Front. Plant Sci. 2021, 11, 607869. [Google Scholar] [CrossRef] [PubMed]
  13. Balduzzi, S.; Rücker, G.; Schwarzer, G. How to perform a meta-analysis with R: A practical tutorial. BMJ Ment. Health 2019, 22, 153–160. [Google Scholar] [CrossRef]
  14. Robinson, G.K. That BLUP is a good thing: The estimation of random effects. Stat. Sci. 1991, 6, 15–32. [Google Scholar]
  15. Piepho, H.P. Best linear unbiased prediction (BLUP) for regional yield trials: A comparison to additive main effects and multiplicative interaction (AMMI) analysis. Theor. Appl. Genet. 1994, 89, 647–654. [Google Scholar] [CrossRef] [PubMed]
  16. Lafaye de Micheaux, P.; Drouilhet, R.; Liquet, B. The R Software: Fundamentals of Programming and Statistical Analysis; Springer Publishing Company: New York, NY, USA, 2013. [Google Scholar]
  17. Köhn, H.F.; Hubert, L.J. Hierarchical Cluster Analysis; Wiley: Hoboken, NJ, USA, 2014; pp. 1–13. [Google Scholar]
  18. Lush, J.L. Heritability of Quantitative Characters in Farm Animals. Hereditas 1949, 35, 356–375. [Google Scholar] [CrossRef]
  19. Robinson, H.; Comstock, R.E.; Harvey, P. Estimates of heritability and the degree of dominance in corn. Agron. J. 1949, 41, 353–359. [Google Scholar] [CrossRef]
  20. Rani, R.; Raza, G.; Ashfaq, H.; Rizwan, M.; Shimelis, H.; Tung, M.H.; Arif, M. Analysis of genotype× environment interactions for agronomic traits of soybean (Glycine max [L.] Merr.) using association mapping. Front. Genet. 2023, 13, 1090994. [Google Scholar] [CrossRef] [PubMed]
  21. Li, Z.; Nelson, R.L. Genetic diversity among soybean accessions from three countries measured by RAPDs. Crop Sci. 2001, 41, 1337–1347. [Google Scholar] [CrossRef]
  22. Sharma, S.; Rao, S.; Goswami, U. Genetic variation, correlation and regression analysis and their implications in selection of exotic soybean. Mysore J. Agric. Sci. 1983, 17, 26–30. [Google Scholar]
  23. Zhang, Z.; Deng, Y.; Tan, J.; Hu, S.; Yu, J.; Xue, Q. A genome-wide microsatellite polymorphism database for the indica and japonica rice. DNA Res. 2007, 14, 37–45. [Google Scholar] [CrossRef]
  24. Zhang, J.; Song, Q.; Cregan, P.B.; Jiang, G.L. Genome-wide association study, genomic prediction and marker-assisted selection for seed weight in soybean (Glycine max). Theor. Appl. Genet. 2016, 129, 117–130. [Google Scholar] [CrossRef]
  25. Watanabe, S.; Harada, K.; Abe, J. Genetic and molecular bases of photoperiod responses of flowering in soybean. Breed. Sci. 2012, 61, 531–543. [Google Scholar] [CrossRef]
  26. Contreras-Soto, R.I.; Mora, F.; de Oliveira, M.A.R.; Higashi, W.; Scapim, C.A.; Schuster, I. A genome-wide association study for agronomic traits in soybean using SNP markers and SNP-based haplotype analysis. PLoS ONE 2017, 12, e0171105. [Google Scholar] [CrossRef]
  27. Liu, B.; Kanazawa, A.; Matsumura, H.; Takahashi, R.; Harada, K.; Abe, J. Genetic redundancy in soybean photoresponses associated with duplication of the phytochrome A gene. Genetics 2008, 180, 995–1007. [Google Scholar] [CrossRef]
  28. Tian, Z.; Wang, X.; Lee, R.; Li, Y.; Specht, J.E.; Nelson, R.L.; McClean, P.E.; Qiu, L.; Ma, J. Artificial selection for determinate growth habit in soybean. Proc. Nat. Acad. Sci. USA 2010, 107, 8563–8568. [Google Scholar] [CrossRef] [PubMed]
  29. Khan, H.; Bashir, M. Evaluation of mid-season soybean varieties at Mansehra [Pakistan]. Sarhad J. Agric. 2005, 21, 531–533. [Google Scholar]
  30. Jiang, B.; Nan, H.; Gao, Y.; Tang, L.; Yue, Y.; Lu, S.; Ma, L.; Cao, D.; Sun, S.; Wang, J. Allelic combinations of soybean maturity loci E1, E2, E3 and E4 result in diversity of maturity and adaptation to different latitudes. PLoS ONE 2014, 9, e106042. [Google Scholar] [CrossRef] [PubMed]
  31. Zhai, H.; Lü, S.; Wang, Y.; Chen, X.; Ren, H.; Yang, J.; Cheng, W.; Zong, C.; Gu, H.; Qiu, H. Allelic variations at four major maturity E genes and transcriptional abundance of the E1 gene are associated with flowering time and maturity of soybean cultivars. PLoS ONE 2014, 9, e97636. [Google Scholar] [CrossRef]
  32. Zhang, L.; Kyei-Boahen, S.; Zhang, J.; Zhang, M.; Freeland, T.; Watson, C., Jr.; Liu, X. Modifications of optimum adaptation zones for soybean maturity groups in the USA. Crop Manag. 2007, 6, 1–11. [Google Scholar] [CrossRef]
  33. Jia, H.; Jiang, B.; Wu, C.; Lu, W.; Hou, W.; Sun, S.; Yan, H.; Han, T. Maturity group classification and maturity locus genotyping of early-maturing soybean varieties from high-latitude cold regions. PLoS ONE 2014, 9, e94139. [Google Scholar] [CrossRef]
  34. Josie, J.; Alcivar, A.; Rainho, J.; Kassem, M.A. Genomic regions containing QTL for plant height, internodes length, and flower color in soybean [Glycine max (L.) Merr]. Bios 2007, 78, 119–126. [Google Scholar] [CrossRef]
  35. Huang, Z.; Wang, W.; Xu, X.; Wen, Z.; Li, H.; Li, J.; Lu, W. Relationship of dynamic plant height and its relative growth rate with yield using recombinant inbred lines of soybean. Acta Agron. Sin. 2011, 37, 559–562. [Google Scholar] [CrossRef]
  36. Guzman, P.; Diers, B.W.; Neece, D.; St. Martin, S.; LeRoy, A.; Grau, C.; Hughes, T.; Nelson, R.L. QTL associated with yield in three backcross-derived populations of soybean. Crop Sci. 2007, 47, 111–122. [Google Scholar] [CrossRef]
  37. Rehman, M.; Khaliq, T.; Ahmad, A.; Wajid, S.A.; Rasul, F.; Hussain, J.; Hussain, S. Effect of planting time and cultivar on soybean performance in Semi–Arid Punjab, Pakistan. Global J. Sci. Front. Res. Agric. Vet. 2014, 14, 41–45. [Google Scholar]
  38. Xavier, A.; Hall, B.; Casteel, S.; Muir, W.; Rainey, K.M. Using unsupervised learning techniques to assess interactions among complex traits in soybeans. Euphytica 2017, 213, 1–18. [Google Scholar] [CrossRef]
  39. Iqbal, Z.; Naeem, R.; Ashraf, M.; Arshad, M.; Afzal, A.; Shah, A.H.; Khan, M.S.; Farooq, M. Genetic diversity of soybean accessions using seed storage proteins. Pak. J. Bot. 2015, 47, 203–209. [Google Scholar]
  40. Liu, X.; Wu, J.-A.; Ren, H.; Qi, Y.; Li, C.; Cao, J.; Zhang, X.; Zhang, Z.; Cai, Z.; Gai, J. Genetic variation of world soybean maturity date and geographic distribution of maturity groups. Breed. Sci. 2017, 67, 221–232. [Google Scholar] [CrossRef]
  41. Sinclair, T.R.; Purcell, L.C. Is a physiological perspective relevant in a ‘genocentric’age? J. Exp. Bot. 2005, 56, 2777–2782. [Google Scholar] [CrossRef] [PubMed]
  42. Coradi, P.C.; Fernandes, C.H.; Helmich, J.C.; Goneli, A.L. Effects of drying air temperature and grain initial moisture content on soybean quality (Glycine max (L.) Merrill). Eng. Agríc. 2016, 36, 866–876. [Google Scholar] [CrossRef]
  43. Malik, M.F.A.; Ashraf, M.; Qureshi, A.S.; Ghafoor, A. Assessment of genetic variability, correlation and path analyses for yield and its components in soybean. Pak. J. Bot. 2007, 39, 405. [Google Scholar]
  44. Ashraf, M.; Iqbal, Z.; Arshad, M.; Waheed, A.; Glufran, M.A.; Chaudhry, Z.; Baig, D. Multi-environment response in seed yield of soybean [Glycine max (L.) Merrill], genotypes through GGE biplot technique. Pak. J. Bot. 2010, 42, 3899–3905. [Google Scholar]
  45. Cruz, C.; Regazzi, A.; Carneiro, P. Modelos biométricos Aplicados ao Melhoramento; UFV: Viçosa, Brazil, 2012. [Google Scholar]
  46. Aditya, J.; Bhartiya, P.; Bhartiya, A. Genetic variability, heritability and character association for yield and component characters in soybean (G. max (L.) Merrill). J. Cen. Eur. Agric. 2011, 12, 27–34. [Google Scholar] [CrossRef]
  47. Mudibu, J.; Nkongolo, K.; Kalonji-Mbuyi, A. Morphovariability and agronomic characteristics of soybean accessions from the Democratic Republic of Congo (DR-Congo) gene pool. J. Plant Breed. Crop Sci. 2011, 3, 260–268. [Google Scholar]
  48. Abady, S.; Merkeb, F.; Dilnesaw, Z. Heritability and path-coefficient analysis in soybean (Glycine Max L. Merrill) genotypes at Pawe, North Western Ethiopia. J. Environ. Sci. Water Resour. 2013, 2, 270–276. [Google Scholar]
  49. Ngalamu, T.; Ashraf, M.; Meseka, S. Soybean (Glycine max L.) genotype and environment interaction effect on yield and other related traits. J. Exp. Agric. Int. 2013, 3, 977–987. [Google Scholar] [CrossRef]
  50. Rodrigues, B.; Serafim, F.; Nogueira, A.; Hamawaki, O.; Sousa, L.; Hamawaki, R. Correlations between traits in soybean (Glycine max L.) naturally infected with Asian rust (Phakopsora pachyrhizi). Genet. Mol. Res. 2015, 14, 17718–17729. [Google Scholar] [CrossRef] [PubMed]
  51. Iqbal, S.; Mahmood, T.; Ali, M.; Anwar, M.; Sarwar, M. Path coefficient analysis in different genotypes of soybean (Glycine max (L.) Merril). Pak. J. Biol. Sci. 2003, 6, 1085–1087. [Google Scholar] [CrossRef]
  52. Hatam, M. Performance of AVRDC vegetable soybean germplasm under Peshawar valley conditions [Pakistan]. Sarhad J. Agric. 2001, 17, 27–31. [Google Scholar]
  53. Liu, K.; Muse, S.V. PowerMarker: An integrated analysis environment for genetic marker analysis. Bioinformatics 2005, 21, 2128–2129. [Google Scholar] [CrossRef] [PubMed]
  54. Lyimo, L.D.; Tamba, M.R.; Madege, R.R. Effects of genotype on yield and yield component of soybean (Glycine max (L.) Merrill). Afr. J. Agric, Res. 2017, 12, 1930–1939. [Google Scholar]
  55. Abd El-Mohsen, A.A.; Mahmoud, G.O.; Safina, S.A. Agronomical evaluation of six soybean cultivars using correlation and regression analysis under different irrigation regime conditions. J. Plant Breed. Crop Sci. 2013, 5, 91–102. [Google Scholar] [CrossRef]
  56. Ajayi, A.; Adekola, M.; Taiwo, B.; Azuh, V. Character expression and differences in yield potential of ten genotypes of cowpea (Vigna unguiculata L. Walp). Int. J. Plant Res. 2014, 4, 63–71. [Google Scholar]
  57. Gohil, V.; Pandya, H.; Mehta, D. Genetic variability for seed yield and its component traits in soybean. Agric. Sci. Dig. 2006, 26, 73–74. [Google Scholar]
  58. Akram, S.; Hussain, B.N.; Al Bari, M.A.; Burritt, D.J.; Hossain, M.A. Genetic variability and association analysis of soybean (Glycine max (L.) Merrill) for yield and yield attributing traits. Plant Gene Trait 2016, 7, 13. [Google Scholar] [CrossRef]
  59. Bangar, N.; Mukhekar, G.; Lad, D.; Mukhekar, D. Genetic variability, correlation and regression studies in soybean. J. Maha-Rashtra Agric. Uni. 2003, 28, 320–321. [Google Scholar]
  60. Karnwal, M.K.; Singh, K. Studies on genetic variability, character association and path coefficient for seed yield and its contributing traits in soybean [Glycine max (L.) Merrill]. Legume Res. 2009, 32, 70–73. [Google Scholar]
  61. Neelima, G.; Mehtre, S.; Narkhede, G. Genetic variability, heritability and genetic advance in soybean. Int. J. Pure Appl. Biosci. 2018, 6, 1011–1017. [Google Scholar] [CrossRef]
  62. Reni, Y.P.; Rao, Y.K. Genetic variability in soybean [Glycine max (L.) Merrill]. Int. J. Plant Animal Environ. Sci. 2013, 3, 35–38. [Google Scholar]
  63. Baraskar, V.; Kachhadia, V.; VachhanI, J.; Barad, H.; Patel, M.; Darwankar, M. Genetic variability, heritability and genetic advance in soybean [Glycine max (L.) Merrill]. Electron. J. Plant Breed. 2014, 5, 802–806. [Google Scholar]
  64. Malek, M.; Rafii, M.Y.; Afroz, S.S.; Nath, U.K.; Mondal, M. Morphological characterization and assessment of genetic variability, character association, and divergence in soybean mutants. Sci. World J. 2014. [Google Scholar] [CrossRef] [PubMed]
  65. Stuti, M.; Pancheshwar, D.K.; Prateek, S.; Avinash, J. Study of genetic variability in recently evolved genotypes of soybean [Glycine max (L.) Merill]. Trends Biosci. 2015, 8, 5390–5393. [Google Scholar]
  66. Chandrawat, K.S.; Baig, K.; Hashmi, S.; Sarang, D.; Kumar, A.; Dumai, P.K. Study on genetic variability, heritability and genetic advance in soybean. Int. J. Pure Appl. Biosci. 2017, 5, 57–63. [Google Scholar] [CrossRef]
Figure 1. Correlation coefficients representing the scatter matrix plots of agronomic traits. The correlation matrix (above the diagonal), frequency distributions (gray bars), and bivariate scatter plots with a fitted line below the diagonal are shown. Days to flowering (DTF), days to maturity (DTM), plant height (PH), number of nodes (NN), pods per plant (PPP), seeds per plant (SDPP), seed weight per plant (SWPP), 100-grain weight (HGW), and total yield (TY). Each variable’s distribution is displayed diagonally. The bivariate scatter plots with a fitted line are shown at the bottom of the diagonal. The correlation coefficient is displayed at the top of the diagonal and the level of significance is displayed as stars (** = 0.001, *** = 0). The correlation coefficients are proportional to the color intensity and the size of the correlation values.
Agronomy 13 02317 g001
Figure 2. Phylogenetic analysis among 203 soybean accessions based on nine agronomic traits. An unrooted neighbor-joining tree divides the 203 accessions into three clusters. Accessions are displayed as G1 to G203 as shown in the supplementary table. C1, C2, and C3 show three clusters.
Agronomy 13 02317 g002
Figure 3. PCA biplot analysis of nine agronomic traits of 203 soybean accessions evaluated during 2016 (E1) and 2017 (E2). The first two interactive principal components explain 45.1% and 13.9% variations, respectively. Traits are represented by vectors, while genotypes are represented by symbols. Similar color symbols show genotype groups with members of the same response pattern. Days to flowering (DTF), days to maturity (DTM), plant height (PH), number of nodes (NN), pods per plant (PPP), seeds per plant (SDPP), seed weight per plant (SWPP), 100-grain weight (HGW), and total yield (TY).
Agronomy 13 02317 g003
Table 1. Weather conditions recorded during the cropping season 2016–2017.
Growing SeasonYearTemperature °CHumidity (%)Rain (mm)Wind (km/h)Pressure (mm)PhotoperiodCropping Stage
MaxMinMeanh·min
February201628.2113.2520.7330.92091015.111–04Sowing
201727.8213.0720.4433.570.118.571015.511–04
March201631.2217.4524.3341.452.1210.381011.9612–00Vegetative stage
201731.7716.0323.933.450.358.191010.8711–59
April201637.1323.5330.3323.230.3411.131005.712–57Reproductive Stage
201740.3325.3332.8321.461.299.931004.312–57
May201643.5831.4537.5119.450.49.25999.2513–45Reproductive Stage
201744.1630.8737.5118.830.168.121000.7713–45
June201646.0334.9340.4822.270.078.8996.6414–09Harvesting
201742.9633.5638.2626.671.178.3996.7514–09
July201642.5133.6138.0635.480.697.32994.9613–57Harvesting
201742.1233.8737.99534.960.28.77996.1913–57
Table 2. Estimate of eight agronomic traits for 203 genotypes of soybean during 2016–2017.
TraitsXδ2gδ2pδ2eδ2g × δ2eLSDCV
DTF54.2417.53 ***17.5203.31 ***3.571.46
DTM120212.92 ***212.92042.29 ***12.893.19
PH24.690.83 ***94.683.85 ***19.39 ***8.9211.98
NN13.4317.29 ***17.29015.72 ***6.9424.26
PPP47.84683.91 ***724.0840.17 ***296.91 ***33.0925.77
SDPP85.262123.61 ***2235.6111.99 ***817.39 ***55.8725.01
SWPP10.8933.01 ***34.611.6 ***11.63 ***6.7724.77
TY58.532157.67 ***2177.419.73 ***60.91 ***16.875.23
*** 0.001 level of significance. X: grand mean, δ2g: genotypic variance, δ2p: phenotypic variance, δ2e: environmental variance, LSD: least significant difference, CV: coefficient of variance, DTF: days to flowering, DTM: days to maturity, PPP: pods per plant, PH: plant height, NN: number of nodes, SDPP: seeds per plant, SWPP: seed weight per plant, and TY: total yield.
Table 3. Estimate of variability, heritability, and genetic advance for different agronomic traits.
TraitsSEmGCV (%)PCV (%)H2 (%)GA
DTF0.5987.88.03918.46
DTM0.161611.8711.879029.41
PPP11.1363.0572.868059.39
PH1.963644.2346.068920.02
NN1.9247.253.456411.41
SDPP17.3462.2270.0981105.86
SWPP2.1959.1267.478212.46
HGW0.394.9718.72924.91
TY24.9477.4777.7999977.34
GCV%: percentage of genotypic coefficient of variance, PCV%: percentage of phenotypic coefficient of variance, H2%: percentage of broad sense heritability, GA: genetic advance, DTF: days to flowering, DTM: days to maturity, PPP: pods per plant, PH: plant height, NN: number of nodes, SDPP: seeds per plant, SWPP: seed weight per plant, HGW: hundred-grain weight, and TY: total yield.
Table 4. Descriptive performance of different yield parameters (means) in 2016.
Soybean GermplasmDays to Flowering (DTF)Days to Maturity (DTM)Pods per Plant (No.)Plant Height (cm)Nodes per Plant (No.)Seeds per Plant (No.)Seed Weight per Plant (g)100 Seed Weight (g)Seed Yield (kg ha−1)
PI54827162 ± 1.15 a131 ± 0.57 ab198.3 ± 17.63 a36.3 ± 0.88 cd32.3 ± 2.03 bc406 ± 73.33 a37.9 ± 1.54 a11.3 ± 0.61 h2150.6 ± 358.65 a
PI55303958 ± 0.57 ab137 ± 0.57 ab89 ± 2.08 efg25 ± 2.89 efgh17.7 ± 2.34 efg155 ± 1.73 defg26.1 ± 0.20 bcdef15.3 ± 0.26 de2027.9 ± 228.33 ab
PI61260849 ± 1.15 abc106 ± 0.57 abcde126.3 ± 5.85 cd40 ± 2.65 c32.7 ± 3.48 bc187 ± 45.94 cdef28.1 ± 5.12 abcd15.7 ± 0.09 cd1966.2 ± 258.93 ab
PI51866455.33 ± 0.66 ab135 ± 0.57 ab77.3 ± 5.46 efgh23.3 ± 1.45 fghi12 ± 0.58 ghi135.3 ± 18.29 defgh25 ± 2.92 cdefg16.2 ± 0.20 bc1964.2 ± 171.86 ab
PI55304249 ± 1.15 abc128 ± 0.57 abc101.7 ± 9.88 cdefg48 ± 2.31 b40.3 ± 3.18 a222.3 ± 24.86 cd33.7 ± 4.34 abc14 ± 0.20 f1927.4 ± 200.15 abc
PI59182567 ± 0.57 a135 ± 0.57 ab190 ± 20.23 ab27 ± 1.53 efg28 ± 1.73 cd320 ± 52.74 ab35.4 ± 5.62 ab11.1 ± 0.19 h1915.1 ± 155.20 abc
PI54865754 ± 0.57 ab113 ± 0.57 abcd63.3 ± 6.23 fghi20 ± 0 hi9.3 ± 1.45 hi123.3 ± 9.83 efgh16.8 ± 1.07 fgh14.6 ± 0.35 ef1888.4 ± 148.08 abcd
PI60446455 ± 0.57 ab134 ± 0.57 ab60.7 ± 3.72 ghi21 ± 0.58 ghi15.3 ± 0.88 efgh97 ± 15.29 fgh16.1 ± 3.20 gh15.6 ± 0.19 cd1878.8 ± 178.09 abcd
Swat-2055 ± 0.57 ab128 ± 0.57 abc129 ± 11.52 cd34.3 ± 0.67 cd21.3 ± 4.92 def224 ± 10.61 cd27.8 ± 2.07 bcd12.3 ± 0.06 g1856.3 ± 140.27 abcd
PI54853354 ± 0.57 ab109 ± 0.57 abcde124.3 ± 44.48 cde39.3 ± 0.67 c19.7 ± 0.88 ef199 ± 36.06 cde29.1 ± 1.82 abcd16.8 ± 0.24 b1853.6 ± 80.76 abcd
PI51867149 ± 1.15 abc106 ± 0.57 abcde85.3 ± 20.39 defg38.7 ± 1.86 c16.3 ± 2.03 efgh198.3 ± 48.40 cde26.9 ± 6.48 bcde14.3 ± 0.15 f1825.7 ± 33.40 abcd
PI52223649 ± 0.57 abc118 ± 0.57 abcd109 ± 9.08 cdef27 ± 3.52 efg30.3 ± 2.61 c250 ± 13.52 bc33 ± 3.02 abc15.4 ± 0.40 d1743.5 ± 94.74 bcd
PI62883763 ± 0.57 a137 ± 0.57 ab132.7 ± 32.16 cd27.7 ± 1.20 ef21.7 ± 2.91 de222 ± 5.20 cd32.1 ± 3.32 abc12.7 ± 0.21 g1600.7 ± 8.60 cd
PI54840062 ± 1.15 a118 ± 0.57 abcd64.7 ± 7.89 fghi37.3 ± 1.45 c21.7 ± 1.86 de151.7 ± 6.67 defg21.2 ± 2.05 defg17.7 ±0.44 a1553.3 ± 45.82 d
PI54848249 ± 1.15 abc122 ± 0.57 abc107 ± 20.33 cdefg31 ± 2.0 de15 ± 0.58 efghi212.3 ± 23.01 cde25.1 ± 2.49 cdefg14.3 ± 0.46 f1546.4 ± 12.96 d
Faisal55 ± 0.57 ab139 ± 0.57 ab143 ± 4.7 abc84.33 ± 4.7 a37.66 ± 4.17 ab197 ± 22.50 cde17.26 ± 3.3 defg14 ± 0.17 fg513.33 ± 85.96 e
NARC250 ± 0.57 ab132 ± 0.57 ab27.33 ± 1.45 h17.33 ± 1.45 h8 ± 1 i73.33 ± 12.4 fg9 ± 0.65 fg12.86 ± 0.08 gh235.80 ± 10.90 f
Ajmeri56 ± 0.57 ab143 ± 0.57 a30 ± 0.577 h21 ± 12.58 gh14.33 ± 1.45 fghi45.66 ± 11.85 g8.33 ± 3.74 g10.56 ± 0.14 j57.03 ± 9.40 g
Values before ± are the means of the sample, and values after ± are the standard error of the mean. Means with the same letter are not significantly different. Analysis was performed using the Statistical Tool for Agricultural Research (STAR).
Table 5. Descriptive performance of different yield parameters (means) in 2017.
Soybean GermplasmDays to Flowering (DTF)Days to Maturity (DTM)Pods per Plant (No.)Plant Height (cm)Nodes per Plant (No.)Seeds per Plant (No.)Seed Weight per Plant (g)100 Seed Weight (g)Seed Yield (kg ha−1)
PI54827162 ± 0.57 a132 ± 0.57 ab190 ± 3.52 d35.33 ± 2.10 def29 ± 0.57 bcd384.11 ± 2.36 d33.18 ± 0.22 g9.32 ± 0.08 k2199.6 ± 16.62 a
PI55303962 ± 0.57 a141 ± 0.57 a77.33 ± 2.02 d33.33 ± 1.37 defg16 ± 0.57 abcd131.045 ± 4.32 d24.11 ± 0.51 g16.81 ± 0.05 b2017.41 ± 23.09 ab
PI51866455 ± 0.57 ab133 ± 0.57 ab67 ± 1.73 bcd25.89 ± 2.07 ghijk11 ± 0.58 abcd117.25 ± 3.03 bcd21.69 ± 0.56 abcd18.49 ± 0.01 a1968.89 ± 5.77 ab
PI61260852 ± 0.57 ab107 ± 0.57 abcde37 ± 1.15 d43.5 ± 1.80 bc25 ± 0.57 abcd184.05 ± 4.99 d28.11 ± 2.58 g14.99 ± 0.05 c1932.12 ± 20.82 ab
PI60446453 ± 0.57 ab132 ± 0.57 ab67 ± 1.15 bcd21.12 ± 1.54 ijk13 ± 2.08 abcd107.12 ± 1.84 bcd17.82 ± 0.3 bcdef16.63 ± 0.01 b1868.12 ± 17.29 abc
PI55304250 ± 0.57 ab129 ± 0.57 abc93 ± 1.15 abc46.12 ± 2.08 b92.33 ± 3.38 a203.38 ± 2.52 ab30.79 ± 0.38 a14.80 ± 0.33 cd1867.81 ± 16.62 abc
Swat-2054 ± 1.15 ab127 ± 1.15 abc110 ± 2.30 ab37.63 ± 1.15 cde19 ± 1.15 a191 ± 4.01 abc23.70 ± 0.49 abc12.34 ± 0.06 ghi1854.23 ± 9.23 abc
PI59182568 ± 0.57 a136 ± 0.57 ab186.33 ± 3.52 d28 ± 2.08 fghij25 ± 0.57 abc301.89 ± 10.18 d32.41 ± 0.21 g11.02 ± 0.01 j1852.1 ± 17.21 abc
PI54853355 ± 0.57 ab110 ± 0.57 abcde113 ± 1.73 ab40.23 ± 5.49 bcd20 ± 2.08 a180.86 ± 2.77 abc26.45 ± 0.40 ab14.62 ± 0.06 cde1789.98 ± 15.28 bcd
PI54865755 ± 0.57 ab113 ± 0.57 abcd56 ± 1.73 bcd20.93 ± 1.64 jk11 ± 1.73 abcd109.05 ± 3.37 bcd14.85 ± 0.45 bcdef13.61 ± 0.05 def1778.98 ± 12.02 bcd
PI51867142 ± 0.57 abc100 ± 0.57 qbcde73.66 ± 2.40 d24.33 ± 2.08 hijk13.66 ± 0.88 d154.18 ± 5.59 d25.36 ± 0.36 fg13.54 ± 001 efg1745.4 ± 7.51 bcde
PI52223649 ± 0.57 bc117 ± 0.57 abcd102 ± 1.15 ab28.91 ± 1.73 fghi29 ± 1.53 a233.94 ± 2.64 a30.91 ± 0.34 a13.21 ± 0.06 fgh1693.45 ± 16.92 cd
PI62883767 ± 0.57 a141 ± 0.57 a127.67 ± 1.73 d23.67 ± 0.57 ijk16.33 ± 1.53 abc196.30 ± 2.89 d26.70 ± 0.41 efg14.45 ± 0.05 cdef1560.89 ± 15.28 d
PI54848260 ± 0.57 a117 ± 0.57 abcd101 ± 1.73 ab32.13 ± 2.14 efg14 ± 1.73 abcd200.42 ± 3.43 ab23.69 ± 0.4 abc11.82 ± 0.01 ij1535.65 ± 12.5 d
PI54840056 ± 0.57 ab130 ± 0.57 ab57 ± 2.03 cd25.66 ± 0.57 ghijk23.33 ± 0.58 abcd168.97 ± 1.71 cd21.04 ± 0.57 cdefg13.64 ± 0.33 def1493.98 ± 10.15 ef
Faisal56 ± 0.57 ab140 ± 0.57 a152 ± 2.3 a91 ± 0.58 a32.33 ± 2.84 a208.91 ± 3.17 ab17.98 ± 0.17 abcde8.78 ± 0.06 k496 ± 18.04 e
NARC249 ± 1.15 abc130 ± 1.15 ab28 ± 2.3 d19.23 ± 1.53 k7 ± 1.15 cd76.05 ± 6.27 cd9.33 ± 0.76 defg12.27 ± 1.25 hij231.21 ± 13.11 f
Ajmeri54 ± 0.57 ab140 ± 0.57 a25.33 ± 1.76 d23.78 ± 1.15 ijk17 ± 1.15 ab40.16 ± 1.78 d7.78 ± 1.16 efg7.58 ± 0.67 a51.98 ± 9.24 g
Values before ± are the means of the sample and values after ± are the standard error of the mean. Means with the same letter are not significantly different. Analysis was performed using the Statistical Tool for Agricultural Research (STAR).
Disclaimer/Publisher’s Note: The statements, opinions and data contained in all publications are solely those of the individual author(s) and contributor(s) and not of MDPI and/or the editor(s). MDPI and/or the editor(s) disclaim responsibility for any injury to people or property resulting from any ideas, methods, instructions or products referred to in the content.

