
Management and Reduction Techniques Strategies of Ammonia Emission in Agricultural Sectors in China


Abstract
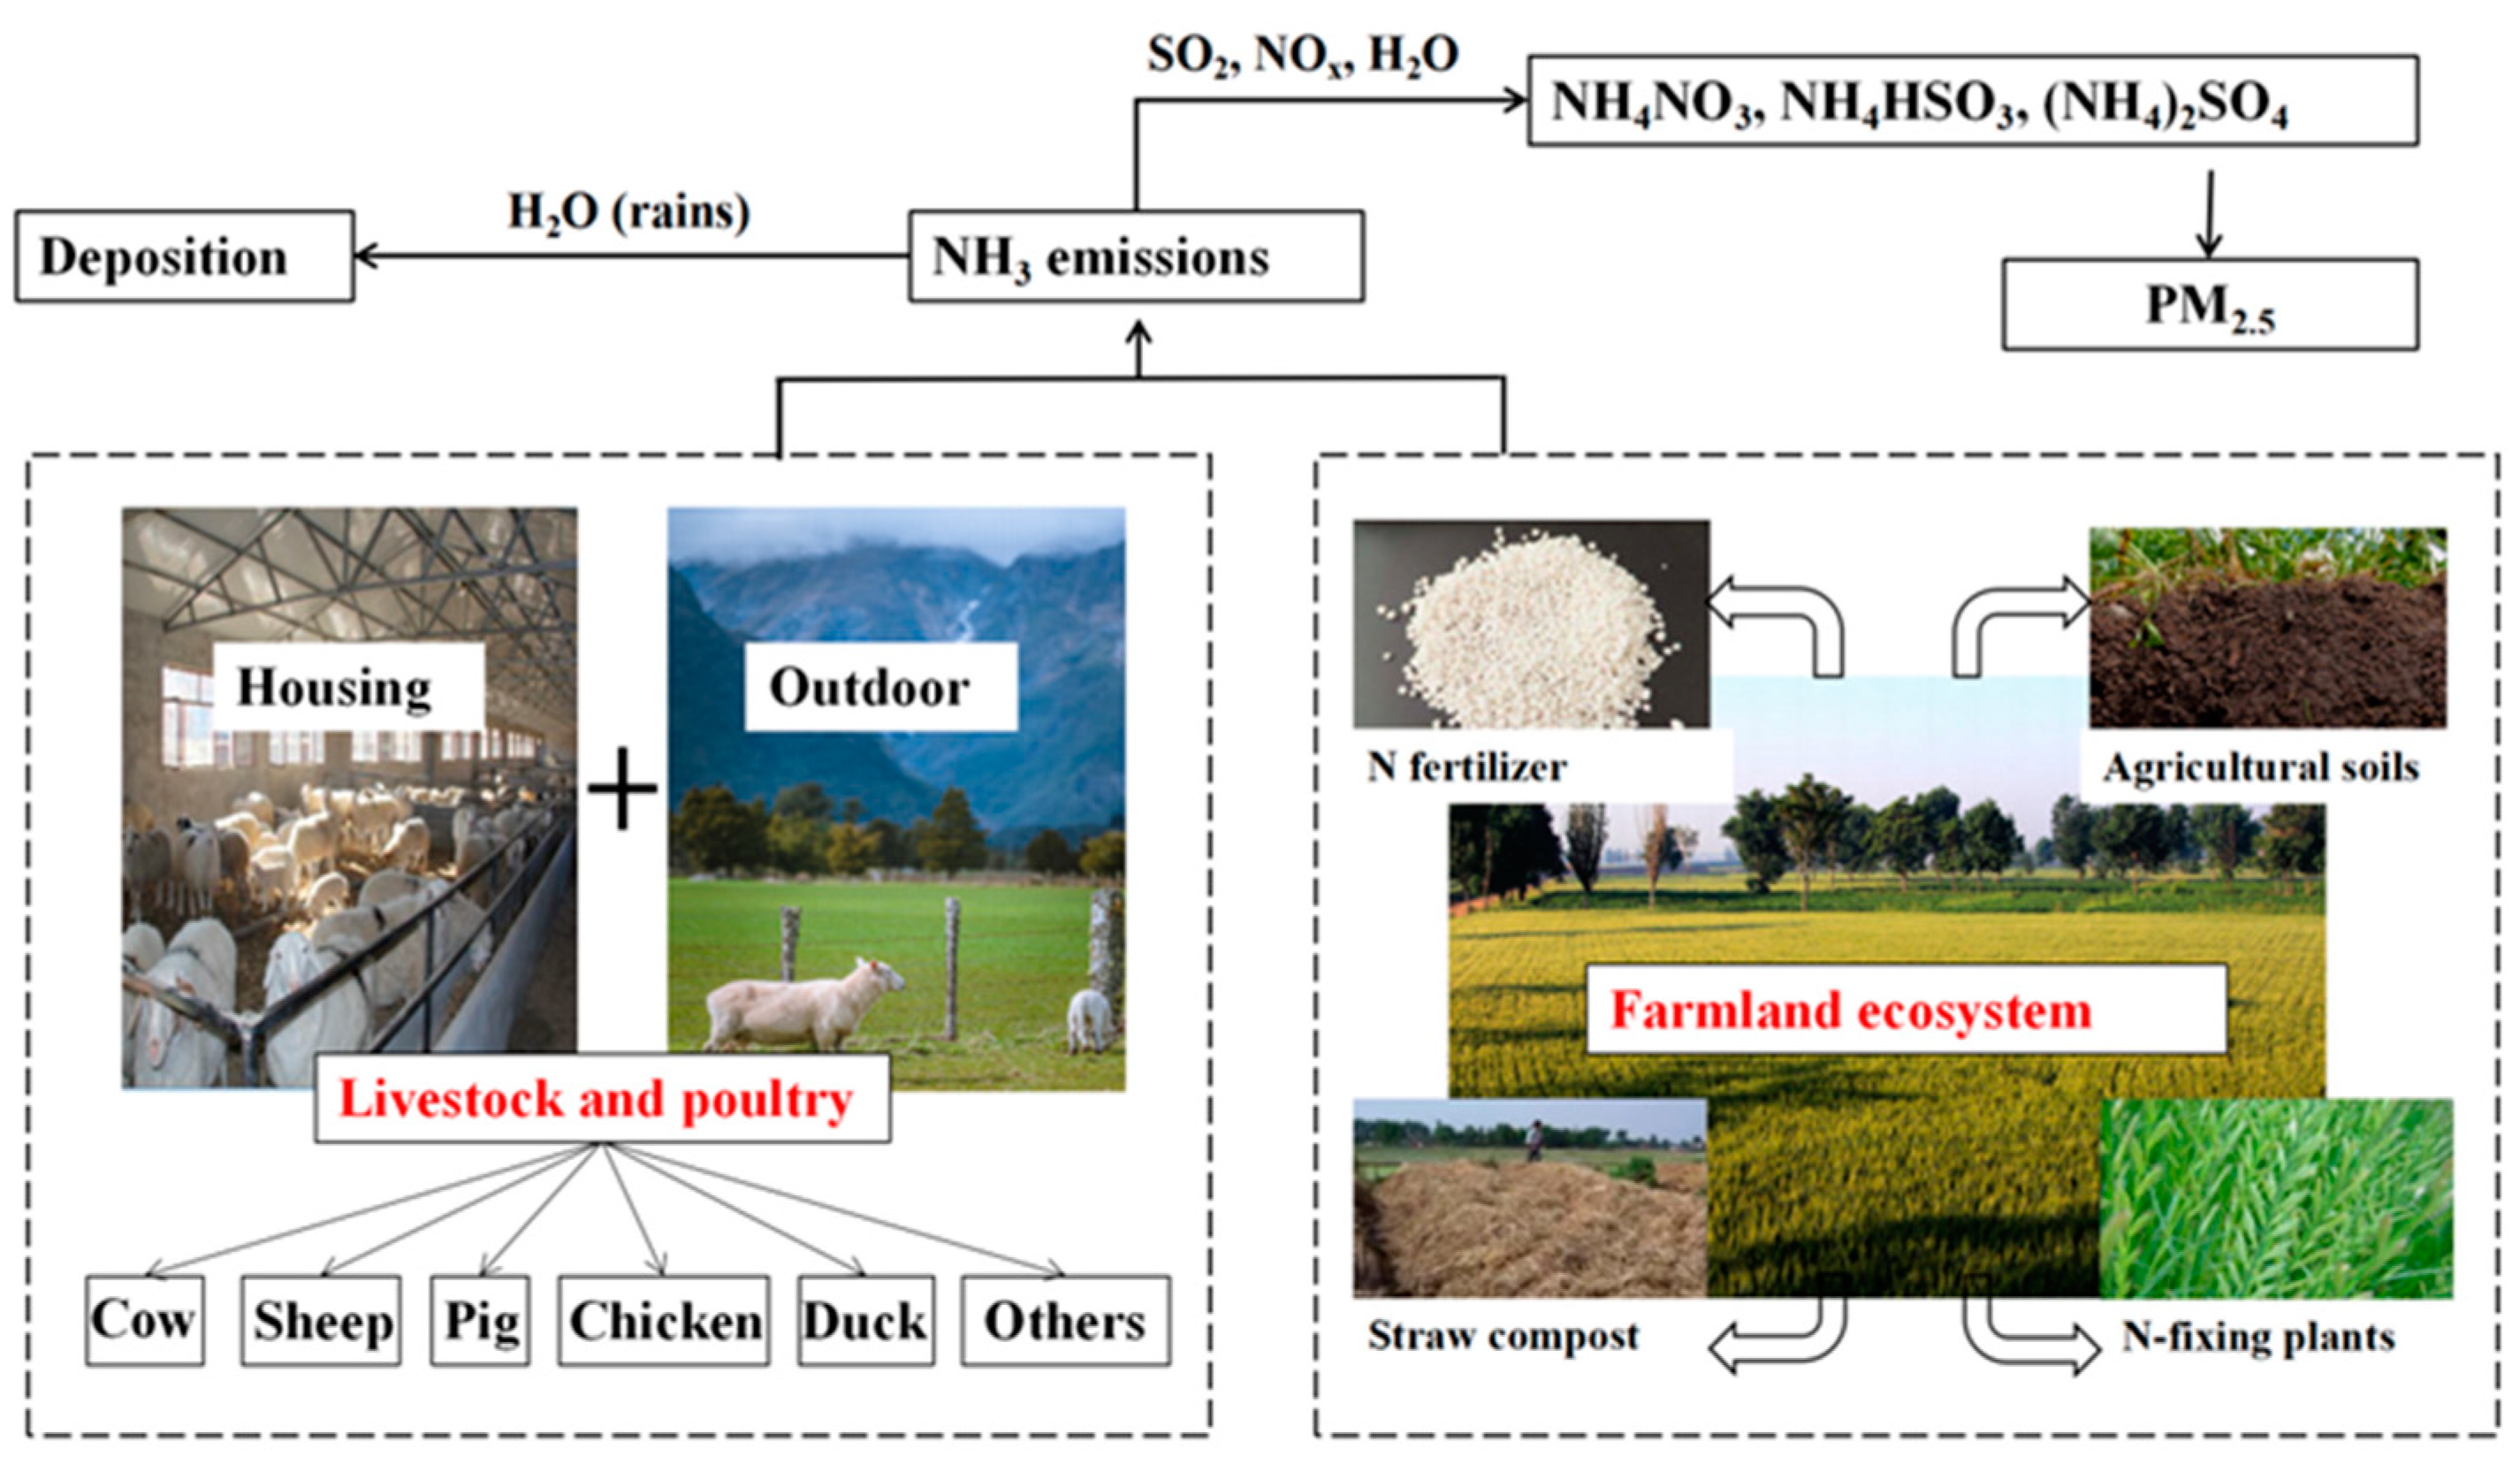
:1. Introduction
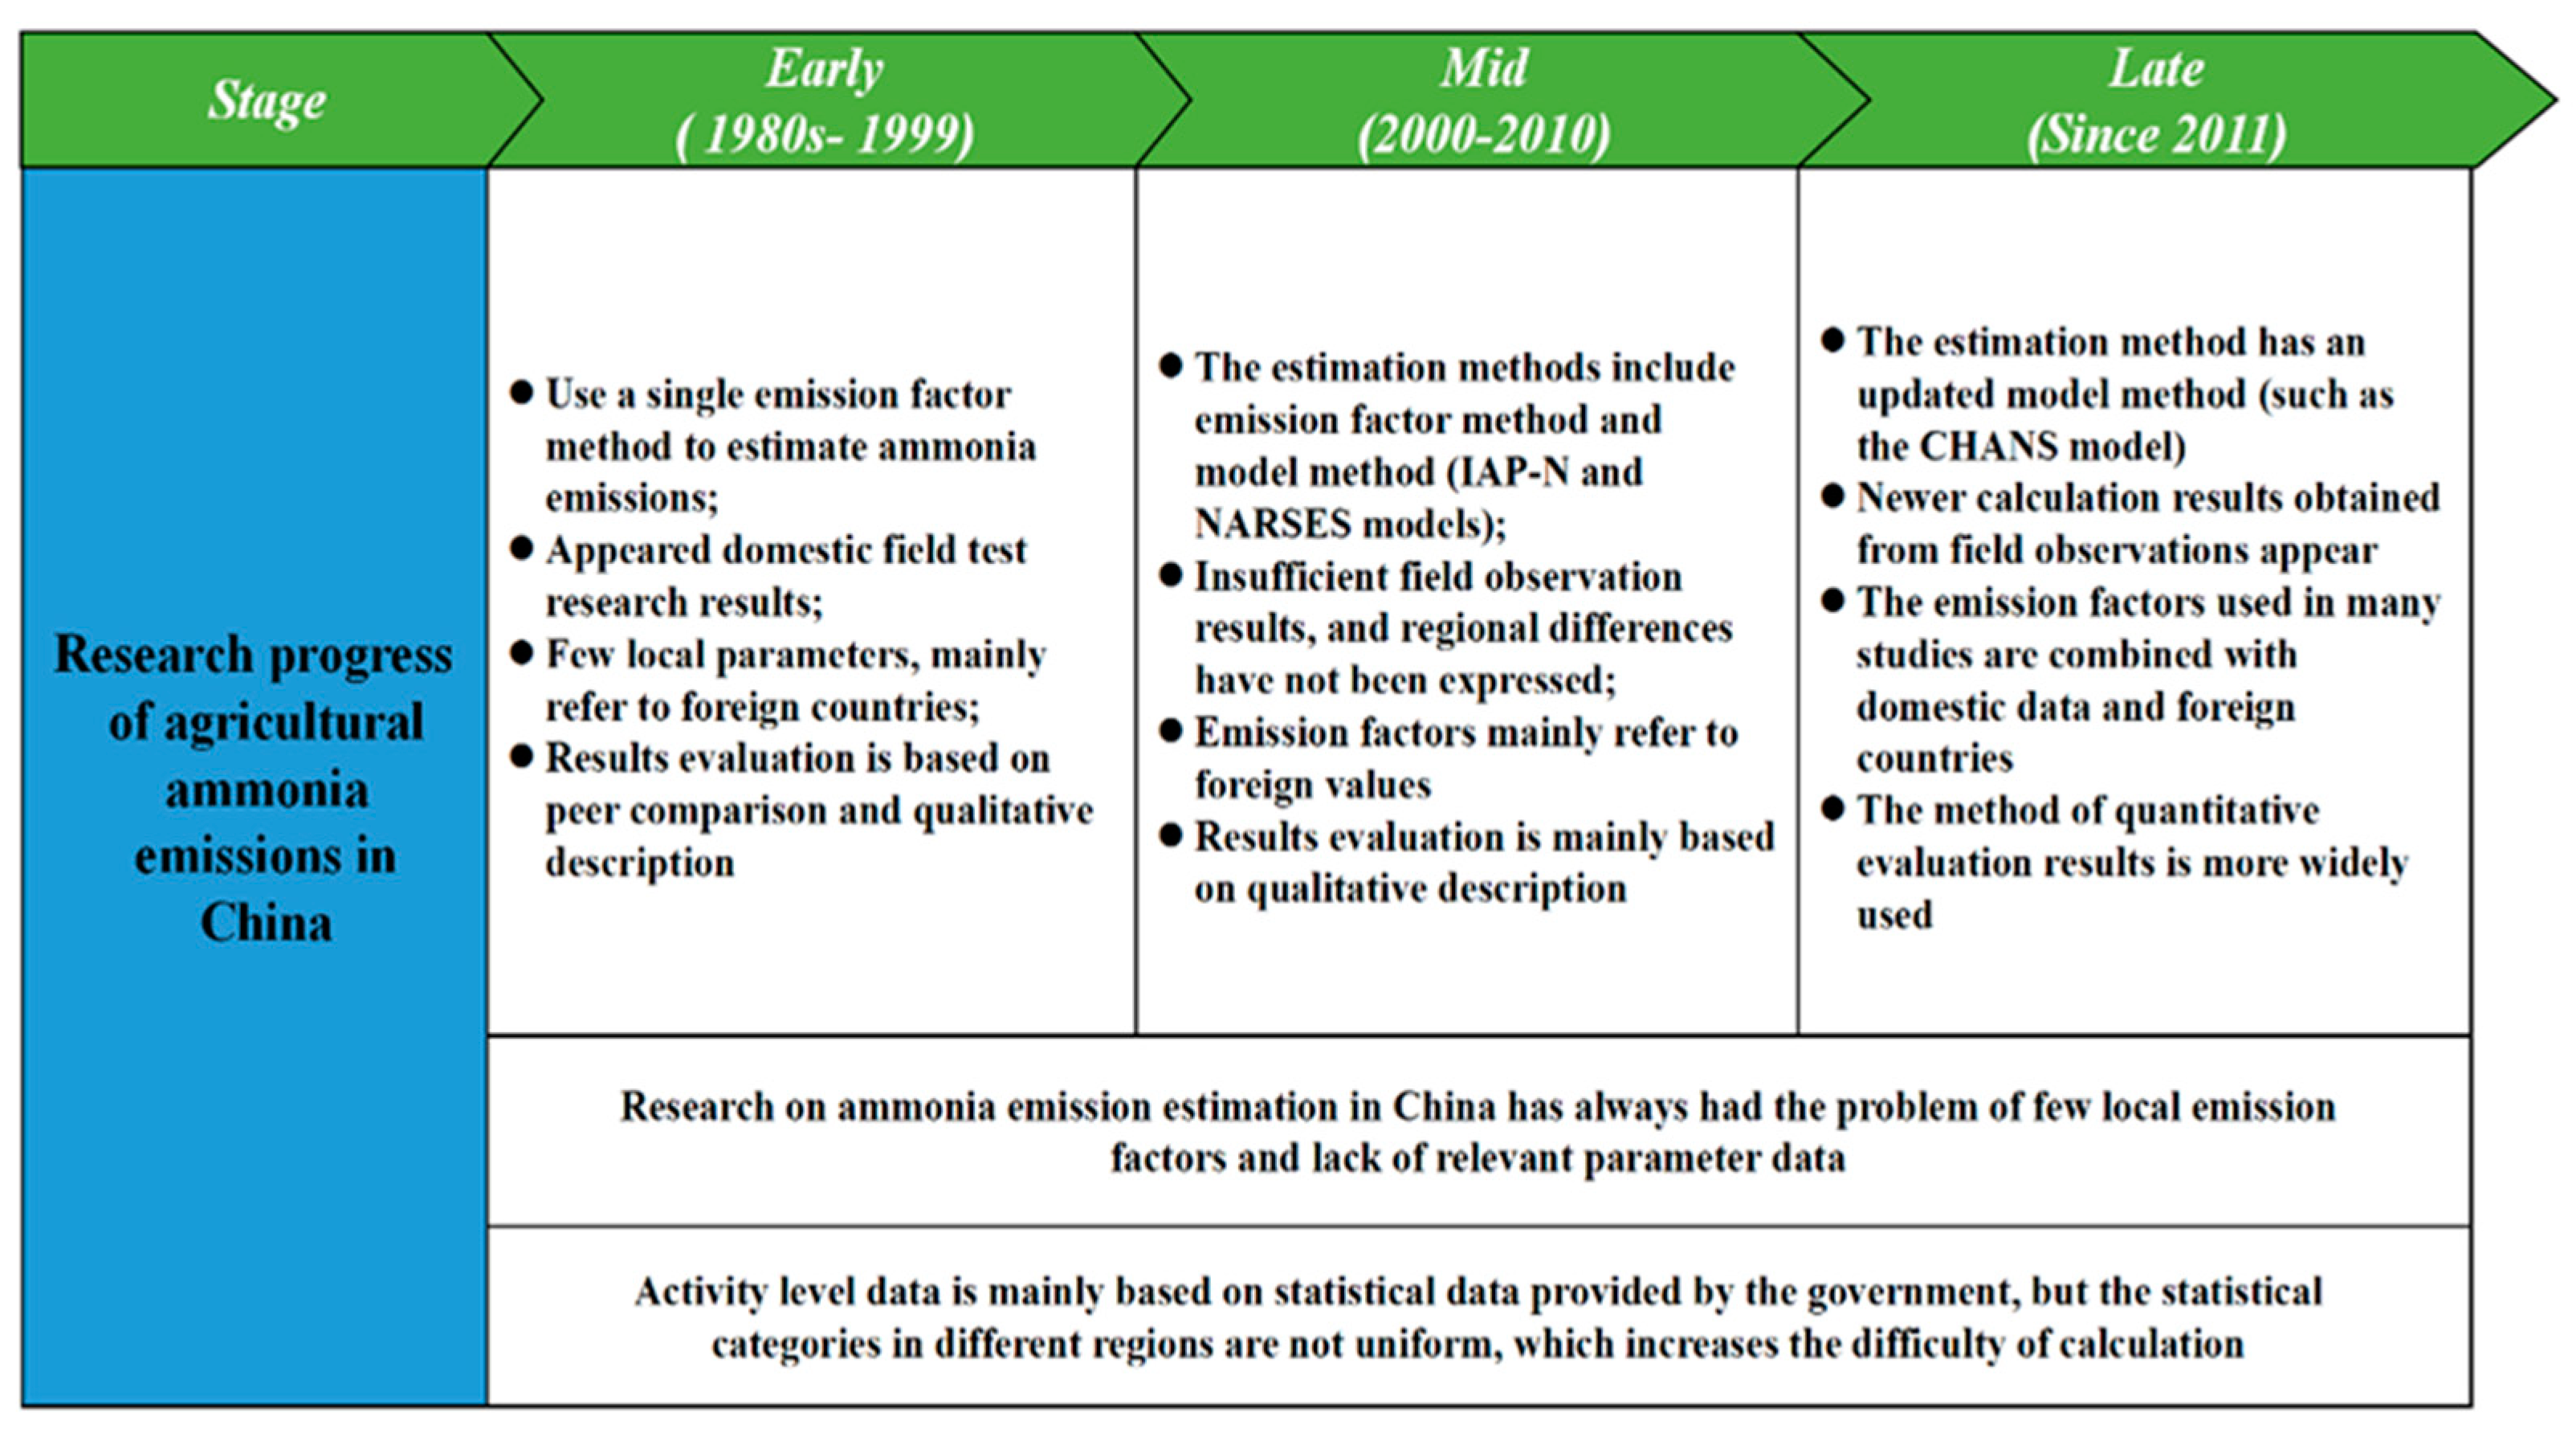
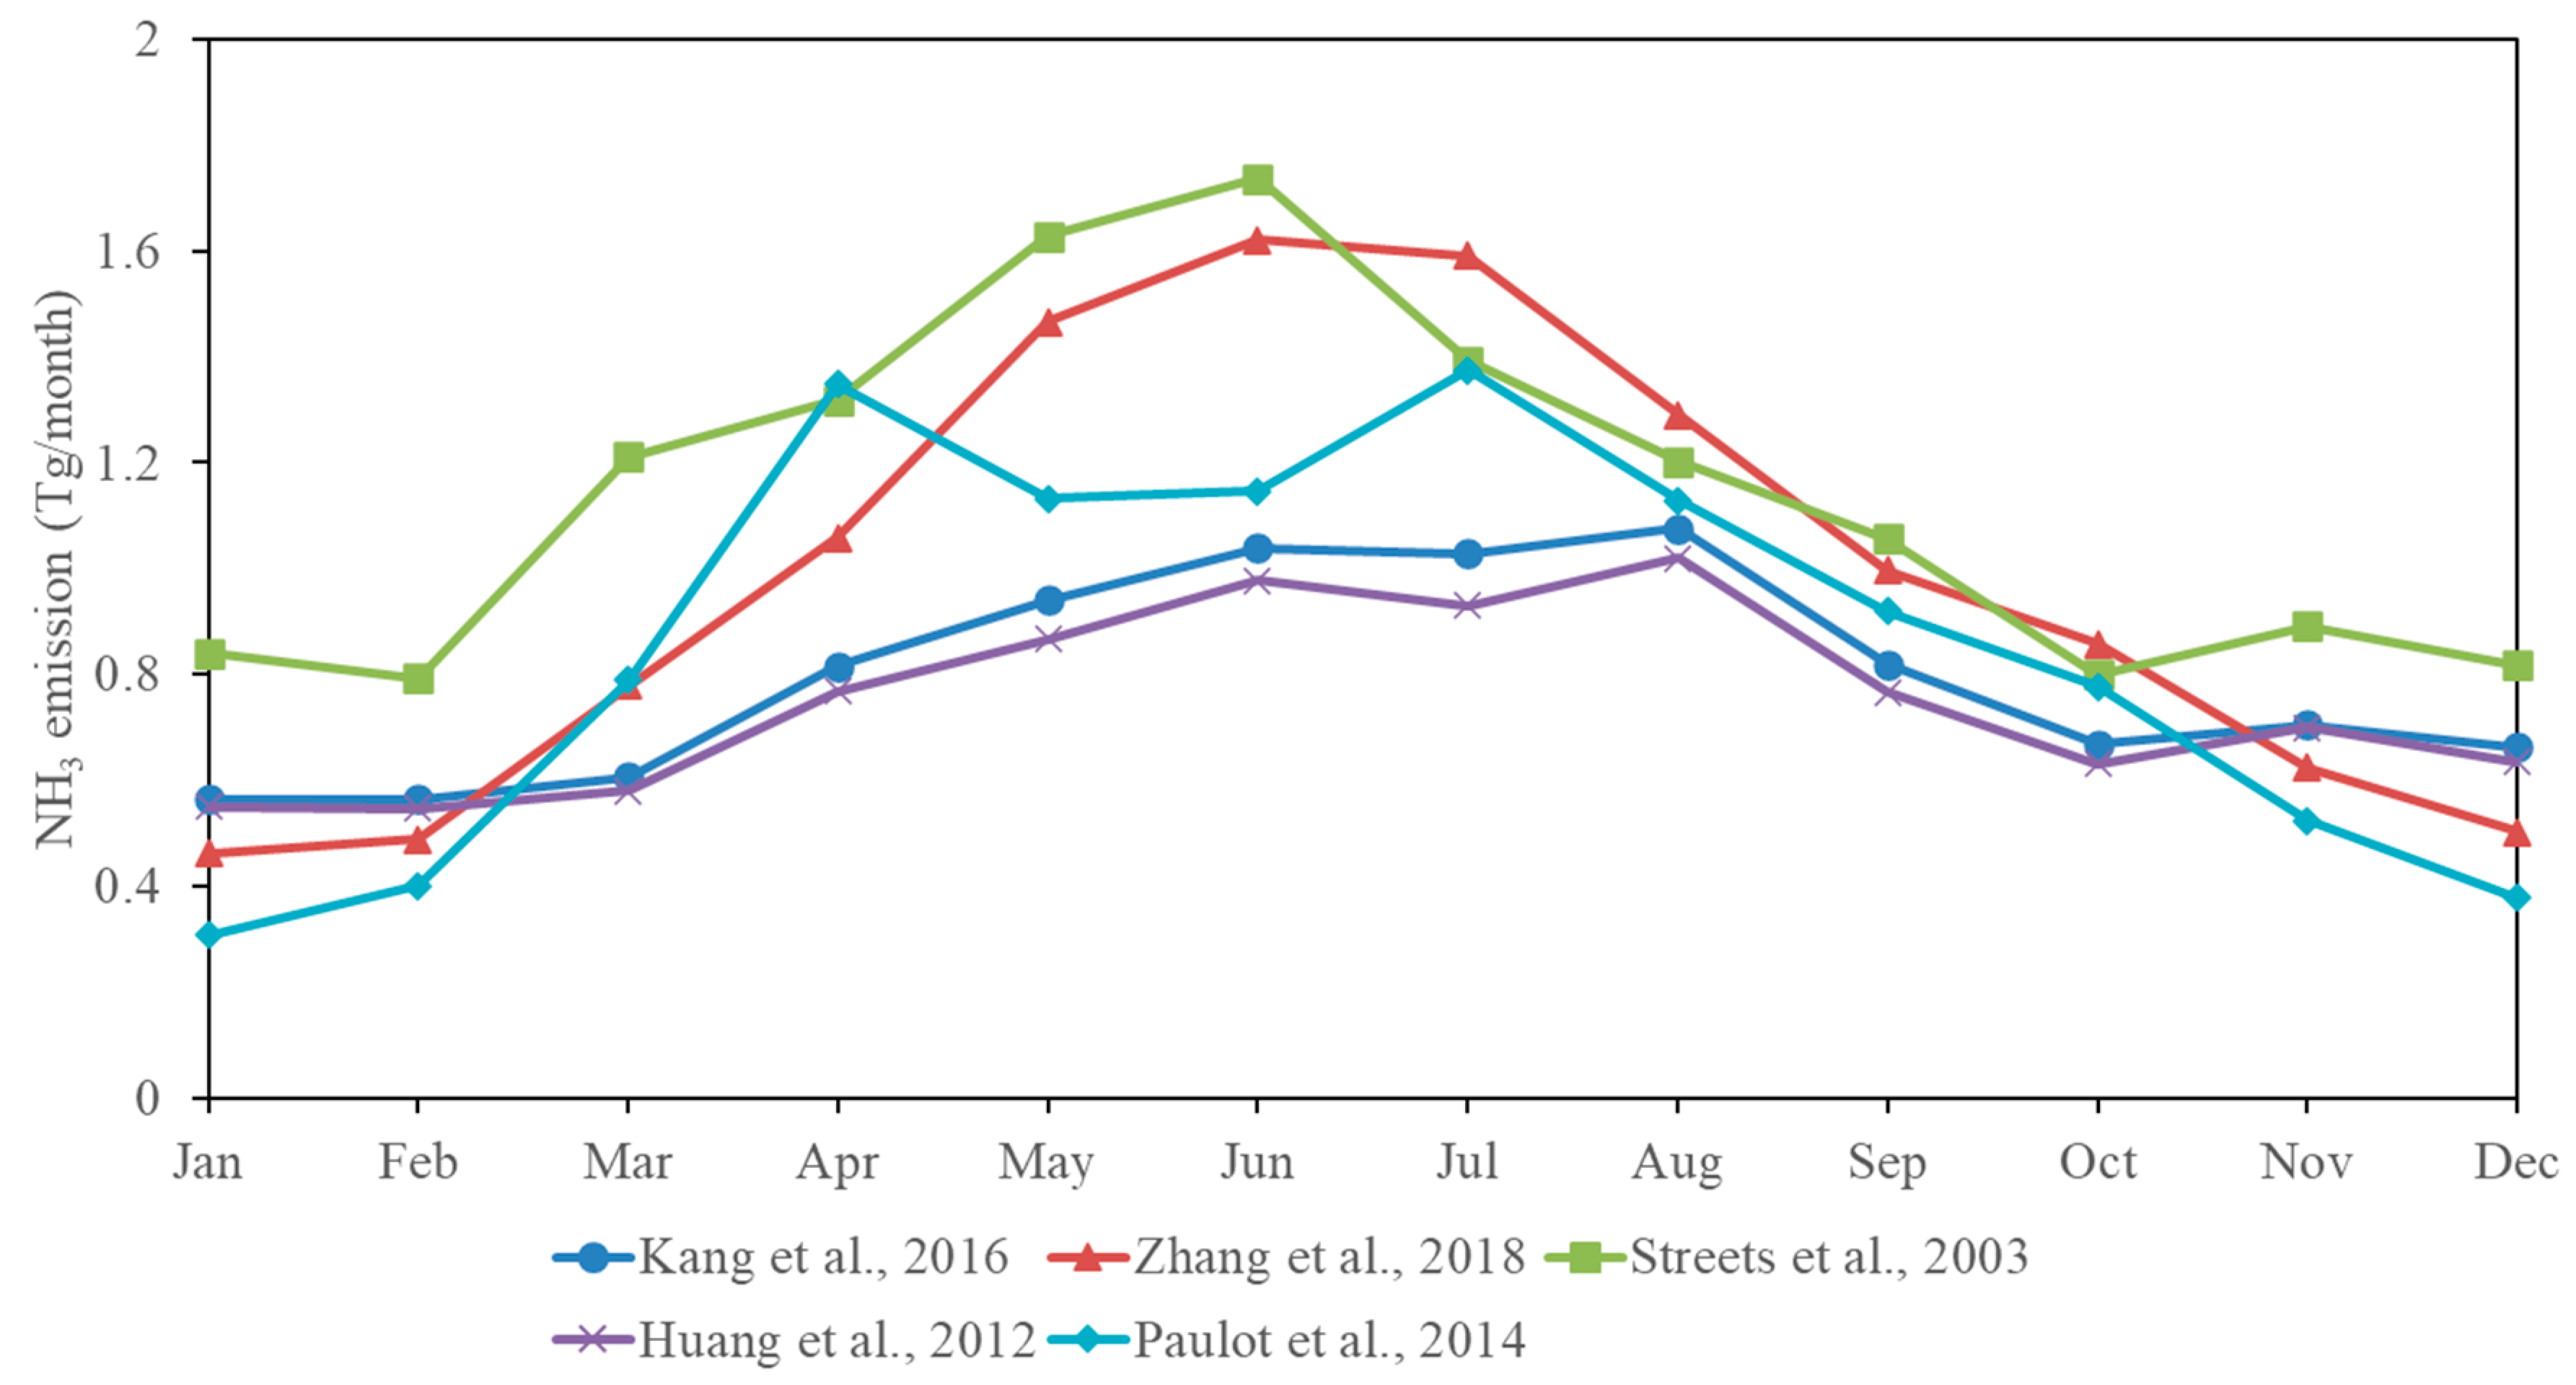
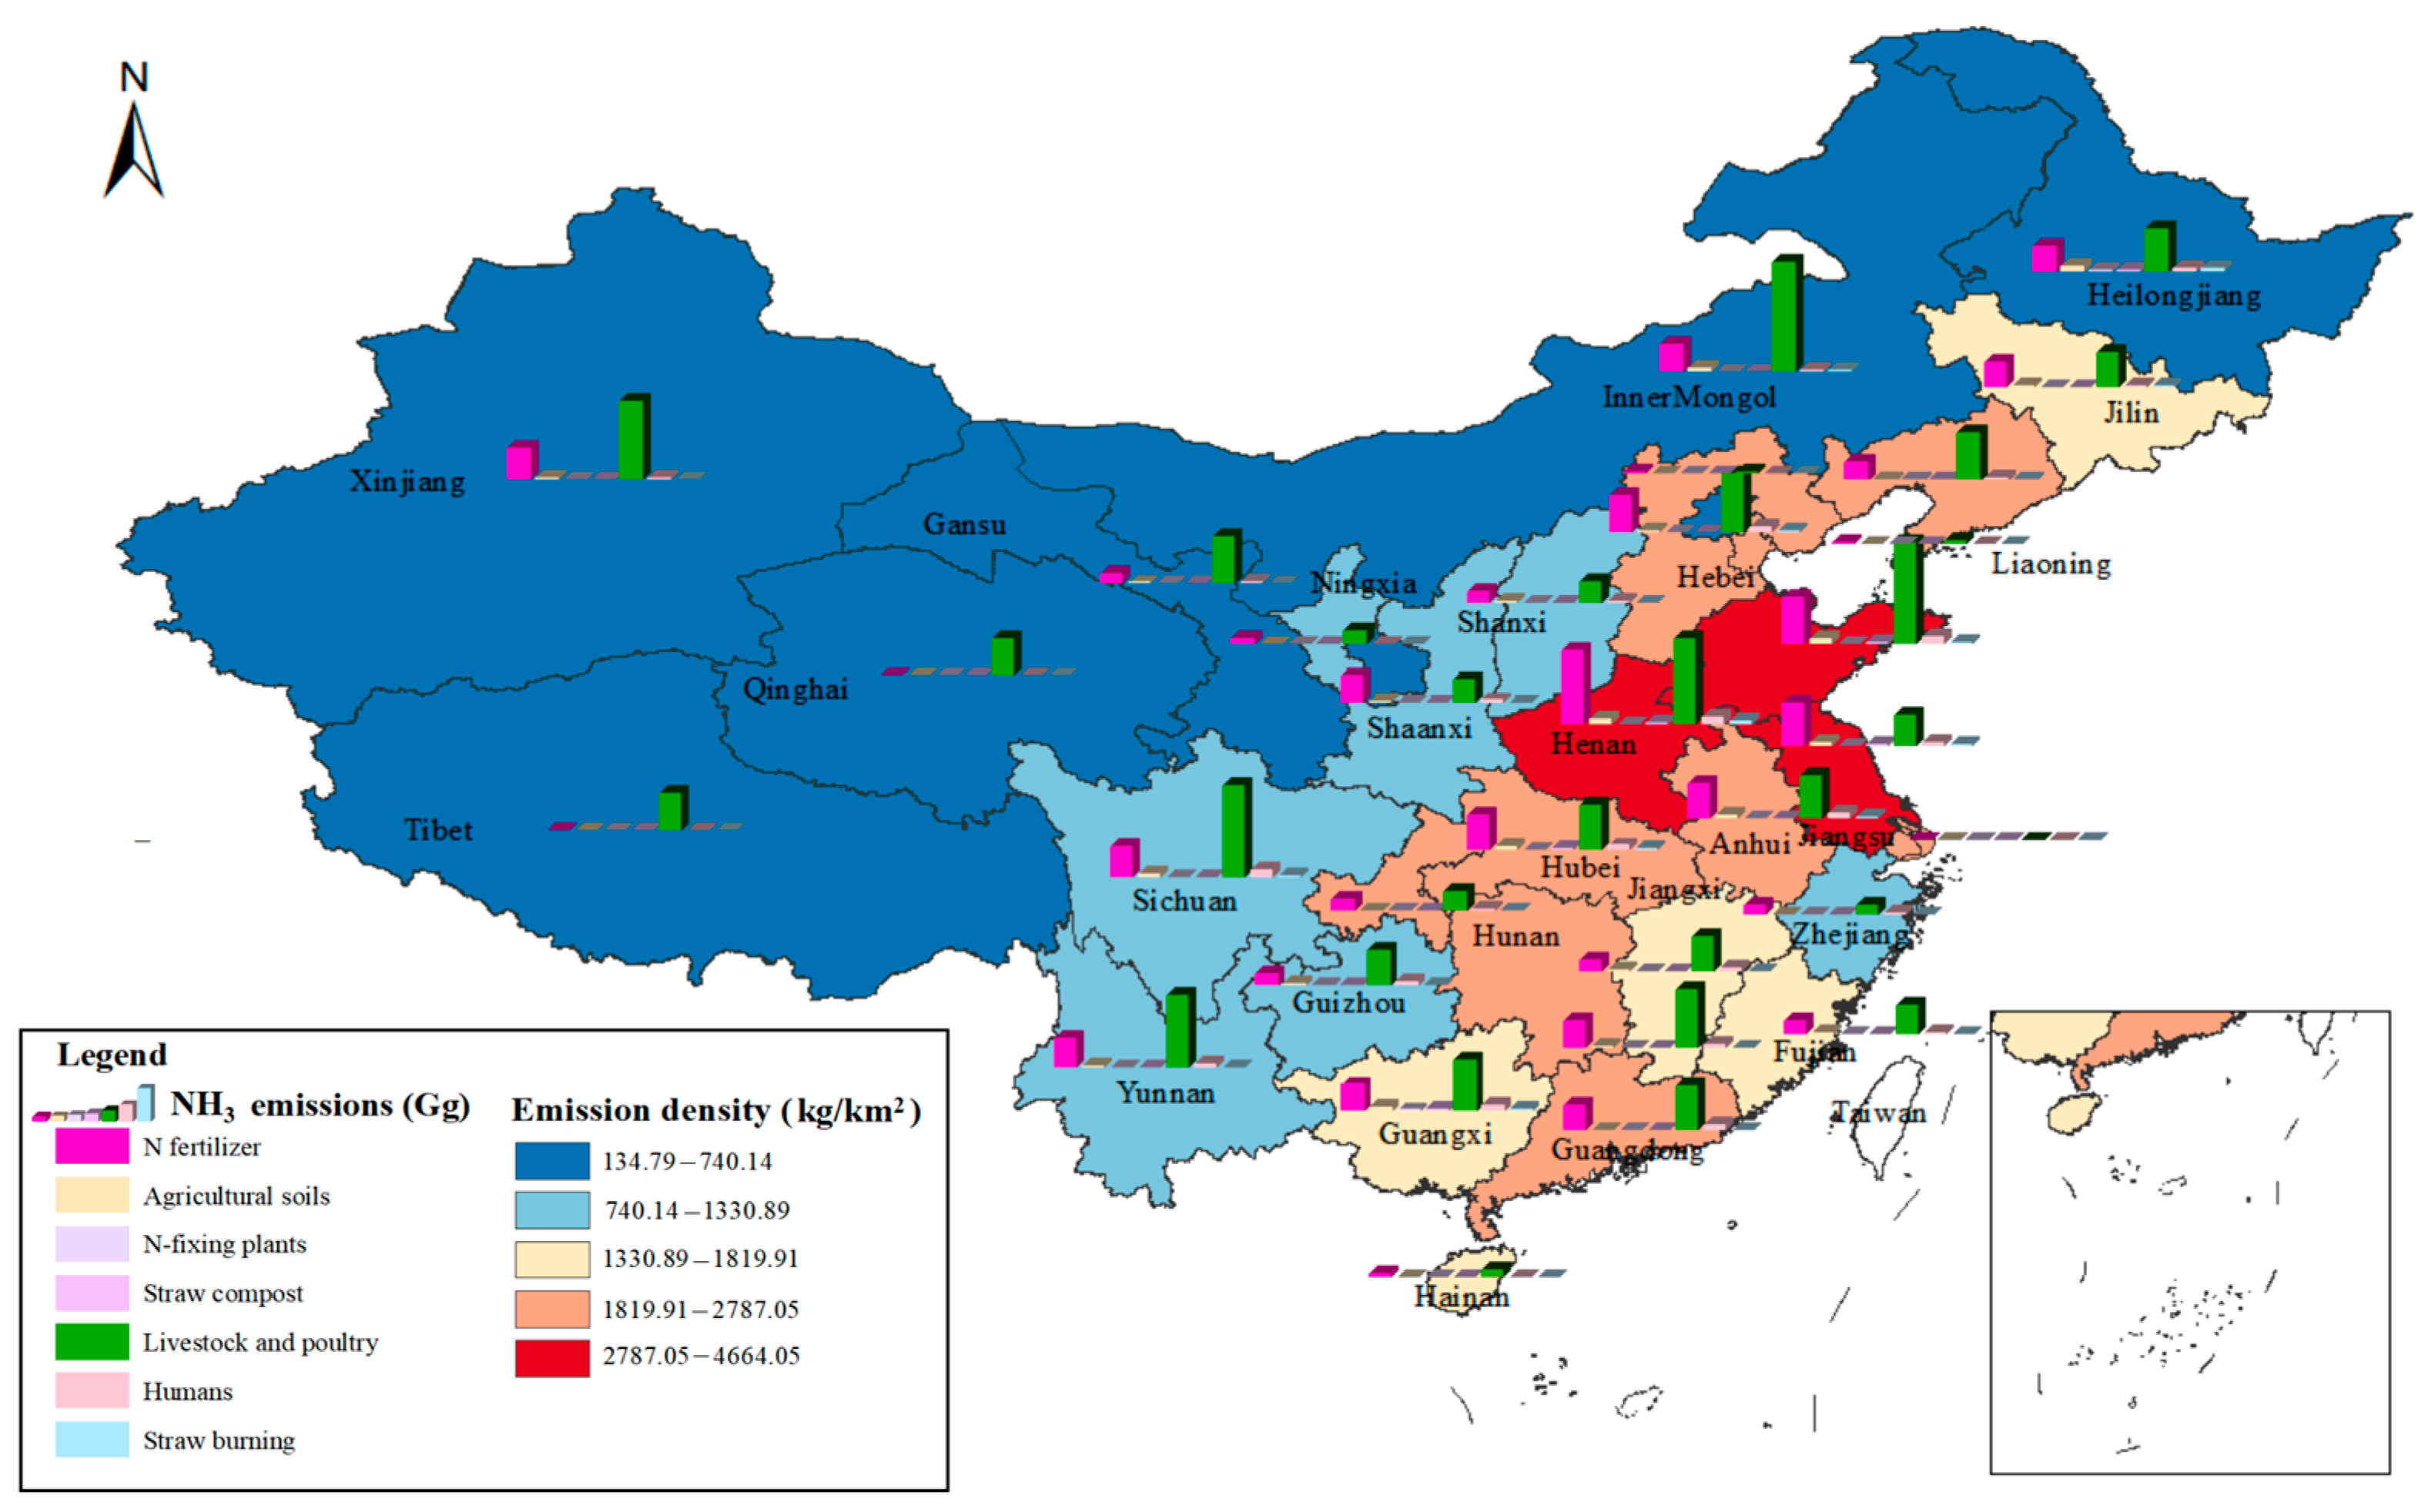
2. Progress of the NH3 Emission Inventory
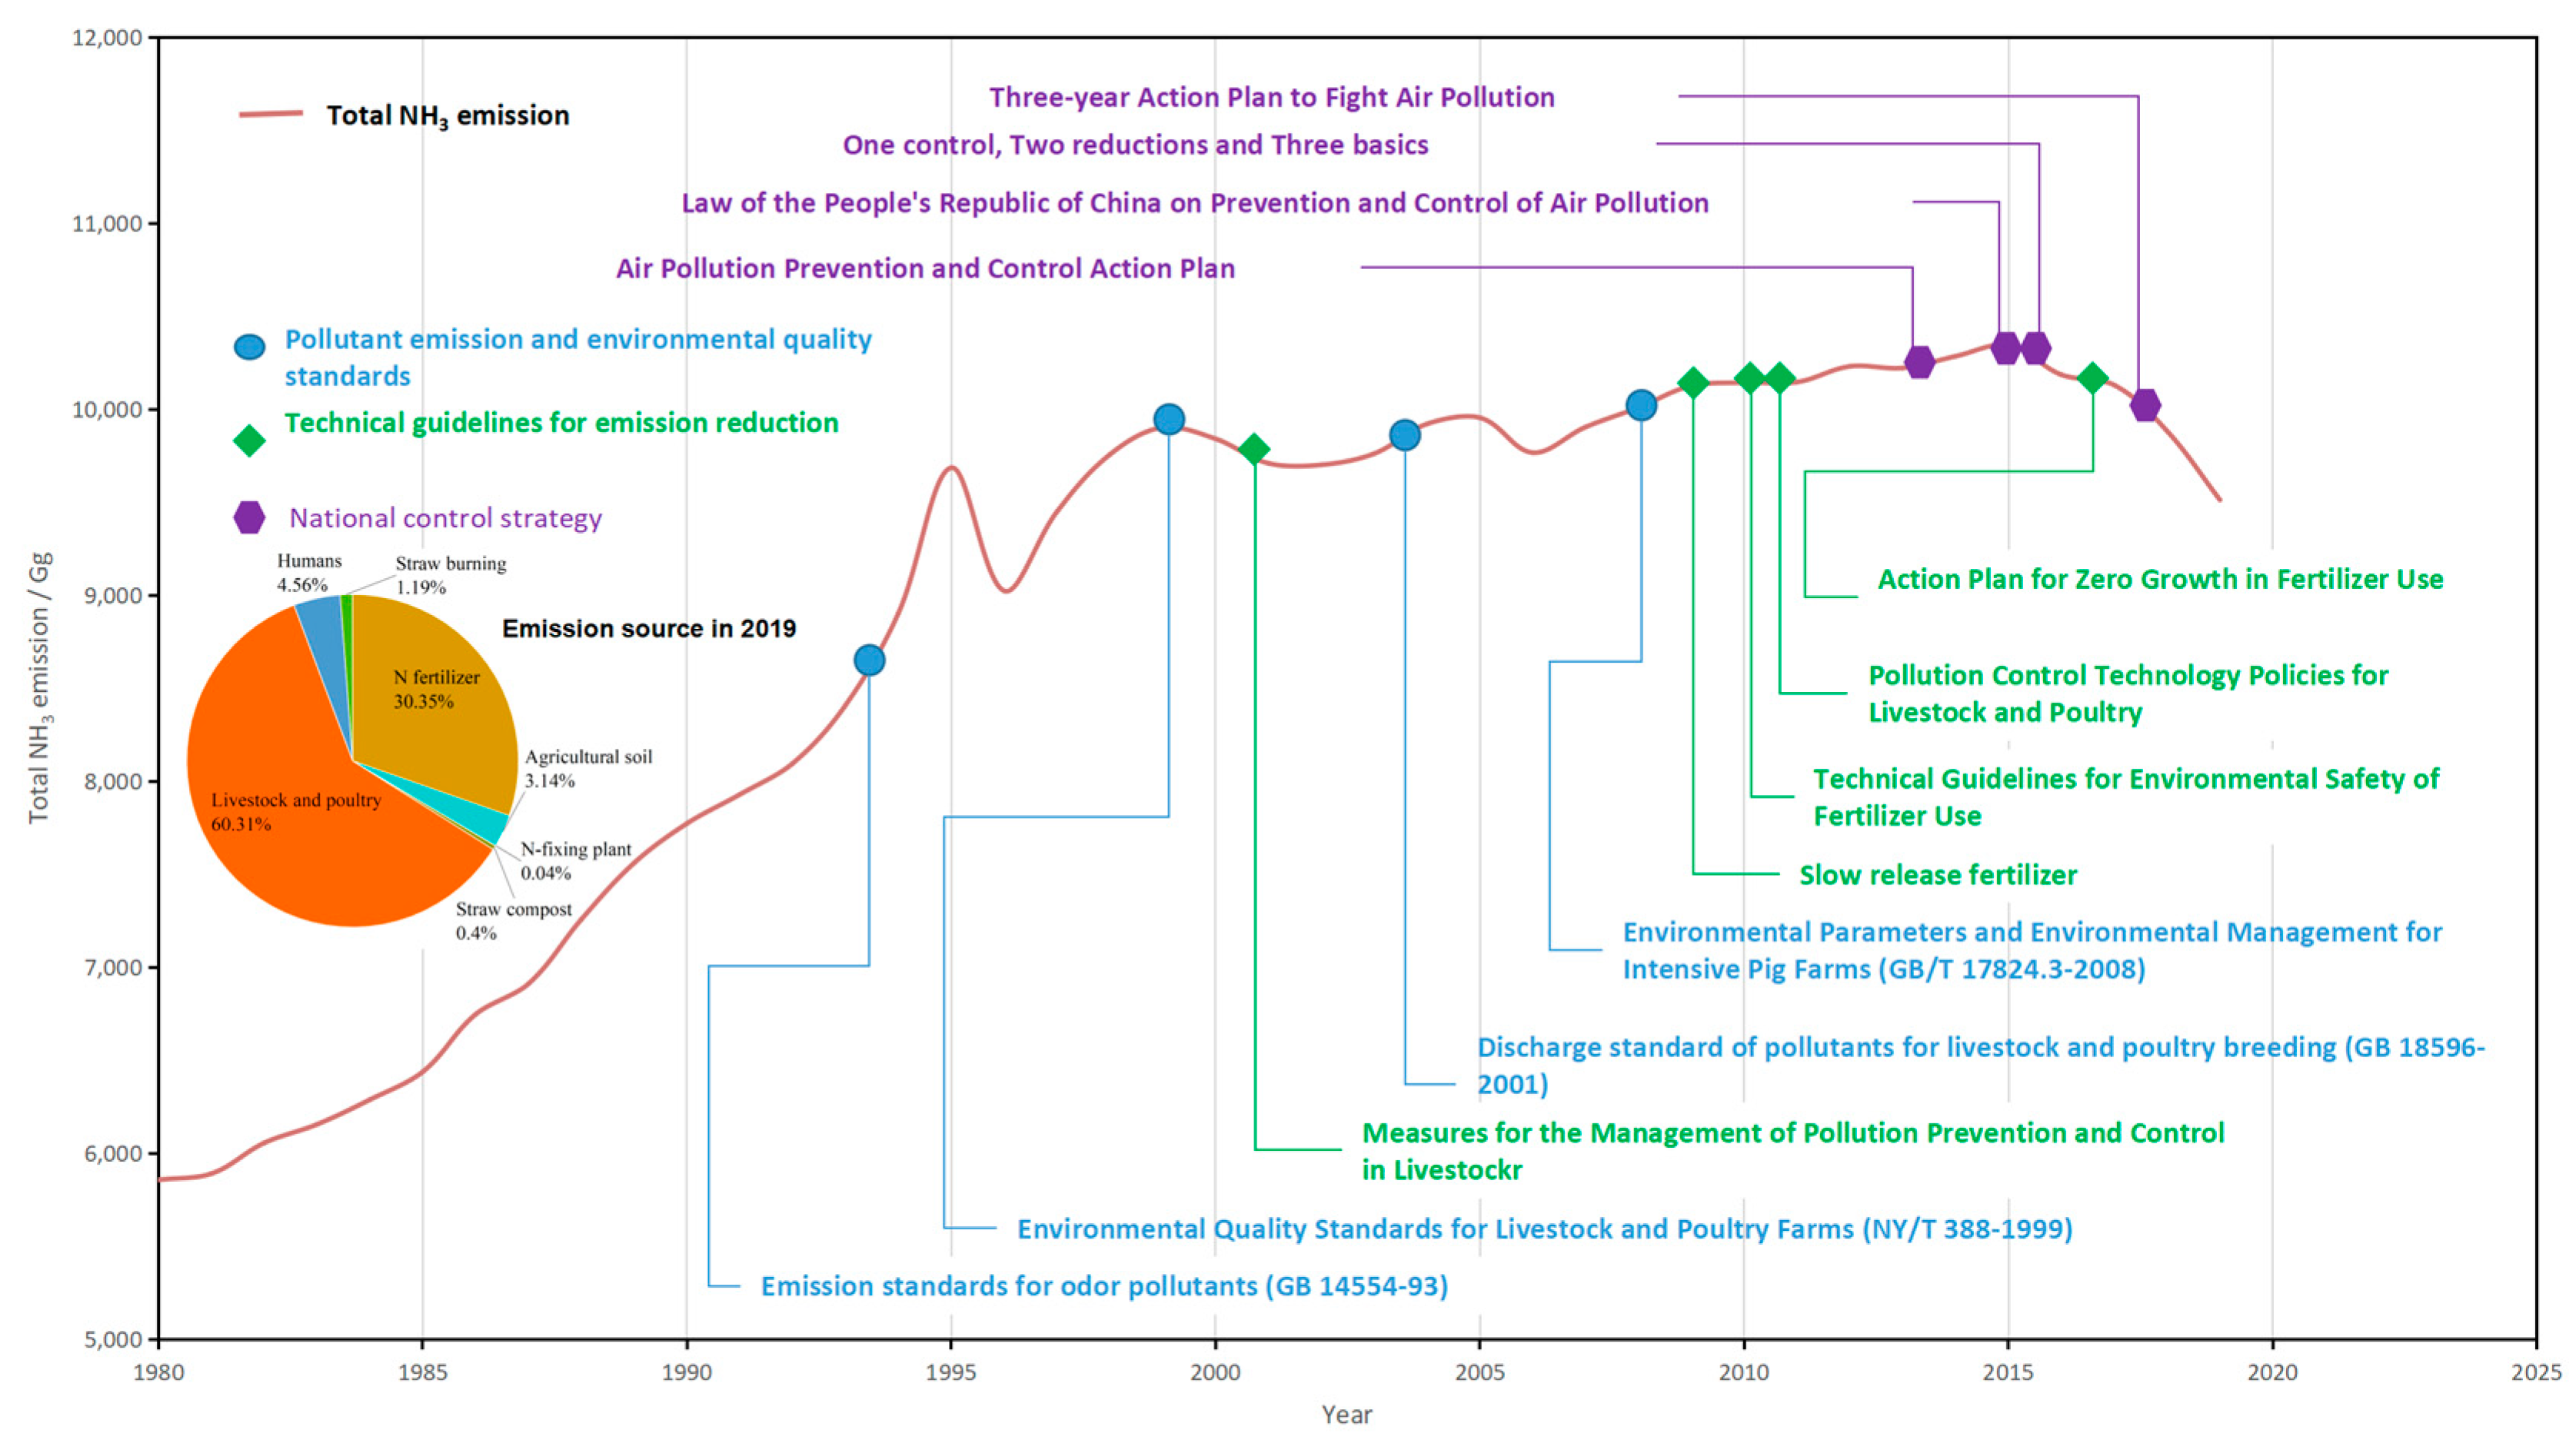
3. China’s Agricultural NH3 Emission Management Strategy
3.1. Goals and Policies
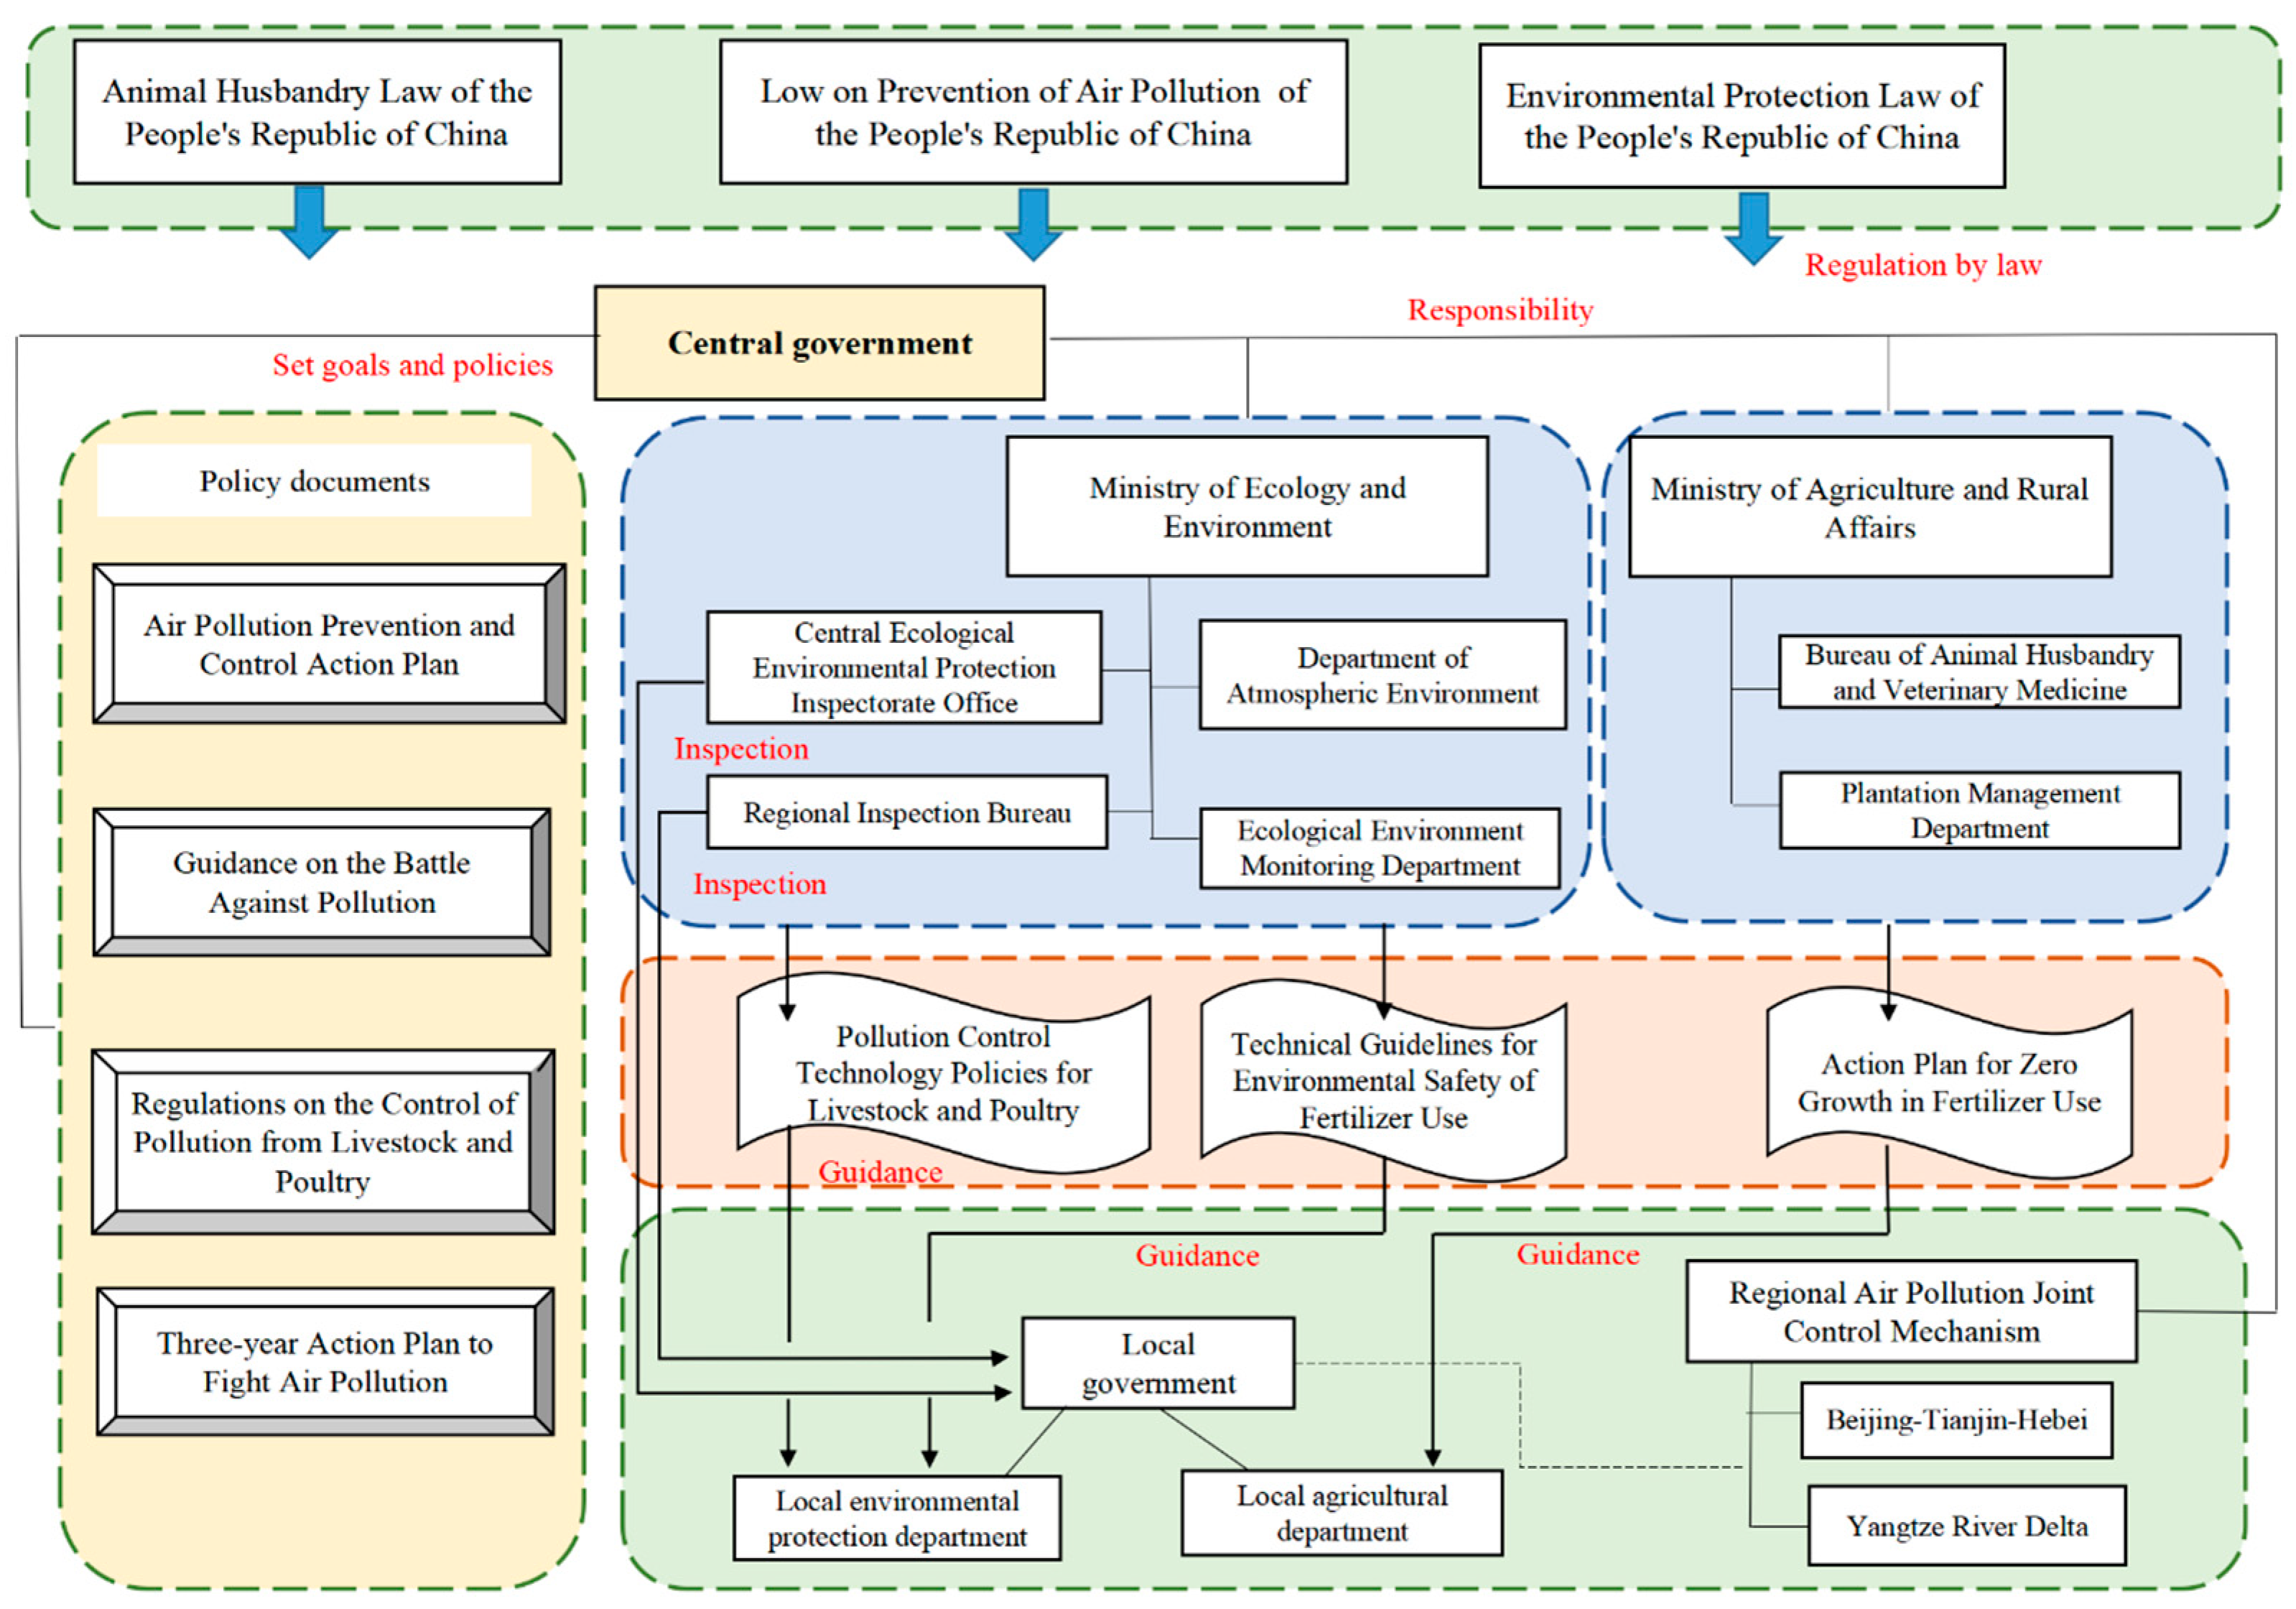
3.2. Administration and Supervision
4. NH3 Emission Reduction Techniques Strategy
4.1. Livestock and Poultry
4.2. Farmland Ecosystem
4.3. Country/Regional Comparisons
5. Conclusions and Expectations
Author Contributions
Funding
Data Availability Statement
Conflicts of Interest
References
- Gu, B.; Sutton, M.A.; Chang, S.X.; Ge, Y.; Chang, J. Agricultural ammonia emissions contribute to China’s urban air pollution. Front. Ecol. Environ. 2014, 12, 265–266. [Google Scholar] [CrossRef]
- Wang, C.; Yin, S.; Bai, L.; Zhang, X.; Gu, X.; Zhang, H.; Lu, Q.; Zhang, R. High-resolution ammonia emission inventories with comprehensive analysis and evaluation in Henan, China, 2006–2016. Atmos. Environ. 2018, 193, 11–23. [Google Scholar] [CrossRef]
- Ye, Z.; Guo, X.; Cheng, L.; Cheng, S.; Chen, D.; Wang, W.; Liu, B. Reducing PM2.5 and secondary inorganic aerosols by agricultural ammonia emission mitigation within the Beijing-Tianjin-Hebei region, China. Atmos. Environ. 2019, 219, 116989. [Google Scholar] [CrossRef]
- Ma, S. High-resolution assessment of ammonia emissions in China: Inventories, driving forces and mitigation. Atmos. Environ. 2020, 229, 117458. [Google Scholar] [CrossRef]
- Yu, X.; Shen, L.; Hou, X.; Yuan, L.; Pan, Y.; An, J.; Yan, S. High-resolution anthropogenic ammonia emission inventory for the Yangtze River Delta, China. Chemosphere 2020, 251, 126342. [Google Scholar] [CrossRef]
- Zhang, X.; Wu, Y.; Liu, X.; Reis, S.; Jin, J.; Dragosits, U.; Van Damme, M.; Clarisse, L.; Whitburn, S.; Coheur, P.F.; et al. Ammonia Emissions May Be Substantially Underestimated in China. Environ. Sci Technol 2017, 51, 12089–12096. [Google Scholar] [CrossRef] [PubMed]
- Bittman, S.; Dedina, M.; Howard, C.; Oenema, O.; Sutton, M. Options for ammonia mitigation: Guidance from the UNECE Task Force on Reactive Nitrogen; NERC/Centre for Ecology & Hydrology: Wallingford, UK, 2014. [Google Scholar]
- Sun, K.; Mao, X.; Lu, Q.; Jia, A.; Liao, Z. Mitigation effect of several controlled-release N fertilizers on ammonia volatilization and related affecting factors. Ying Yong Sheng Tai Xue Bao = J. Appl. Ecol. 2004, 15, 2347–2350. [Google Scholar]
- Wang, W.; Liu, B.; Han, R.; Wang, Y.; Liu, X.; Xu, Q.; Li, W.; Tang, X. Review of Researches on Factors Affecting Emission of Ammonia From Agriculture. J. Ecol. Rural Environ. 2016, 32, 870–878. [Google Scholar]
- Hristov, A.N.; Hanigan, M.; Cole, A.; Todd, R.; McAllister, T.A.; Ndegwa, P.M.; Rotz, A. Review: Ammonia emissions from dairy farms and beef feedlots. Can. J. Anim. Sci. 2011, 91, 1–35. [Google Scholar] [CrossRef]
- Webb, J.; Pain, B.; Bittman, S.; Morgan, J. The impacts of manure application methods on emissions of ammonia, nitrous oxide and on crop response-A review. Agric. Ecosyst. Environ. 2010, 137, 39–46. [Google Scholar] [CrossRef]
- Li, J.; Zeng, W.; Zhou, Y.; Chen, X. A synthetic review of the methods used to estimate agricultural ammonia emissions in China. Acta Ecol. Sin. 2018, 38, 8256–8265. [Google Scholar]
- Wang, W.; Lu, X.; Pang, Y.; Tang, D.; Zhang, W. Geographical distribution of NH3 emission intensities in China. Acta Sci. Circumstantiae 1997, 17, 2–7. [Google Scholar]
- Air Pollution Prevention and Control Law of the People’s Republic of China; China Legal Publishing House: Beijing, China, 2018.
- SCC, State Council of the People’s Republic of China. Three-Year Action Plan to Fight Air Pollution; Standards Press of China: Beijing, China, 2018. [Google Scholar]
- MEP, Ministry of Environmental Protection the People’s Republic of China. Technical Guideline on Environmental Safety Application of Chemical Fertilizer; Standards Press of China: Beijing, China, 2010. [Google Scholar]
- Hellsten, S.; Dragosits, U.; Place, C.J.; Misselbrook, T.H.; Tang, Y.S.; Sutton, M.A. Modelling Seasonal Dynamics from Temporal Variation in Agricultural Practices in the UK Ammonia Emission Inventory. Water Air Soil Pollut. Focus 2007, 7, 3–13. [Google Scholar] [CrossRef]
- Pinder, R.W.; Adams, P.J.; Pandis, S.N.; Gilliland, A.B. Temporally resolved ammonia emission inventories: Current estimates, evaluation tools, and measurement needs. J. Geophys. Res.-Atmos. 2006, 111, 14. [Google Scholar] [CrossRef]
- Xu, X. Estimation of Anthropogenic Ammonia Emissions in Jiangsu-Zhejiang-Shanghai District. Rural Eco-Environ. 1997, 13, 50–52. [Google Scholar]
- Fu, H.; Luo, Z.; Hu, S. A temporal-spatial analysis and future trends of ammonia emissions in China. Sci Total Environ. 2020, 731, 138897. [Google Scholar] [CrossRef] [PubMed]
- Zheng, X.; Liu, C.; Han, S. Description and application of a model for simulating regional nitrogen cycling and calculating nitrogen flux. Adv. Atmos. Sci. 2008, 25, 181–201. [Google Scholar] [CrossRef]
- Huang, X.; Song, Y.; Li, M.; Li, J.; Huo, Q.; Cai, X.; Zhu, T.; Hu, M.; Zhang, H. A high-resolution ammonia emission inventory in China. Global Biogeochemical Cycles 2012, 26. [Google Scholar] [CrossRef]
- Li, F.-c.; Han, S.-h.; Yang, J.; Zhang, X.; Li, R.-y.; Wei, Y.-s.; Fan, M.-h. Agro-ecosystem ammonia emission in Sichuan-Chongqing region. Huan Jing Ke Xue= Huanjing Kexue 2009, 30, 2823–2831. [Google Scholar]
- SEPA, State Environmental Protection Administration of the People’s Republic of China. Emission Standards for Odor Pollutants; Standards Press of China: Beijing, China, 1993. [Google Scholar]
- MEP, Ministry of Environmental Protection of the People’s Republic of China. Technical Guidelines for the Compilation of Atmospheric Ammonia Source Emissions Inventory; Standards Press of China: Beijing, China, 2014. [Google Scholar]
- Ni, J.-Q.; Heber, A.J.; Cortus, E.L.; Lim, T.-T.; Bogan, B.W.; Grant, R.H.; Boehm, M.T. Assessment of ammonia emissions from swine facilities in the U.S.—Application of knowledge from experimental research. Environ. Sci. Policy 2012, 22, 25–35. [Google Scholar] [CrossRef]
- Gilliland, A.B.; Dennis, R.L.; Roselle, S.J.; Pierce, T.E. Seasonal NH3 emission estimates for the eastern United States based on ammonium wet concentrations and an inverse modeling method. J. Geophys. Res.-Atmos. 2003, 108. [Google Scholar] [CrossRef]
- Shen, X.; Yin, S.; Zheng, J.; Lu, Q.; Zhong, L. Anthropogenic ammonia emission inventory and its mitigation potential in Guangdong Province. Acta Sci. Circumstantiae 2014, 34, 43–53. [Google Scholar]
- Bouwman, A.F.; Lee, D.S.; Asman, W.A.H.; Dentener, F.J.; VanderHoek, K.W.; Olivier, J.G.J. A global high-resolution emission inventory for ammonia. Glob. Biogeochem. Cycles 1997, 11, 561–587. [Google Scholar] [CrossRef]
- Bash, J.O.; Cooter, E.J.; Dennis, R.L.; Walker, J.T.; Pleim, J.E. Evaluation of a regional air-quality model with bidirectional NH3 exchange coupled to an agroecosystem model. Biogeosciences 2013, 10, 1635–1645. [Google Scholar] [CrossRef]
- Fang, X.; Shen, G.; Xu, C.; Qian, X.; Li, J.; Zhao, Z.; Yu, S.; Zhu, K. Agricultural ammonia emission inventory and its distribution characteristics in Shanghai. Acta Agric. Zhejiangensis 2015, 27, 2177–2185. [Google Scholar]
- Webb, J.; Misselbrook, T.H. A mass-flow model of ammonia emissions from UK livestock production. Atmos. Environ. 2004, 38, 2163–2176. [Google Scholar] [CrossRef]
- Wu, S.-P.; Zhang, Y.-J.; Schwab, J.J.; Li, Y.-F.; Liu, Y.-L.; Yuan, C.-S. High-resolution ammonia emissions inventories in Fujian, China, 2009-2015. Atmos. Environ. 2017, 162, 100–114. [Google Scholar] [CrossRef]
- Guo, X.; Ye, Z.; Chen, D.; Wu, H.; Shen, Y.; Liu, J.; Cheng, S. Prediction and mitigation potential of anthropogenic ammonia emissions within the Beijing-Tianjin-Hebei region, China. Environ. Pollut 2020, 259, 113863. [Google Scholar] [CrossRef] [PubMed]
- Hou, X.-H.; Yu, X.-N.; Shen, L.; Zhao, R.-D.; Wang, G.-Z.; Zhang, Y.-X. Establishment and Characteristics of an Artificial Ammonia Emissions Inventory in Jiangsu Province from 2013 to 2017. Huan Jing Ke Xue= Huanjing Kexue 2019, 40, 4862–4869. [Google Scholar]
- Kang, Y.; Liu, M.; Song, Y.; Huang, X.; Yao, H.; Cai, X.; Zhang, H.; Kang, L.; Liu, X.; Yan, X.; et al. High-resolution ammonia emissions inventories in China from 1980 to 2012. Atmos. Chem. Phys. 2016, 16, 2043–2058. [Google Scholar] [CrossRef]
- Paulot, F.; Jacob, D.J.; Pinder, R.W.; Bash, J.O.; Travis, K.; Henze, D.K. Ammonia emissions in the United States, European Union, and China derived by high-resolution inversion of ammonium wet deposition data: Interpretation with a new agricultural emissions inventory (MASAGE_NH3). J. Geophys. Res.-Atmos. 2014, 119, 4343–4364. [Google Scholar] [CrossRef]
- Streets, D.G.; Bond, T.C.; Carmichael, G.R.; Fernandes, S.D.; Fu, Q.; He, D.; Klimont, Z.; Nelson, S.M.; Tsai, N.Y.; Wang, M.Q.; et al. An inventory of gaseous and primary aerosol emissions in Asia in the year 2000. J. Geophys. Res. Atmos. 2003, 108. [Google Scholar] [CrossRef]
- Zhang, L.; Chen, Y.; Zhao, Y.; Henze, D.K.; Zhu, L.; Song, Y.; Paulot, F.; Liu, X.; Pan, Y.; Lin, Y.; et al. Agricultural ammonia emissions in China: Reconciling bottom-up and top-down estimates. Atmos. Chem. Phys. 2018, 18, 339–355. [Google Scholar] [CrossRef]
- Wang, Y.; Zhao, T.; Zou, G.; Yang, J.; Tian, Z.; Li, X. Research Statues of Ammonia Emission Characteristics and Mitigation Technologies from Livestock Houses. Chin. J. Anim. Nutr. 2017, 29, 4249–4259. [Google Scholar]
- MA, Ministry of Agriculture of the People’s Republic of China. Environmental Quality Standards for Livestock and Poultry Farms; Standards Press of China: Beijing, China, 1999. [Google Scholar]
- SAC, Standardization Administration of the People’s Republic of China. Slow Release Fertilizers; Standards Press of China: Beijing, China, 2009. [Google Scholar]
- MEP, Ministry of Environmental Protection of the People’s Republic of China. Technical Policy on Pollution Prevention and Control in Livestock and Poultry Breeding; Standards Press of China: Beijing, China, 2010. [Google Scholar]
- SCC, State Council of the People’s Republic of China. Action Plan for the Prevention and Control of Air Pollution; Standards Press of China: Beijing, China, 2013. [Google Scholar]
- SEPA, State Environmental Protection Administration of the People’s Republic of China. Discharge standard of pollutants for livestock and poultry breeding; Standards Press of China: Beijing, China, 2001. [Google Scholar]
- GAQSIQ, General Administration of Quality Supervision, Inspection and Quarantine of the People’s Republic of China. Inspection and Quarantine of the People’s Republic of China, Environmental parameters and environmental management for intensive pig farms; Standards Press of China: Beijing, China, 2008. [Google Scholar]
- Zeng, W.; Li, J. Spatio-temporal distribution of ammonia (NH3) emissions in agricultural fields across North China. Environ. Sci. Pollut. Res. 2020, 27, 8129–8141. [Google Scholar] [CrossRef] [PubMed]
- Suo, L. Strategic Change in the Region, Policy Regionalization and Changes in the Structure of the Collaborative Governance Organization for Air Pollution. J. Tianjin Adm. Inst. 2020, 22, 55–68. [Google Scholar]
- de Vries, M.; de Boer, I.J.M. Comparing environmental impacts for livestock products: A review of life cycle assessments. Livest. Sci. 2010, 128, 1–11. [Google Scholar] [CrossRef]
- Yang, Z. Estimation of Ammonia Emission from Livestock in China based on Mass-flow Method and Regional Comparison. Master’s Thesis, Peking University, Beijing, China, 2008. [Google Scholar]
- Cortus, E.L.; Lemay, S.P.; Barber, E.M.; Hill, G.A.; Godbout, S. A dynamic model of ammonia emission from urine puddles. Biosyst. Eng. 2008, 99, 390–402. [Google Scholar] [CrossRef]
- Bai, Z.H.; Ma, L.; Qin, W.; Chen, Q.; Oenema, O.; Zhang, F.S. Changes in pig production in China and their effects on nitrogen and phosphorus use and losses. Environ. Sci Technol 2014, 48, 12742–12749. [Google Scholar] [CrossRef] [PubMed]
- Ma, L.; Velthof, G.L.; Wang, F.H.; Qin, W.; Zhang, W.F.; Liu, Z.; Zhang, Y.; Wei, J.; Lesschen, J.P.; Ma, W.Q.; et al. Nitrogen and phosphorus use efficiencies and losses in the food chain in China at regional scales in 1980 and 2005. Sci Total Environ. 2012, 434, 51–61. [Google Scholar] [CrossRef]
- Tamminga, S. Gaseous pollutants produced by farm animal enterprises. In Effect of Farm Animals on the Human Environment; CAB International: Wallingford, UK, 1992; pp. 345–356. [Google Scholar]
- Cao, Y.; Xing, X.; Bai, Z.; Wang, X.; Hu, C.; Ma, L. Review on Ammonia Emission Mitigation Techniques of Crop-Livestock Production System. Sci. Agric. Sin. 2018, 51, 566–580. [Google Scholar]
- Cheng, L. Establlishment and Contral Scheme of Agricultural Ammonia Emission Inventory in Beijing-Tianjin-Hebei Region; Beijing University of Technology: Beijing, China, 2018. [Google Scholar]
- Velthof, G.L.; Oudendag, D.A.; Oenema, O. Development and Application of the Integrated Nitrogen Model MITERRA-EUROPE; Task 1 Service Contract “Integrated Measures in Agriculture to Reduce Ammonia Emissions”; Alterra: Wageningen, The Netherlands, 2007. [Google Scholar]
- Burgos, S.A.; Embertson, N.M.; Zhao, Y.; Mitloehner, F.M.; DePeters, E.J.; Fadel, J.G. Prediction of ammonia emission from dairy cattle manure based on milk urea nitrogen: Relation of milk urea nitrogen to ammonia emissions. J. Dairy Sci. 2010, 93, 2377–2386. [Google Scholar] [CrossRef] [PubMed]
- Rotz, C.A. Management to reduce nitrogen losses in animal production. J. Anim. Sci. 2004, 82 (Suppl. S13), E119–E137. [Google Scholar]
- Canh, T.T.; Aarnink, A.J.A.; Schutte, J.B.; Sutton, A.; Langhout, D.J.; Verstegen, M.W.A. Dietary protein affects nitrogen excretion and ammonia emission from slurry of growing-finishing pigs. Livest. Prod. Sci. 1998, 56, 181–191. [Google Scholar] [CrossRef]
- Ogink, N.W.M.; Kroodsma, W. Reduction of ammonia emission from a cow cubicle house by flushing with water or a formalin solution. J. Agric. Eng. Res. 1996, 63, 197–204. [Google Scholar] [CrossRef]
- Huang, X.-D.; Han, Z.-Y.; Shi, D.-Z.; Huang, X.; Wu, W.-X.; Liu, Y.-X. Nitrogen loss and its control during livestock manure composting. Ying Yong Sheng Tai Xue Bao = J. Appl. Ecol. 2010, 21, 247–254. [Google Scholar]
- Liu, X.J.; Sha, Z.P.; Song, Y.; Dong, H.M.; Pan, Y.P.; Gao, Z.L.; Li, Y.E.; Ma, L.; Dong, W.X.; Hu, C.S.; et al. China’s Atmospheric Ammonia Emission Characteristics, Mitigation Options and Policy Recommendations. Res. Environ. Sci. 2021, 34, 149–157. [Google Scholar]
- Zhang, Z.; Zhang, S.; Han, Y.; Wang, J.; Wang, A.; Bi, H. Preliminary study on control strategies of ammonia emissions from agricultural sources. Jiangsu Agric. Sci. 2016, 44, 439–442. [Google Scholar]
- Wang, W. How much pollution can be reduced by controlling agricultural source ammonia. China Environment News, 3 April 2017. [Google Scholar]
- Shan, L.; He, Y.; Chen, J.; Huang, Q.; Wang, H. Ammonia volatilization from a Chinese cabbage field under different nitrogen treatments in the Taihu Lake Basin, China. J. Environ. Sci. 2015, 38, 14–23. [Google Scholar] [CrossRef]
- Zhang, Y.; Luan, S.; Chen, L.; Shao, M. Estimating the volatilization of ammonia from synthetic nitrogenous fertilizers used in China. J. Environ. Manag. 2011, 92, 480–493. [Google Scholar] [CrossRef]
- Li, X.; Ju, X.-t.; Zhang, L.-j.; Wan, Y.-j.; Liu, S.-q. Effects of different fertilization modes on soil ammonia volatilization and nitrous oxide emission. Ying Yong Sheng Tai Xue Bao = J. Appl. Ecol. 2008, 19, 99–104. [Google Scholar]
- Yang, X.; Yang, H. Soil ammonia volatilization under the different fertilization in summer corn farmland in North China. J. Arid Land Resour. Environ. 2016, 30, 137–142. [Google Scholar]
- Sha, Z.; Ma, X.; Loick, N.; Lv, T.; Cardenas, L.M.; Ma, Y.; Liu, X.; Misselbrook, T. Nitrogen stabilizers mitigate reactive N and greenhouse gas emissions from an arable soil in North China Plain: Field and laboratory investigation. J. Clean. Prod. 2020, 258, 121025. [Google Scholar] [CrossRef]
- Phillips, J. Control and Pollution Prevention Options for Ammonia Emissions; United States Environmental Protection Agency: Washington, DC, USA, 1995. [Google Scholar]
- Reidy, B.; Webb, J.; Misselbrook, T.H.; Menzi, H.; Luesink, H.H.; Hutchings, N.J.; Eurich-Menden, B.; Döhler, H.; Dämmgen, U. Comparison of models used for national agricultural ammonia emission inventories in Europe: Litter-based manure systems. Atmos. Environ. 2009, 43, 1632–1640. [Google Scholar] [CrossRef]
- Hellsten, S.; Dalgaard, T.; Rankinen, K.; Torseth, K.; Bakken, L.; Bechmann, M.; Kulmala, A.; Moldan, F.; Olofsson, S.; Piil, K.; et al. Abating N in Nordic agriculture-Policy, measures and way forward. J Environ. Manag. 2019, 236, 674–686. [Google Scholar] [CrossRef] [PubMed]
- EEA, European Environment Agency. EMEP/CORINAIR Emission Inventory Guidebook— 2007; In Publications Office of the Europe: Luxembourg, 2007. [Google Scholar]
- Van Grinsven, H.J.M.; Tiktak, A.; Rougoor, C.W. Evaluation of the Dutch implementation of the nitrates directive, the water framework directive and the national emission ceilings directive. NJAS—Wagening. J. Life Sci. 2016, 78, 69–84. [Google Scholar] [CrossRef]

| No. | Area | Time | Source | Resolution | Method | Activity Data | Factor Differentiation | Total/Gg | Farmland/Gg | Livestock & Poultry /Gg | Human/Gg | Uncertainty Method | Uncertainty | References | |
|---|---|---|---|---|---|---|---|---|---|---|---|---|---|---|---|
| 1 | National | National | 2016 | Anthropogenic | 1 × 1 km | CHEN | Provincial | Yes | 11,032.00 | 6475.00 | 3032.00 | 487.00 | MC | (−20%,24%) | [20] |
| National | 2015 | Anthropogenic | CHANS | Provincial | Yes | 15,600.00 | 5870.00 | 6650.00 | 780.00 | MC | (−21%, 32%) | [6] | |||
| National | 2015 | Anthropogenic | 1 × 1 km | EF | Provincial | Yes | 12,580.00 | 5580.00 | 2560.00 | 870.00 | Literature-based values | ±30% | [4] | ||
| 2 | Regional | Yangtze River Delta region | 2014 | Anthropogenic | 1 × 1 km | EF, NARSES | Prefecture-level city | Partial | 986.73 | 532.82 | 316.68 | 51.11 | MC | (−55%, 60%) | [5,34] |
| North China | 2016 | Anthropogenic | EF | Prefecture-level city | Partial | 966.14 | 350.04 | 548.90 | 13.11 | MC | (−17%, 25%) | [34] | |||
| Sichuan and Chongqing | 2004 | Agricultural | IAP-N | County | No | 698.76 | 374.94 | 219.60 | 98.59 | Qualitative analysis | [23] | ||||
| 3 | Provincial | Fujian | 2015 | Anthropogenic | 1 × 1 km | EF, NARSES | County | Partial | 228.02 | 89.74 | 98.37 | 11.13 | MC | ±16.3% | [33] |
| Jiangsu | 2017 | Anthropogenic | EF | Prefecture-level city | No | 562.47 | 250.54 | 212.91 | 33.55 | Qualitative analysis | [35] | ||||
| Henan | 2015 | Anthropogenic | 3 × 3 km | EF, NARSES | Prefecture-level city | Partial | 1031.60 | 291.00 | 591.50 | 31.60 | MC; the AuvToolPro tool | (−33%, 35%) | [2] | ||
Disclaimer/Publisher’s Note: The statements, opinions and data contained in all publications are solely those of the individual author(s) and contributor(s) and not of MDPI and/or the editor(s). MDPI and/or the editor(s) disclaim responsibility for any injury to people or property resulting from any ideas, methods, instructions or products referred to in the content. |
© 2023 by the authors. Licensee MDPI, Basel, Switzerland. This article is an open access article distributed under the terms and conditions of the Creative Commons Attribution (CC BY) license (https://creativecommons.org/licenses/by/4.0/).
Share and Cite
Li, J.; Zeng, W.; Wan, X. Management and Reduction Techniques Strategies of Ammonia Emission in Agricultural Sectors in China. Agronomy 2023, 13, 2555. https://doi.org/10.3390/agronomy13102555
Li J, Zeng W, Wan X. Management and Reduction Techniques Strategies of Ammonia Emission in Agricultural Sectors in China. Agronomy. 2023; 13(10):2555. https://doi.org/10.3390/agronomy13102555
Chicago/Turabian StyleLi, Jing, Weibin Zeng, and Xiaoming Wan. 2023. "Management and Reduction Techniques Strategies of Ammonia Emission in Agricultural Sectors in China" Agronomy 13, no. 10: 2555. https://doi.org/10.3390/agronomy13102555
APA StyleLi, J., Zeng, W., & Wan, X. (2023). Management and Reduction Techniques Strategies of Ammonia Emission in Agricultural Sectors in China. Agronomy, 13(10), 2555. https://doi.org/10.3390/agronomy13102555