Article

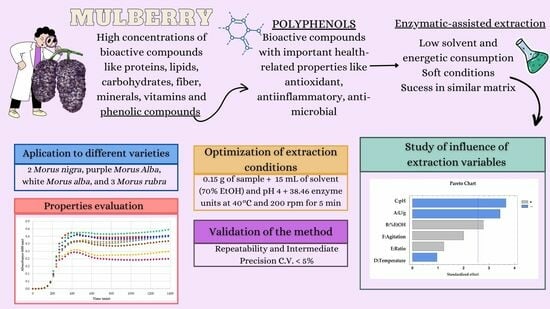
Enhancing Efficiency of Enzymatic-Assisted Extraction Method for Evaluating Bioactive Compound Analysis in Mulberry: An Optimization Approach

by
Ainara Tizón Alba
1,
María José Aliaño-González
1,2,*,
Miguel Palma
1,
Gerardo Fernández Barbero
1 and
Ceferino Carrera
1
1
Department of Analytical Chemistry, Faculty of Sciences—IVAGRO, University of Cadiz, Agrifood Campus of International Excellence (ceiA3), 11510 Puerto Real, Spain
2
MED–Mediterranean Institute for Agriculture, Environment and Development, Faculdade de Ciências e Tecnologia, Universidade do Algarve, Campus de Gambelas, Ed. 8, 8005-139 Faro, Portugal
*
Author to whom correspondence should be addressed.
Agronomy 2023, 13(10), 2548; https://doi.org/10.3390/agronomy13102548
Submission received: 31 August 2023 / Revised: 29 September 2023 / Accepted: 2 October 2023 / Published: 3 October 2023

Abstract

:
The present investigation endeavors to optimize a method based on enzyme-assisted extraction for the efficient retrieval of bioactive compounds from mulberry, leveraging its notable health-promoting properties. A combined approach of Plackett–Burman design followed by Box–Behnken design was employed for determining the crucial extraction parameters and subsequently, refining the process. Optimal conditions consisted of heating 0.15 g of mulberry at 40 °C, using 15 mL of 70% EtOH as a solvent at pH 4, 38.46 enzyme units per g of sample, and shaking at 200 rpm. The optimum extraction time study revealed that 5 min of extraction was sufficient to reach the maximum concentration of the bioactive compound. The repeatability and intermediate precision assessment exhibited a coefficient of variation below 5%. Among the diverse mulberry varieties scrutinized, Morus nigra showed the highest anthocyanin content (27.90 ± 2.14 mg/100 g), while Morus rubra showed the highest concentration of phenolic compounds (121.10 ± 19.56 mg/100 g). Moreover, the extracted compounds showcased significant antioxidant and antimicrobial properties.

Graphical Abstract

1. Introduction

The mulberry tree, an arboreal species characterized by its deciduous nature, belongs to the Morus genus, a member of the Moraceae family, which encompasses 24 species and over 100 recognized varieties. Predominantly indigenous to China, various components of the tree, including its bark, branches, and leaves, have been utilized for medicinal purposes [1,2]. Conversely, in many European countries, the cultivation of mulberries focuses on the production of its fruit [3,4].
Mulberry fruit, a syncarpous berry resulting from the fusion of a flower spike, exhibits varying shapes and sizes across cultivars [5]. Distinct mulberry varieties can be categorized based on their geographical origins, such as black mulberries (Morus nigra) and white mulberries (Morus alba), both native to Asia [6], as well as red mulberries (Morus rubra), originating from eastern North America and also cultivated in Spain [7]. Among these, the black mulberry has recently gained significant popularity due to its appealing coloration and higher content of bioactive compounds, particularly anthocyanins [8].
Mulberries possess noteworthy nutritional compositions, exhibiting substantial concentrations of proteins, lipids, carbohydrates, fiber, minerals, and vitamins such as A and E [9]. Much research has proven the importance of concentrations of bioactive compounds within mulberries, including phenolic compounds, which contribute to crucial biological activities beneficial for human health [10,11,12]. These compounds have shown potential in the prevention of cerebrovascular and cardiovascular diseases [13], exerting an anticarcinogenic role [14,15], diabetes prevention [16], and mitigating neurodegenerative diseases like Alzheimer’s [17]. Notably, their antioxidant properties emerge as a prominent characteristic, as they effectively scavenge and neutralize reactive oxygen species (ROS) generated during cellular respiration in the presence of oxygen [18,19].
Anthocyanins represent a distinct category of the phenolic compound family, often examined in isolation due to their significant biological relevance [20]. Their notable attributes encompass the enhancement of the shelf life of various food products, the mitigation of oxidative stress, which bears considerable implications in the context of afflictions such as cancer and cardiovascular diseases, manifesting anti-inflammatory properties, safeguarding the gastrointestinal microbiota, and exerting a considerable influence in the realm of averting obesity and type 2 diabetes [21,22,23,24,25]. It is worth noting that in Morus nigra varieties, anthocyanin content can account for up to 50% of the overall phenolic compound composition [26], thereby signifying their pivotal role in conferring distinctive properties associated with the consumption of this fruit.
The increasing demand for mulberry, driven by its recognized health benefits attributed to its polyphenolic content, necessitates the establishment of efficient and rapid extraction methods for these chemical compounds. Novel approaches such as microwave-assisted extraction (MAE), supercritical fluid extraction (SFE), and ultrasound-assisted extraction (UAE) have emerged as viable options to conventional approaches, which often possess limitations and fail to align with eco-extraction principles. These novel techniques have proven successful in extracting phenolic compounds from food matrices [27,28,29]. However, it is important to consider certain disadvantages, such as that UAE employs organic solvents, introducing environmental concerns, and the substantial financial investment required for SFE, PLE, and MAE devices, limiting their practical application in many laboratories.
Enzyme-assisted extraction (EAE) is a method that capitalizes on specific enzymes’ ability to catalyze the degradation or modification of cellular walls, facilitating the release of intracellular compounds of interest, particularly phenolic compounds [30]. Pectinase, amylase, and cellulose represent the three most frequently employed enzymes for cell wall degradation [31]. However, the use of pectinase stands out because it acts by degrading pectin, a crucial component in the cell wall structure that preserves morphology, confers rigidity and resistance to vascular plants, and allows the passage of water and solutes thanks to the tracheal elements [32]. Enzymes are highly effective in breaking down cell walls and can synergistically enhance extraction when combined with other solvents [33]. The combination of chemical solvents and EAE offers a merger of the advantages inherent to both techniques, presenting a proficient and eco-conscious alternative to the established methods for extracting anthocyanins and flavonoids [34]. EAE exhibits notable advantages as a gentle process that typically avoids the need for chemical solvents, high energy consumption, extended time, or elevated temperatures to achieve significant extraction yields [35]. These advantages associated with the average conditions make the extracts obtained suitable for application in a multitude of fields of interest such as medicine, pharmacy, or the agri-food industry [36,37,38,39,40]. In addition, the suitability of EAE for extracting bioactive compounds from similar matrices like açai, blackcurrant, grapes, and cherries has been demonstrated in previous studies [32,34,35,41].
In conclusion, the principal aim of this study is to develop and optimize an EAE-based method for obtaining bioactive compound-enriched extracts from mulberry. These extracts hold potential applications in various fields, including nutrition, medicine, and the pharmaceutical industry, owing to their multiple beneficial properties. To the extent of our knowledge, this study represents the first investigation of its kind conducted on the mulberry. To the best of the authors’ knowledge, this is the first time that an EAE-based approach has been used for the extraction of bioactive compounds from mulberry fruits, which represents a significant advance in the extraction and application of polyphenols in multiple fields with important advantages for the environment.

2. Materials and Methods

2.1. Samples

Black mulberries (Morus nigra) harvested in Puerto Real (Andalusia, Spain) were employed for the development of the EAE method. Prior to extraction, the black mulberries underwent lyophilization using a VirTis BenchTop Pro freeze dryer (SP Industries, Warminster, Pensilvania, USA) and subsequently ground into a fine powder using an MKM6003 electric grinder (BSH Electrodomésticos España S.A., Zaragoza, Spain). This grinding process aimed to enhance the extraction yield by maximizing the interfacial area of contact between the mulberry powder and the solvent. The resulting samples were stored at −20 °C until required for further analysis. Following the completion of the method development, the optimized extraction method was applied to different varieties of mulberries, as detailed in Table 1. These mulberry varieties were collected from two locations in the province of Cadiz, Andalusia, Spain, during June for black and white mulberries and in September for red mulberries. In the case of red mulberries, samples were collected twice, with a 10-day interval, to assess the impact of overripening on the content of bioactive compounds. The treatment procedure for these samples was consistent with the aforementioned methodology.
These varieties were selected because they are the most cultivated in the province of Cadiz and consequently the most consumed. Although they have shown notorious differences in their composition, especially in the concentration of minerals and fats, comparative studies on their composition of phenolic compounds are scarce [42,43].

2.2. Chemicals and Solvents

Absolute ethanol (EtOH) (Scharlau, Sentmenat, Barcelona, Spain), methanol (MeOH) (Fisher Scientific, Loughborough, England, UK) of HPLC grade, and Milli Q water from a Millipore water purification system (EMD Millipore Corporation, Bedford, Massachusetts, USA) were the solvents utilized for the extraction. Formic acid (Panreac Química S.L.U., Castellar del Vallès, Barcelona, Spain) and MeOH (Fisher Scientific, Loughborough, England, UK)), both of HPLC grade, were used for the chromatographic separation for the anthocyanin analysis and its quantification. The reference standard chosen for the anthocyanin measurement was cyanidin chloride (95% purity), which was provided by Sigma-Aldrich Chemical Co. (St. Louis, Misuri, USA).
The enzyme selected to carry out the enzyme-assisted extraction was a pectinase from Aspergillus niger (P4716-25KU, Sigma-Aldrich Chemical Co., St. Louis, Missouri, USA). To guarantee the stability of the enzyme against pH variations, a citric/phosphate buffer was added. For this, several mixes of sodium disodium phosphate dibasic dodecahydrate hydrate (Na2HPO4·12H2O) and citric acid 0.1 M (CH8O7) were used. The mixtures used for pH 4, pH 5, and pH 6 were 62% CH8O7/38% Na2HPO4·12H2O, 49% CH8O7/51% Na2HPO4·12H2O, and 37.5% CH8O7/6.5% Na2HPO4·12H2O, respectively.

2.3. Enzyme-Assisted Extraction

2.3.1. Enzymatic Extraction Procedure

The developed EAE method followed the subsequent procedure. Freeze-dried black mulberries were accurately weighed and placed into an Erlenmeyer flask. A total of 15 mL of the appropriate extraction solvent and the required units of the enzyme were introduced into the flask. The Erlenmeyer flask was then placed on a shaker, and the temperature and agitation settings were adjusted according to the experimental conditions. After the specified extraction time had elapsed, the extracts were subjected to centrifugation at 1702× g for 5 min. The resulting supernatant was carefully transferred to a 25 mL volumetric flask and diluted to the mark using the same solvent as used for extraction. Prior to analysis, the samples were filtered through 0.22 µm filters and stored in a dark environment at −20 °C.

2.3.2. Optimization of the Process

In the pursuit of enhancing the efficiency of the EAE methodology for the isolation of anthocyanins and phenolic compounds from mulberries, a methodical strategy was implemented. In the initial phase, a Plackett-Burman screening design (PBD) was utilized to discern the primary variables exerting the greatest impact. The PBD methodology operates under the assumption of the independence of each factor [44], and can be elucidated by the subsequent first-order model (Equation (1)):
Y ( m g / 100   g   s a m p l e ) = β 0 + ( β i + X i )
Here, Y is the target response, total anthocyanins, or total phenolic compounds. β0 is the intercept of the model, βi is the regression ratio, and Xi is an independent parameter. Six distinct independent factors were chosen for inclusion in the study, a selection informed by both the existing literature and the research team’s prior expertise in dealing with analogous sample matrices [32,34], including the percentage of ethanol (% EtOH), pH, units of enzyme per gram of sample, temperature (°C), ratio (g/15 mL), and agitation (rpm). These factors were assigned two levels, high (+1) and low (−1), resulting in a total of 12 experiments (Table S1). The extraction time was fixed at 20 min, and the extracts were analyzed using UHPLC-UV-Vis to evaluate the total concentration of anthocyanins (mg/100 g) and phenolic compounds (mg/100 g sample).
Next, the influential variables identified from the PBD were further investigated using the Box–Behnken Design–Response Surface Methodology (BBD–RSM), a type of response surface design that does not have a factorial or fractional factorial design [45,46]. The BBD–RSM employed in this study involves a design matrix consisting of three levels for each factor: (−1) representing a lower level, (0) indicating an intermediate level, and (1) signifying a higher level. Notably, this design does not incorporate axial points, resulting in a more spherical arrangement of experimental points compared to other statistical designs. Consequently, this approach not only necessitates a reduced total number of experiments but also avoids conducting experiments under extreme conditions, which could potentially lead to polyphenol degradation or incur excessive economic costs [47]. This design framework facilitated a comprehensive investigation of the selected variables, enabling the determination of optimal conditions for the EAE methodology in finer detail. Three variables (%EtOH, pH, and units of enzyme per gram of sample) were chosen for optimization, and their ranges were selected according to the literature, research group experience, and previous study results. A total of 15 experiments were randomly conducted following the BBD-RSM (Table S2). The response variables used were the total concentration of anthocyanins (mg/100 g) and phenolic compounds (mg/100 g) in the mulberry samples. The estimated response value Y in each test can be fitted to a second-degree polynomial (Equation (2)) as follows:
Y m g · g 1 = β 0 + β 1 X 1 + β 2 X 2 + β 3 X 3 + β 11 X 1 2 + β 12 X 1 X 2 + β 13 X 1 X 3 + β 22 X 2 2 + β 23 X 2 X 3 + β 33 X 3 2
In Equation (2), Y is the total concentration of anthocyanins or phenolic compounds; β0 is the ordinate; X1 (percentage of EtOH in the extraction solvent), X2 (pH), and X3 (U/g), are the independent variables; βi are the linear coefficients; βij are the cross product coefficients; and βii are the quadratic coefficients.
Statgraphic Centurion statistical software (version XVII) (Statgraphics Technologies, Inc., The Plains, VA, USA) was used to generate and analyze the PB and BBD–RSM designs. The influence of the variables was studied using an ANOVA test at a 95% confidence level.

2.4. Identification of Anthocyanins

The identification of anthocyanins present in mulberry extracts was conducted using a UHPLC-Q-ToF-MS system (model Xevo G2, Waters Corp., Milford, MA, USA) and following the method described by Velasco et al. [48].
Identification was carried out by analysis of mulberry extracts under optimal conditions. Specifically, four anthocyanins were identified: cyanidin 3-O-glucoside (m/z 449), cyanidin 3-O-rutinoside (m/z 595), pelargonidin 3-O-glucoside (m/z 433), and pelargonidin 3-O-rutinoside (m/z 579). The identification process involved comparing retention times, elution order, UV spectra, mass spectra, and relevant research group experience in similar matrices [34].

2.5. Quantification of Anthocyanins

The quantification of anthocyanins was performed using an Elite HPLC LaChrom Ultra liquid chromatography system (Hitachi, Tokyo, Japan). The methodology employed was the previously employed by Velasco et al. [49] with some modifications.
The system consisted of an automatic autosampler (L-2200 U), a column oven (L-2300), two pumps (L-2160 U), and a UV-Vis detector (L-2420 U). The temperature of the column oven was set to 50 °C, and an injection volume of 15 μL was used. The detector was set to monitor the absorbance at 520 nm, which corresponds to the maximum absorption wavelength of anthocyanins. A Kinetex EVO C18 column (2.6 μm, 2.1 × 100 mm, Phenomenex, Torrance, California, USA) was employed for chromatographic separation. The mobile phase consisted of a 5% aqueous solution of formic acid (Phase A) and pure MeOH (Phase B). A gradient elution method was applied with a flow rate of 1.0 mL/min. The gradient profile (%B) over time (min) was as follows: 0.00, 15%; 1.50, 20%; 3.30, 30%; 4.80, 40%; 5.40, 100%; 8.40, 100%; and 9.00, 15%. The total analysis time, including equilibration, was 9 min. Subsequently, the concentrations of the previously identified anthocyanins were summed to obtain the total anthocyanin content (mg/100 g).
For the quantification of anthocyanins, a calibration curve was constructed using cyanidin chloride (Sigma Aldrich, St. Louis, Missouri, USA) as a standard. The calibration curve equation was y = 187132.66x − 4292.66, with an R2 value of 1.00. The limit of detection (LOD) and limit of quantification (LOQ) were determined to be 0.15 mg/L and 0.31 mg/L, respectively. This calibration curve was used to determine the concentration of individual anthocyanins, assuming that the molar extinction coefficient is similar among them and applying the appropriate correction based on the molecular weight of each compound [50].

2.6. Identification and Quantification of Phenolic Compounds

The identification and quantification of phenolic compounds were conducted using an ACQUITY UPLC H-Class system equipped with a DAD detector (ACQUITY UPLC® H-Class, Waters Corporation, Milford, MA, USA) and controlled using Empower TM version 3 Chromatography Data Software (Waters Corporation, Milford, Massachusetts, USA). The injection volume was set at 3 µL. Chromatographic separation was achieved using a reverse-phase C18 column (Acquity UPLC® BEH, 2.1 × 100 mm, 1.7 μm, Waters Corporation, Wexford, Ireland). A binary solvent system consisting of phase A (2% acetic acid in water) and phase B (2% acetic acid in acetonitrile) was employed at a flow rate of 0.5 mL/min. The gradient elution profile (%B) over time (min) was as follows: 0.00, 0%; 1.00, 5%; 3.00, 10%; 5.00, 20%; 8.00, 30%; and 10.00, 100%. The total analysis time, including equilibration, was 12 min. The temperature of the system was maintained at 47 °C throughout the analysis.
The identification of phenolic compounds was based on their retention times at specific wavelengths. Chlorogenic acid, vanillic acid, and resveratrol were identified at 320 nm, while rutin was identified at 360 nm. For quantification, calibration curves were constructed for each compound. A chromatogram comparing the standard and phenolic compounds identified can be found in Figure S1. The calibration curves exhibited the following equations and statistical parameters: (i) chlorogenic acid (y = 26442x + 11415.3) with an R2 value of 0.9999, LOD of 0.12 mg/L, and LOQ of 0.37 mg/L; (ii) vanillic acid (y = 26087x + 2031.3) with an R2 value of 0.9997, LOD of 0.22 mg/L, and LOQ of 0.66 mg/L; (iii) resveratrol (y = 35396x − 14333) with an R2 value of 0.9995, LOD of 0.56 mg/L, and LOQ of 1.87 mg/L; and (iv) rutin (y = 34822x + 9115.2) with an R2 value of 0.9992, LOD of 0.43 mg/L, and LOQ of 1.40 mg/L. The sum of the quantities of these identified phenolic compounds was expressed as total phenolic compounds (TPC) in mg/100 g, which served as one of the response variables for optimization in this study.

2.7. Antioxidant Activity Assay

The antioxidant capacity of the extracts was determined using the DPPH (α-diphenyl-β-picrylhydrazyl, C18H12N5O6) method, employing the trolox standard as the reference compound. The DPPH assay relies on the color change of the DPPH molecule, from purple to pale yellow, when it reacts with an antioxidant substance such as trolox. This color change occurs due to the reduction of the unpaired electron of the nitrogen atoms [51]. The chemical translation or observation of this modification manifests as a change in the absorption of the solution, which can be measured at 515 nm.
To establish a calibration curve, trolox concentrations ranging from 5 to 100 mg/L were selected. The resulting calibration curve for the trolox standard exhibited an equation of y = 0.9059x − 3.6649, with a regression coefficient (R2) of 0.9993. After measuring the absorbances of the samples, they were transformed into percentage inhibition using Equation (3). The percentage inhibition served as a measure of the antioxidant capacity of the extracts.
%   i n h i b i t i o n = 1 a b s   s a m p l e a b s   b l a n k · 100

2.8. Antimicrobial Activity Assay

The antimicrobial activity of the obtained extracts was assessed by examining their impact on the growth of two bacterial strains: Escherichia coli 1077 (E. coli), a Gram-negative bacteria, and Staphylococcus aureus (ATCC 6538) (S. aureus), a Gram-positive bacteria. The initial inoculum for both bacterial strains had a concentration of 104–105 colony-forming units (CFU) and was cultivated in tryptic soy broth (TSB) medium.
The experimental procedure involved dispensing 200 µL of the bacterial inoculum into microplate wells, to which 20 µL of the mulberry extract or antibiotic at the appropriate concentration was added. The growth of the bacteria was monitored for a period of 24 h at 37 °C, and the optical density of the bacterial culture was measured at 600 nm. This monitoring process allowed for the assessment of bacterial growth inhibition caused by the mulberry extract or antibiotic [52,53]. All tests were performed in triplicate. Mulberry extracts were obtained under optimal conditions and the optimal extraction solvent was exposed to bacterial growth and subsequently subtracted from the signal to delay the possible solvent influence. A bacterial culture without any additional compounds served as the control in these experiments.

2.9. Statistical Analysis

The BBD-RSM design was performed using the Statgraphic Centurion software (version XVII) from Statgraphics Technologies, Inc. (The Plains, VA, USA). The data obtained were compared and grouped based on the least significant difference (LSD) method, response surface regression techniques, analysis of variance (ANOVA), and the Fisher test. The significance level was set at 95%, corresponding to a p-value ≤ 0.05.

3. Results and Discussion

3.1. Determining the Influencing Variables

To ascertain the pivotal factors influencing the extraction of anthocyanins and phenolic compounds using EAE, a screening analysis was conducted employing the PB methodology. Six variables were chosen for investigation, leading to a total of 12 experiments randomly conducted (see Table S1). The total anthocyanin concentrations and phenolic compounds in the samples were quantified and expressed as milligrams per 100 g of sample. The obtained values were then subjected to analysis using the PB design, and the results were correlated with the predicted values (Table S1). The analysis was performed separately for anthocyanins and phenolic compounds.

3.1.1. Influential Variables for Anthocyanins

For anthocyanins, the average error between the predicted and observed values was found to be 4.21%, ranging from 0.82% to 11.07%. Moreover, the statistical model achieved an R2 value of 0.82, indicating a good fit, and a Durbin–Watson p-value of 2.27, which exceeded the significance threshold of 0.05. This indicates that no substantial disparities existed between the predicted and observed values.
The normal distribution of the data was verified, followed by the execution of an analysis of variance (ANOVA) to explore the impact of the variables. The outcomes were graphically illustrated through a Pareto diagram (Figure S2A). It was observed that pH (p-value: 0.0145), the %EtOH in the solvent (p-value: 0.0392), and the units of enzyme added (p-value: 0.0187) were the influential variables affecting the extraction of anthocyanins. A negative influence of pH was observed, indicating that a lower pH value (within the enzyme’s efficient range) resulted in a higher concentration of extracted anthocyanins. A comparable trend was noted in relation to the quantity of enzyme employed. Furthermore, it was observed that the proportion of ethanol in the solvent had a beneficial impact on the extraction process, leading to an extension of its value to 80% in the subsequent BBD–RSM. These findings align with the existing literature and the research group’s expertise, which have highlighted the significant influence of %EtOH, solvent pH, and enzyme units on anthocyanin production in EAE processes [34,54,55].

3.1.2. Influential Variables for Phenolic Compounds

Similarly, for total phenolic compounds, the predicted values were compared with the observed values (see Table S1). The average error between the predicted and observed values was 1.51%, ranging from 4.15% to 8.58%. The R2 value obtained was 0.88, indicating a good fit, and the Durbin–Watson p-value was 1.99, exceeding the significance threshold of 0.05. This result indicates the absence of statistically significant disparities between the observed and predicted values. The normal distribution of the results was verified, and an ANOVA was conducted. The results are graphically presented in Figure S2B using a Pareto diagram. The diagram reveals that both the percentage of ethanol in the solvent (p-value: 0.0098) and enzyme units (p-value: 0.0348) were influential variables in the extraction of phenolic compounds from mulberry samples. These findings are consistent with the results obtained for anthocyanins.
Both variables were found to have a positive influence, implying that higher values within the studied range led to a higher yield of total phenolic compounds. Consequently, the %EtOH was extended to 80%, and the same range of enzyme units was retained for the subsequent BBD-RSM optimization. In light of these findings, it can be deduced that the pH, %EtOH, and enzyme units are the influential variables in the extraction of anthocyanins and phenolic compounds using EAE. Therefore, these variables were selected for further optimization using BBD-RSM. The remaining variables’ values, temperature (set at 40 °C), ratio (0.15 g per 15 mL), and agitation (200 rpm), were prescribed based on the research group’s prior experience, as their influence was found to be minimal.

3.2. Box–Behnken Design

Subsequent to the preliminary screening analysis, the influential variables (%EtOH, U/g enzyme, and pH) identified in the previous design were selected for further optimization using the BBD-RSM. The specific values chosen for each factor are presented in Table S2. A total of 15 trials were randomly conducted according to this design. The resulting extracts from these 15 trials were analyzed using UHPLC-UV-Vis, and the content of total anthocyanins and phenolic compounds were quantified and expressed as milligrams per 100 g of the sample. The obtained data were then analyzed using the BBD-RSM design.

3.2.1. Optimization for Anthocyanins

For the anthocyanins, predicted concentrations were calculated based on the BBD-RSM design (Table S2), and these values were compared with the observed values, yielding an average error of 5.88% ranging from 1.65% to 12.70%. The developed model exhibited an R2 value of 0.77, indicating a reasonable fit, and the Durbin–Watson p-value was 1.51, below the significance threshold of 0.05. This suggests that there were no significant differences between the predicted and observed values. The normal distribution of the results was confirmed, and an ANOVA was performed, similar to in the previous analysis. In this particular instance, it was determined that only the ethanol concentration had a discernible impact (p-value: 0.0298) in the extraction of anthocyanins from mulberry. This variable exerted a positive influence, indicating that a higher %EtOH within the studied range resulted in a greater anthocyanins concentration.

3.2.2. Optimization for Phenolic Compounds

Similarly, the optimization process was conducted for phenolic compounds. The total concentration obtained from the BBD-RSM analysis was used to predict values and compare them with the observed values (Table S2). The average error between the predicted and observed values was 3.28%, ranging from 0.16% to 10.90%. The model achieved an R2 value of 0.81, indicating a good fit. Additionally, the Durbin–Watson p-value of 1.51 suggests that there are no statistically significant disparities between the anticipated and observed values. The influence of each variable on the extraction of phenolic compounds was examined. The normal distribution of the results was confirmed, and an ANOVA was performed. The analysis revealed that none of the variables studied had a significant influence, as all of them presented p-values greater than 0.05.
The ANOVA results obtained using BBD-RSM for both anthocyanins and phenolic compounds are summarized in Table S3.

3.3. Optimal Extraction Conditions

Following the examination of influential variables using the BBD-RSM design, the optimal extraction conditions for anthocyanins and phenolic compounds were determined. For the extraction of total anthocyanins, the optimal conditions involved dissolving 0.15 g of the sample in 15 mL of a solvent consisting of 80%EtOH at pH 4. Additionally, 38.46 U of enzyme per gram of sample was added, and the extraction was conducted at 40 °C with agitation at 200 rpm. Similarly, for phenolic compounds, the optimal conditions included dissolving 0.15 g of the sample in 15 mL of a solvent with 65.32%EtOH at pH 4. An enzyme concentration of 35.67 U per gram of sample was used, and the extraction was performed at 40 °C with stirring at 200 rpm. Both extractions were conducted for 20 min.
Upon comparing these optimal conditions, certain similarities were observed, prompting the exploration of a multi-parametric approach to develop a single enzymatic extraction method for various metabolites present in wild blackberries. The chosen optimal values for extraction encompassed 0.15 g of the sample dissolved in 15 mL of a solvent containing 80%EtOH at pH 4. Additionally, 38.46 U of enzyme per gram of sample was added, and the extraction was conducted at 40 °C with stirring at 200 rpm for 20 min. Notably, the pH value was situated at the lower boundary of the examined range due to the influential factors affecting the nature of phenolic compounds. The enzyme units employed were at the upper extreme of the studied range, although a further increase would entail higher costs without a significant influence on the extraction. Moreover, the optimal %EtOH was also found to be at the upper end of the studied range. However, since %EtOH was influential in anthocyanin extraction, an additional study was planned to explore solvents with increased %EtOH ranging from 70% to 100%.

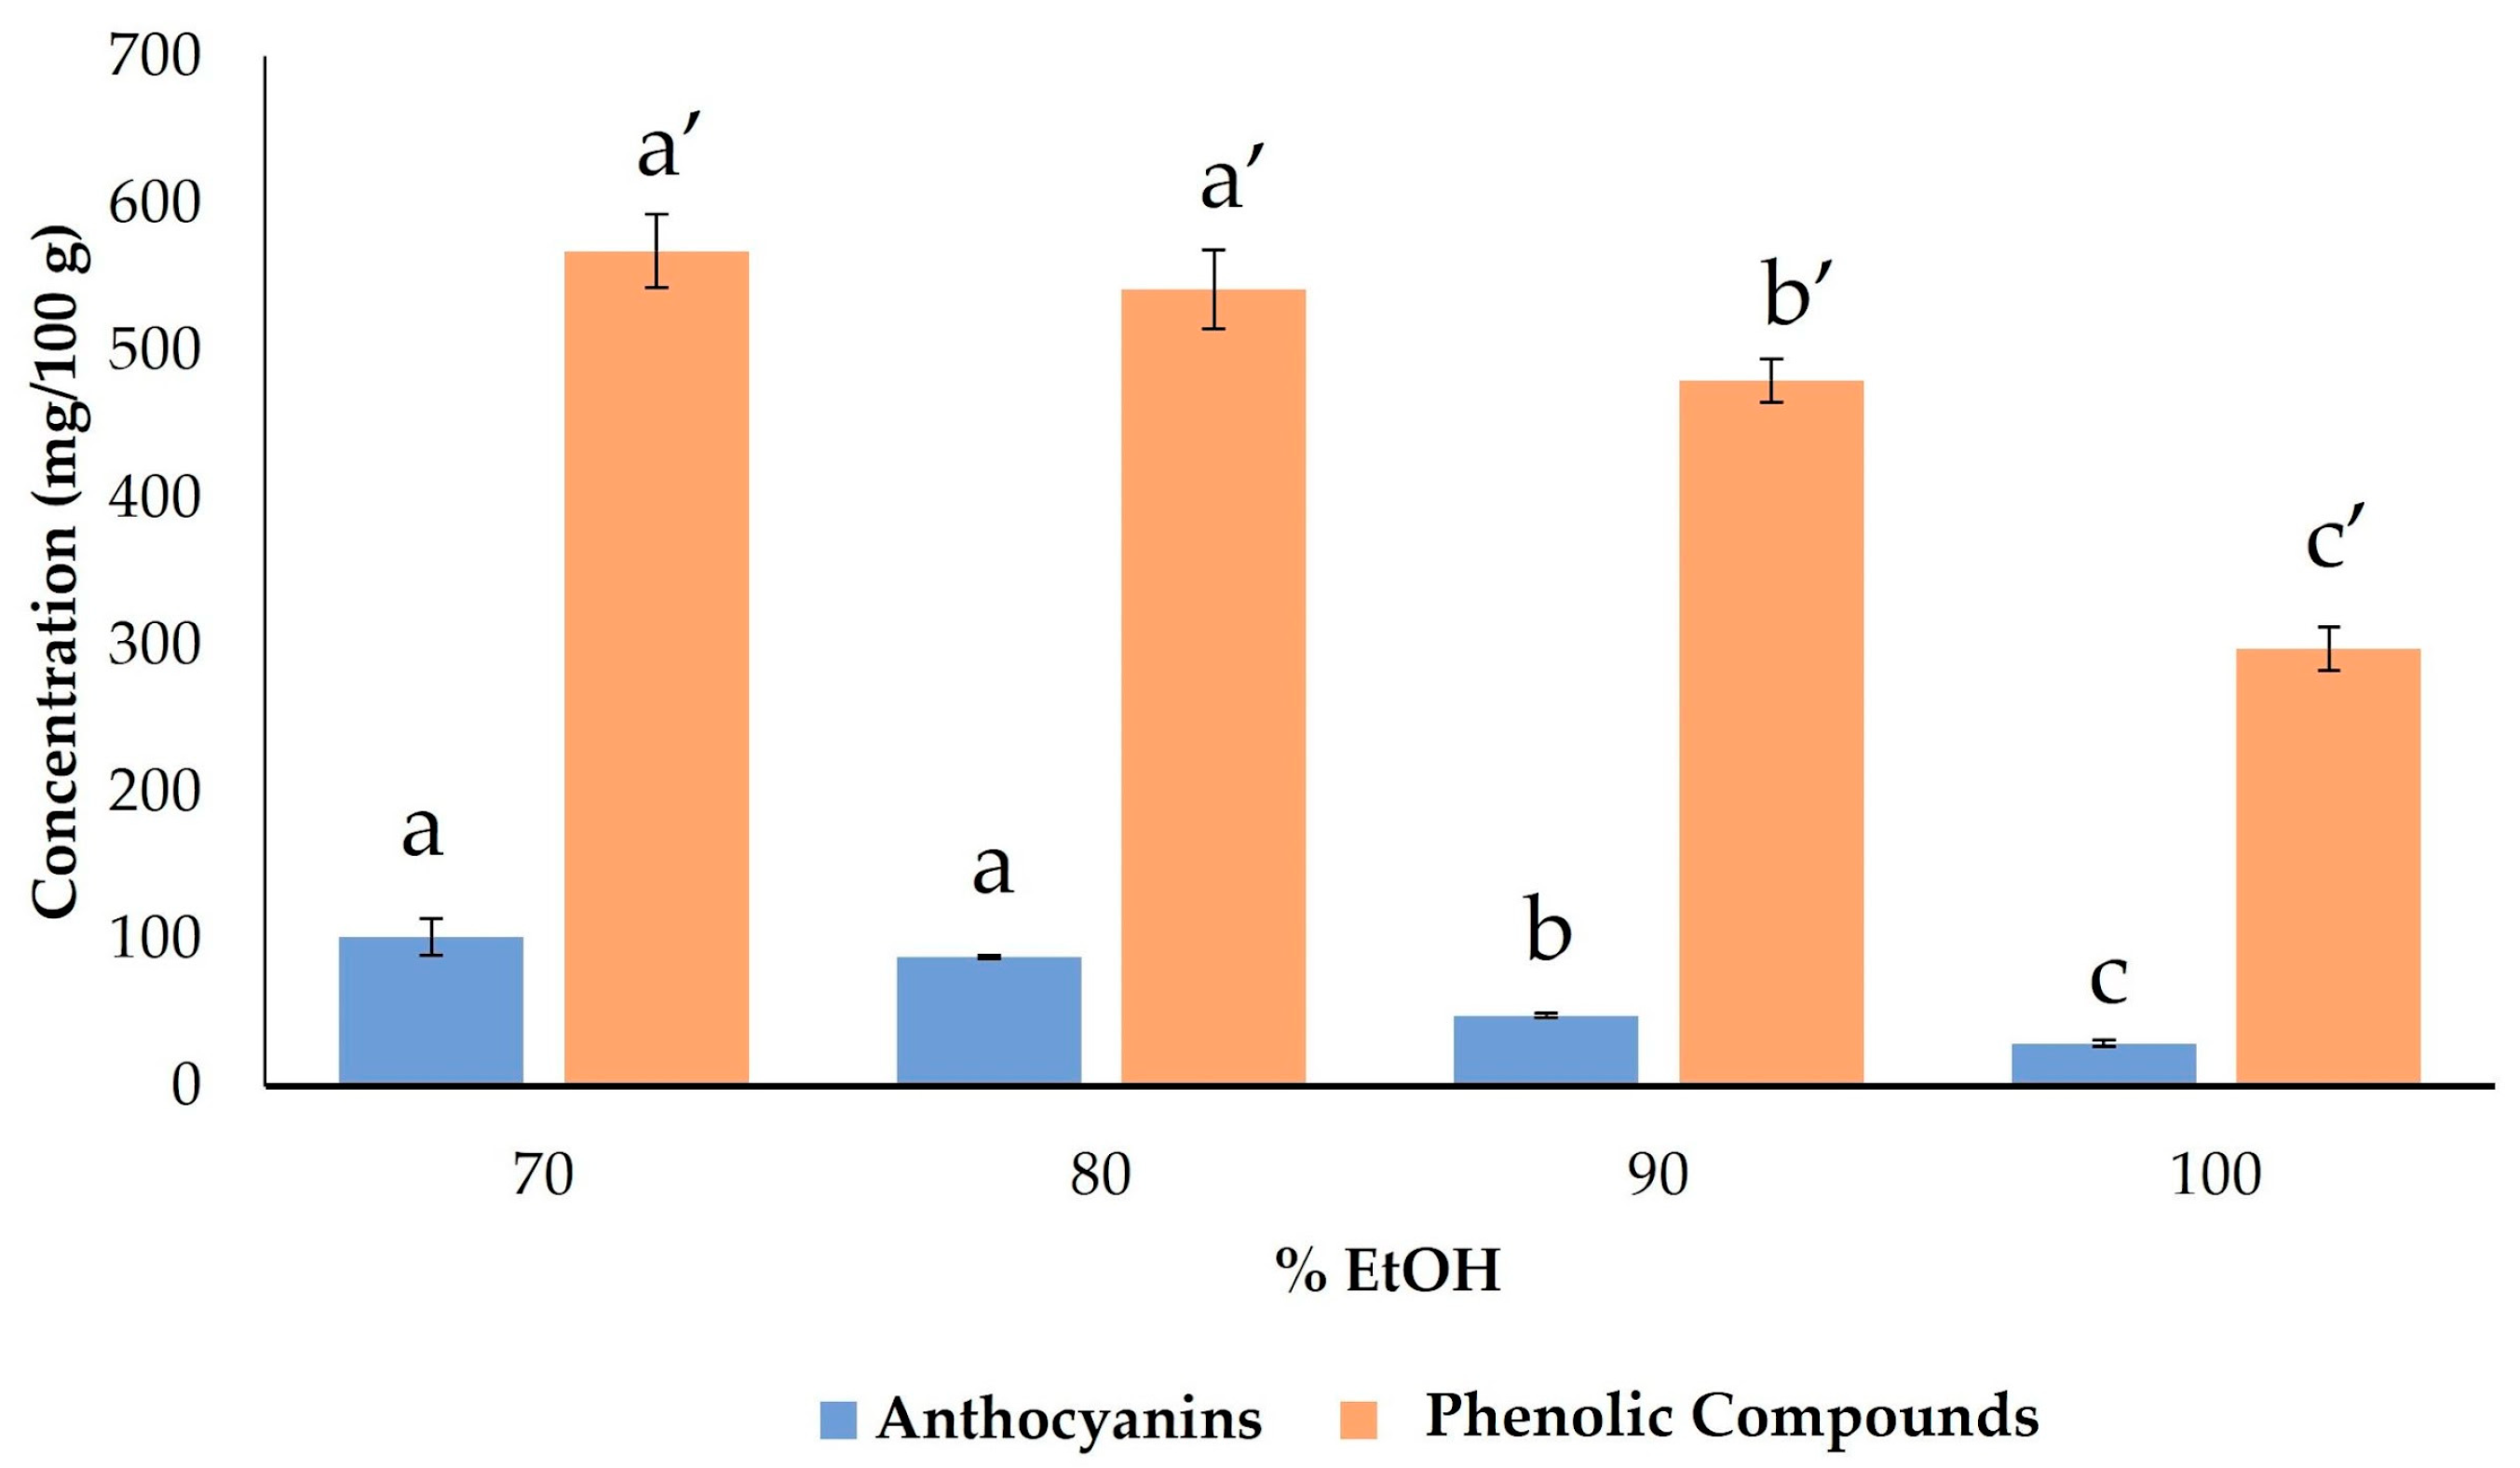
3.4. Ethanol Percentage Influence

To assess the impact of %EtOH in the solvent on the extraction of anthocyanins and phenolic compounds, a comprehensive evaluation was conducted. Under optimal conditions, the %EtOH was varied from 70% to 100%, and the analysis was performed in duplicate. The total concentrations of anthocyanins and phenolic compounds were calculated in milligrams per 100 g of sample and served as the response variables. The average total concentrations for both compounds were calculated and plotted against the %EtOH used in the solvent preparation (Figure 1).
The results revealed a progressive decrease in the total concentration of both anthocyanins and phenolic compounds as the %EtOH increased, with the maximum concentration achieved at 70%. An ANOVA was performed to ascertain the statistical significance of the observed differences dependent on the %EtOH used. Subsequently, a Duncan post hoc analysis was applied to compare the various %EtOH. The findings of the post hoc analysis indicated that there were no significant differences between using 70% or 80% EtOH. However, significant differences were observed when comparing these percentages with the rest of the range. As a result of these findings, it has been determined that utilizing 70% EtOH is the optimal concentration for the extraction process.
In conclusion, the optimal extraction conditions for anthocyanins and phenolic compounds from mulberries were determined to be as follows: 0.15 g of sample extracted with 15 mL of a solvent containing 70%EtOH and adjusted to pH 4. Additionally, 38.46 enzyme units were added, and the mixture was heated to 40 °C while stirring at 200 rpm. These identified optimal conditions are consistent with previous research on the extraction of phenolic compounds from analogous matrices. For instance, Aliaño-González et al. [34] optimized the extraction of polyphenols from blackcurrant using 0.1 g of sample, a 10%EtOH solvent at pH 4, and a temperature of 30 °C. Similarly, Alavarsa et al. [32] employed a 40%EtOH solvent at pH 4, 0.1 g of açai, 24 enzyme units per gram, and a temperature of 60 °C for polyphenol extraction from açai. Meini et al. [56] optimized the extraction of polyphenols from Syrah grape pomace using 180 enzyme units per gram, a temperature of 45 °C, and a pH 4 buffer. Likewise, Chamorro et al. [57] investigated the extraction of phenolic compounds from grape seed and grape pomace using a buffer at pH 5.50, a temperature of 35 °C, and 13.5 enzyme units.
These similarities in optimal conditions among different studies highlight the consistency and reproducibility of the extraction process using EAE for phenolic compounds from various plant sources.

3.5. Study of the Optimum Extraction Time

Following the establishment of optimal conditions for enzymatic extraction of polyphenols from mulberries, the study proceeded to investigate the optimal extraction duration. Enzymatic extractions were carried out in triplicate at various time intervals (5, 10, 15, 20, 30, and 60 min) under the established optimal conditions. Subsequently, the extracts underwent analysis via UHPLC-UV-Vis, and the cumulative concentrations of anthocyanins and phenolic compounds were calculated and are represented in Figure 2.
The obtained results were subjected to analysis employing a one-factor ANOVA, which revealed significant differences in the extraction time for both anthocyanins and phenolic compounds concentrations. Subsequently, a Duncan’s post hoc analysis was conducted to further examine these differences. For anthocyanins, no significant disparities were detected between the concentrations obtained at extraction times ranging from 5 to 30 min, but a lower concentration was obtained at 60 min. In the case of phenolic compounds, it was found that a 5 min extraction yielded a significantly higher total concentration compared to the other time intervals. In addition, there was a progressive decline in content as the extraction time was extended. This decrease in the overall concentration of both compounds with longer extraction times may be attributed to the documented degradation of phenolic compounds, particularly under prolonged or extreme extraction conditions, as documented in the previous literature [58].
As a result, it was concluded that a 5 min extraction time was optimal for the developed method. This finding carries significant advantages, as it allows for very short extraction times, thereby making the process more cost-effective and environmentally friendly by reducing energy consumption and minimizing the overall environmental impact.

3.6. Validation of the Extraction Method

3.6.1. Repeatability and Intermediate Precision Evaluation

After completing the kinetic study, the enzymatic extraction method was validated through a repeatability and intermediate precision study. Nine trials were conducted on three different days, totaling 27 experiments. The repeatability was assessed using the nine experiments performed on the same day, while the intermediate precision study used data collected on three different days (9 + 9 + 9). Under the optimal conditions for both anthocyanins and phenolic compounds, the total concentrations achieved were as follows: for repeatability, 119.63 ± 2.39 mg/100 g sample for anthocyanins and 494.61 ± 10.01 mg/100 g sample for phenolic compounds; for intermediate precision, 119.50 ± 3.24 mg/100 g sample for anthocyanins and 484.37 ± 21.48 mg/100 g sample for phenolic compounds. The coefficient of variation (C.V.) was used as a statistical measure for the validation study. The C.V. values achieved for repeatability were 1.99% for anthocyanins and 2.71% for phenolic compounds, while for intermediate precision, they were 2.02% for anthocyanins and 4.44% for phenolic compounds. These values were all below 5%, indicating that the developed method is reliable, repeatable, and exhibits good intermediate precision.

3.6.2. Enzyme-Assisted Extraction Evaluation

Subsequent to the development of the method, the next phase of this research involved ascertaining the influence of EAE on the extraction of anthocyanins and phenolic compounds in mulberry samples. To investigate this, three extractions were conducted under optimal conditions, omitting the introduction of enzymatic units into the mixture. The resultant concentrations of total anthocyanins and phenolic compounds were determined and compared with data derived from extractions carried out under optimal conditions with the inclusion of the enzyme.
The total anthocyanins concentration attained in the absence of enzyme utilization was measured at 109.65 ± 2.19 mg/100 g of the sample, while the corresponding concentration for phenolic compounds stood at 449.53 ± 9.10 mg/100 g of the sample. It is evident from these results that the omission of the enzyme led to a reduction of approximately 8.5% in the concentration of bioactive compounds extracted, thereby affirming the positive role played by the EAE in the recovery of these valuable compounds from mulberry samples.

3.7. Application to Real Samples

Subsequently, the established extraction method was employed for the analysis of real samples collected from diverse geographical locations (see Table 1). Each extraction procedure was conducted in triplicate, adhering to the optimal conditions previously determined. Individual anthocyanins and phenolic compounds were quantified using calibration curves, and the cumulative concentration for each compound category was computed by summing the individual compounds. The average of the three replicates was computed, and the outcomes are detailed in Table 2.
The results were analyzed using a one-factor ANOVA at the 95% confidence level. Regarding total anthocyanins, it can be observed that Morus nigra from Torrecera (Mn-T) exhibited the highest concentration of anthocyanins (2790.00 ± 21.40 mg/100 g), which was significantly different from the other varieties. This is consistent with the previous literature, as the dark color of blackberries indicates a higher concentration of polyphenols [59]. Morus rubra from Torrecera (Mr-T) and Morus rubra from Puerto Real, 1 (Mr-PR1) and 2 (Mr-PR2), showed similar concentrations, while the white varieties displayed lower concentrations. Among the white varieties, Morus alba with white fruit exhibited the lowest concentration (82.00 ± 4.00 mg/100 g) compared to the other blackberries. When considering individual compounds, cyanidin 3-O-glucoside was found to be the most abundant anthocyanin, while pelargonidin-3-O-glucoside had the lowest concentration in most cases, consistent with previously described anthocyanins in mulberries [60].
Once again, a one-factor ANOVA with a 95% confidence interval was conducted to examine whether there were significant differences in the concentrations of each phenolic compound, as well as the total amount, depending on the variety of mulberry. The analysis revealed significant differences in the total concentration of phenolic compounds among the varieties. The Morus rubra variety from Torrecera exhibited the highest concentration (12,110.00 ± 1956.00 mg/100 g), which was significantly different from the other samples. These findings align with results previously documented in the literature [42]. On the other hand, the variety selected for the optimization of the design showed the lowest concentration (3834.00 ± 396.00 mg/100 g) without significant differences compared to Morus alba with purple fruit, Morus rubra from Torrecera, and overripe Morus rubra from Puerto Real. Thus, it can be observed that the profile of phenolic compounds slightly differs from that of anthocyanins.
Regarding the individual compounds, chlorogenic acid, vanillic acid, and rutin were found to be more abundant in Morus alba with white fruit, Morus rubra from Torrecera, and Morus rubra from Puerto Real in their first sampling. On the other hand, resveratrol was more abundant in purple and black mulberries.

3.8. Antioxidant Activity

The enriched extracts derived from the real samples were subjected to assessment for their antioxidant potential. The analysis was carried out employing the DPPH method, as previously outlined, and the mean values of the replicates are compiled in Table 3. The outcomes substantiated the presence of phenolic compounds and antioxidant activity across all the mulberry samples examined. It was observed that the antioxidant capacity had a directly proportional relationship with the concentration of polyphenols. In other words, higher concentrations of polyphenols corresponded to higher antioxidant capacity in the extracts. This relationship was expected considering the well-known antioxidant properties of these bioactive compounds. Among the mulberries, Mn-T exhibited the highest antioxidant power with a value of 56.04 ± 4.60 trolox eq. On the other hand, Ma-B had a lower antioxidant capacity with a value of 9.7439 ± 0.44 trolox eq. These findings are consistent with what has been described in the literature regarding the antioxidant properties of different mulberry varieties. For instance, Ruíz-Rodríguez et al. [61] obtained an antioxidant capacity of 26.3 trolox equivalent for Morus nigra samples whereas Vukmirovic et al. [62] observed an antioxidant power of 10.49 trolox equivalent, data similar to the obtained for the Mn-PR sample. Krzykowski et al. [63] also evaluated the Morus alba antioxidant capacity using the ABTS method obtaining a EC50 of 12.82 mg/mL, also similar to the data obtained in the current research.
Overall, the results indicate that the developed method successfully extracted phenolic compounds with antioxidant capacity from the real mulberry samples.

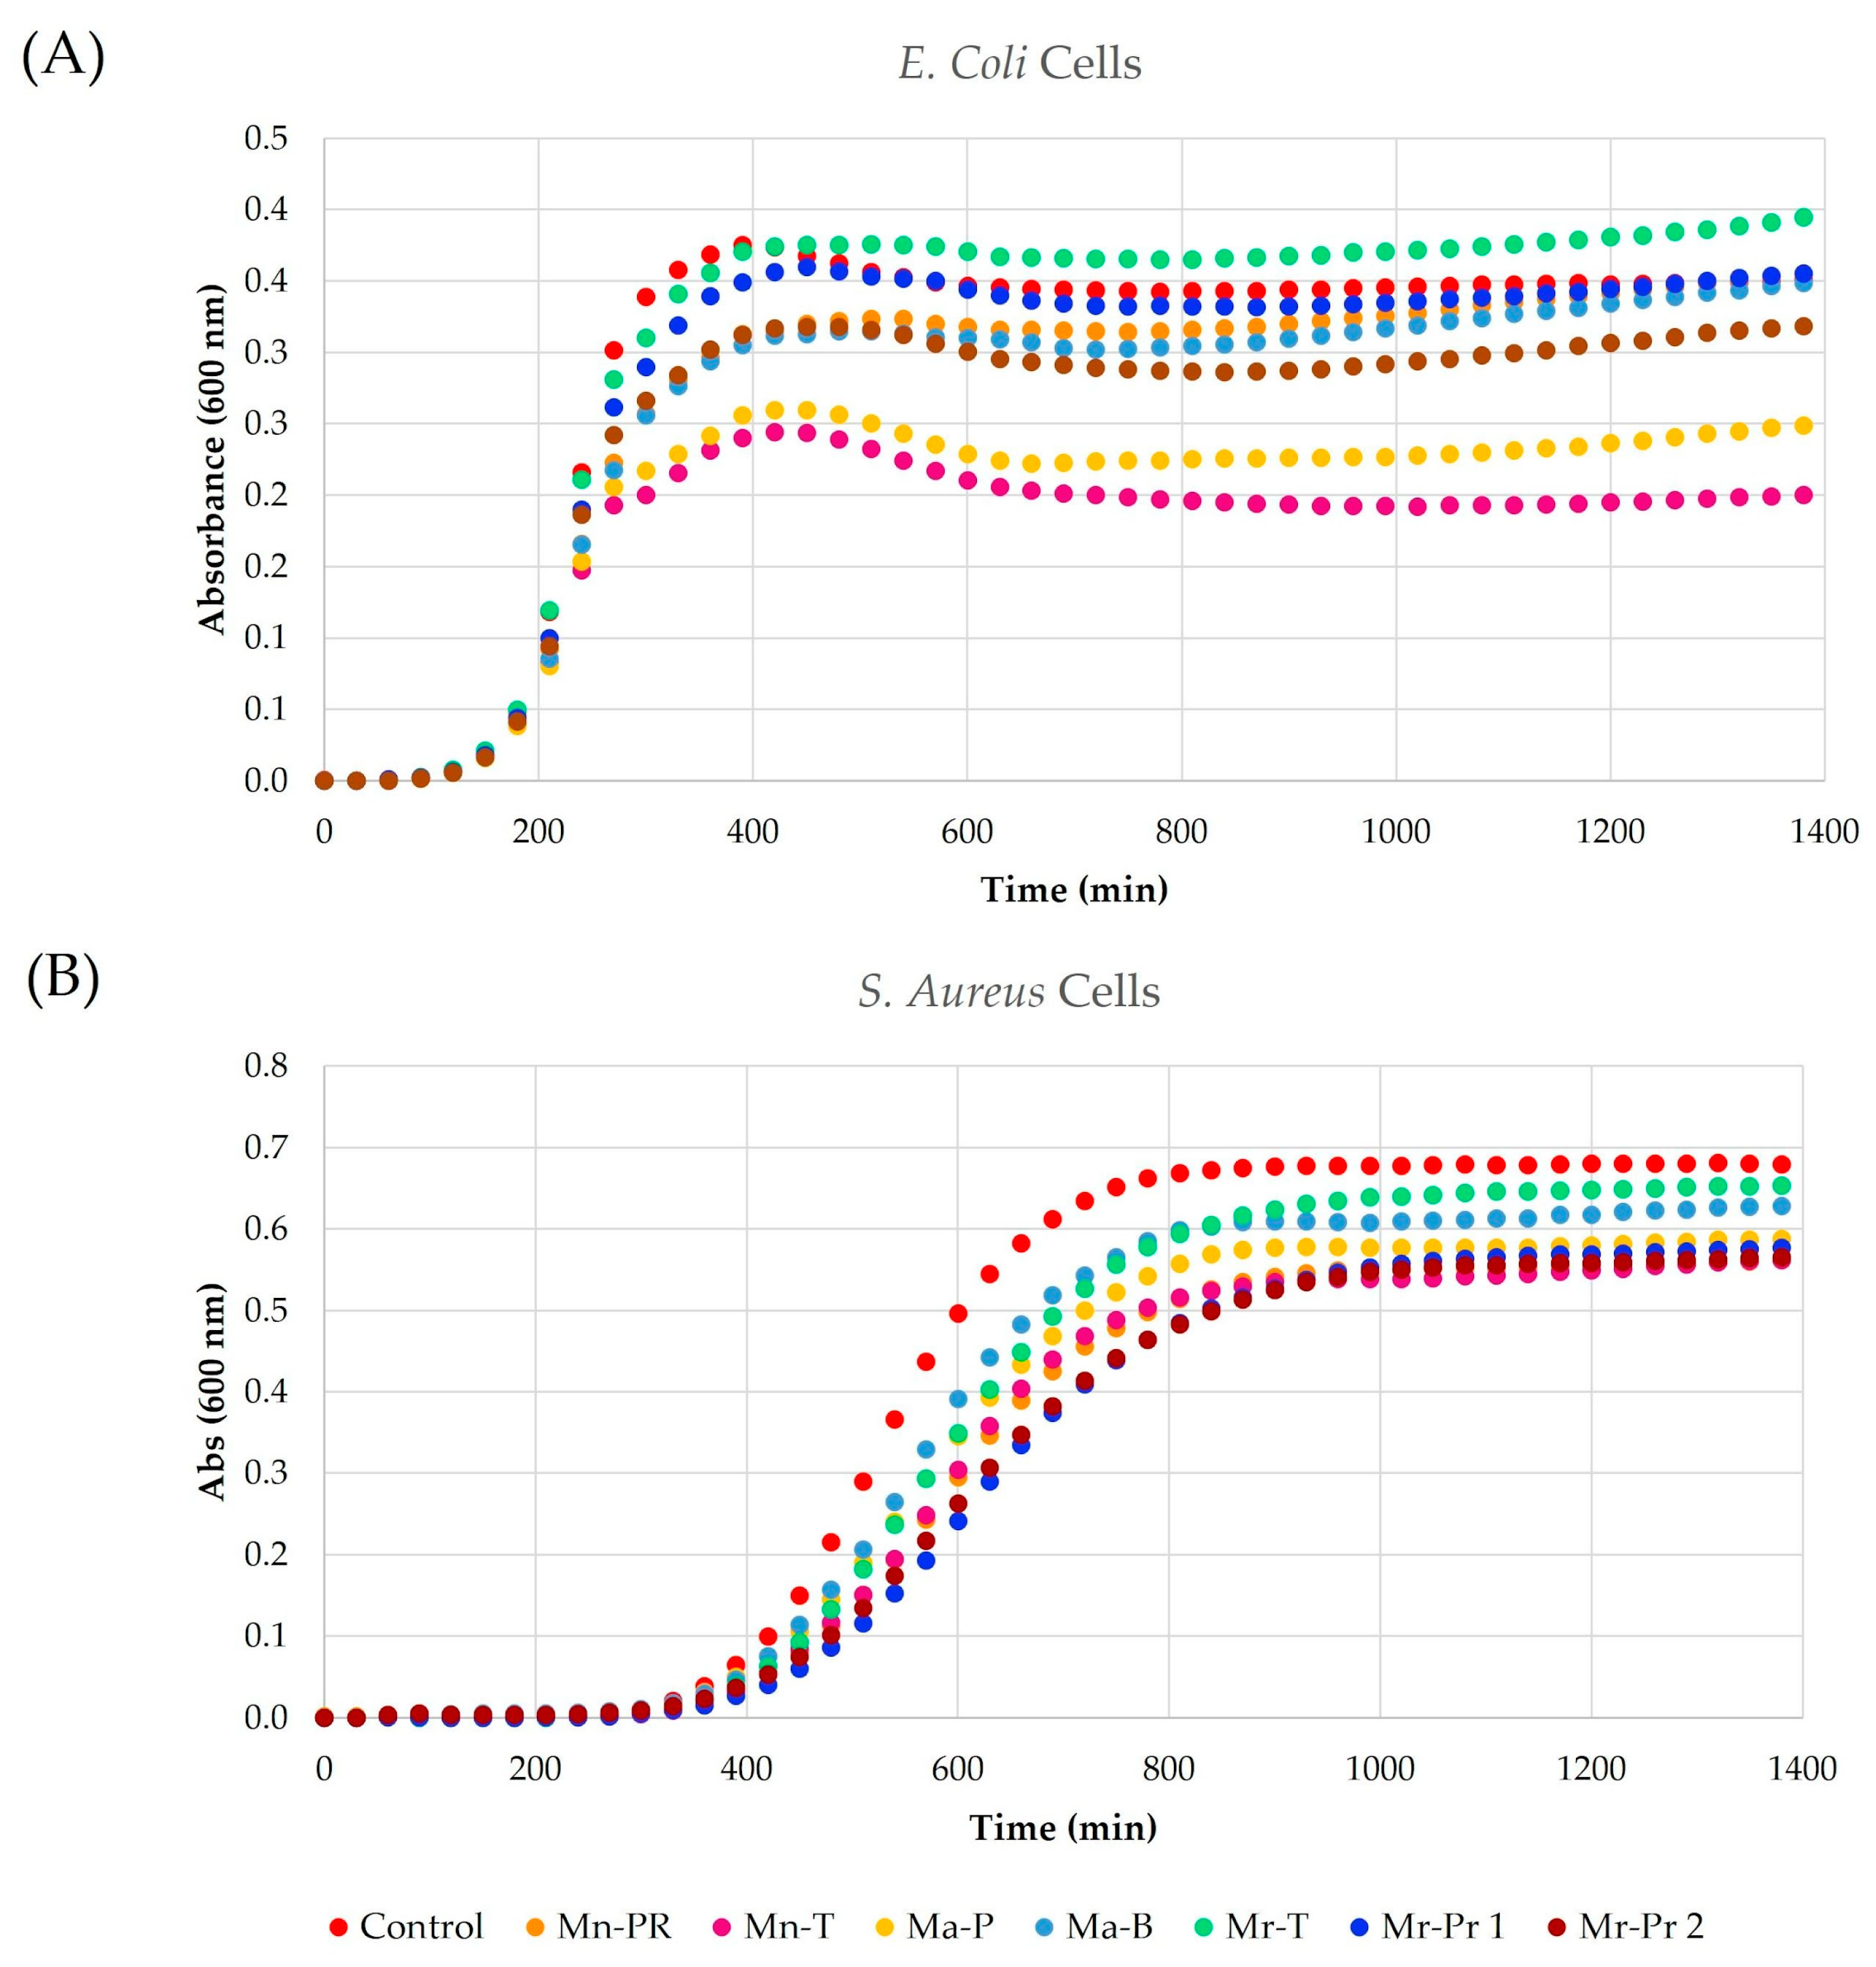
3.9. Antimicrobial Activity

In the final stage of the study, the antimicrobial activity of the mulberry extracts obtained using the optimal extraction conditions was evaluated. Both Gram-negative (E. coli) and Gram-positive (S. aureus) bacterial cultures were exposed to the extracts, and the average growth curves of the bacteria are graphically represented in Figure 3. The control culture displayed a typical sigmoidal growth profile.
The Mn-T and Mr-T samples exhibited the highest antimicrobial activity against E. coli (Gram-negative) with absorbance differences at 600 nm of 0.20 and 0.25, respectively. On the other hand, the Mn-PR and Mr-Pr2 samples displayed the highest activity against S. aureus (Gram-positive) with an increase in absorbance of 0.56 and 0.57, respectively. Notably, these samples also demonstrated the highest antioxidant activity, which aligns with the expected results. While previous studies have evaluated the antimicrobial activity of mulberry pulp [64,65,66], to the authors’ knowledge, this is the first investigation to assess the antimicrobial capacity of extracts from different mulberry varieties obtained using EAE. These findings highlight the remarkable antimicrobial properties of the extracted bioactive compounds. Overall, this study successfully demonstrated the antimicrobial activity of the mulberry extracts, further emphasizing the potential of these extracts as natural antimicrobial agents.

4. Conclusions

The present study successfully optimized an enzymatic extraction method to obtain phenolic compound-enriched extracts from mulberries. The effectiveness of this method was demonstrated across different mulberry varieties. The use of EAE offers several advantages, including low temperature and solvent consumption, cost-effectiveness, gentle extraction conditions, and rapid analysis times. These advantages make it a valuable technique for obtaining bioactive compound-rich extracts from mulberries.
Furthermore, this study investigated the variation in phenolic compound content among different mulberry varieties. This allows for the selection of specific varieties based on the desired bioactive compounds. The extracts obtained from the optimized method exhibited notable health benefits, particularly high antioxidant and antimicrobial activities. These findings are significant for the scientific community and society as a whole, opening up possibilities for diverse applications. The extracts may find application in fields such as medicine, pharmaceuticals, nutrition, and even in the development of antibacterial and antifungal treatments for crops.
Overall, this study’s findings contribute to the advancement of knowledge regarding mulberry extracts and their potential as sources of bioactive compounds. The optimized extraction method, along with the observed beneficial properties, holds promise for various practical applications with positive implications for multiple industries and areas of research.

Supplementary Materials

The following supporting information can be downloaded at: https://www.mdpi.com/article/10.3390/agronomy13102548/s1. Table S1. Experimental extraction conditions and total anthocyanins and phenolic compound values obtained and adjusted to the 12 Plackett–Burman tests with six variables. Table S2. Experimental extraction conditions and total anthocyanins and phenolic compound values obtained and adjusted to the BBD-RSM. Table S3. Values obtained from the ANOVA analysis of anthocyanins and phenolic compounds of mulberry by BBD-RSM. Figure S1. UV Chromatogram at 320 nm. In blue, a mixture of standards; in black, mulberry extract. 1. Chlorogenic acid, 2. Vanillic acid, 3. Rutin, and 4. Resveratrol. Figure S2. Pareto chart for (A) anthocyanins (mg/100 g) and (B) phenolic compounds (mg/100 g) according to the analysis for PB.

Author Contributions

Conceptualization, C.C. and M.J.A.-G.; methodology, C.C. and A.T.A.; software, M.J.A.-G.; formal analysis, A.T.A.; investigation and resources, C.C.; data curation, M.J.A.-G.; writing—original draft preparation, A.T.A.; writing—review and editing, M.J.A.-G. and C.C.; visualization, M.P. and G.F.B.; funding acquisition, M.P. and G.F.B. All authors have read and agreed to the published version of the manuscript.

Funding

This work has been supported by the project “EQC2018-005135-P” (Equipment for liquid chromatography by means of mass spectrometry and ion chromatography) of the State Subprogram of Research Infrastructures and Technical Scientific Equipment.

Data Availability Statement

Data available upon request.

Acknowledgments

The authors are grateful to the “Instituto de Investigación Vitivinícola y Agroalimentaria” (IVAGRO) for providing the necessary facilities to carry out the research. A special acknowledgment is extended to the Mass Spectrometry Division from the Central Research Services for Science and Technology (SC-ICYT) of the University of Cadiz for their collaboration throughout the analysis of the samples. María José Aliaño-González would like to thank the University of Cádiz for the grant in the modality “Margarita Salas” of the call for the Requalification of the Spanish University System for 2021–2023 (Resolution of the Rector of the University of Cadiz UCA/R155REC/2021, of 2 July), and financed by the Ministry of Universities of the Government of Spain through the European Recovery Instrument “Next Generation EU” of the European Union (Order UNI/551/2021, of 26 May).

Conflicts of Interest

The authors declare no conflict of interest.

References

  1. Tortora, C.; Pisano, L.; Vergine, V.; Ghirga, F.; Iazzetti, A.; Calcaterra, A.; Marković, V.; Botta, B.; Quaglio, D. Synthesis, Biosynthesis, and Biological Activity of Diels–Alder Adducts from Morus Genus: An Update. Molecules 2022, 27, 7580. [Google Scholar] [CrossRef]
  2. Liao, B.-Y.; Li, L.; Tanase, C.; Thakur, K.; Zhu, D.-Y.; Zhang, J.-G.; Wei, Z.-J. The Rheological Behavior of Polysaccharides from Mulberry Leaves (Morus alba L.). Agronomy 2020, 10, 1267. [Google Scholar] [CrossRef]
  3. Wang, R.-S.; Dong, P.-H.; Shuai, X.-X.; Chen, M.-S. Evaluation of Different Black Mulberry Fruits (Morus nigra L.) Based on Phenolic Compounds and Antioxidant Activity. Foods 2022, 11, 1252. [Google Scholar] [CrossRef] [PubMed]
  4. Yang, C.-X.; Liu, S.-Y.; Zerega, N.J.C.; Stull, G.W.; Gardner, E.M.; Tian, Q.; Gu, W.; Lu, Q.; Folk, R.A.; Kates, H.R.; et al. Phylogeny and Biogeography of Morus (Moraceae). Agronomy 2023, 13, 2021. [Google Scholar] [CrossRef]
  5. Singhal, B.; Khan, M.A.U.; Dhar, A.; Baqual, F.M.; Bindroo, B.B. Approaches to Industrial Exploitation of Mulberry (Mulberry Sp.) Fruits. J. Fruit Ornam. Plant Res. 2010, 18, 83–99. [Google Scholar]
  6. Sánchez-Salcedo, E.M.; Mena, P.; García-Viguera, C.; Hernández, F.; Martínez, J.J. (Poly)Phenolic Compounds and Antioxidant Activity of White (Morus alba) and Black (Morus nigra) Mulberry Leaves: Their Potential for New Products Rich in Phytochemicals. J. Funct. Foods 2015, 18, 1039–1046. [Google Scholar] [CrossRef]
  7. Wang, L.; Gao, H.; Sun, C.; Huang, L. Protective Application of Morus and Its Extracts in Animal Production. Animals 2022, 12, 3541. [Google Scholar] [CrossRef]
  8. Erden, Y. Sour Black Mulberry (Morus nigra L.) Causes Cell Death by Decreasing Mutant P53 Expression in HT-29 Human Colon Cancer Cells. Food Biosci. 2021, 42, 101113. [Google Scholar] [CrossRef]
  9. Negro, C.; Aprile, A.; De Bellis, L.; Miceli, A. Nutraceutical Properties of Mulberries Grown in Southern Italy (Apulia). Antioxidants 2019, 8, 223. [Google Scholar] [CrossRef]
  10. Zhang, H.; Ma, Z.F.; Luo, X.; Li, X. Effects of Mulberry Fruit (Morus alba L.) Consumption on Health Outcomes: A Mini-Review. Antioxidants 2018, 7, 69. [Google Scholar] [CrossRef]
  11. Li, H.; Xiao, C.; Wang, F.; Guo, X.; Zhou, Z.; Jiang, Y. Blueberry–Mulberry Extract Alleviates Cognitive Impairment, Regulates Gut Metabolites, and Inhibits Inflammation in Aged Mice. Foods 2023, 12, 860. [Google Scholar] [CrossRef] [PubMed]
  12. Memete, A.R.; Miere (Groza), F.; Laslo, V.; Purcarea, C.; Vicas, L.; Ganea, M.; Antonescu, A.; Vicas, S.I. An In Vitro Study of the Healing Potential of Black Mulberry (Morus nigra L.) Extract in a Liposomal Formulation. Appl. Sci. 2023, 13, 1041. [Google Scholar] [CrossRef]
  13. Jung, S.; Lee, M.-S.; Chang, E.; Kim, C.-T.; Kim, Y. Mulberry (Morus alba L.) Fruit Extract Ameliorates Inflammation via Regulating MicroRNA-21/132/143 Expression and Increases the Skeletal Muscle Mitochondrial Content and AMPK/SIRT Activities. Antioxidants 2021, 10, 1453. [Google Scholar] [CrossRef]
  14. Birt, D.F.; Hendrich, S.; Wang, W. Dietary Agents in Cancer Prevention: Flavonoids and Isoflavonoids. Pharmacol. Ther. 2001, 90, 157–177. [Google Scholar] [CrossRef] [PubMed]
  15. Kim, K.S.; Kim, R.; Son, S.-R.; Kang, K.S.; Jang, D.S.; Lee, S. Oddioside A, a New Phenolic Glycoside Isolated from the Fruits of Morus Alba (Mulberry), Protects TNF-α-Induced Human Dermal Fibroblast Damage. Antioxidants 2022, 11, 1894. [Google Scholar] [CrossRef] [PubMed]
  16. Naz, R.; Saqib, F.; Awadallah, S.; Wahid, M.; Latif, M.F.; Iqbal, I.; Mubarak, M.S. Food Polyphenols and Type II Diabetes Mellitus: Pharmacology and Mechanisms. Molecules 2023, 28, 3996. [Google Scholar] [CrossRef]
  17. Engelhart, M.J. Dietary Intake of Antioxidants and Risk of Alzheimer Disease. JAMA-J. Am. Med. Assoc. 2002, 287, 3223. [Google Scholar] [CrossRef]
  18. Chen, J.; Shu, Y.; Chen, Y.; Ge, Z.; Zhang, C.; Cao, J.; Li, X.; Wang, Y.; Sun, C. Evaluation of Antioxidant Capacity and Gut Microbiota Modulatory Effects of Different Kinds of Berries. Antioxidants 2022, 11, 1020. [Google Scholar] [CrossRef]
  19. Li, Z.; Liu, Y.; Xiang, J.; Wang, C.; Johnson, J.B.; Beta, T. Diverse Polyphenol Components Contribute to Antioxidant Activity and Hypoglycemic Potential of Mulberry Varieties. LWT 2023, 173, 114308. [Google Scholar] [CrossRef]
  20. Ozdal, T.; Kamiloglu, S. 1.02—Polyphenols, Bioavailability and Potency. In Comprehensive Gut Microbiota; Glibetic, M., Ed.; Elsevier: Oxford, UK, 2022; pp. 3–19. ISBN 978-0-12-822036-8. [Google Scholar]
  21. Chhoden, T.; Singh, A.; Aggarwal, P.; Sharma, S. Chapter 7—Anthocyanins and Its Health Benefits. In Functionality and Application of Colored Cereals; Punia Bangar, S., Kumar, M., Eds.; Academic Press: New York, NY, USA, 2023; pp. 161–184. ISBN 978-0-323-99733-1. [Google Scholar]
  22. Cassidy, A. Berry Anthocyanin Intake and Cardiovascular Health. Mol. Asp. Med. 2018, 61, 76–82. [Google Scholar] [CrossRef]
  23. Wu, Y.; Han, T.; Yang, H.; Lyu, L.; Li, W.; Wu, W. Known and Potential Health Benefits and Mechanisms of Blueberry Anthocyanins: A Review. Food Biosci. 2023, 55, 103050. [Google Scholar] [CrossRef]
  24. Shu, C.; Wu, S.; Li, H.; Tian, J. Health Benefits of Anthocyanin-Containing Foods, Beverages, and Supplements Have Unpredictable Relation to Gastrointestinal Microbiota: A Systematic Review and Meta-Analysis of Random Clinical Trials. Nutr. Res. 2023, 116, 48–59. [Google Scholar] [CrossRef] [PubMed]
  25. Escalante-Aburto, A.; Mendoza-Córdova, M.Y.; Mahady, G.B.; Luna-Vital, D.A.; Gutiérrez-Uribe, J.A.; Chuck-Hernández, C. Consumption of Dietary Anthocyanins and Their Association with a Reduction in Obesity Biomarkers and the Prevention of Obesity. Trends Food Sci. Technol. 2023, 140, 104140. [Google Scholar] [CrossRef]
  26. Huo, J.; Ni, Y.; Li, D.; Qiao, J.; Huang, D.; Sui, X.; Zhang, Y. Comprehensive Structural Analysis of Polyphenols and Their Enzymatic Inhibition Activities and Antioxidant Capacity of Black Mulberry (Morus nigra L.). Food Chem. 2023, 427, 136605. [Google Scholar] [CrossRef] [PubMed]
  27. Cui, Y.; Wang, S.; Wang, S.; Cao, S.; Wang, X.; Lü, X. Extraction Optimization and Characterization of Persimmon Peel Pectin Extracted by Subcritical Water. Food Chem. X 2022, 16, 100486. [Google Scholar] [CrossRef]
  28. Wang, P.-Y.; Shuang, F.-F.; Yang, J.-X.; Jv, Y.-X.; Hu, R.-Z.; Chen, T.; Yao, X.-H.; Zhao, W.-G.; Liu, L.; Zhang, D.-Y. A Rapid and Efficient Method of Microwave-Assisted Extraction and Hydrolysis and Automatic Amino Acid Analyzer Determination of 17 Amino Acids from Mulberry Leaves. Ind. Crop. Prod. 2022, 186, 115271. [Google Scholar] [CrossRef]
  29. Mustafa, A.M.; Mazzara, E.; Abouelenein, D.; Angeloni, S.; Nunez, S.; Sagratini, G.; López, V.; Cespi, M.; Vittori, S.; Caprioli, G.; et al. Optimization of Solvent-Free Microwave-Assisted Hydrodiffusion and Gravity Extraction of Morus nigra L. Fruits Maximizing Polyphenols, Sugar Content, and Biological Activities Using Central Composite Design. Pharmaceuticals 2022, 15, 99. [Google Scholar] [CrossRef]
  30. Akyüz, A.; Ersus, S. Optimization of Enzyme Assisted Extraction of Protein from the Sugar Beet (Beta vulgaris L.) Leaves for Alternative Plant Protein Concentrate Production. Food Chem. 2021, 335, 127673. [Google Scholar] [CrossRef]
  31. Abdullah, S.; Pradhan, R.C.; Pradhan, D.; Mishra, S. Modeling and Optimization of Pectinase-Assisted Low-Temperature Extraction of Cashew Apple Juice Using Artificial Neural Network Coupled with Genetic Algorithm. Food Chem. 2021, 339, 127862. [Google Scholar] [CrossRef]
  32. Alavarsa-Cascales, D.; Aliaño-González, M.J.; Palma, M.; Barbero, G.F.; Carrera, C. Optimization of an Enzyme-Assisted Extraction Method for the Anthocyanins Present in Açai (Euterpe oleracea Mart.). Agronomy 2022, 12, 2327. [Google Scholar] [CrossRef]
  33. Jung, S.; Moura, J.; Campbell, K.; Johnson, I. Enzyme-Assisted Aqueous Extraction of Oilseeds. In Enhancing Extraction Processes in the Food Industry; Lebovka, N., Vorobiev, E., Chemat, F., Eds.; CRC Press: Boca Raton, FL, USA, 2012; pp. 477–518. ISBN 978-0-429-10867-9. [Google Scholar]
  34. Aliaño González, M.J.; Carrera, C.; Barbero, G.F.; Palma, M. A Comparison Study between Ultrasound–Assisted and Enzyme–Assisted Extraction of Anthocyanins from Blackcurrant (Ribes nigrum L.). Food Chem. X 2022, 13, 100192. [Google Scholar] [CrossRef] [PubMed]
  35. Domínguez-Rodríguez, G.; Marina, M.L.; Plaza, M. Enzyme-Assisted Extraction of Bioactive Non-Extractable Polyphenols from Sweet Cherry (Prunus avium L.) Pomace. Food Chem. 2021, 339, 128086. [Google Scholar] [CrossRef] [PubMed]
  36. Bandara, S.; Devereaux, S.; Weerasooriya, A. Methods to Evaluate the Antiobesity Effects of Medicinal Plants Using Enzyme Assays. Obesities 2023, 3, 13–35. [Google Scholar] [CrossRef]
  37. Quitério, E.; Grosso, C.; Ferraz, R.; Delerue-Matos, C.; Soares, C. A Critical Comparison of the Advanced Extraction Techniques Applied to Obtain Health-Promoting Compounds from Seaweeds. Mar. Drugs 2022, 20, 677. [Google Scholar] [CrossRef] [PubMed]
  38. Chávez-González, M.L.; López-López, L.I.; Rodríguez-Herrera, R.; Contreras-Esquivel, J.C.; Aguilar, C.N. Enzyme-Assisted Extraction of Citrus Essential Oil. Chem. Pap. 2016, 70, 412–417. [Google Scholar] [CrossRef]
  39. Yilmaz, E. Use of Hydrolytic Enzymes as Green and Effective Extraction Agents for Ultrasound Assisted-Enzyme Based Hydrolytic Water Phase Microextraction of Arsenic in Food Samples. Talanta 2018, 189, 302–307. [Google Scholar] [CrossRef] [PubMed]
  40. Li, X.; Zhu, J.; Wang, T.; Sun, J.; Guo, T.; Zhang, L.; Yu, G.; Xia, X. Antidiabetic Activity of Armillaria Mellea Polysaccharides: Joint Ultrasonic and Enzyme Assisted Extraction. Ultrason. Sonochem. 2023, 95, 106370. [Google Scholar] [CrossRef]
  41. Kuhlman, B.; Hansen, J.; Jørgensen, B.; du Toit, W.; Moore, J.P. The Effect of Enzyme Treatment on Polyphenol and Cell Wall Polysaccharide Extraction from the Grape Berry and Subsequent Sensory Attributes in Cabernet Sauvignon Wines. Food Chem. 2022, 385, 132645. [Google Scholar] [CrossRef]
  42. Ercisli, S.; Orhan, E. Chemical Composition of White (Morus alba), Red (Morus rubra) and Black (Morus nigra) Mulberry Fruits. Food Chem. 2007, 103, 1380–1384. [Google Scholar] [CrossRef]
  43. Sánchez-Salcedo, E.M.; Sendra, E.; Carbonell-Barrachina, Á.A.; Martínez, J.J.; Hernández, F. Fatty Acids Composition of Spanish Black (Morus nigra L.) and White (Morus alba L.) Mulberries. Food Chem. 2016, 190, 566–571. [Google Scholar] [CrossRef]
  44. Li, X.; Chen, F.; Li, S.; Jia, J.; Gu, H.; Yang, L. An Efficient Homogenate-Microwave-Assisted Extraction of Flavonols and Anthocyanins from Blackcurrant Marc: Optimization Using Combination of Plackett-Burman Design and Box-Behnken Design. Ind. Crop. Prod. 2016, 94, 834–847. [Google Scholar] [CrossRef]
  45. Ayyubi, S.N.; Purbasari, A.; Kusmiyati. The Effect of Composition on Mechanical Properties of Biodegradable Plastic Based on Chitosan/Cassava Starch/PVA/Crude Glycerol: Optimization of the Composition Using Box Behnken Design. Mater. Today 2022, 63, S78–S83. [Google Scholar] [CrossRef]
  46. Dejaegher, B.; Heyden, Y.V. Experimental Designs and Their Recent Advances in Set-up, Data Interpretation, and Analytical Applications. J. Pharm. Biomed. Anal. 2011, 56, 141–158. [Google Scholar] [CrossRef]
  47. Khatib, I.; Chow, M.Y.T.; Ruan, J.; Cipolla, D.; Chan, H.-K. Modeling of a Spray Drying Method to Produce Ciprofloxacin Nanocrystals inside the Liposomes Utilizing a Response Surface Methodology: Box-Behnken Experimental Design. Int. J. Pharm. 2021, 597, 120277. [Google Scholar] [CrossRef] [PubMed]
  48. González-de-Peredo, A.V.; Vázquez-Espinosa, M.; Espada-Bellido, E.; Ferreiro-González, M.; Carrera, C.; Barbero, G.F.; Palma, M. Development of Optimized Ultrasound-Assisted Extraction Methods for the Recovery of Total Phenolic Compounds and Anthocyanins from Onion Bulbs. Antioxidants 2021, 10, 1755. [Google Scholar] [CrossRef] [PubMed]
  49. V. González de Peredo, A.; Vázquez-Espinosa, M.; Espada-Bellido, E.; Jiménez-Cantizano, A.; Ferreiro-González, M.; Amores-Arrocha, A.; Palma, M.; Barroso, C.G.; Barbero, G.F. Development of New Analytical Microwave-Assisted Extraction Methods for Bioactive Compounds from Myrtle (Myrtus communis L.). Molecules 2018, 23, 2992. [Google Scholar] [CrossRef]
  50. Aliaño-González, M.J.; Espada-Bellido, E.; Ferreiro-González, M.; Carrera, C.; Palma, M.; Ayuso, J.; Álvarez, J.Á.; Barbero, G.F. Extraction of Anthocyanins and Total Phenolic Compounds from Açai (Euterpe oleracea Mart.) Using an Experimental Design Methodology. Part 2: Ultrasound-Assisted Extraction. Agronomy 2020, 10, 326. [Google Scholar] [CrossRef]
  51. Farooq, A.; Hussain, S.Z.; Bhat, T.A.; Naseer, B.; Shafi, F. Walnut Fruit: Impact of Ethylene Assisted Hulling on in Vitro Antioxidant Activity, Polyphenols, PUFAs, Amino Acids and Sensory Attributes. Food Chem. 2023, 404, 134763. [Google Scholar] [CrossRef]
  52. Lopez-Romero, J.C.; González-Ríos, H.; Borges, A.; Simões, M. Antibacterial Effects and Mode of Action of Selected Essential Oils Components against Escherichia coli and Staphylococcus aureus. Evid. Based Complement Altern. Med. 2015, 2015, 795435. [Google Scholar] [CrossRef]
  53. Simões, M.; Rocha, S.; Coimbra, M.A.; Vieira, M.J. Enhancement of Escherichia coli and Staphylococcus aureus Antibiotic Susceptibility Using Sesquiterpenoids. Med. Chem. 2008, 4, 616–623. [Google Scholar] [CrossRef]
  54. Jiang, Y.; Ding, Y.; Wang, D.; Deng, Y.; Zhao, Y. Radio Frequency-Assisted Enzymatic Extraction of Anthocyanins from Akebia trifoliata (Thunb.) Koidz. Flowers: Process Optimization, Structure, and Bioactivity Determination. Ind. Crop. Prod. 2020, 149, 112327. [Google Scholar] [CrossRef]
  55. Kumar, M.; Dahuja, A.; Sachdev, A.; Tomar, M.; Lorenzo, J.M.; Dhumal, S.; Radha; Chandran, D.; Varghese, E.; Saha, S.; et al. Optimization of the Use of Cellulolytic Enzyme Preparation for the Extraction of Health Promoting Anthocyanins from Black Carrot Using Response Surface Methodology. LWT 2022, 163, 113528. [Google Scholar] [CrossRef]
  56. Meini, M.-R.; Cabezudo, I.; Boschetti, C.E.; Romanini, D. Recovery of Phenolic Antioxidants from Syrah Grape Pomace through the Optimization of an Enzymatic Extraction Process. Food Chem. 2019, 283, 257–264. [Google Scholar] [CrossRef] [PubMed]
  57. Chamorro, S.; Viveros, A.; Alvarez, I.; Vega, E.; Brenes, A. Changes in Polyphenol and Polysaccharide Content of Grape Seed Extract and Grape Pomace after Enzymatic Treatment. Food Chem. 2012, 133, 308–314. [Google Scholar] [CrossRef] [PubMed]
  58. Verbeyst, L.; Oey, I.; Van der Plancken, I.; Hendrickx, M.; Van Loey, A. Kinetic Study on the Thermal and Pressure Degradation of Anthocyanins in Strawberries. Food Chem. 2010, 123, 269–274. [Google Scholar] [CrossRef]
  59. Özgen, M.; Serçe, S.; Kaya, C. Phytochemical and Antioxidant Properties of Anthocyanin-Rich Morus nigra and Morus rubra Fruits. Sci. Hortic. 2009, 119, 275–279. [Google Scholar] [CrossRef]
  60. Espada-Bellido, E.; Ferreiro-González, M.; Carrera, C.; Palma, M.; Barroso, C.G.; Barbero, G.F. Optimization of the Ultrasound-Assisted Extraction of Anthocyanins and Total Phenolic Compounds in Mulberry (Morus nigra) Pulp. Food Chem. 2017, 219, 23–32. [Google Scholar] [CrossRef]
  61. Ruiz-Rodríguez, B.M.; Sánchez-Moreno, C.; Ancos, B.D.; Sánchez-Mata, M.d.C.; Fernández-Ruiz, V.; Cámara, M.; Tardío, J. Wild Arbutus Unedo L. and Rubus Ulmifolius Schott Fruits Are Underutilized Sources of Valuable Bioactive Compounds with Antioxidant Capacity. Fruits 2014, 69, 435–448. [Google Scholar] [CrossRef]
  62. Vukmirović, S.; Ilić, V.; Tadić, V.; Čapo, I.; Pavlović, N.; Tomas, A.; Paut Kusturica, M.; Tomić, N.; Maksimović, S.; Stilinović, N. Comprehensive Analysis of Antioxidant and Hepatoprotective Properties of Morus nigra L. Antioxidants 2023, 12, 382. [Google Scholar] [CrossRef]
  63. Krzykowski, A.; Dziki, D.; Rudy, S.; Polak, R.; Biernacka, B.; Gawlik-Dziki, U.; Janiszewska-Turak, E. Effect of Air-Drying and Freeze-Drying Temperature on the Process Kinetics and Physicochemical Characteristics of White Mulberry Fruits (Morus alba L.). Processes 2023, 11, 750. [Google Scholar] [CrossRef]
  64. Du, H.; Wang, X.; Yang, H.; Zhu, F.; Liu, J.; Cheng, J.; Lin, Y.; Tang, D.; Liu, X. Regulation on the Quality of Yogurt by Phenolic Fraction of Mulberry Pomace Supplemented before and after Fermentation. Food Control 2023, 144, 109333. [Google Scholar] [CrossRef]
  65. Herman, R.A.; Ayepa, E.; Fometu, S.S.; Shittu, S.; Davids, J.S.; Wang, J. Mulberry Fruit Post-Harvest Management: Techniques, Composition and Influence on Quality Traits—A Review. Food Control 2022, 140, 109126. [Google Scholar] [CrossRef]
  66. Sharifi, K.A.; Pirsa, S. Biodegradable Film of Black Mulberry Pulp Pectin/Chlorophyll of Black Mulberry Leaf Encapsulated with Carboxymethylcellulose/Silica Nanoparticles: Investigation of Physicochemical and Antimicrobial Properties. Mater. Chem. Phys. 2021, 267, 124580. [Google Scholar] [CrossRef]
Figure 1. Effect of %EtOH on EAE for anthocyanins (mg/100 g sample) and phenolic compounds (mg/100 g sample). Different letters indicate a significant difference at 95% confidence.
Agronomy 13 02548 g001
Figure 2. Effect of extraction time for the EAE of anthocyanins (mg/100 g sample) and flavonoids (mg/100 g sample) from mulberry (n = 3). Different letters indicate significant differences at 95% confidence.
Agronomy 13 02548 g002
Figure 3. Antimicrobial activity of extracts from mulberries obtained under optimal extraction conditions (A) for E. coli cells (gram negative) and (BS. aureus cells (gram positive).It was observed that extracts from all the mulberry varieties exhibited antimicrobial activity, as the bacterial growth was lower than that of the control after 24 h. However, in the case of E. coli, the Mr-T and Mr-Pr1 varieties showed similar values to the control, indicating relatively weaker antimicrobial activity against this Gram-negative bacterium. To assess the individual impact on each strain, the difference in absorbance between the initial point and 24 h was calculated. Smaller differences indicated higher antimicrobial activity. The results for both bacteria are presented in Table 3.
Agronomy 13 02548 g003
Table 1. Mulberry samples used for the validation of the developed enzyme-assisted extraction method.
VarietyLocationSampling DateCode
Morus nigraPuerto Real, Cádiz (Spain)6 January 2021Mn-PR
Morus nigraTorrecera, Cádiz (Spain)7 June 2022Mn-T
Purple Morus albaTorrecera, Cádiz (Spain)7 June 2022Ma-P
White Morus albaTorrecera, Cádiz (Spain)7 June 2022Ma-B
Morus rubraTorrecera, Cádiz (Spain)1 September 2022Mr-T
Morus rubraPuerto Real, Cádiz (Spain)1 September 2022Mr-Pr 1
Morus rubraPuerto Real, Cádiz (Spain)11 September 2022Mr-Pr 2
Table 2. Concentrations of the different individual and total anthocyanins and phenolic compounds (mg/100 g sample) in the different mulberry samples. Different letters indicate a significant difference at 95% confidence.
SampleAnthocyanins (mg/100 g)
Cyanidin
3-O-glucoside
Cyanidin
3-O-rutinoside
Pelargonidin
3-O-glucoside
Pelargonidin 3-O-rutinosideTotal
Mn-PR 144.00 ± 22.00 a13.00 ± 0.41 a5.00 ± 1.00 a18.00 ± 3.00 a181.00 ± 26.00 a
Ma-B 60.00 ± 4.00 a12.00 ± 0.28 a1.00 ± 0.12 a8.00 ± 0.11 a82.00 ± 4.00 a
Ma-P166.00 ± 10.00 a17.00 ± 2.00 a3.00 ± 0.44 a18.00 ± 1.00 a204.00 ± 7.00 a
Mn-T2530.00 ± 192.00 d123.00 ± 11.00 c83.00 ± 7.00 d56.00 ± 5.00 d2790.00 ± 214.00 d
Mr-T1434.00 ± 118.00 c113.00 ± 10.00 c59.00 ± 4.00 c54.00 ± 4.00 cd1660.00 ± 135.00 c
Mr-Pr 11045.00 ± 84.00 b78.00 ± 5.00 b39.00 ± 3.00 b40.00 ± 10.00 b1202.00 ± 101.00 b
Mr-Pr 21113.00 ± 13.00 b95.00 ± 1.00 b60.00 ± 0.46 c42.00 ± 1.00 bc1310.00 ± 14.00 b
p-value7.57 × 10−141.11 × 10−123.98 × 10−141.45 × 10−81.08 × 10−13
SamplePhenolic Compounds (mg/100 g)
Chlorogenic AcidVanillic AcidRutinResveratrolTotal
Mn-PR 678.00 ± 65.00 ab505.00 ± 55.00 a594.00 ± 75.00 ab2057.00 ± 85.00 ab3834.00 ± 396.00 a
Ma-B 1357.00 ± 72.00 c2805.00 ± 83.00 b1825.00 ± 671.00 ab1997.00 ± 24.00 ab7984.00 ± 1202.00 b
Ma-P428.00 ± 40.00 a990.00 ± 94.00 ab504.00 ± 45.00 a2125.00 ± 108.00 ab4047.00 ± 406.00 a
Mn-T576.00 ± 37.00 ab2265.00 ± 79.00 ab830.00 ± 70.00 ab2392.00 ± 50.00 c6063.00 ± 334.00 ab
Mr-T1204.00 ± 94.00 c6682.00 ± 924.00 c2198.00 ± 314.00 c2026.00 ± 51.00 ab12110.00 ± 1956.00 c
Mr-Pr 1841.00 ± 45.00 b5209.00 ± 449.00 c1706.00 ± 116.00 ab1969.00 ± 12.00 ab9725.00 ± 880.00 bc
Mr-Pr 2560.00 ± 32.00 ab2873.00 ± 269.00 b892.00 ± 21.00 ab1864.00 ± 138.00 a6189.00 ± 651.00 ab
p-value0.0000680.0001230.0205160.0359330.000574
Table 3. Antioxidant capacity of mulberry samples expressed as trolox equivalents and antimicrobial activity of extract calculated as difference in absorbance at 600 nm at 24 h and 0 h for Gram-negative (E. coli) and Gram-positive (S. aureus) bacteria.
SamplesTrolox EquivalentDiff. Abs
E. coli
Diff. Abs
S. aureus
Mn-PR 25.51 ± 1.040.360.56
Ma-B 9.74 ± 0.440.350.63
Ma-P13.12 ± 0.720.400.66
Mn-T56.04 ± 4.600.200.57
Mr-T29.53 ± 2.520.250.59
Mr-Pr 121.80 ± 3.470.360.58
Mr-Pr 228.46 ± 2.070.320.57
Control (bacteria)-0.350.68
Disclaimer/Publisher’s Note: The statements, opinions and data contained in all publications are solely those of the individual author(s) and contributor(s) and not of MDPI and/or the editor(s). MDPI and/or the editor(s) disclaim responsibility for any injury to people or property resulting from any ideas, methods, instructions or products referred to in the content.

