Article

Genome-Wide Identification of the Phytocyanin Gene Family and Its Potential Function in Salt Stress in Soybean (Glycine max (L.) Merr.)

1
Henan Collaborative Innovation Center of Modern Biological Breeding, College of Agronomy, Henan Institute of Science and Technology, Xinxiang 453003, China
2
Collaborative Innovation Center of Henan Grain Crops, College of Agronomy, Henan Agricultural University, Zhengzhou 450046, China
*
Author to whom correspondence should be addressed.
These authors contributed equally to this work.
Agronomy 2023, 13(10), 2484; https://doi.org/10.3390/agronomy13102484
Submission received: 1 September 2023 / Revised: 17 September 2023 / Accepted: 25 September 2023 / Published: 27 September 2023
(This article belongs to the Special Issue Functional Genomics and Molecular Breeding of Soybeans)

Abstract

:
Phytocyanins (PCs), plant-specific blue copper proteins, are crucial for various biological processes during plant development. However, a comprehensive characterization of the soybean PC gene family (GmPC) is lacking. In this study, we performed genome-wide screening of soybean PC genes, and 90 PC genes were identified in the soybean genome. Further analysis revealed that the GmPC family was categorized into four subfamilies (stellacyanins, GmSCs; uclacyanins, GmUCs; plantacyanins, GmPLCs; and early nodulin-like proteins, GmENODLs). In-depth analysis revealed that each specific GmPC subfamily exhibited similar characteristics, with segmental duplications playing a major role in expanding the members of GmPC. Additionally, synteny and evolutionary constraint analyses suggested that GmPCs have undergone strong selective pressure for purification during the evolution of soybeans. The promoter cis-regulatory elements analysis of GmPCs suggested that GmPCs might play a crucial role in various stress responses. The expression patterns of GmPCs exhibited tissue-specific variations. Moreover, 23 of the GmPCs may be involved in soybean’s response to salt stress. In all, our study presents a systematic overview of GmPC, which not only provides a valuable foundation for further functional investigations of GmPCs, but also offers new insights into the mechanism of soybean salt tolerance.

1. Introduction

In plants, phytocyanins (PCs), as members of blue copper-binding proteins (BCPs), perform biological functions by binding to single type I copper atoms in the form of electron transfer protein [1,2]. The PC family consists of four subfamilies, plantacyanins (PLCs), stellacyanins (SCs), early nodulin-like proteins (ENODLs), and uclacyanins (UCs), each comprising a varying number of members [3,4]. Among them, SCs, PLCs, and UCs possess four conserved copper-binding sites, all of which have two His and one Cys. The difference is that SCs have one Gln, while PLCs and UCs have one Met, and ENODLs lack key copper-binding residues [4]. However, all PCs contain one necessary plastocyanin-like domain (PLCD).
PCs play a major role in different stages of plant development. In Arabidopsis thaliana, overexpression of AtPLC inhibited pollen germination, disrupted pollen tube-directed growth, and decreased the rate of seed setting [5]. Similarly, OsUCL8 and OsUCL23 in rice have been shown to play significant regulatory roles during pollen development [6,7]. Knockout of two UC gene members (UCC1 and UCC2) in Arabidopsis thaliana reduce lignification, particularly in the central casparian strip nanodomain, and this reduction led to increased endodermal permeability and a disruption of mineral nutrient homeostasis [8]. Studies in Medicago truncatula and Vicia sativa have shown that specific members of the ENODL subfamily, which exhibit high expression in nodules, play a crucial role in the process of nodulation [9,10]. Furthermore, PCs are also involved in plant response to stress. Overexpression of AtUC5, AtUC6, and AtSC3 conferred protection to plants against oxidative stress factors [11]. The heterologous overexpression of the cotton PC gene (GhENODL6) in Arabidopsis thaliana significantly increased the expression levels of salicylic acid (SA)-related genes and pathogenicity-related genes, resulting in increased hydrogen peroxide and SA content [12]. Consequently, this led to enhanced resistance against verticillium wilt. In Boea crassifolia, the expression level of BcBCP1 was significantly upregulated under strong induction conditions of abscisic acid (ABA), drought, and salt stresses; for example, transgenic tobacco plants with overexpression of BcBCP1 exhibited enhanced tolerance to osmotic stress and increased photosynthetic rate [13]. The transcriptional level of some maize PC genes, such as ZmUC19, ZmSC2, ZmENODL10, and ZmENODL13, was found to be induced by both salt stress and drought stress [14].
The whole-genome data of multiple species have now been successively reported, primarily attributed to the rapid development and application of DNA sequencing technology [15,16,17]. The PC gene family has been identified at the whole-genome level in several species; for instance, Arabidopsis thaliana [3], Oryza sativa [18], Populus trichocarpa [19], Zea mays [14], Medicago truncatula [20], and cotton [21]. In contrast, there is a paucity of comprehensive reports on the PC gene family in Glycine max (L.) Merr. (soybean). As a crucial economic and oil crop, soybean plays an important role in human life [22,23]. However, it is susceptible to various abiotic stresses throughout its growth and development process, which significantly impacts soybean yield [24,25,26,27]. Therefore, a systematic identification and analysis of the PC gene family is imperative to fully understand and explore the biological functions of PC gene members in soybean.
In this study, genome-wide identification, bioinformatics analysis, and expression analysis of the soybean PC gene family (GmPC) were conducted to comprehend the composition, classification, and expression characteristics of GmPC members. Then, we investigated the changes in the expression levels of GmPC members under high salt concentration treatment. Our findings could offer a basis for further elucidating the biological roles of GmPC in plant responses to salt stress.

2. Materials and Methods

2.1. Authentication of Candidate GmPC Genes in Soybean

To understand the PC proteins of soybean, the hidden Markov model of the plastocyanin-like (PF02298) domain was obtained by searching the Pfam database (https://www.ebi.ac.uk/interpro/entry/pfam/, accessed on 24 September 2023) [28]. Then, the hmmSearch tool was used to screen soybean PC proteins with the plastocyanin-like domain [29]. The sequences of GmPC genes were compared with PC genes in Arabidopsis thaliana, rice, maize, and Medicago truncatula through multiple sequence alignment. The comparisons were combined with confirmatory gene annotation to further identify members of the GmPC family. The physical and chemical properties of PC proteins were predicted and calculated via the ExPASY website (https://web.expasy.org/protparam/, accessed on 24 September 2023) [30]. The subcellular localization information was predicted using the online tool Cell-PLoc 2.0 (http://csbio.sjtu.edu.cn/bioinf/Cell-PLoc-2/, accessed on 24 September 2023) online tool [31].

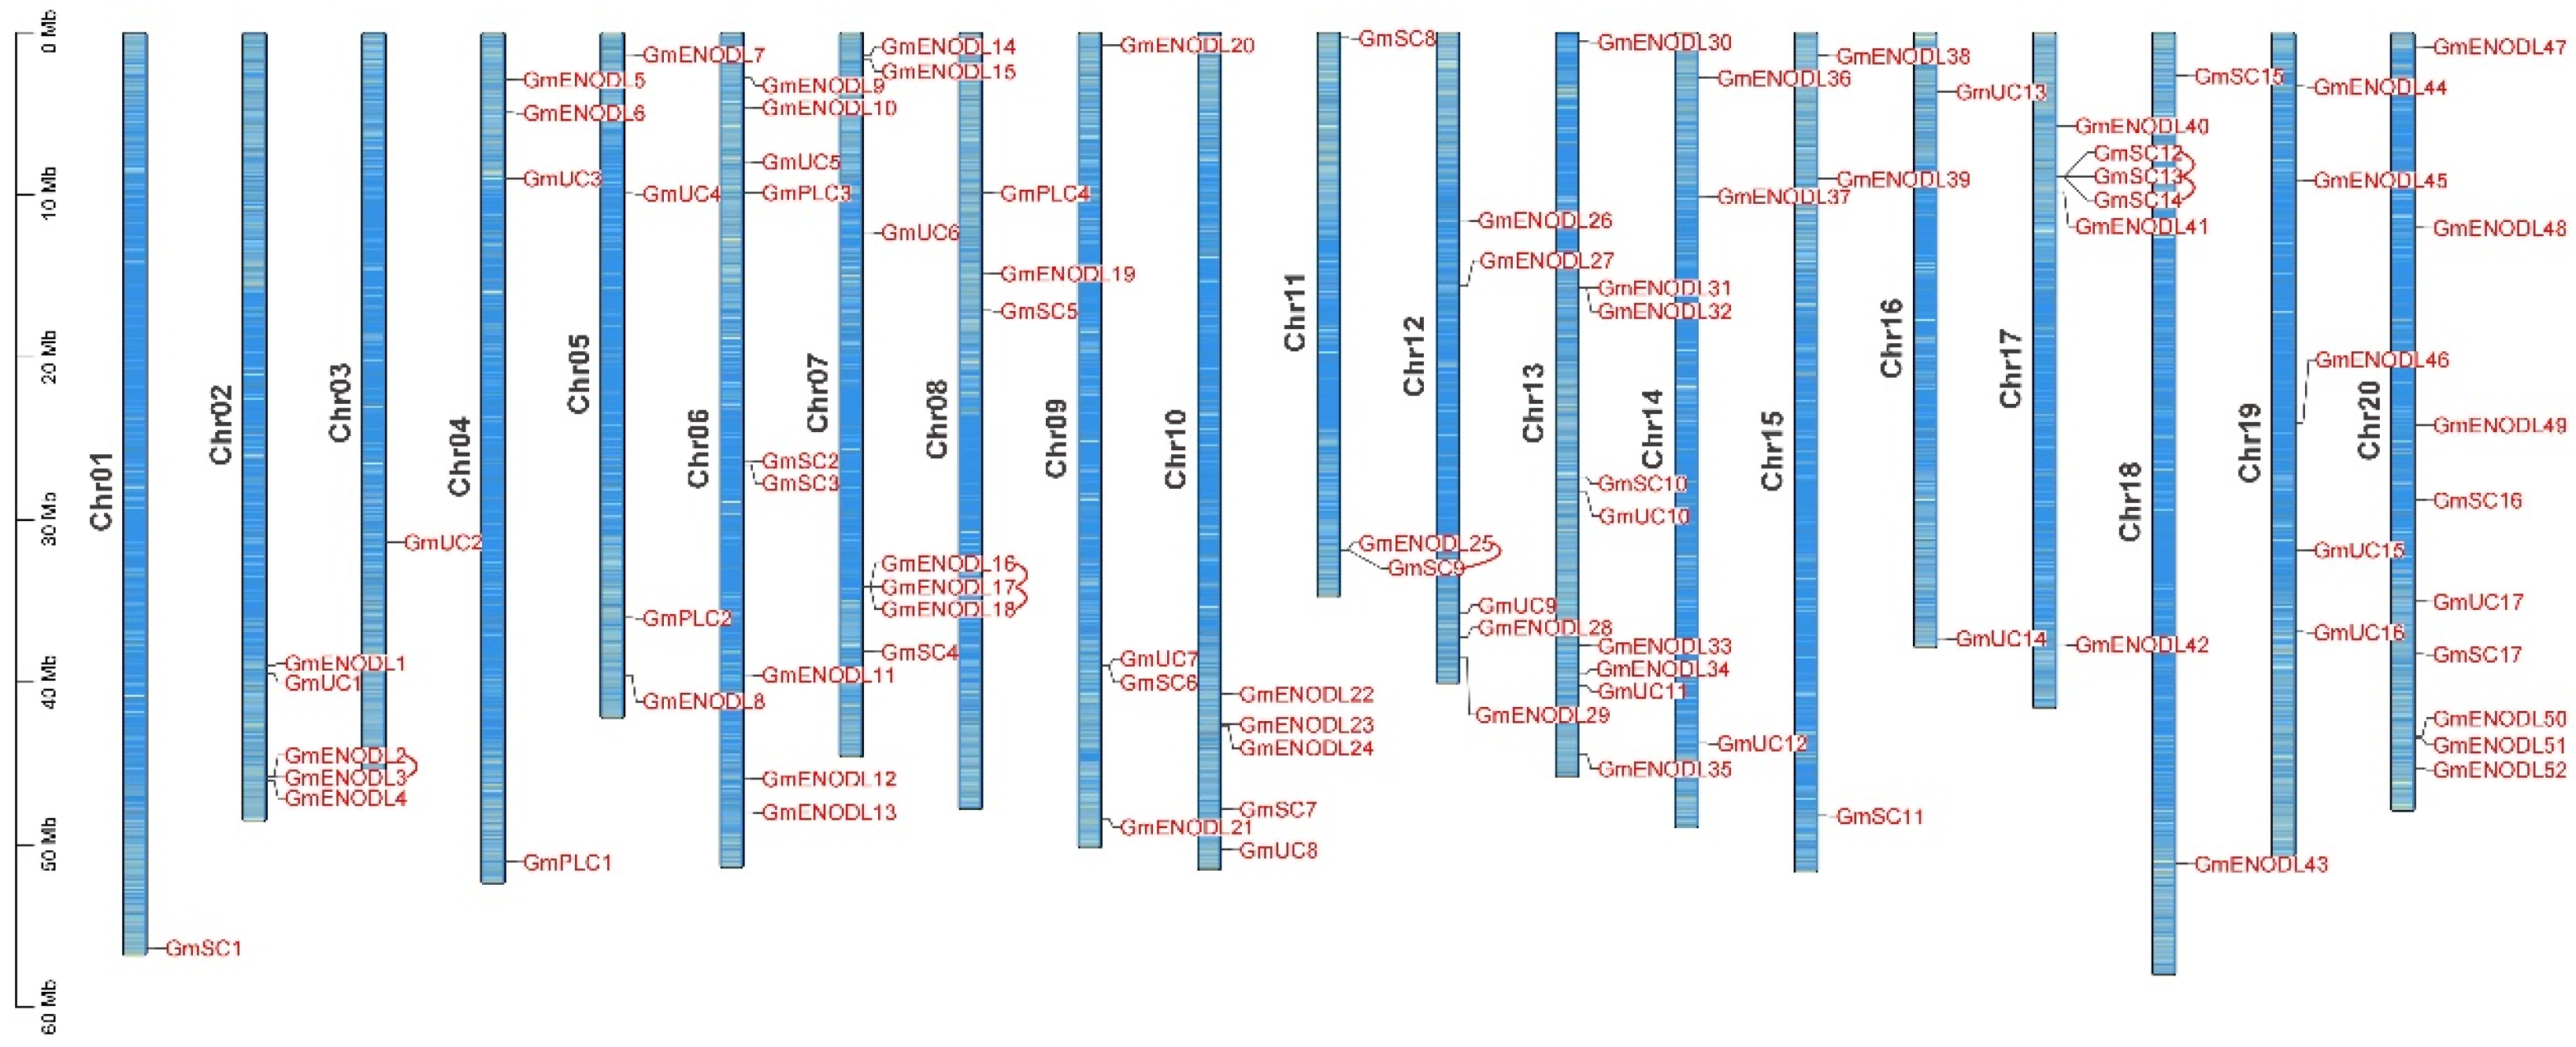
2.2. Characterization of Chromosomal Location, Structure, and Conserved Domain Distribution of GmPCs

An annotation file of the soybean genome (Gmax_Wm82_a2_v1 version) was used to obtain the exon/intron location information of GmPC genes. Two online tools or databases (NCBI [32] and MEME [33]) were used to perform the protein domains and conserved motifs analysis. The graphs of chromosomal location, structure, conserved domains, and motifs were drawn using TBtools software (version 2.003) [34].

2.3. Phylogenetic Analysis and Classification

The PC protein sequences from Arabidopsis and soybean were used for phylogenetic analysis. Multiple alignment analyses and phylogenetic tree construction were performed using the MEGA_X_10.1.7 program with default parameters (neighbor-joining method with 1000 bootstrap iterations).

2.4. GmPC Gene Duplication and Synteny Analyses

Tandem and collinearity files of GmPCs were extracted from the soybean genome file and general feature format (gff) file for analyzing tandem and segmental duplication events of GmPCs. The analysis results were further visualized using the Advanced Circos module in TBtools. Synteny analyses between GmPCs and orthologous PC genes from Arabidopsis thaliana and Glycine soja were carried out using the Dual Synteny Plotter module in TBtools. The selection pressure parameters, including nonsynonymous substitution (Ka), synonymous substitution (Ks), and the Ka/Ks ratio, were computed using TBtools software [34].

2.5. Promoter Cis-Regulatory Elements Analysis of GmPCs

The upstream 2000 bp genome sequence was extracted and defined as the promoter of each GmPC gene member. The cis-regulatory elements of GmPC promoters were analyzed online using the PlantCARE website (http://bioinformatics.psb.ugent.be/webtools/plantcare/html/, accessed on 24 September 2023) [35]. The graph depicting the cis-regulatory elements of GmPC promoters was constructed using TBtools software [34].

2.6. GmPCs Expression Analysis in Tissues and under Salt Stress

Transcriptional levels of GmPC gene members in various tissues were downloaded from data reported by Severin et al., which provided high-resolution gene expression data in a diverse set of fourteen tissues (such as nodule, root, leaf, flower, pod, and seed) throughout the growth period of soybean [36]. The heatmap of tissue expression was illustrated with TBtools software [34].
The response of GmPCs to salt stress was analyzed using the online transcriptome data [37]. Based on the expression data of GmPC gene members in roots and leaves of soybean variety Jack seedlings treated with 150 mM NaCl solution for 6 h, the co-expression network of the GmPC gene family was analyzed by the weighted gene co-expression network analysis (WGCNA) method in online software iDEP.96 (http://bioinformatics.sdstate.edu/idep/, accessed on 24 September 2023) [38]. The co-expression network diagram was further modified and optimized by Cytoscape v 3.10.1 [39].

2.7. RNA Isolation and Reverse Transcription Quantitative PCR (RT-qPCR) Analysis

The seedlings of soybean cultivar Jack were treated with normal water and 150 mM NaCl for 6 h, and the roots and leaves (three biological replicates for control and treatment, respectively) were sampled and rapidly frozen with liquid nitrogen for total RNA isolation. The method of RNA extraction followed the instructions of the SPARKeasy Plant RNA Extract Kit (SparkJade, Qingdao, China). Then, 1 μg RNA was reverse transcribed using a SPARKscript II RT Plus Kit (With gDNA Eraser) (SparkJade, Qingdao, China). The expression levels of GmSC10, GmSC12, GmENODL5, GmENODL11, GmENODL15, and GmENODL31 were identified by RT-qPCR. The transcript level of Tubulin (GenBank accession number: AY907703) was used as a quantitative control. Specific primers are detailed in Table S9. RT-qPCR was performed using 2 × SYBR Green qPCR Mix kit (SparkJade, Qingdao, China) on the CFX96 Touch system (Bio-Rad Laboratories, Hercules, CA, USA). The relative expression was calculated as reported by Livak and Schmittgen [40].

3. Results

3.1. Identification of PC Gene Family in Soybean

Through multiple sequence alignment analysis, we identified 90 PC genes in the soybean genome. Based on their gene location information and the alignment of four conserved amino acid residues (His, Cys, His, and Met/Gln) involved in copper binding, these 90 GmPC genes were further categorized into four subfamilies: GmSC1-GmSC17, GmUC1-GmUC17, GmPLC1-GmPLC4, and GmENODL1-GmENODL52. These genes are distributed across all chromosomes of the soybean (Figure 1).
To further characterize the GmPC genes, sequence length, physicochemical properties, and subcellular localization information of each member were analyzed. The results showed that coding DNA sequence length of GmPCs ranged from 351 bp (GmENODL41) to 1557 bp (GmENODL33), corresponding to a full length of 117 and 519 amino acid residues. Among them, GmENODL33 had the largest molecular weight (57.74 kDa), while GmUC3 had the smallest molecular weight (12.03 kDa). GmENODL33 had the largest isoelectric point (9.88), while GmENODL21 had the smallest isoelectric point (4.26) (Table S1). Subcellular localization prediction analysis indicated that most GmPC proteins were located in the cell membrane, with some members found in the cell wall, chloroplast, or mitochondria. These results suggest significant heterogeneity among soybean PC genes.

3.2. The Structure, Conserved Domain, and Motif Analyses of the GmPCs

To analyze the gene structure of GmPCs, gene members were obtained by searching soybean genomic DNA sequences. As shown in Figure 2, all GmPC gene members contained 2 or 3 exons, with most of them having 2 exons. All GmPC proteins contained typical plastocyanin-like domains, such as phytocyanin, plantacyanin, and cupredoxin superfamily. Ten conserved motifs (Motif 1–10) were analyzed in detail using the MEME online website, as shown in Table S2. Generally, the individual branches of the GmPC gene exhibit similar structures in terms of genes, conserved domains, and motifs.

3.3. Phylogenetic and Synteny Analyses of GmPCs

To elucidate the phylogenetic relationships of the GmPC proteins, a phylogenetic tree was constructed containing 132 PC members, with 90 members from soybean (Table S1) and 42 from Arabidopsis thaliana (Table S3). Furthermore, all PC members were divided into nine subfamilies named I to IX (Figure 3). This result suggests that soybean has more members of the PC gene family than Arabidopsis thaliana, possibly due to several rounds of replication events during evolution.
In order to investigate the underlying factors contributing to the escalation of GmPC gene members, a collinearity analysis was conducted within the soybean genome. As illustrated in Figure 4 and Table S4, six tandem duplication events (GmENODL2/GmENODL3, GmENODL16/GmENODL17, GmENODL17/GmENODL18, GmENODL25/GmCS9, GmCS12/GmCS13, and GmCS13/GmCS14) were identified. Additionally, 60 segmental duplication events associated with 72 GmPC genes were identified, such as those between GmCS1 and GmCS8 or between GmUC1 and GmUC3 (Figure 4A). These results suggested that fragment repeat events have played a pivotal role in the expansion of GmPCs compared to tandem repeat events. Furthermore, we performed a genome-wide comparison of the soybean PCs with those in Arabidopsis thaliana and Glycine soja, respectively (Figure 4B,C). Among the 75 GmPCs identified, 36 and 74 exhibited collinear relationships with those in Arabidopsis thaliana and Glycine soja, respectively (Tables S5 and S6). There were 49 orthologous syntenic gene pairs identified between Arabidopsis thaliana and Glycine max (Figure 4B), while the number increased to 187 pairs between Glycine max and Glycine soja (Figure 4C), possibly due to the domestication of Glycine max from Glycine soja.
Subsequently, we utilized the TBtools software to calculate the Ka/Ks values of gene pairs. All Ka/Ks ratios were below 1 in Arabidopsis thaliana and Glycine max as well as Glycine max and Glycine soja, except for two gene pairs exhibiting a ratio exceeding 1 (Tables S5 and S6). This observation indicates that GmPCs may have undergone strong purification selective pressure during the evolutionary process of soybeans.

3.4. Analysis of Cis-Regulatory Elements in GmPCs

To investigate the cis-regulatory element type of the GmPCs promoter, we retrieved the 2000 bp sequences upstream of the start codon (ATG) for all GmPCs and visualized their cis-regulatory elements. In total, 20 common elements were identified in the promoter regions of GmPCs (Figure 5), with detailed descriptions provided in Table S7. These elements encompassed hormone-related elements, light responsive-related elements, defense and stress-related elements, as well as seed-specific regulatory elements, among others. These findings suggest that the expression of GmPCs may be regulated by light signals, hormonal signals, biological stress, and abiotic stress, etc. They further indicate that GmPCs may play an important role in the growth and development of soybeans.

3.5. Expression Analysis of GmPCs in Different Tissues of Soybean

The expression levels of GmPCs were extracted from transcriptome data available in the soybean genome database. By extracting the expression of GmPCs from the published tissue expression transcriptome data, a total of 78 GmPCs were recruited and their expression levels in different tissues were displayed using heat maps (Figure 6). As depicted in Table S8, the expression levels of 10 GmPC gene members were relatively high in various tissues including root, stem, and leaf, such as GmPLC2, GmENODL15, GmENODL31, and GmENODL33; while 26 other members had low or even no expression levels observed in these tissues, such as GmSC3, GmSC4, GmUC3, GmUC13, GmUC14, GmENODL3, and GmENODL9. Other members exhibited high expression, specifically in certain tissues, such as nodules (GmENODL1) and roots (GmUC9). Therefore, the distinct expression patterns among different GmPC gene members suggest a tissue-dependent role that is not specific.

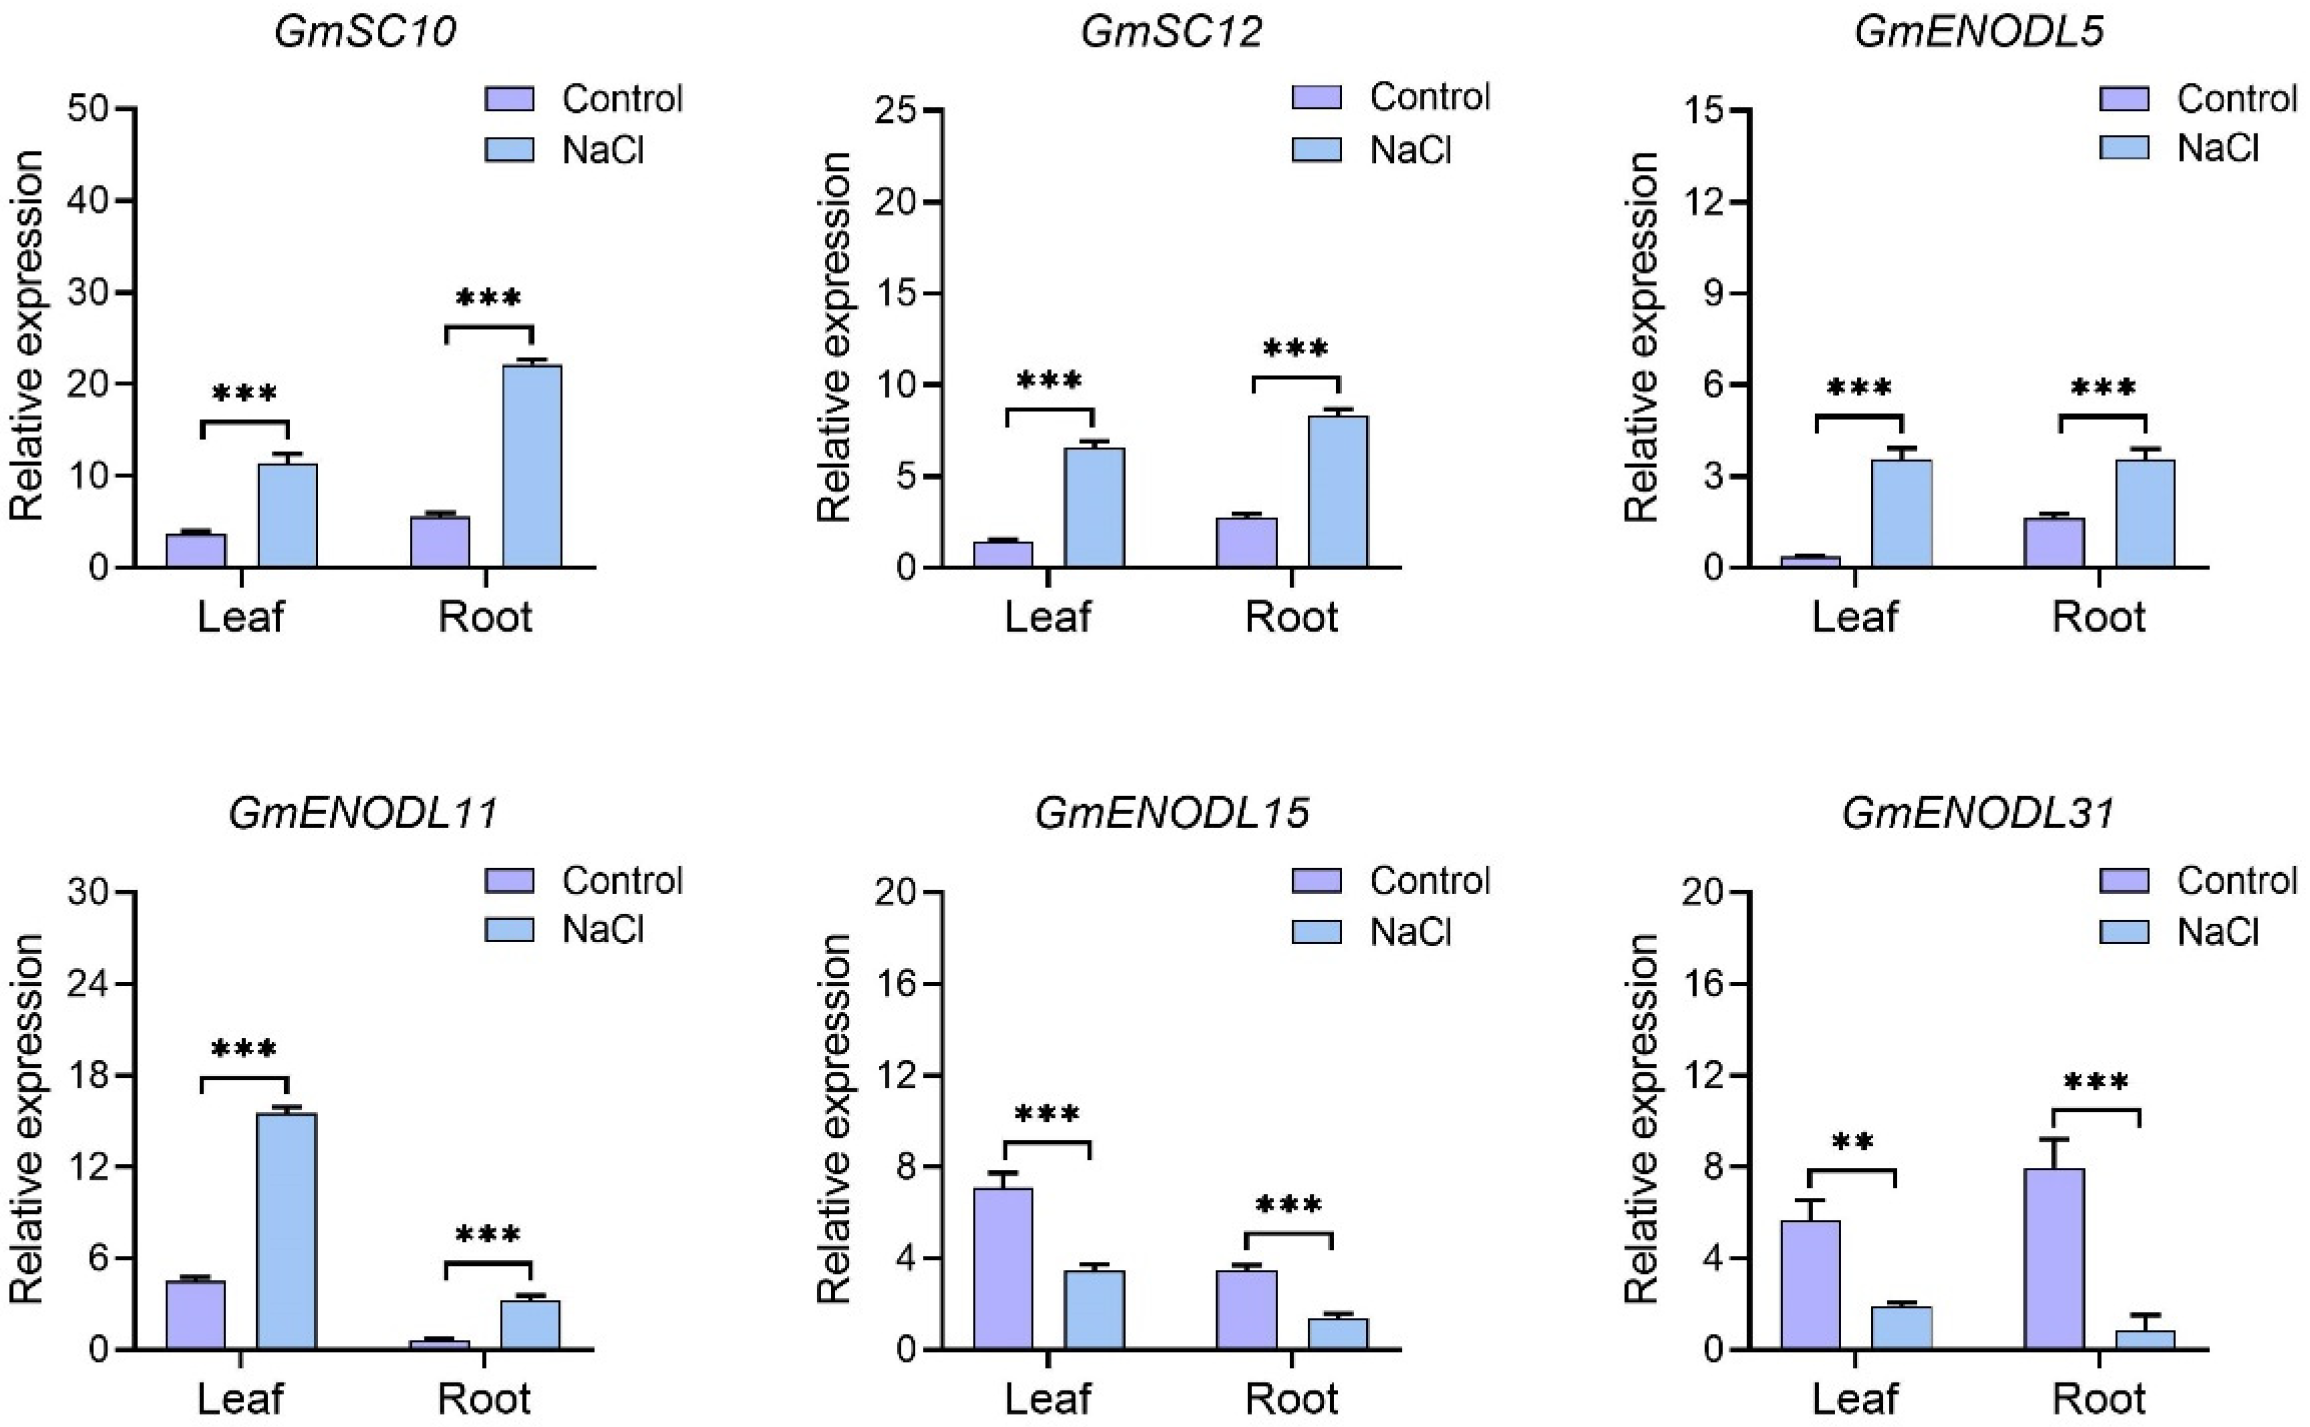
3.6. Co-Expression Network Analysis and Expression Profiles of GmPCs in Response to Saline Stress

Previous research has demonstrated the pivotal role of PCs in plant adaptation to salt stress [41,42]. To explore whether GmPCs participate in the response mechanism of salt stress, based on the reported transcriptome sequencing data from roots and leaves of soybean cultivar Jack seedlings treated with 150 mM NaCl solution for 6 h [37], the co-expression network of GmPC gene family members was analyzed by WGCNA. Genes with similar expression patterns may have similar molecular functions or participate in the same regulatory network. Here, the top 30 co-expressed GmPC gene members were screened and illustrated. As shown in Figure 7, GmENODL subfamily gene members had strong interaction with each other, and GmENODL15 and GmENODL16 were at the center of the co-expression network, indicating that GmENODL subfamily gene members (especially GmENODL15 and GmENODL16) might play a major role in the process of salt stress response.
Differential expression analysis further revealed that the expression levels of 23 GmPC genes were induced by salt stress, of which 8 members were found in leaves and 21 in roots (Figure 8). Under salt stress, the expression of 13 GmPCs was upregulated (GmSC3, GmSC10, GmSC12, GmUC9, GmENODL5, GmENODL9, GmENODL11, GmENODL16, GmENODL17, GmENODL18, GmENODL21, GmENODL43, and GmENODL47), while the expression of 10 GmPCs was downregulated (GmSC2, GmSC13, GmENODL6, GmENODL10, GmENODL15, GmENODL22, GmENODL31, GmENODL37, GmENODL42, and GmENODL52). Furthermore, RT-qPCR analysis was performed on the GmPCs that were simultaneously altered in both soybean leaves and roots (primers were detailed in Table S9). The transcriptional levels of GmSC10, GmSC12, GmENODL5, and GmENODL11 were significantly upregulated in leaves and roots under salt stress conditions compared to normal conditions, as illustrated in Figure 9. Conversely, the expression of GmENODL15 and GmENODL31 exhibited significant downregulation under salt stress condition, which was consistent with the transcriptome data. These findings suggest that specific GmPCs may participate in distinct molecular mechanisms in response to salt stress in soybean.

4. Discussion

As an ancient blue copper protein, the PC protein is widely recognized for its pivotal role in various aspects of plant growth and modulation of responses to diverse stresses [1,2,43]. Therefore, understanding the functions and regulatory mechanisms of the soybean PC gene family could supply helpful insights to improve crop productivity and enhance stress tolerance. In recent years, significant progress has been made in the investigation of PC gene families across different species through whole genome identifications [3,14,18,21]. However, studies on the PC gene family in soybean are still lacking. In this study, we performed comprehensive analysis of soybean PC gene family at the whole genome level. A total of 90 GmPCs were identified and exhibited an uneven distribution across soybean chromosomes (Figure 1). Similar to previous reports on Arabidopsis thaliana and Oryza sativa [3,18], the GmPC gene family was further classified into four subfamilies: GmSC, GmUC, GmPLC, and GmENODL. Among these subfamilies, the GmPLC subfamily had the lowest number of members, while the GmENODL subfamily had the most members. Moreover, compared to Arabidopsis thaliana and some other species, soybean has a higher number of GmPCs due to its evolution from ancient polyploidy, which led to multiple rounds of genome replication events and thus multiple copies of most genes [16,44].
Genes with different exon–intron structures and conserved domains may possess diverse functions [45,46]. Despite being excised through post-transcriptional processing, introns have been speculated to play a vital role in plant evolution and are considered an essential pathway for genes to acquire novel functions [47,48]. Therefore, conducting a comprehensive analysis of the exon–intron structure, conserved domains, and motifs of gene family members is necessary to examine their evolutionary relationships. All the GmPC genes were found to contain two or three exons, which differs from the observation that gene members of other species typically exhibit a higher number of exons [3,14,21]. However, all the genes contained at least one typical plastocyanin-like domain (Figure 2). Phylogenetic tree analysis showed that some members of different subfamilies were clustered together, indicating possible gene duplication events or convergent evolution. Additionally, the distribution of GmPCs in various plant species revealed a conserved pattern within certain clades but divergent patterns between different clades (Figure 3). The evolution and functional diversification of GmPCs may have been shaped by both ancestral genetic variation and environmental adaptation, indicating the intricate interplay between genetic inheritance and environmental factors in driving the evolutionary trajectory of this gene family.
During the process of evolution, some duplicated genes maintained their functional similarity, while others either acquired new functions, diversified their functions, or lost them [49,50]. In this study, collinear analysis of the GmPC gene family within the soybean genome revealed six tandem duplicate gene pairs and sixty segmental duplication events, indicating that segmental duplication may be the primary driver of GmPC gene family expansion. (Figure 4A). In the collinear analysis, 49 orthologous gene pairs were identified in a comparison between Glycine max and Arabidopsis thaliana (Figure 4B). As Glycine soja is a wild relative of soybean, more homologous gene pairs totaling 187 were identified in a comparison between Glycine max and Glycine soja (Figure 4C). Two orthologous genes with linear relationships may have similar biological functions, which helps in explaining the biological functions of GmPCs. Conducting collinearity analysis comparing PC members of two different species is helpful to explore the evolution of PC genes. Additionally, the replicating genes are the result of evolutionary selection [51]. In this study, most homologous pairs of GmPCs exhibited Ka/Ks ratios below 1, indicating that purifying selection occurred during soybean evolution. This may have facilitated soybean’s adaptation to various environmental changes.
In the process of growth and development, plants may encounter various stresses that impede their progress in terms of development, yield formation, and quality formation [52]. Simultaneously, plants have also developed a series of molecular mechanisms to adapt to changing environmental conditions. For instance, they regulate gene expression by combining certain transcription factors associated with resistance with cis-regulatory elements on gene promoters [53,54]. Thus, thorough analysis and identification of cis-regulatory elements and their intricate functions in governing plant development, as well as orchestrating responses to dynamic environmental stimuli, are of utmost importance within the realm of fundamental plant biology research. [55]. Here, 20 general cis-regulatory elements were identified (Figure 5). The presence of these elements suggests that the GmPCs may also play important roles in photosynthesis, similar to the function of BcBCP1 in Boea crassifolia [13]. Consistently, PC genes have been reported to participate widely in various biochemical reactions, including plant developmental regulation and stress response, etc. [5,13,56,57]. Therefore, the cis-regulatory analysis provides crucial insights into the potential involvement of the GmPC genes in diverse stress responses.
Currently, the utilization of RNA-seq databases has emerged as a powerful and convenient approach for excavating bioinformatics characteristics of different gene families [58]. In the present study, we analyzed the transcript levels across various tissues by searching RNA-seq data published by Severin et al. [36]. The tissue expression patterns of GmPC gene members exhibited variations, some being expressed in all tissues, while others were specific to certain tissues or not expressed at all, potentially attributable to the divergent functionalities or functional redundancy among PC genes (Figure 6). Based on the transcriptome data of salt stress treatment [37], a total of 23 GmPC genes were found to be induced by salt stress, with 8 GmPC members in leaves and 21 GmPC members in roots (Figure 8). To validate the credibility of the transcriptomic data, 6 GmPCs that were induced in both leaves and roots were selected for RT-qPCR analysis. Not surprisingly, the expression levels of 4 GmPCs (GmSC10, GmSC12, GmENODL5, and GmENODL11) were significantly upregulated and 2 GmPCs (GmENODL15 and GmENODL31) were significantly downregulated under salt stress (Figure 9). These results further suggest that the GmPCs may participate in response to salt stress. Certainly, the current exploration of PC gene function in soybean is far from enough. In the future, it will be necessary to investigate the molecular function of the PC gene through the combination of molecular biology techniques and soybean transgenic genetic transformation methods. Furthermore, exploring its regulatory mechanism in response to salt stress through multi-omics sequencing technology will provide valuable genetic resources and innovative research ideas for developing crop varieties with enhanced tolerance to high salinity conditions.

5. Conclusions

In summary, this study identified a total of 90 GmPC genes throughout the soybean genome and conducted a systematic analysis of the characteristics exhibited by members within the GmPC gene family. Comprehensive analyses of gene structure, protein physicochemical properties, and conserved domains revealed that different subfamilies had similar characteristics. Phylogenetic evolution and synteny analyses indicated that segmental duplications played a major role in amplifying the soybean genome. Most members of the GmPC gene from the same subfamily exhibited identical motifs and cis-regulatory elements on their promoters. However, there were also inconsistencies that may lead to differentiation in molecular functions among GmPC genes. The expression levels of GmPC genes in tissues were different, indicating that they may play various roles in the regulation of soybean growth and development. Moreover, a preliminary investigation revealed the involvement of six GmPC genes in soybean’s response to saline stress, which could provide reference for the study of salt tolerance mechanism in soybean. In the future, it will be critical to thoroughly study GmPC genes to improve soybean productivity and enhance stress tolerance.

Supplementary Materials

The following supporting information can be downloaded at: https://www.mdpi.com/article/10.3390/agronomy13102484/s1, Table S1: List of the identified GmPC genes and their related information in soybean; Table S2: Analyses of the motifs in GmPCs from the MEME website; Table S3: AtPC genes in Arabidopsis thaliana; Table S4: Tandemly and segmentally duplicated GmPC gene pairs; Table S5: One-to-one orthologous relationships between the PC gene members in Glycine max and Arabidopsis thaliana; Table S6: One-to-one orthologous relationships between the PC gene members in Glycine max and Glycine soja; Table S7: Cis-element analyses of the GmPC gene promoter regions; Table S8: Expression analyses of GmPC genes in multiple tissues throughout various developmental stages; Table S9: Primers used in this study for RT-qPCR.

Author Contributions

L.W. and Y.Y. conceived and designed the research. L.W. and X.X. conducted the data analysis and experiments; H.L., G.Z. and D.H. carried out the RT-qPCR experiment. L.W. and J.Z. wrote the manuscript; Y.Y., D.Z. and Z.H. revised the manuscript. All authors have read and agreed to the published version of the manuscript.

Funding

This work was supported in part by the National Natural Science Foundation of China (No. 32201867) to Y.Y. and (No. 32272171) to D.Z., Henan Province Science and Technology Project (222102110299) to D.Z., and Henan Fine Variety Joint Tackling Key Problems Project (No. 20220100304) to D.Z.

Data Availability Statement

RNA-seq data used in this study are available in the GenBank database (GEO accession number: GSE173640). All data described in the study have been provided in the Supplementary Information.

Conflicts of Interest

The authors declare no conflict of interest.

References

  1. Giri, A.V.; Anishetty, S.; Gautam, P. Functionally specified protein signatures distinctive for each of the different blue copper proteins. BMC Bioinform. 2004, 5, 127. [Google Scholar] [CrossRef]
  2. Ruan, X.M.; Luo, F.; Li, D.D.; Zhang, J.; Liu, Z.H.; Xu, W.L.; Huang, G.Q.; Li, X.B. Cotton BCP genes encoding putative blue copper-binding proteins are functionally expressed in fiber development and involved in response to high-salinity and heavy metal stresses. Physiol. Plant 2011, 141, 71–83. [Google Scholar] [CrossRef]
  3. Mashiguchi, K.; Asami, T.; Suzuki, Y. Genome-wide identification, structure and expression studies, and mutant collection of 22 early nodulin-like protein genes in Arabidopsis. Biosci. Biotechnol. Biochem. 2009, 73, 2452–2459. [Google Scholar] [CrossRef]
  4. Nersissian, A.M.; Immoos, C.; Hill, M.G.; Hart, P.J.; Williams, G.; Herrmann, R.G.; Valentine, J.S. Uclacyanins, stellacyanins, and plantacyanins are distinct subfamilies of phytocyanins: Plant-specific mononuclear blue copper proteins. Protein Sci. 1998, 7, 1915–1929. [Google Scholar] [CrossRef]
  5. Dong, J.; Kim, S.T.; Lord, E.M. Plantacyanin plays a role in reproduction in Arabidopsis. Plant Physiol. 2005, 138, 778–789. [Google Scholar] [CrossRef]
  6. Zhang, F.; Zhang, Y.C.; Zhang, J.P.; Yu, Y.; Zhou, Y.F.; Feng, Y.Z.; Yang, Y.W.; Lei, M.Q.; He, H.; Lian, J.P.; et al. Rice UCL8, a plantacyanin gene targeted by miR408, regulates fertility by controlling pollen tube germination and growth. Rice 2018, 11, 60. [Google Scholar] [CrossRef]
  7. Zhang, Y.C.; He, R.R.; Lian, J.P.; Zhou, Y.F.; Zhang, F.; Li, Q.F.; Yu, Y.; Feng, Y.Z.; Yang, Y.W.; Lei, M.Q.; et al. OsmiR528 regulates rice-pollen intine formation by targeting an uclacyanin to influence flavonoid metabolism. Proc. Natl. Acad. Sci. USA 2020, 117, 727–732. [Google Scholar] [CrossRef]
  8. Reyt, G.; Chao, Z.; Flis, P.; Salas-González, I.; Castrillo, G.; Chao, D.Y.; Salt, D.E. Uclacyanin Proteins Are Required for Lignified Nanodomain Formation within Casparian Strips. Curr. Biol. 2020, 30, 4103–4111. [Google Scholar] [CrossRef]
  9. Greene, E.A.; Erard, M.; Dedieu, A.; Barker, D.G. MtENOD16 and 20 are members of a family of phytocyanin-related early nodulins. Plant Mol. Biol. 1998, 36, 775–783. [Google Scholar] [CrossRef]
  10. Vijn, I.; Yang, W.C.; Pallisgård, N.; Ostergaard Jensen, E.; van Kammen, A.; Bisseling, T. VsENOD5, VsENOD12 and VsENOD40 expression during Rhizobium-induced nodule formation on Vicia sativa roots. Plant Mol. Biol. 1995, 28, 1111–1119. [Google Scholar] [CrossRef]
  11. Saji, S.; Saji, H.; Sage-Ono, K.; Ono, M.; Nakajima, N.; Aono, M. Phytocyanin-encoding genes confer enhanced ozone tolerance in Arabidopsis thaliana. Sci. Rep. 2022, 12, 21204. [Google Scholar] [CrossRef]
  12. Zhang, M.; Wang, X.; Yang, J.; Wang, Z.; Chen, B.; Zhang, X.; Zhang, D.; Sun, Z.; Wu, J.; Ke, H.; et al. GhENODL6 Isoforms from the Phytocyanin Gene Family Regulated Verticillium Wilt Resistance in Cotton. Int. J. Mol. Sci. 2022, 23, 2913. [Google Scholar] [CrossRef]
  13. Wu, H.; Shen, Y.; Hu, Y.; Tan, S.; Lin, Z. A phytocyanin-related early nodulin-like gene, BcBCP1, cloned from Boea crassifolia enhances osmotic tolerance in transgenic tobacco. J. Plant Physiol. 2011, 168, 935–943. [Google Scholar] [CrossRef]
  14. Cao, J.; Li, X.; Lv, Y.; Ding, L. Comparative analysis of the phytocyanin gene family in 10 plant species: A focus on Zea mays. Front. Plant Sci. 2015, 6, 515. [Google Scholar] [CrossRef]
  15. Arabidopsis Genome Initiative. Analysis of the genome sequence of the flowering plant Arabidopsis thaliana. Nature 2000, 408, 796–815. [Google Scholar] [CrossRef]
  16. Schmutz, J.; Cannon, S.B.; Schlueter, J.; Ma, J.; Mitros, T.; Nelson, W.; Hyten, D.L.; Song, Q.; Thelen, J.J.; Cheng, J. Genome sequence of the palaeopolyploid soybean. Nature 2010, 463, 178–183. [Google Scholar] [CrossRef]
  17. International Rice Genome Sequencing Project. The map-based sequence of the rice genome. Nature 2005, 436, 793–800. [Google Scholar] [CrossRef]
  18. Ma, H.; Zhao, H.; Liu, Z.; Zhao, J. The phytocyanin gene family in rice (Oryza sativa L.): Genome-wide identification, classification and transcriptional analysis. PLoS ONE 2011, 6, e25184. [Google Scholar] [CrossRef]
  19. Luo, S.; Hu, W.; Wang, Y.; Liu, B.; Yan, H.; Xiang, Y. Genome-wide identification, classification, and expression of phytocyanins in Populus trichocarpa. Planta 2018, 247, 1133–1148. [Google Scholar] [CrossRef]
  20. Sun, Y.; Wu, Z.; Wang, Y.; Yang, J.; Wei, G.; Chou, M. Identification of Phytocyanin Gene Family in Legume Plants and their Involvement in Nodulation of Medicago truncatula. Plant Cell Physiol. 2019, 60, 900–915. [Google Scholar] [CrossRef]
  21. Bilal Tufail, M.; Yasir, M.; Zuo, D.; Cheng, H.; Ali, M.; Hafeez, A.; Soomro, M.; Song, G. Identification and Characterization of Phytocyanin Family Genes in Cotton Genomes. Genes 2023, 14, 611. [Google Scholar] [CrossRef] [PubMed]
  22. Fang, C.; Kong, F. Soybean. Curr. Biol. 2022, 32, R902–R904. [Google Scholar] [CrossRef] [PubMed]
  23. Yang, F.; Xu, X.; Wang, W.; Ma, J.; Wei, D.; He, P.; Pampolino, M.; Johnston, A. Estimating nutrient uptake requirements for soybean using QUEFTS model in China. PLoS ONE 2017, 12, e0177509. [Google Scholar] [CrossRef] [PubMed]
  24. Muncan, J.; Jinendra, B.M.S.; Kuroki, S.; Tsenkova, R. Aquaphotomics Research of Cold Stress in Soybean Cultivars with Different Stress Tolerance Ability: Early Detection of Cold Stress Response. Molecules 2022, 27, 744. [Google Scholar] [CrossRef]
  25. Rasheed, A.; Raza, A.; Jie, H.; Mahmood, A.; Ma, Y.; Zhao, L.; Xing, H.; Li, L.; Hassan, M.U.; Qari, S.H.; et al. Molecular Tools and Their Applications in Developing Salt-Tolerant Soybean (Glycine max L.) Cultivars. Bioengineering 2022, 9, 495. [Google Scholar] [CrossRef]
  26. Wang, K.; Bu, T.; Cheng, Q.; Dong, L.; Su, T.; Chen, Z.; Kong, F.; Gong, Z.; Liu, B.; Li, M. Two homologous LHY pairs negatively control soybean drought tolerance by repressing the abscisic acid responses. New Phytol. 2021, 229, 2660–2675. [Google Scholar] [CrossRef] [PubMed]
  27. Yang, Y.; Wang, R.; Wang, L.; Cui, R.; Zhang, H.; Che, Z.; Hu, D.; Chu, S.; Jiao, Y.; Yu, D.; et al. GmEIL4 enhances soybean (Glycine max) phosphorus efficiency by improving root system development. Plant Cell Environ. 2023, 46, 592–606. [Google Scholar] [CrossRef]
  28. Mistry, J.; Chuguransky, S.; Williams, L.; Qureshi, M.; Salazar, G.A.; Sonnhammer, E.L.L.; Tosatto, S.C.E.; Paladin, L.; Raj, S.; Richardson, L.J.; et al. Pfam: The protein families database in 2021. Nucleic Acids Res 2021, 49, D412–D419. [Google Scholar] [CrossRef]
  29. Finn, R.; Clements, J.; Eddy, S. HMMER web server: Interactive sequence similarity searching. Nucleic Acids Res. 2011, 39, W29–W37. [Google Scholar] [CrossRef]
  30. Duvaud, S.; Gabella, C.; Lisacek, F.; Stockinger, H.; Ioannidis, V.; Durinx, C. Expasy, the Swiss Bioinformatics Resource Portal, as designed by its users. Nucleic Acids Res. 2021, 49, W216–W227. [Google Scholar] [CrossRef]
  31. Chou, K.C.; Shen, H.B. Cell-PLoc 2.0: An improved package of web-servers for predicting subcellular localization of proteins in various organisms. Nat. Protoc. 2008, 3, 153–162. [Google Scholar] [CrossRef] [PubMed]
  32. Yang, M.; Derbyshire, M.K.; Yamashita, R.A.; Marchler-Bauer, A. NCBI’s Conserved Domain Database and Tools for Protein Domain Analysis. Curr. Protoc. Bioinform. 2020, 69, e90. [Google Scholar] [CrossRef] [PubMed]
  33. Bailey, T.L.; Johnson, J.; Grant, C.E.; Noble, W.S. The MEME Suite. Nucleic Acids Res. 2015, 43, W39–W49. [Google Scholar] [CrossRef] [PubMed]
  34. Chen, C.; Chen, H.; Zhang, Y.; Thomas, H.; Frank, M.; He, Y.; Xia, R. TBtools: An Integrative Toolkit Developed for Interactive Analyses of Big Biological Data. Mol. Plant 2020, 13, 1194–1202. [Google Scholar] [CrossRef]
  35. Lescot, M.; Déhais, P.; Thijs, G.; Marchal, K.; Moreau, Y.; Van de Peer, Y.; Rouzé, P.; Rombauts, S. PlantCARE, a database of plant cis-acting regulatory elements and a portal to tools for in silico analysis of promoter sequences. Nucleic Acids Res. 2002, 30, 325–327. [Google Scholar] [CrossRef]
  36. Severin, A.J.; Woody, J.L.; Bolon, Y.-T.; Joseph, B.; Diers, B.W.; Farmer, A.D.; Muehlbauer, G.J.; Nelson, R.T.; Grant, D.; Specht, J.E. RNA-Seq Atlas of Glycine max: A guide to the soybean transcriptome. BMC Plant Biol. 2010, 10, 160. [Google Scholar] [CrossRef]
  37. Lu, L.; Wei, W.; Tao, J.J.; Lu, X.; Bian, X.H.; Hu, Y.; Cheng, T.; Yin, C.C.; Zhang, W.K.; Chen, S.Y.; et al. Nuclear factor Y subunit GmNFYA competes with GmHDA13 for interaction with GmFVE to positively regulate salt tolerance in soybean. Plant Biotechnol. J. 2021, 19, 2362–2379. [Google Scholar] [CrossRef]
  38. Ge, S.X.; Son, E.W.; Yao, R. iDEP: An integrated web application for differential expression and pathway analysis of RNA-Seq data. BMC Bioinform. 2018, 19, 534. [Google Scholar] [CrossRef]
  39. Shannon, P.; Markiel, A.; Ozier, O.; Baliga, N.S.; Wang, J.T.; Ramage, D.; Amin, N.; Schwikowski, B.; Ideker, T. Cytoscape: A software environment for integrated models of biomolecular interaction networks. Genome Res. 2003, 13, 2498–2504. [Google Scholar] [CrossRef]
  40. Livak, K.J.; Schmittgen, T.D. Analysis of relative gene expression data using real-time quantitative PCR and the 2−ΔΔCT method. Methods 2001, 25, 402–408. [Google Scholar] [CrossRef]
  41. Dong, Y.; Zhang, L.; Chang, X.; Wang, X.; Li, G.; Chen, S.; Jin, S. Overexpression of LpCPC from Lilium pumilum confers saline-alkali stress (NaHCO3) resistance. Plant Signal Behav. 2022, 17, 2057723. [Google Scholar] [CrossRef] [PubMed]
  42. Mei, X.; Zhao, Z.; Bai, Y.; Yang, Q.; Gan, Y.; Wang, W.; Li, C.; Wang, J.; Cai, Y. Salt Tolerant Gene 1 contributes to salt tolerance by maintaining photosystem II activity in maize. Plant Cell Environ. 2023. [CrossRef] [PubMed]
  43. Li, J.; Gao, G.; Zhang, T.; Wu, X. The putative phytocyanin genes in Chinese cabbage (Brassica rapa L.): Genome-wide identification, classification and expression analysis. Mol. Genet. Genom. 2013, 288, 1–20. [Google Scholar] [CrossRef] [PubMed]
  44. Shoemaker, R.; Schlueter, J.; Doyle, J. Paleopolyploidy and gene duplication in soybean and other legumes. Curr. Opin. Plant Biol. 2006, 9, 104–109. [Google Scholar] [CrossRef] [PubMed]
  45. Hajibarat, Z.; Saidi, A.; Zeinalabedini, M.; Gorji, A.M.; Ghaffari, M.R.; Shariati, V.; Ahmadvand, R. Genome-wide identification of StU-box gene family and assessment of their expression in developmental stages of Solanum tuberosum. J. Genet. Eng. Biotechnol. 2022, 20, 25. [Google Scholar] [CrossRef]
  46. Wu, W.; Zhu, S.; Xu, L.; Zhu, L.; Wang, D.; Liu, Y.; Liu, S.; Hao, Z.; Lu, Y.; Yang, L.; et al. Genome-wide identification of the Liriodendron chinense WRKY gene family and its diverse roles in response to multiple abiotic stress. BMC Plant Biol. 2022, 22, 25. [Google Scholar] [CrossRef]
  47. Jeffares, D.C.; Penkett, C.J.; Bähler, J. Rapidly regulated genes are intron poor. Trends Genet. 2008, 24, 375–378. [Google Scholar] [CrossRef]
  48. Roy, S.W.; Penny, D. A very high fraction of unique intron positions in the intron-rich diatom Thalassiosira pseudonana indicates widespread intron gain. Mol. Biol. Evol. 2007, 24, 1447–1457. [Google Scholar] [CrossRef]
  49. Wang, X.Y.; Paterson, A.H. Gene conversion in angiosperm genomes with an emphasis on genes duplicated by polyploidization. Genes 2011, 2, 1–20. [Google Scholar] [CrossRef]
  50. Zhu, Y.; Wu, N.; Song, W.; Yin, G.; Qin, Y.; Yan, Y.; Hu, Y. Soybean (Glycine max) expansin gene superfamily origins: Segmental and tandem duplication events followed by divergent selection among subfamilies. BMC Plant Biol. 2014, 14, 93. [Google Scholar] [CrossRef]
  51. Navarro, A.; Barton, N. Chromosomal speciation and molecular divergence--accelerated evolution in rearranged chromosomes. Science 2003, 300, 321–324. [Google Scholar] [CrossRef] [PubMed]
  52. Lamaoui, M.; Jemo, M.; Datla, R.; Bekkaoui, F. Heat and Drought Stresses in Crops and Approaches for Their Mitigation. Front. Chem. 2018, 6, 26. [Google Scholar] [CrossRef] [PubMed]
  53. Jiang, J.; Ma, S.; Ye, N.; Jiang, M.; Cao, J.; Zhang, J. WRKY transcription factors in plant responses to stresses. J. Integr. Plant Biol. 2017, 59, 86–101. [Google Scholar] [CrossRef] [PubMed]
  54. Ma, J.; Wang, L.Y.; Dai, J.X.; Wang, Y.; Lin, D. The NAC-type transcription factor CaNAC46 regulates the salt and drought tolerance of transgenic Arabidopsis thaliana. BMC Plant Biol. 2021, 21, 11. [Google Scholar] [CrossRef]
  55. Schmitz, R.; Grotewold, E.; Stam, M. Cis-regulatory sequences in plants: Their importance, discovery, and future challenges. Plant Cell 2022, 34, 718–741. [Google Scholar] [CrossRef] [PubMed]
  56. Ezaki, B.; Sasaki, K.; Matsumoto, H.; Nakashima, S. Functions of two genes in aluminium (Al) stress resistance: Repression of oxidative damage by the AtBCB gene and promotion of efflux of Al ions by the NtGDI1gene. J. Exp. Bot. 2005, 56, 2661–2671. [Google Scholar] [CrossRef]
  57. Poon, S.; Heath, R.L.; Clarke, A.E. A chimeric arabinogalactan protein promotes somatic embryogenesis in cotton cell culture. Plant Physiol. 2012, 160, 684–695. [Google Scholar] [CrossRef]
  58. Wang, Z.; Gerstein, M.; Snyder, M. RNA-Seq: A revolutionary tool for transcriptomics. Nat. Rev. Genet. 2009, 10, 57–63. [Google Scholar] [CrossRef]
Figure 1. The chromosomal distributions of the GmPC genes in Glycine max. The vertical bars represent chromosomes, and tandem duplicated genes are connected by red lines.
Agronomy 13 02484 g001
Figure 2. Phylogenetic clustering, gene structure, domains, and motifs of GmPCs. (A) The phylogenetic tree was constructed using full-length protein sequences by the maximum likelihood (ML) method. (B) Exons and introns are represented by green color boxes and gray lines, respectively, and the domains are represented by different color boxes. (C) The ten motifs are represented in different color boxes. The sizes of exons and introns are proportional to their sequence lengths.
Agronomy 13 02484 g002
Figure 3. Phylogenetic analysis of PC proteins in soybean and Arabidopsis thaliana. The full-length amino acid sequences from Arabidopsis thaliana (At) and soybean (Gm) were aligned and analyzed with MEGA_X_10.1.7, and the tree was built with the maximum likelihood (ML) method. The tree was further categorized into distinct subfamilies in different colors; I-IX represents nine subfamilies.
Agronomy 13 02484 g003
Figure 4. Inter-chromosomal relations and synteny analyses of GmPC gene family members. (A) Chromosomal locations of GmPCs and their synteny were illustrated by the Circos diagram. All the syntenic blocks in the soybean genome are depicted by the gray lines, and the sky blue lines link the duplicated GmPC gene pairs. (B,C) Synteny analysis of PC genes between Glycine max and Arabidopsis thaliana, and between Glycine max and Glycine soja, respectively. The syntenic PC gene pairs between soybean and other species are highlighted with sky-blue lines.
Agronomy 13 02484 g004
Figure 5. Cis-elements in GmPCs promoter regions. Left panel: phylogenetic clustering of the GmPC gene members. Right panel: the pattern of the cis-elements in the 2000 bp upstream hereditary regions of the identified GmPCs. Different cis-elements are indicated by distinct colored boxes.
Agronomy 13 02484 g005
Figure 6. Expression analyses of GmPCs in various tissues during the whole growth period of soybean. Phylogenetically clustered expression of GmPCs in different tissues during soybean developments based on the public RNA-seq data. The RPKM values are displayed for gene expression levels and were Log2 normalized to depict the heatmap. DAF represents the days after flowering.
Agronomy 13 02484 g006
Figure 7. Co-expression network o of GmPC gene family. Ellipses represent gene nodes, gray lines represent co-expression relationships, and genes distributed in circles from inside to outside represent the distribution of degree values from high to low. The darker the color of the ellipse in the same circle, the greater the degree value and the stronger the correlation between genes.
Agronomy 13 02484 g007
Figure 8. Expression patterns of GmPCs in leaves and roots of the cultivar Jack under salt stress. (A) Expression levels of GmPCs induced by salt stress in soybean leaves. (B) Expression levels of GmPCs induced by salt stress in soybean roots. The expression values were mapped using a color gradient from low (blue) to high (red). Co (Control) and Na (NaCl) represent water and salt-stress conditions, respectively; 1, 2, and 3 represent three biological repetitions.
Agronomy 13 02484 g008
Figure 9. The RT-qPCR analyses of six selected GmPC genes induced by salt stress. Data were normalized to Tubulin, and columns and error bars represent the means ± standard deviation (SD) of three independent biological replicates. Differences were evaluated using the two-tailed Student’s t-test (*** p < 0.001, ** p < 0.01). Control and NaCl represent water and salt-stress conditions, respectively.
Agronomy 13 02484 g009
Disclaimer/Publisher’s Note: The statements, opinions and data contained in all publications are solely those of the individual author(s) and contributor(s) and not of MDPI and/or the editor(s). MDPI and/or the editor(s) disclaim responsibility for any injury to people or property resulting from any ideas, methods, instructions or products referred to in the content.

