Review

A Scientometric Analysis of Research Trends and Knowledge Structure on the Climate Effects of Irrigation between 1993 and 2022

1
Center for Agricultural Water Research in China, China Agricultural University, Beijing 100083, China
2
International Institute for Earth System Science, Nanjing University, Nanjing 210023, China
*
Author to whom correspondence should be addressed.
Agronomy 2023, 13(10), 2482; https://doi.org/10.3390/agronomy13102482
Submission received: 18 May 2023 / Revised: 16 June 2023 / Accepted: 23 August 2023 / Published: 26 September 2023

Abstract

:
Irrigation, as one of the most impactful human interventions in the terrestrial water cycle, has been arousing great attention due to research on the impacts of its interaction with climate. In this paper, we used a scientometric analysis method to explore the overall publication output of the climatic effects of irrigation (CEI) field from the Web of Science Core Collection (WSCC) database, covering the time period from 1993 to 2022. And, through a visual scientific citation analysis tool, CiteSpace, we studied the knowledge structure, disciplinary trajectory, frontier hotspots, and academic impacts in the field of CEI. Using topic screening, 2919 publications related to irrigation climate were searched. CEI research has gone through the knowledge germination stage (1993–2005), knowledge accretion stage (2006–2012), and the knowledge prosperity stage (2013–2022), respectively. Ecology, earth, and marine are the most influential disciplines of research in this field, and they are influenced by earth, geology, geophysics and plant, ecology, zoology. AWM and SOTTE are the most popular journals currently. The academic impacts of scientific stakeholders are uneven. European and American countries have profound influence in the research field. The keyword of “Climate change” is the turning point in the co-word analysis network, and research hotspots focus on “carbon dioxide”, “model”, “climate”, “growth”, “temperature”, “biomass”, “global warming”, “CO2”, “global change”, “dynamics”, “adjustments”, and “atmospheric CO2”. The knowledge base of the CEI field can be divided into 14 clusters, such as cotton production, semi-arid condition, and irrigation water supply, and these three clusters are the three largest among them. This paper offers a comprehensive scientometric review of CEI, and, to some degree, provides some reference for the relevant research on the climate effects of irrigation, which will be beneficial to understand the current research situation and development trend in this field, as well as provide state-of-the-art and future perspectives.

1. Introduction

Climate change and the water crisis will be the most persistent and profound global risks for the coming decades, as stated in the United Nations Environmental Programme [1]. The interaction between climate change and water-use activities has been one of the most critical and dynamic research topics in the field of earth sciences. The impact of climate change is universal; it not only intuitively reflects the increase in temperature and extreme climate, but also has a significant impact on local hydrological cycles and human water-use management [2,3]. Indeed, water resource availability, quality, streamflow, and motion are very sensitive to changes in temperature and precipitation [4,5]. A previous study showed that snowcap and snowmelt affect the generation of snowmelt-driven runoff, which might affect the availability and management of water resources in high mountain areas, resulting in significant economic consequences [5]. A groundwater-level simulation of the Tedori River alluvial fan in Japan indicates that the groundwater level at a non-irrigation period is the most sensitive to changes in precipitation [6]. Furthermore, any hydrological change caused by long-term climate change impacts the management of water resources [7].
On the flip side, human water management can combat climate change. Sustainable water management is central to building the resilience of societies and ecosystems, and reducing carbon emissions [8]. As land and water management measures, irrigation decisions are closely related to climate change. The consumption amount, area, and method of irrigation are not only affected by climate change, but also have feedback effects on the climate. Agricultural water withdrawal accounts for 70% of the total water withdrawal, and 21% of the total cultivated land has been equipped as irrigation land [9]. More than 40 percent of crops are produced under irrigated conditions [10]. In an era of increasing irrigation demand, with the development of urbanization, the outdoor water consumption (e.g., urban greening and landscape pools) in urban areas cannot be underestimated [11]. As the largest anthropogenic water-use approach, irrigation has been one of the greatest human disturbances to the land surface, affecting energy budgets, the water cycle, and climate significantly in the 20th century, but it is only recently that attention has been focused on the connections between irrigation and climate [12,13,14,15]. It figures out that water evaporation from irrigation affects temperature and humidity curves via thermodynamics (directly) and radiation (indirectly) [12]. Many studies show that irrigation controls water resource consumption, surface energy flux balance, and greenhouse gas emissions, and thus impacts regional hydrological and meteorological characteristics, even the global land–atmosphere coupling [16,17,18]. Irrigation can directly and indirectly affect climate [12,18,19,20,21]. From an indirect perspective, soil respiration and biomass accumulation respond strongly to irrigation, which may greatly affect soil carbon sequestration and atmospheric carbon exchange [22]. From a direct perspective, as early as 1969, Norero [23] studied the effect of irrigation frequency on the average evapotranspiration of different crop–climate–soil systems through a series of observation experiments.
With the development of computer technology and the advances in climate, hydrological, and ecological model mechanisms, there is increasing research on the impacts of irrigation on climate using numerical models, which can be derived from the site scale to the regional and global scale to study climate. At the end of the 20th century (1981–2000), the climatic effects of irrigation (CEI) were highly localized, especially in areas with intensive irrigation [13]. Thiery [24] affirmed that irrigation had a small beneficial effect on the current near-surface climate, but a large impact on temperature extremes during hot or dry periods. In arid regions or large scale agricultural irrigation areas, the irrigation effects on climate will be more obvious. Irrigation decreases surface air temperature and wind anomalies, which enhances the rainfall to the east of the irrigated areas, and reduces direct precipitation in irrigated areas [25]. On the basis of the changes in irrigated agriculture in the Loess Plateau area, research found that the types of CEI included cooling, wetting, and dimming effects [26]. At the level of urban irrigation, urban irrigation significantly lowers the surface and air temperature in cities, and partially offsets warming anomalies in heat waves via additional cooling [27]. And, urban water management is a good method to optimize urban irrigation’s thermal benefits, and can be a good case for using irrigation as a heat mitigation measure during heatwaves [28]. On the global or continent scale, irrigation causes a slightly greater soil moisture and a substantial increase in ET, which benefits plant production. On the regional scale, irrigation causes more complex effects on the water cycle, and significantly cools the land surfaces by enhancing ET [29]. And, from the field scale, drip irrigation can reduce ET, E, and T by 22, 3.5, and 18.5 mm on average, respectively [30]. These changes are due to drip irrigation significantly lowering the leaf area index and shortening crop growth, which verifies that irrigation indirectly affects climate by altering crop growth processes, and changing land use and land cover (LUCC). Considering these research contributions, irrigation has become an important climate adaptation measure; however, the impacts of irrigation on climate are not always positive [31]. Due to these different research results, the research process in the CEI field has also generated many different scientific themes. And, because the impacts between irrigation and climate are mutual, it is difficult to completely distinguish between the two to talk about their impact. Therefore, in order to explore the scientific domain, knowledge process, and frontier development involved in this research, a scientometric analysis was used in this paper with the CEI field over the past three decades as the research subject.
This paper was designed to sort out the development background and research frontiers of the CEI research, figure out the influential academic contributors, and interpret the scientific outputs systematically. It has been divided into the following sections. In Section 2, the main scientometric analysis procedures and visualization analysis tools are introduced. In Section 3, we gradually refine the discipline distribution, cooperation network, knowledge base, and cutting-edge progress in the field of CEI from the perspective of the overall scientific research output by CiteSpace. Ulteriorly, in Section 4, we conduct a comprehensive review and summary of CEI from multiple perspectives, which can be helpful for obtaining more precise information regarding CEI, and guiding future research directions or researchers.

2. Materials and Methods

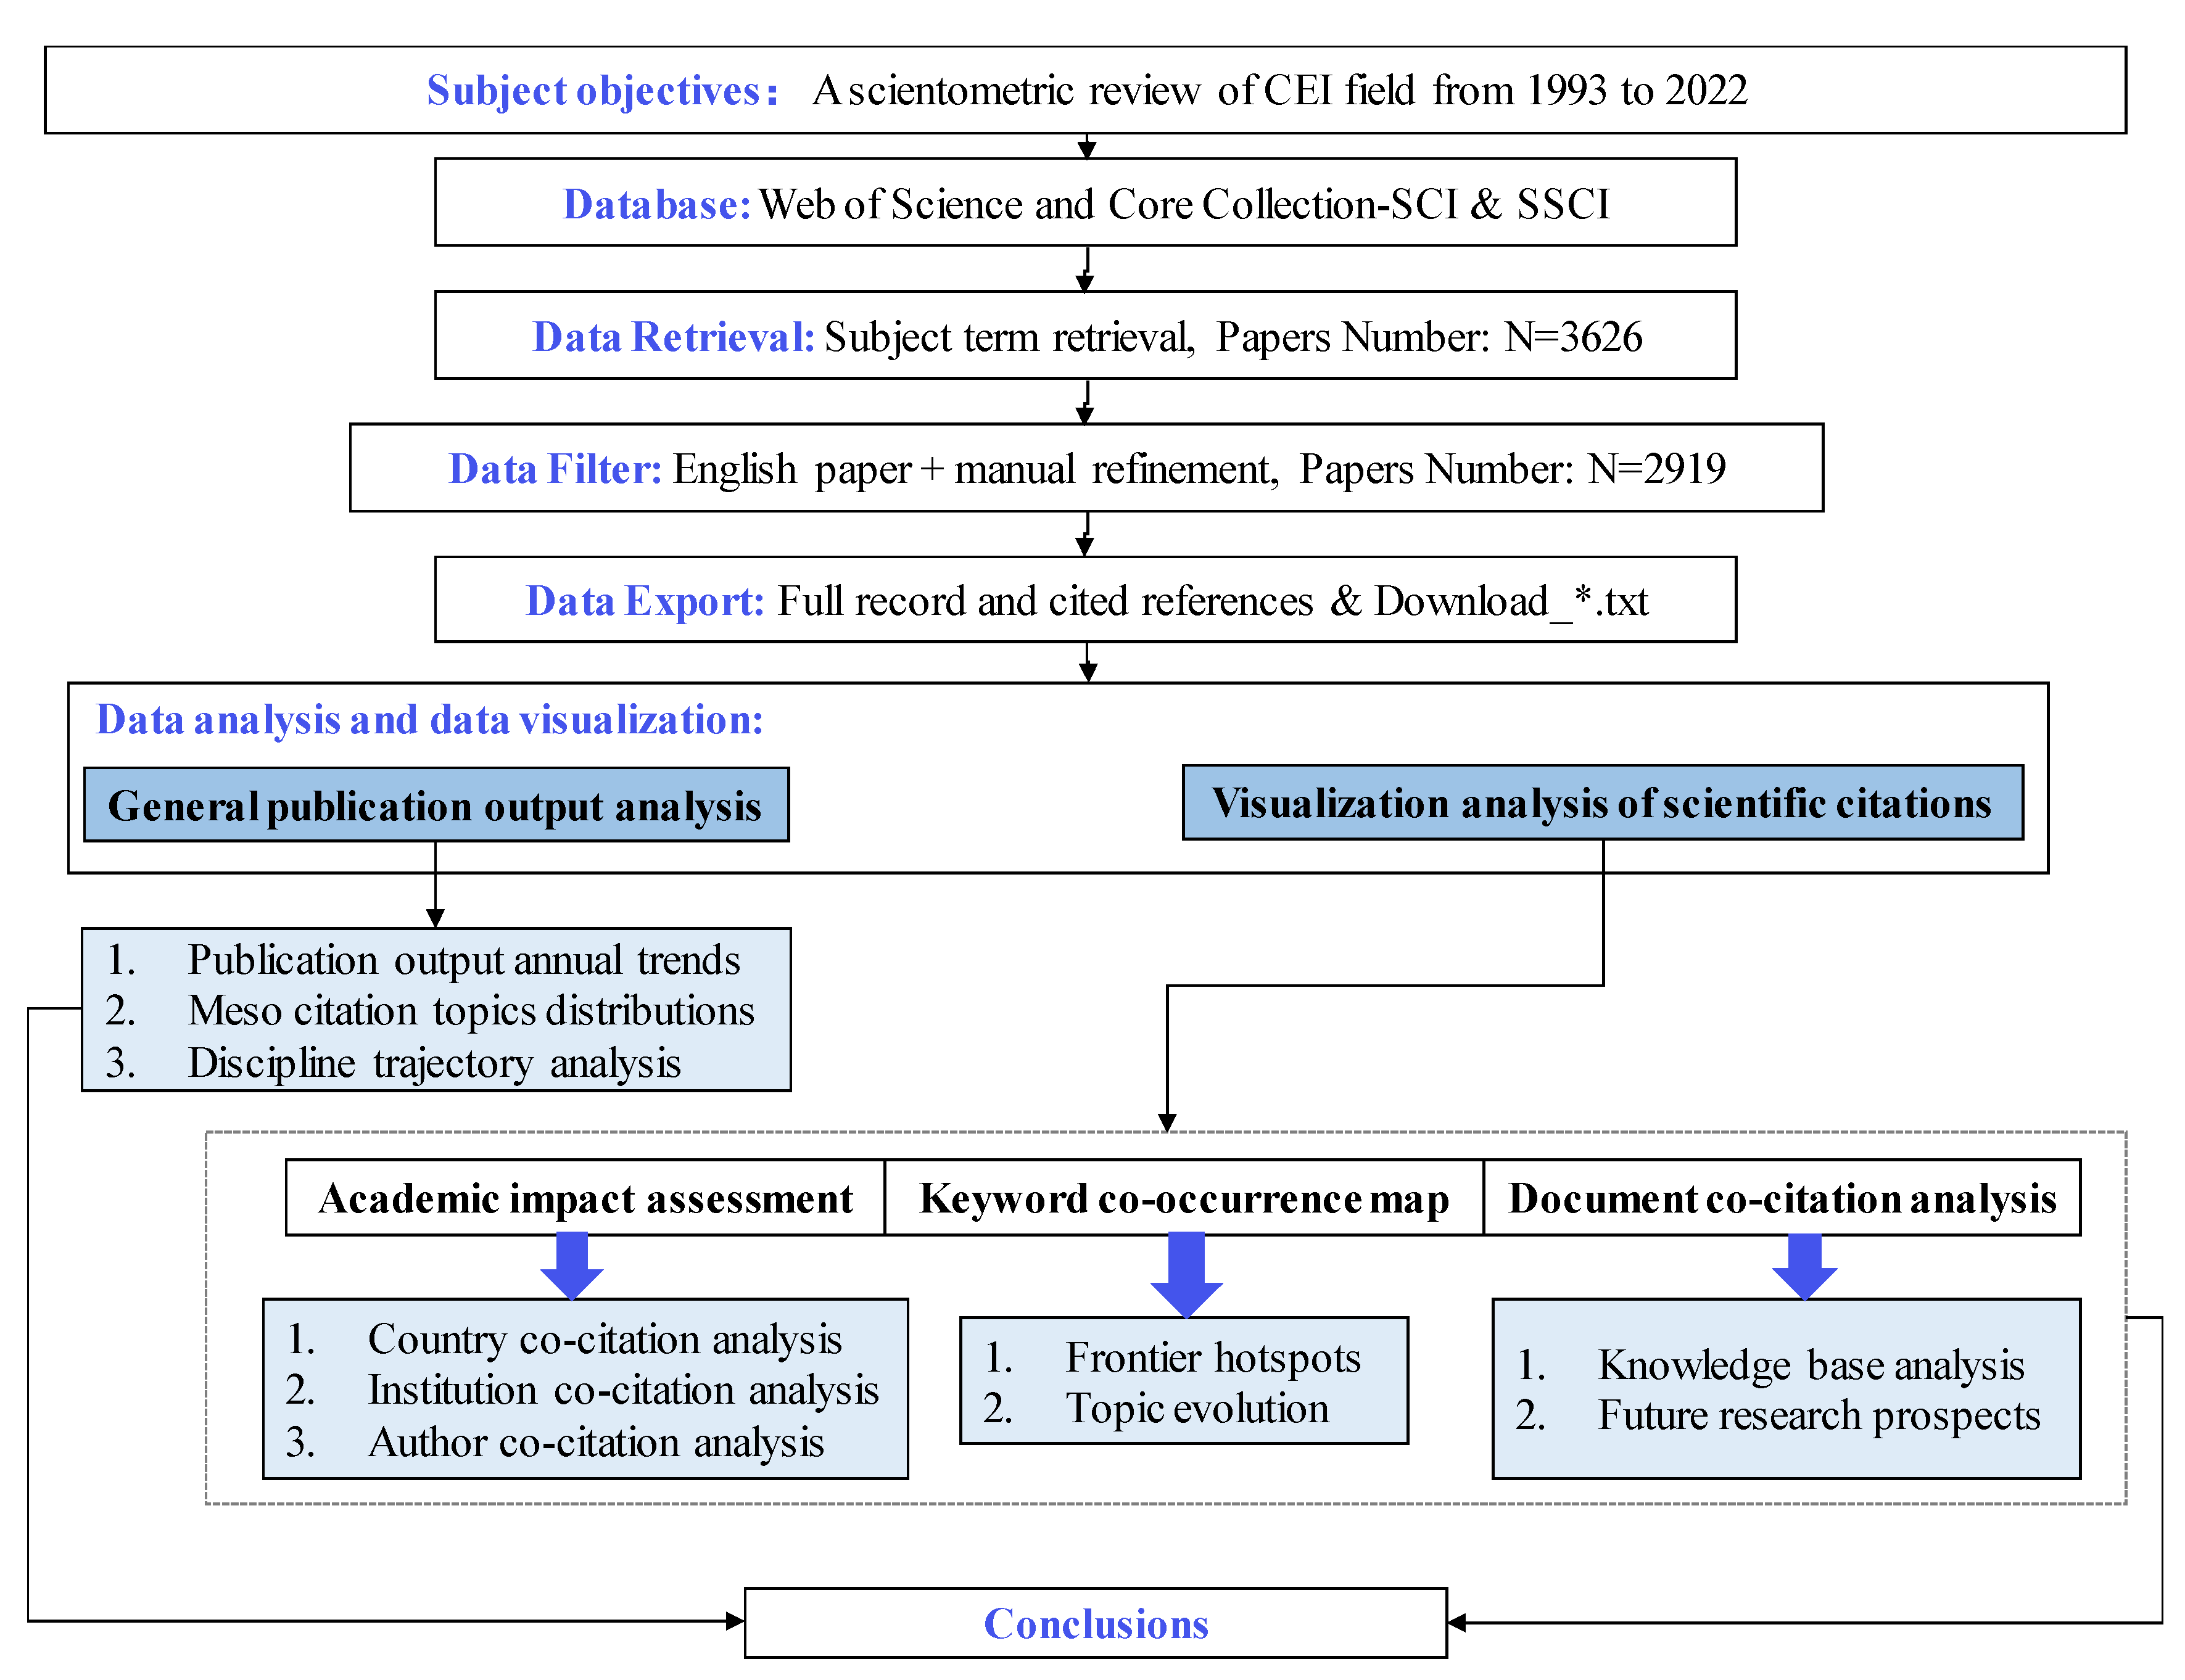
2.1. Scientometric Analytical Research Design

Scientometric analysis is a quantitative method of research on the development of science as an information process [32]. The aim of it is to assess the degree of consensus in the field of study and determine challenges and future directions, guiding new researchers to pursue effective research, and keeping the knowledge of experienced researchers in the field up to date [27]. The scientometric analytical schematic layout of this review is depicted in Figure 1. Firstly, the research object of this article was well defined: the scientometric analysis of the research trend and knowledge structure of CEI from 1993 to 2022. Next, data collection and data reduction were carried out, including data retrieval, data filtration, and data export. Lastly, data analysis and visualization analysis were shown using Excel, Origin, and CiteSpace.

2.2. Analysis Data Collection and Processing

Data source and data retrieval are the cornerstones of our scientometric study because the coverage of our data will directly influence the scope of the subsequent analysis. Web of Science (WOS) is one of the world’s most interdisciplinary and most comprehensive citation databases, and is considered an effective source of data retrieval for scientometric analyses [33]. In this paper, on 18 March 2023, we selected the Science Citation Index Expanded (SCIE) and the Social Sciences Citation Index (SSCI) of the Web of Science Core Collection (WSCC) from the digital library of China Agricultural University (CAU) as the paper retrieval sources. There were four topic search formulas used: #4 (TS = irrigation or irrigate or irrigative AND TS = climate effect or climatic effect), #3 (TS = irrigation effect AND TS = climat* change), #2 (Irrigation and temperature or humidity or evaporation or flux or climate change or extreme climate), and #1 (Publication Year = 1993-01-01 to 2022-12-31). After linking all four formulas with the logical operator “AND”, 3626 papers were generated. Considering the restrictions of language and document types, 3365 English articles were kept. Then, after eliminating irrelevant research areas, 2919 valid articles remained as the scientometric analysis database for this article. The final data were exported in the plain text format with full records and cited references.

2.3. Data Analysis Methods and Tools

From a holistic perspective, based on the database of WSCC, it analyzed the output distribution (journals, countries, and research areas) and annual trends of 2919 papers. From a local perspective, a mainstream scientometric analysis tool, CiteSpace, was used for analyzing trends and patterns in the scholarly literature of a field of research [34].
CiteSpace is particularly useful for analyzing large volumes of bibliographic data by visualizing the evolution of research fields, historical research achievements, research hotspots, and future emerging directions [34,35]. It makes us no longer focus on the partial contribution of specific papers, but instead focus on their role in the overall development of the academic domain [36].
In this paper, using CiteSpace 6.2.2, discipline trajectory, academic cooperation (co-author, co-country, co-institution), research trends, and intellectual base were mapped with different types of nodes. In CiteSpace, nodes and links form a corresponding scientific analysis network. Nodes indicate research items (author, keyword, country, institution, and reference) and links between nodes describe co-citation or co-occurrence relationships. The size of a node is proportional to the normalized citation counts in the latest time interval. Landmark nodes can be identified by their large discs. The label size of each node is proportional to the citations of the article; thus, larger nodes also have larger-sized labels. The user can enlarge font sizes at will, and both the width and the length of a link are proportional to the corresponding co-citation coefficient. The color of a link indicates the earliest appearance time of the link with reference to the chosen thresholds [35]. The number of nodes is mainly filtered using the following procedure: time slicing, threshold setting. Firstly, time slicing includes two parameters: time span and time-slice length. The time span specifies the year of publication of the citation range, which is determined by the distribution of citation years and the time period of interest to the analyst. The length of a time slice is a division of the time span. The time slice of this article is not fixed to one year. Next, we changed the threshold setting in this article via the scale factor k in G-index to control the number of nodes too. G-index refers to the cumulative number of citations of g papers that have been ranked according to the number of citations. K is the proportional adjustment factor in the G-index, and, the larger the K, the more nodes that appear in the graph, and vice versa. Node size and label size mean the frequency of citations or occurrences of a node. The nodes are always displayed as citation tree-rings, representing the history of citations received by the underlying reference. Its color spectrum indicates the chronological order of occurrence of links and items. And, the tree rings with an outer purple ring indicate good betweenness centrality (no less than 0.1), which can be defined as Equation (1) [35].
C e n t r a l i t y n o d e   i = i j k ρ j k i ρ j k
In Equation (1), ρ j k presents the number of shortest paths between node j and node k, and ρ j k i presents the number of those paths that pass through node i. The betweenness centrality of a particular node or link measures the importance of the node or link in connecting any two nodes in the network. Therefore, a paper with high betweenness centrality is potentially transformative, and plays a “communication bridge” role in the network. The higher the centrality, the stronger the correlation and the greater the importance of the index. Burst detection generated the breakout words, the occurrence frequency of which, over a certain period of time, is unusually prominent, and can be used to determine the research hotspots [37]. In CiteSpace, pivotal points (nodes) in co-citation networks are identified based on their betweenness centrality. These points are cited with different co-citation clusters, and the co-citation clusters correspond to thematic structures. Therefore, points connecting different thematic structures are candidates for intellectual turning points [37]. In CiteSpace visualizations, burst properties are depicted with red rings. The presence of red rings on nodes indicates that a significant citation or occurrence burst was detected. In other words, there was a period of time in which citations to the reference increased sharply with respect to other references in the visualization map [37]. Modularity (Q) and Silhouette (S) are two cluster evaluation metrics. Q is used to evaluate whether the various research fields (the cluster) can be clearly defined; generally, Q > 0.3 means that the clustering structure is reliable. S can measure the homogeneity of cluster members. The larger the S, the higher the similarity of the cluster members.

3. Results and Discussion

3.1. General Analysis

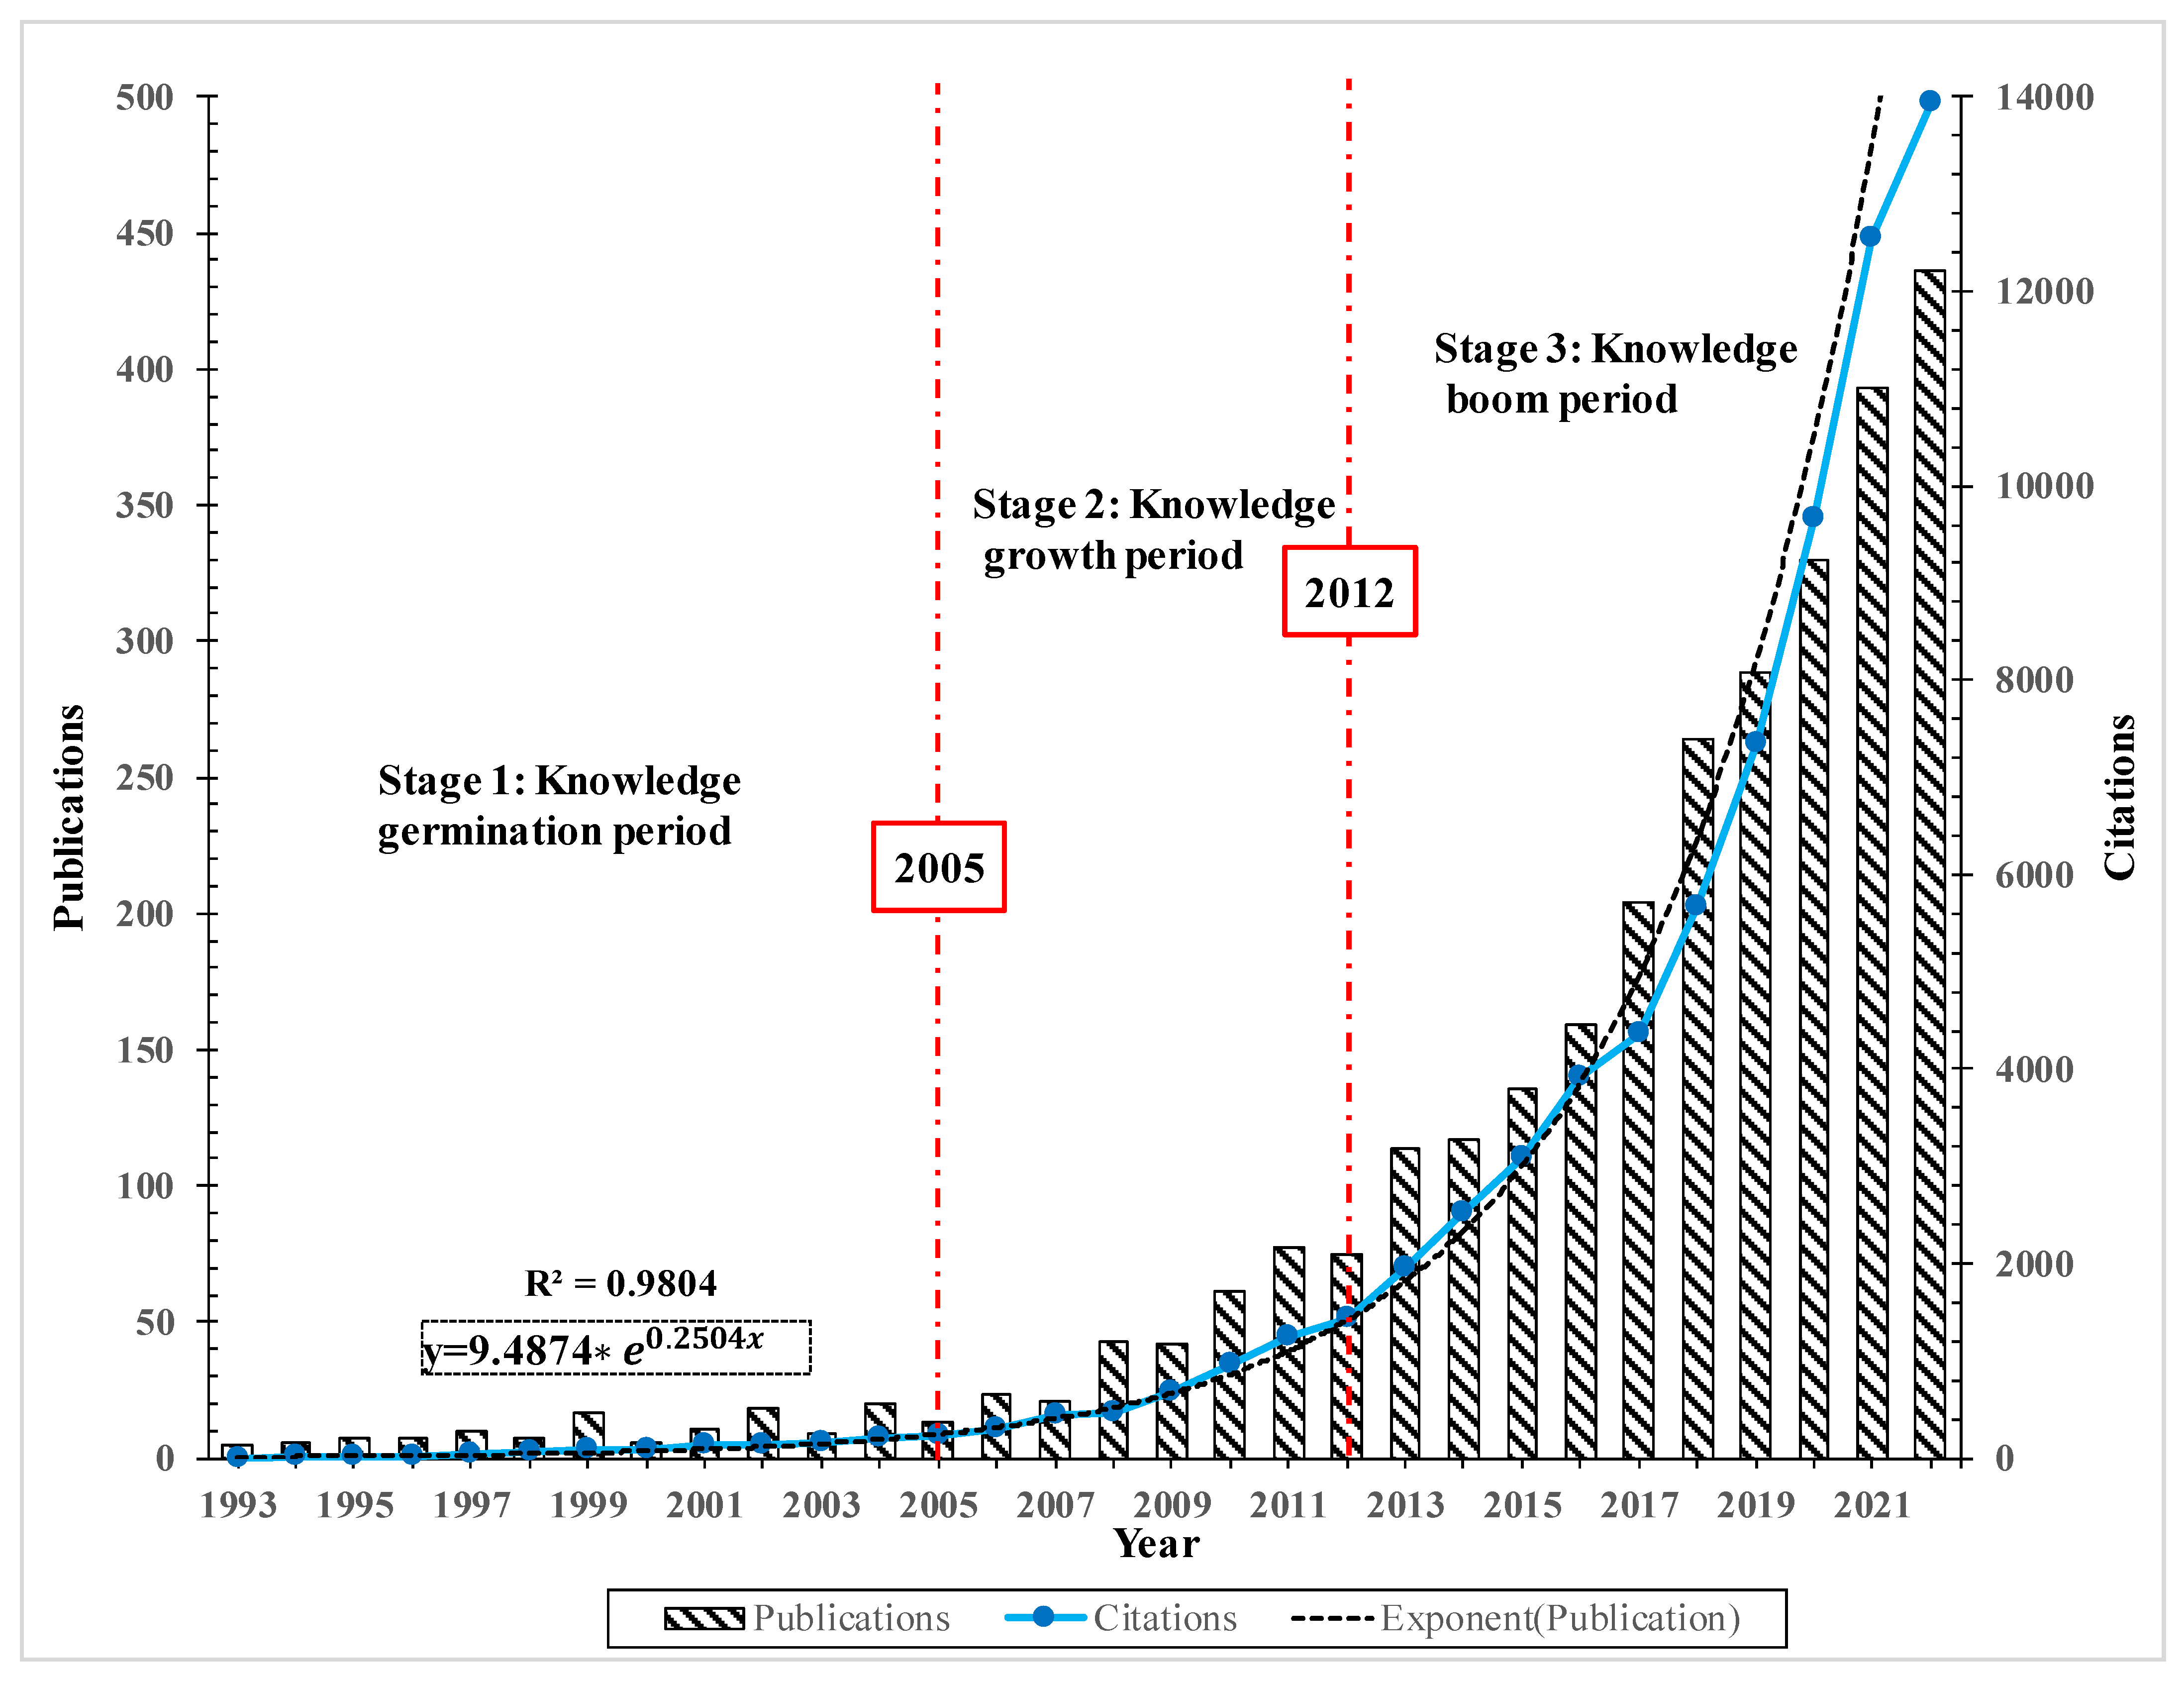
3.1.1. The Annual Trends of Publication Outputs

The annual publication quantity of articles and citations regarding irrigation effects on climate from 1993 to 2022 are shown in Figure 2. Since 1993, about 2919 source articles have been cited 71,790 times, with a citation frequency of 25.67 per article. Over the past three decades, the average annual growth rate of the number of articles is 17% and the overall annual publication trend follows an exponential distribution. Based on the annual publication trend of the published papers, the development of the field can be divided into three stages. Before 2006, the number of publications was about 10 per year, and the annual trend of publications was unstable, which suggests insufficient attention to and understanding of this topic. During 2006–2012, the number of annual publications ranged from 20 to 100, 11.7% of the total publications, with the fastest annual growth rate. And, the number of annual paper publications and citations increased substantially. In 2013, a rapidly developing stage of citations and publications appeared. The publication number increased dramatically from 114 in 2013 to 436 in 2022 with 83.6% of the total publications, while the citations grew from 1965 to 13940 with 90.6% of the total citation times. These shifts indicate that CEI study has entered a stage of prosperity development, owing to the early knowledge accumulation and outbreak of hot topics. Synthesizing the characteristics of the three stages, the knowledge germination period (1993–2005), knowledge accretion period (2006–2012), and knowledge prosperity period (2013–2022) can be identified, respectively.

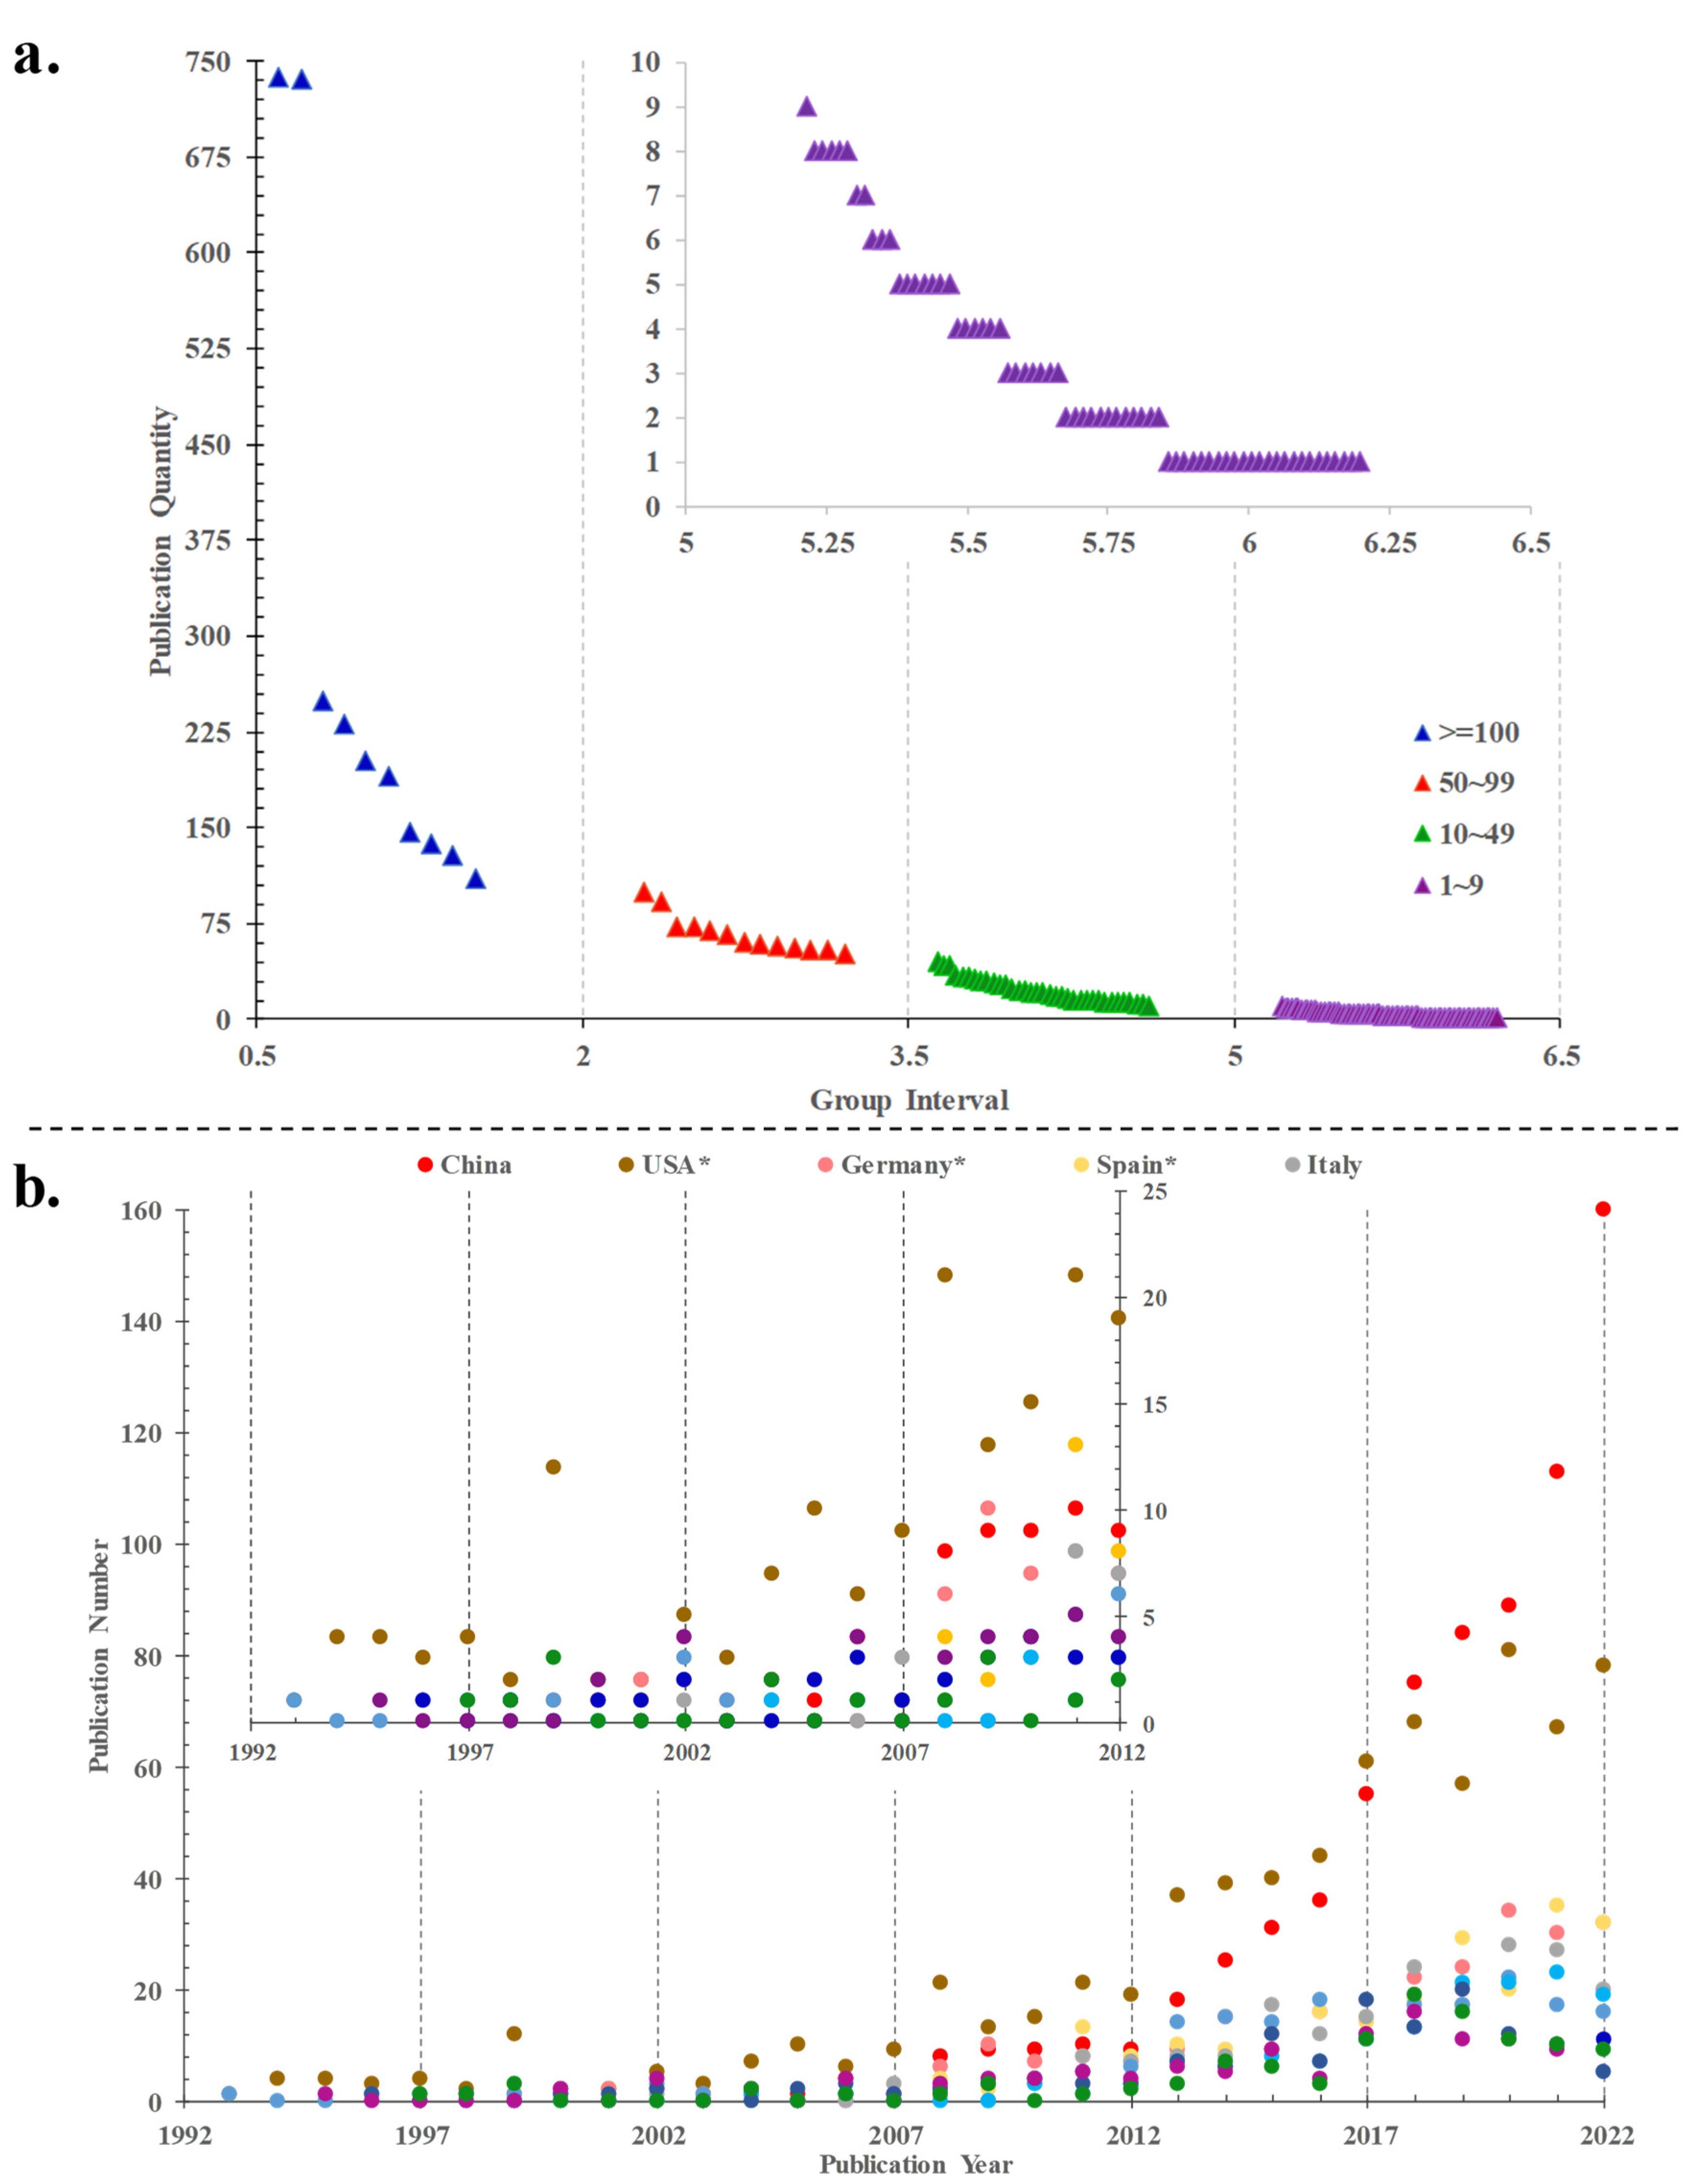
3.1.2. The Distribution Trends of Publication Outputs

In the distribution of meso citation topics, Table 1 displays the top five meso citation topics of publications in different publication years. Oceanography, meteorology and atmospheric sciences have been the popular citation themes in the past five years, and next are crop science and soil science. Additionally, these citation topics are relevant to the micro-citation topics of evapotranspiration, microbial biomass, elevated CO2, nitrous oxide, water governance, urban heat island, and grain yield. A dual-map overlay was designed to demonstrate and contrast the characteristics of publication portfolios. Figure 3 shows the dual-map overlay with annotations of the CEI research. The dual-map design enables an explicit, intuitive, and easy-to-interpret representation of citations made by a wide variety of publication portfolios. Thus, we can see the origin and direction of citations in a single, uninterrupted view. There are two global maps in the dual map: one for the citing map (left-side) and the other for the cited map (right-side) (Figure 3a) [38]. And, the Blondel clustering algorithm [39] is used to compute the trajectory for a set of publications at the level of individual journals or disciplines. In the citing map (left-side), the disciplines earth, geology, geophysics and plant, ecology, zoology have a high co-citation relationship. And, the disciplines of ecology, earth, marine and veterinary, animal, science on the citing side are mainly influenced by them (Figure 3b). In addition, based on WOS statistics, it was found that Agricultural Water Management (AWM) and Science of the Total Environment (SOTTE) are the top two most popular journals in the veterinary, animal, and science disciplines, with 185 and 114 published articles, respectively, and these two journals are also the most productive journals in the CEI research field. Additionally, Agricultural and Forest Meteorology (AFM) and the Journal of Hydrology (JH) are the top two most popular journals in the disciplines of ecology, earth, and marine with 67 and 72 published articles, respectively. In terms of the most cited articles, there is a brief table of the top 30 cited articles in the CEI field, containing information on the source of the literature, the publication year, and the citation frequency (Table 2). From these 30 top-cited articles, there are 6, 11, and 13 articles from the periods of knowledge germination, accretion, and prosperity, respectively, which indicates that more and more cutting-edge literature is becoming highly cited. The highest cited paper was published in 2019 by Chen in the journal of Nature Sustainability [40], and it shows that the farmlands in China and India are turning green, an indirect contribution of irrigation and fertilization. Therefore, in the future, it is more necessary to truly reflect human land-use practices in Earth system models [40].

3.2. Academic Impacts and Cooperation Analysis

Co-authorship networks are an important category of social networks and have been used extensively to determine the structure of scientific collaborations and the status of individual researchers [41]. The size of the circles represents the amount of publications of the authors (countries, institutions), and a shorter distance between two circles suggests more collaboration between individual authors (countries, institutions).

3.2.1. Co-Country Analyses

In this context, it can be seen that 125 countries have published general publications related to CEI research (Figure 4a). There only 10 countries that have published more than 100 articles, 8% of the total countries, but the countries with one to nine papers published are the most prevalent, accounting for 53.6% of the total number of countries. Therefore, the publication output of these countries is extremely unbalanced, since a large number of countries have published a small proportion of articles, while the majority of countries (most of them are economically backward countries) have published fewer papers. Figure 4b displays the annual publication trend of the top 10 most prolific countries, all of their publications covering 98% of the total number of articles. The leader in the general publication about CEI is China (except for Taiwan data) with 737 articles published, but the publication number of European and American countries is greater than that of Asia. During 1993–2012, the USA produced articles every year, and, with its European counterparts, published 374 articles, accounting for 86% of the total number of publications during the same period. The researches of CEI in China and India mainly focuses on the knowledge prosperity period. Between 2013 and 2022, China and India published 686 and 136 articles, respectively, both accounting for 93% of their total annual publications. In 2018, the number of publications surpassed that of the USA for the first time, and there is still a positive increasing trend now. Citation bursts, which refer to articles that have received sharp increases in citations, can in part reflect the dynamics of a field. Based on the analysis of CiteSpace’s countries co-authorship network, 8 of 125 have passed burst detection (Table 3). And, in the most prolific countries, the USA, Germany, Spain, Australia, and the Netherlands have strong citation bursts, which means they have received particular attention from the CEI scientific communities in 1993–2022 (Figure 4b).

3.2.2. Co-Institutes Analyses

Two authors’ institutes appear in the same article as one cooperation. CiteSpace software mainly judges cooperation based on the co-occurrence frequency matrix. Institution cooperation study choses the “institution” node with the scale factor k = 23 by pruning sliced networks; the institution co-authorship then generates 489 nodes (also known as institution) and 1361 links (Figure 5). There are three institutions with over 100 articles: the Chinese Academy of Sciences (CAS, records = 251, year = 2005), University of Chinese Academy of Sciences (UCAS, records = 110, year = 2006), and the United States Department of Agriculture (USDA, records = 107, year = 1995). CGIAR, CSIRO, USDA, and Columbia University all have a purple outer circle (betweenness centrality is no less than 0.1), which means they possess a good bridge connection function. Table 4 exhibits 30 nodes with a strong burstness (red ring), which indicates that these institutions have attracted significant attention within a short period of time by producing potentially interesting work. Sixteen out of the thirty high burstness institutions belong to the United States, and 80% of these institutions belong to the category of developed countries from European and American countries. Meanwhile, China, India, and Pakistan have become the main regions for CEI research in regard to Asian and African countries. Thus, it can be seen that cooperation between institutions in European and American countries in the field of CEI researches is more frequent and studies is more frequent and studies earlier than that between Asian countries.

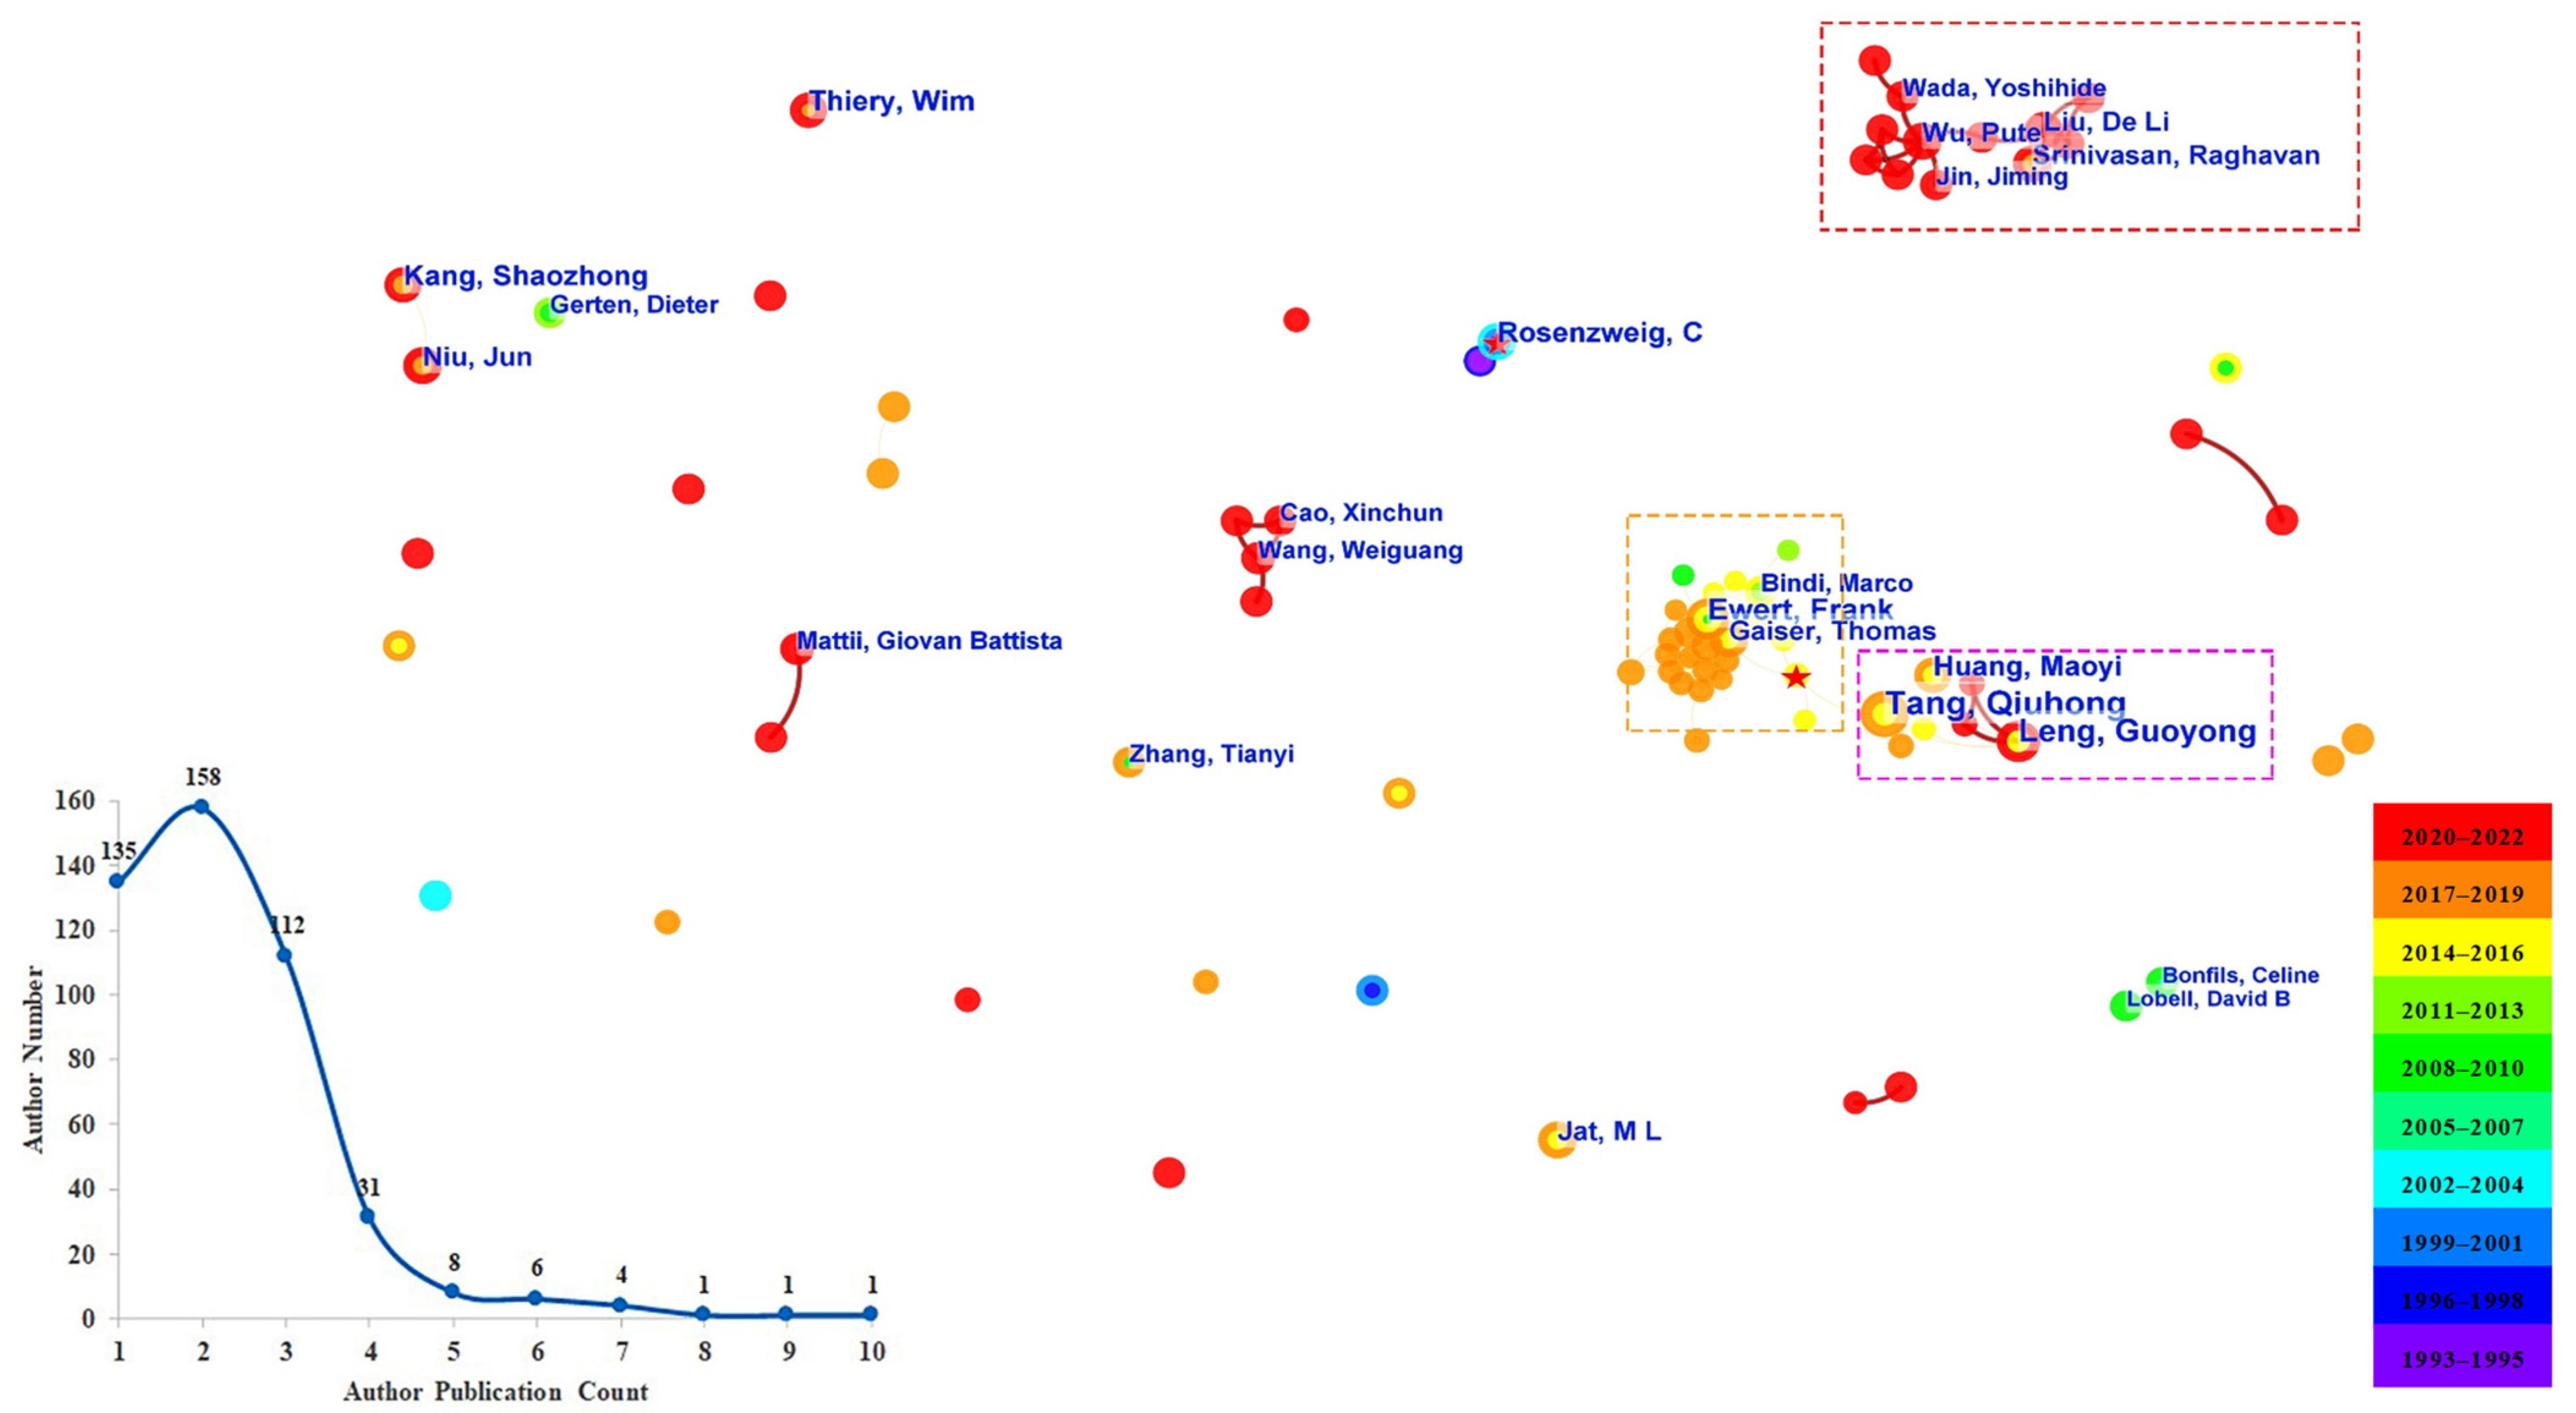
3.2.3. Co-Author Analyses

The author cooperation study chose the “author” node with a three-year time slice, and the institution co-authorship generated 457 nodes and 466 links, which reveal a lack of collaboration between many authors. According to the scatter plot located in the bottom left corner in Figure 6, most authors publish one to three relevant articles in the CEI field, accounting for 88.6% of collaborative author publications, while only 21 authors publish five or more articles. The shorter the distance between the two circles, the greater the cooperation between the two authors. Then, these prolific authors collaborate and closely connect with each other, becoming the core of the three co-authorship network with different colors of rectangles. Tang Qiuhong (count = 10) has the largest number of publications, followed by Leng Guoyong (count = 9). These two authors, along with Huang Maoyi (count = 7), composed the core of terrestrial hydrology and groundwater irrigation. Leng et al. [42] distinguished the similar/different characteristics between climate change and irrigation, which could provide guidance for determining effective measures for adapting to environmental changes induced by climate change and human water use. Ewert Frank, the third most productive author, led the yellow rectangle with the research theme of crop rotation. The red rectangle represented the latest co-author group, without a certain research subject. Liu Deli, Jin Jiming, Wang Weiguang, Mattii, Giovan Battista, Tang Qiuhong, and Srinivasan Raghavan guided the latest cooperation direction of the CEI field. Most of the collaborating authors mainly appear during the periods of knowledge accretion and knowledge prosperity. Lobell David B and Bonfils Celine are the main representative figures in the study of the climate effects of irrigation during the knowledge accretion period; they revealed the quantitative impacts of irrigation on regional temperature, heat index extremes, and future temperature trends [43].

3.3. Keyword Co-Occurrence Analyses

3.3.1. Thematic Trends Analyses

CiteSpace uses natural language processing to extract terms representing the topics of the papers. Keyword co-occurrence analysis is a method used to study the closeness of keywords and it can be used to detect the dominant topics, research hotspots, and frontier transitions of a knowledge domain [44,45]. To a certain extent, a high-frequency keyword reflects the research hotspot and research interests [35]. With the pathfinder clipping and the scale factor decreasing (k = 15) with a two-year slice, there are 465 nodes and 1619 links, with the modularity Q = 0.48 and Silhouette = 0.73 in the timeline diagram of the co-word network (Figure 7). Additionally, the keyword clusters are reliable and homogeneous. A large number of keywords are found in the low-frequency area, while a small number are in the high-frequency area which appears earlier. There are 231 keywords with a frequency of occurrence less than 10, accounting for 49.7% of all keyword nodes, and 199 keywords appear ten to one hundred times, accounting for 42.8% of all keyword nodes. Only 35 keywords appear more than 100 times, such as “climate change” (1381), “irrigation” (447), “growth” (327), “model” (326), “yield” (306), and “impacts” (305). There are 141, 91, and 233 keywords that appeared during the period of knowledge germination, knowledge accretion, and knowledge prosperity, respectively. It can be seen that more and more keywords are emerging in the CEI field, which indicates that the research in this field is constantly expanding and growing over the years. There are nine clusters in the co-word analysis (Table 5). Over time, the cross fusion between keyword nodes has also been significantly enhanced. The domain has evolved step by step from “risk assessment”, “soil temperature”, and “climate change” to “greenhouse gas emissions”, “food security”, “photosynthesis”, “water scarcity”, “irrigation management”, and “remote sensing”. In the period of knowledge germination, the thermal conditions and summer climates of urban parks under different greening conditions were also included in the CEI research scope for the first time [46]. Research on the impact of irrigation on agricultural climate change, crop growth, and soil nutrients is emerging [47,48,49]. “Climate change”, is an intellectual turning point and pivot point with good betweenness centrality, and it is a keyword that appears from 1995 to 2022. Even though the occurring frequency of “climate change” between 1993 and 2005 is 43, the assessment of the hydrological sensitivity to climate change [50,51], the development of water resource utilization models for climate management [52], and the study of the Palmer Drought Severity Index (PDSI) and the impact of climate and irrigation on hydrological phenomena [53] have laid the foundation for future developments in this topic. In recent years, the keyword, “climate change” has focused on an integrated approach for assessing past and future agricultural drought risks [51] and quantifying the hydrological cycle [54]. And, more recent research has paid more attention to “water scarcity” and “irrigation management”; therefore, water-saving irrigation, basin water resource allocation, and rainwater recycling have emerged over time.

3.3.2. Research Hotspots Analyses

There are 33 burst points that can be regarded as the emerging research directions across certain years (Table 6). The vast majority of burst keywords (31 of 33) appear during the periods of knowledge germination and knowledge accretion. And, according to the burst detection over the years, keywords, such as “carbon dioxide”, “model”, “climate”, “growth”, “temperature”, “biomass”, “global warming”, “CO2”, “global change”, “dynamics”, “adjustments”, “tallgrass prairie”, and “atmospheric CO2” have been emerged more than 10 years, which reflects that the CEI field is ongoing and expanding. Climate change (evaluated CO2, drought) [55], hydrological cycle changes (water availability), and additional carbon input (nutrients) [56,57,58] change the soil carbon cycle process of the ecosystem by affecting soil respiration. Through meta-analysis, these experimental results can quantitatively detect the impact and synergistic impact of global environmental and human factors on soil respiration, provide information for regional and global ecology and climate models, and predict the state of future ecosystems and climate systems [59]. The keyword of “carbon dioxide” has been present for 21 years of burst detection, and the keyword of “swat model” is in an upward phase. Therefore, there will be more and more research on the impacts of the carbon footprint, ecosystem services, as well as intensive agricultural management [60,61].

3.4. The Knowledge Base and Intellectual Structure Analysis

In CiteSpace, the widely cited journals, authors, and papers are the reference track of the knowledge frontier, i.e., knowledge base, continuously providing knowledge for follow-up research, and promoting field development [62]. We applied Document Co-citation Analysis (DCA) to analyze the knowledge base of the CEI field. In DCA, a larger size of the node reflects a higher co-citation frequency, and the link between two nodes represents a co-citation relationship. By setting the scale factor k equal to 17, with a five-year time slice and network pruning, there generates 492 reference nodes and 618 edges with S = 0.95, Q = 0.89, which indicates the reasonable uniformity networks of DCA. We only labeled the top two most highly cited references and the turning point (the nodes with outer purple circles) in each cluster (Figure S1). From Figure S1, the intersection between the nodes are stronger, and the number and scale of clusters more increasing. The first cited documents in this paper are authored by Adams and Reid; both of them published their studies in 1990 [63,64]. The latest cited reference is the AR6 Climate Change 2021, published by IPCC. Considering the knowledge development stage of the cited references in regard to the year of publication, during the knowledge prosperity period, there were 215 references, while during the knowledge budding period, there were only 124 references. Over time, the knowledge structure and intellectual foundation have been further improved. There are 25 references in the DCA with the strongest citation bursts, and their mutation years have all exceeded five years (Table S1). Among them, only two articles are in the period of knowledge germination; however, the database of monthly climate observations from meteorological stations constructed by Mitchell [65] and the research on the impact of land cover change on future climates [66] play an important role in future CEI research.
We have revealed the timeline chart of the intellectual base of the CEI field (Figure 8). The intellectual base of the CEI field has covered topics from cropland management, global irrigation, socio-economic scenario, irrigation water supply, agricultural irrigation, crop rotation, global surface to paddy field expansion, grape composition, groundwater recharge, cotton production, semi-arid condition, water footprint, and the WRF-Noah model system. And, regarding the impacts of irrigation on climate research, according to the cluster size, there are many references in the cotton production (C = 39) field, followed by the semi-arid condition (C = 31), and irrigation water supply (C = 29). In general, the knowledge base of the CEI field has two branches: one is based on the impact of ecosystem carbon cycle dynamic change on the climate–ecology system interaction (indirect methods), and the other is based on the impact of land-use management on hydrology and land–atmospheric exchange (direct methods). On the one hand, improvements in irrigation practices could widely compensate for the production losses of irrigated cropland in the world [67,68]. Crop growth and production will change the soil carbon cycle, soil carbon respiration, and the water resource allocation pattern, and will further affect the soil–crop–atmosphere system, thus affecting climate. One study found that an increase of one degree Celsius in global mean temperature would, on average, reduce the global yields of wheat by 6%, rice by 3.2%, maize by 7.4%, and soybean by 3.1% [69]. On the other hand, early research has found that the regional surface energy distribution is very sensitive to increased irrigation [70], and it has a direct influence on water vapor concentration, runoff, and evapotranspiration [12,71]. In this paper, we focus on the direct methods. In 1993–2005, the development of a global irrigation map [72] and crop geographical distribution maps [73] greatly promotes the research on global irrigation, and these can be regarded as milestone articles, for which the citation times over a certain period of time are unusually prominent. With the global irrigation map, a regional climate model demonstrated the existence of regional irrigation cooling effects, and the past expansion of irrigated land likely affected the surface temperature [17]. Furthermore, by applying new irrigation schemes to a numerical weather prediction model (NWP), it enable the capture of land–atmosphere feedback in agricultural managed lands more accurately, and thus improves our climate forecasting skills [74]. Emerging scientific evidence not only indicates that irrigation substantially affects the mean climate conditions in different regions of the world, but it also has a significant impact on extreme temperatures, further proving that the local effects of land management are far more important than previously thought, and that we should consider irrigation schemes actively in future regional climate models, such as the WRF-Noah model [24] (Figure 8). The risk of severe drought in California has already increased due to extremely warm conditions induced by anthropogenic global warming, which has called for scholars to pay more attention to the impact of human water management on extreme climate [75]. An idealized global climate model was used to simulate the potential of land-use management schemes (irrigation and crop albedo enhancement) in influencing regional climate [76]. Irrigation could moderate the harmful impact of heat stress on agriculture, but over time its effectiveness declined [67,77], and so the humid and thermal stresses of irrigation have not been reduced in densely populated areas, such as the central United States and the Middle East [78]. Similarly, the cooling effect of irrigation can also play a role in the urban heat island effect [79,80].

4. Conclusions

In this article, we used a scientometric analysis to explore the overall publication outputs of the CEI field from the WSCC database covering the time period from 1993 to 2022. This paper objectively shows the discipline distribution mapping, academic impacts, historical knowledge process, and future frontier development of CEI research via the use of a visual analysis software, CiteSpace. The results are summarized as follows:
CEI research is undoubtedly very popular and fresh, and 2919 publications have been cited more than 70,000 times, attracting numerous scholars and institutions to conduct relevant research. Academic impact evaluation offers a comprehensive and thorough co-authorship analysis of the major countries, universities, authors, and other stakeholders. A large quantity of the published literature is published by a small number of academic groups, exerting an important influence, while a large number of academic groups have published a small amount of literature. China and the USA are the leaders in the general publication of research about CEI. Four of the five strongest citation burst institutions belong to developed countries in Europe and America, and can indicate that high academic influence may be related to economic level. During the research time span (1993–2022), CEI has gone through the knowledge germination stage, knowledge accretion stage, and the knowledge prosperity stage, respectively. Although the number of publications on CEI was not abundant in the stages of knowledge germination and knowledge accretion, the milestone papers on land management changes and irrigation experiments assisted in the development of various research topics during the knowledge prosperity period. For example, the global map of irrigation areas [72], and the irrigation cooling effects studies [18] play an important role in evaluating and constructing global hydrological models, ecosystem models, crop models and climate models by considering agricultural management measures or human land management [24,81,82,83] activities. Ecology, earth, and marine can be considered the most influential disciplines of research in this field, and they have been influenced by earth, geology, geophysics and plant, ecology, zoology. AWM has become the most popular journal currently. The CEI research themes have experienced topics from “risk assessment”, “soil temperature”, and “climate change” to “greenhouse gas emissions”, “food security”, “photosynthesis”, “water scarcity”, “irrigation management”, and “remote sensing”. The keywords of “carbon dioxide”, “model”, “climate”, “growth”, “temperature”, “biomass”, “global warming”, “CO2”, “global change”, “dynamics”, “adjustments”, “tallgrass prairie”, and “atmospheric CO2” have been emerging topics in the past decades of the keyword co-occurrence network, and will also further impact future researches. The knowledge base structure of the CEI field shows that land management measures (irrigation, irrigation expansion, fertigation, and so on) have a feedback effect on climate by affecting ecological, hydrological, and terrestrial–atmosphere exchange processes [26,79,84] such as crop growth, soil respiration, runoff change, soil temperature, and vapor pressure deficit.
Based on existing research, in the future, we believe that further efforts will be made to consider and optimize the application of human land management schemes in Earth system models, such as irrigation, fertilization, conservation tillage, film mulching, crop rotation. To some extent, the land-use management schemes can be good practices to guarantee global food security, improve the urban heat island effect, and promote sustainable ecological and social development.
In summary, the results and perspectives of this study directly reflect the domain evolution and knowledge structure of CEI research. Therefore, it may generate more research interest about the effects of irrigation on climate.

Supplementary Materials

The following supporting information can be downloaded at: https://www.mdpi.com/article/10.3390/agronomy13102482/s1, Figure S1: The document co-citation analysis (DCA) network of the CEI field; Table S1: The top 25 references with the strongest citation bursts.

Author Contributions

Conceptualization, S.H. and M.W.; methodology, S.H.; software, S.H.; validation, S.H. and M.W.; formal analysis, S.H. and C.W.; investigation, S.H. and D.Y.; resources, S.H. and C.W.; writing—original draft preparation, S.H.; writing—review and editing, C.W. and D.Y.; supervision, S.L.; funding acquisition, S.L. All authors have read and agreed to the published version of the manuscript.

Funding

The authors would like to thank the National Key Research and Development Program of China: 2022YFD1900801 and the National Key Research and Development Program of China: 2022YFC3002802, for their great contributions to this work.

Data Availability Statement

Not applicable.

Conflicts of Interest

The authors declare that they have no known competing financial interest or personal relationships that could have appeared to influence the work reported in this paper.

References

  1. NCEP. The United Nations World Water Development Report 2021: Valuing Water; NCEP: College Park, MD, USA, 2021.
  2. Kundzewicz, Z.W. Climate change impacts on the hydrological cycle. Ecohydrol. Hydrobiol. 2008, 8, 195–203. [Google Scholar] [CrossRef]
  3. Zou, L.; Xia, J.; She, D. Analysis of Impacts of Climate Change and Human Activities on Hydrological Drought: A Case Study in the Wei River Basin, China. Water Resour. Manag. 2018, 32, 1421–1438. [Google Scholar] [CrossRef]
  4. Cassardo, C.; Park, S.K.; Galli, M.; Sungmin, O. Climate change over the high-mountain versus plain areas: Effects on the land surface hydrologic budget in the Alpine area and northern Italy. Hydrol. Earth Syst. Sci. 2018, 22, 3331–3350. [Google Scholar] [CrossRef]
  5. Liuzzo, L.; Noto, L.V.; Arnone, E.; Caracciolo, D.; La Loggia, G. Modifications in Water Resources Availability Under Climate Changes: A Case Study in a Sicilian Basin. Water Resour. Manag. 2015, 29, 1117–1135. [Google Scholar] [CrossRef]
  6. Yoshioka, Y.; Nakamura, K.; Horino, H.; Kawashima, S. Numerical assessments of the impacts of climate change on regional groundwater systems in a paddy-dominated alluvial fan. Paddy Water Environ. 2016, 14, 93–103. [Google Scholar] [CrossRef]
  7. Cohen, S.J.; Miller, K.A.; Hamlet, A.F.; Avis, W. Climate Change and Resource Management in the Columbia River Basin. Water Int. 2000, 25, 253–272. [Google Scholar] [CrossRef]
  8. UN-Water Policy Brief on Climate Change and Water. 2019. Available online: https://www.unwater.org/water-facts/water-and-climate-change (accessed on 8 March 2023).
  9. United Nations Environment Programme. Climate Change, Water Scarcity and Security. 2021. Available online: https://www.unep.org/news-and-stories/speech/climate-change-water-scarcity-and-security (accessed on 8 March 2023).
  10. Doell, P.; Siebert, S. Global modeling of irrigation water requirements. Water Resour. Res. 2002, 38, 1–10. [Google Scholar] [CrossRef]
  11. Hof, A.; Wolf, N. Estimating potential outdoor water consumption in private urban landscapes by coupling high-resolution image analysis, irrigation water needs and evaporation estimation in Spain. Landsc. Urban Plan. 2014, 123, 61–72. [Google Scholar] [CrossRef]
  12. Boucher, O.; Myhre, G.; Myhre, A. Direct human influence of irrigation on atmospheric water vapour and climate. Clim. Dyn. 2004, 22, 597–603. [Google Scholar] [CrossRef]
  13. Cook, B.I.; Shukla, S.P.; Puma, M.J.; Nazarenko, L.S. Irrigation as an historical climate forcing. Clim. Dyn. 2015, 44, 1715–1730. [Google Scholar] [CrossRef]
  14. Puma, M.J.; Cook, B.I. Effects of irrigation on global climate during the 20th century. J. Geophys. Res. Atmos. 2010, 115, D16. [Google Scholar] [CrossRef]
  15. Siebert, S.; Burke, J.; Faures, J.M.; Frenken, K.; Hoogeveen, J.; Döll, P.; Portmann, F.T. Groundwater use for irrigation—A global inventory. Hydrol. Earth Syst. Sci. 2010, 14, 1863–1880. [Google Scholar] [CrossRef]
  16. Douglas, E.M.; Niyogi, D.; Frolking, S.; Yeluripati, J.B.; Pielke, R.A., Sr.; Niyogi, N.; Vörösmarty, C.J.; Mohanty, U.C. Changes in moisture and energy fluxes due to agricultural land use and irrigation in the Indian Monsoon Belt. Geophys. Res. Lett. 2006, 33, L14403. [Google Scholar] [CrossRef]
  17. Kueppers, L.M.; Snyder, M.A.; Sloan, L.C. Irrigation cooling effect: Regional climate forcing by land-use change. Geophys. Res. Lett. 2007, 34, L03703. [Google Scholar] [CrossRef]
  18. Sacks, W.J.; Cook, B.I.; Buenning, N.; Levis, S.; Helkowski, J.H. Effects of global irrigation on the near-surface climate. Clim. Dyn. 2009, 33, 159–175. [Google Scholar] [CrossRef]
  19. Trost, B.; Prochnow, A.; Drastig, K.; Meyer-Aurich, A.; Ellmer, F.; Baumecker, M. Irrigation, soil organic carbon and N2O emissions. A review. Agron. Sustain. Dev. 2013, 33, 733–749. [Google Scholar] [CrossRef]
  20. Wu, L.; Feng, J.; Miao, W. Simulating the Impacts of Irrigation and Dynamic Vegetation Over the North China Plain on Regional Climate. J. Geophys. Res. Atmos. 2018, 123, 8017–8034. [Google Scholar] [CrossRef]
  21. Yang, B.; Zhang, Y.; Qian, Y.; Tang, J.; Liu, D. Climatic effects of irrigation over the Huang-Huai-Hai Plain in China simulated by the weather research and forecasting model. J. Geophys. Res. Atmos. 2016, 121, 2246–2264. [Google Scholar] [CrossRef]
  22. Gong, J.; Xu, S.; Wang, Y.; Luo, Q.; Liu, M.; Zhang, W. Effect of irrigation on the soil respiration of constructed grasslands in Inner Mongolia, China. Plant Soil 2015, 395, 159–172. [Google Scholar] [CrossRef]
  23. Norero, A.L.; Ashcroft, G.L.; Keller, J. Effect of irrigation frequency on the average evapotranspiration of various crop-climate-soil systems. Trans. ASAE 1972, 15, 662–666. [Google Scholar] [CrossRef]
  24. Thiery, W.; Davin, E.L.; Lawrence, D.M.; Hirsch, A.L.; Hauser, M.; Seneviratne, S.I. Present-day irrigation mitigates heat extremes. J. Geophys. Res. Atmos. 2017, 122, 1403–1422. [Google Scholar] [CrossRef]
  25. Alter, R.E.; Im, E.-S.; Eltahir, E.A.B. Rainfall consistently enhanced around the Gezira Scheme in East Africa due to irrigation. Nat. Geosci. 2015, 8, 763–767. [Google Scholar] [CrossRef]
  26. Xu, L.; Shi, Z.; Wang, Y.; Chu, X.; Yu, P.; Xiong, W.; Zuo, H.; Zhang, S. Agricultural irrigation-induced climatic effects: A case study in the middle and southern Loess Plateau area, China. Int. J. Climatol. 2017, 37, 2620–2632. [Google Scholar] [CrossRef]
  27. Wang, C.; Wang, Z.; Yang, J. Urban water capacity: Irrigation for heat mitigation. Comput. Environ. Urban Syst. 2019, 78, 101397. [Google Scholar] [CrossRef]
  28. Broadbent, A.M.; Coutts, A.M.; Tapper, N.J.; Demuzere, M. The cooling effect of irrigation on urban microclimate during heatwave conditions. Urban Clim. 2018, 23, 309–329. [Google Scholar] [CrossRef]
  29. Guimberteau, M.; Laval, K.; Perrier, A.; Polcher, J. Global effect of irrigation and its impact on the onset of the Indian summer monsoon. Clim. Dyn. 2012, 39, 1329–1348. [Google Scholar] [CrossRef]
  30. Yang, D.; Li, S.; Kang, S.; Du, T.; Guo, P.; Mao, X.; Tong, L.; Hao, X.; Ding, R.; Niu, J. Effect of drip irrigation on wheat evapotranspiration, soil evaporation and transpiration in Northwest China. Agric. Water Manag. 2020, 232, 106001. [Google Scholar] [CrossRef]
  31. Kang, S.; Eltahir, E.A.B. North China Plain threatened by deadly heatwaves due to climate change and irrigation. Nat. Commun. 2018, 9, 2894. [Google Scholar] [CrossRef]
  32. Nalimov, V.V.; Mul’chenko, Z.M. Measurement of Science: Study of the Development of Science as an Information Process; Hill, R.D., Ed.; Drexel University Library, Foreign Technology Division: Philadelphia, PA, USA, 1971. [Google Scholar]
  33. Chen, X.; Liu, Y. Visualization analysis of high-speed railway research based on CiteSpace. Transp. Policy 2020, 85, 1–17. [Google Scholar] [CrossRef]
  34. Chen, C.; Ibekwe-SanJuan, F.; Hou, J. The structure and dynamics of cocitation clusters: A multiple-perspective cocitation analysis. J. Am. Soc. Inf. Sci. Technol. 2010, 61, 1386–1409. [Google Scholar] [CrossRef]
  35. Chen, C. Searching for intellectual turning points: Progressive knowledge domain visualization. Proc. Natl. Acad. Sci. USA 2004, 101 (Suppl. S1), 5303–5310. [Google Scholar] [CrossRef]
  36. Chen, C. Science Mapping: A Systematic Review of the Literature. J. Data Inf. Sci. 2017, 2, 1–40. [Google Scholar] [CrossRef]
  37. Chen, C.; Chen, Y.; Horowitz, M.; Hou, H.; Liu, Z.; Pellegrino, D. Towards an explanatory and computational theory of scientific discovery. J. Informetr. 2009, 3, 191–209. [Google Scholar] [CrossRef]
  38. Chen, C.; Leydesdorff, L. Patterns of connections and movements in dual-map overlays: A new method of publication portfolio analysis. J. Assoc. Inf. Sci. Technol. 2014, 65, 334–351. [Google Scholar] [CrossRef]
  39. Blondel, V.D.; Guillaume, J.-L.; Lambiotte, R.; Lefebvre, E. Fast unfolding of communities in large networks. J. Stat. Mech. Theory Exp. 2008, 2008, P10008. [Google Scholar] [CrossRef]
  40. Chen, C.; Park, T.; Wang, X.; Piao, S.; Xu, B.; Chaturvedi, R.K.; Fuchs, R.; Brovkin, V.; Ciais, P.; Fensholt, R.; et al. China and India lead in greening of the world through land-use management. Nat. Sustain. 2019, 2, 122–129. [Google Scholar] [CrossRef]
  41. Liu, X.; Bollen, J.; Nelson, M.L.; Van de Sompel, H. Co-authorship networks in the digital library research community. Inf. Process. Manag. 2005, 41, 1462–1480. [Google Scholar] [CrossRef]
  42. Leng, G.; Tang, Q.; Huang, M.; Leung, L.-y.R. A comparative analysis of the impacts of climate change and irrigation on land surface and subsurface hydrology in the North China Plain. Reg. Environ. Chang. 2015, 15, 251–263. [Google Scholar] [CrossRef]
  43. Lobell, D.B.; Bonfils, C. The Effect of Irrigation on Regional Temperatures: A Spatial and Temporal Analysis of Trends in California, 1934–2002. J. Clim. 2008, 21, 2063–2071. [Google Scholar] [CrossRef]
  44. Peng, Z.; Hu, Z. A bibliometric analysis of linguistic research on COVID-19. Front. Psychol. 2022, 13, 1005487. [Google Scholar] [CrossRef]
  45. Ouyang, W.; Wang, Y.; Lin, C.; He, M.; Hao, F.; Liu, H.; Zhu, W. Heavy metal loss from agricultural watershed to aquatic system: A scientometrics review. Sci. Total Environ. 2018, 637–638, 208–220. [Google Scholar] [CrossRef] [PubMed]
  46. Spronken-Smith, R.A.; Oke, T.R. The thermal regime of urban parks in two cities with different summer climates. Int. J. Remote Sens. 1998, 19, 2085–2104. [Google Scholar] [CrossRef]
  47. Aggarwal, P.K.; Mall, R.K. Climate Change and Rice Yields in Diverse Agro-Environments of India. II. Effect of Uncertainties in Scenarios and Crop Models on Impact Assessment. Clim. Chang. 2002, 52, 331–343. [Google Scholar] [CrossRef]
  48. Kimball, B.A.; Mauney, J.R. Response of Cotton to Varying COz, Irrigation, and Nitrogen: Yield and Growth. Agron. J. 1993, 85, 706–712. [Google Scholar] [CrossRef]
  49. Reddy, K.R.; Prashant, R.D.; Linda, O.M.; Mariquita, Y.L.B.; Harry, F.H.; Alec, G.R.; Vijaya Gopal, K. Simulating the impacts of climate change on cotton production in the Mississippi Delta. Clim. Res. 2002, 22, 271–281. [Google Scholar] [CrossRef]
  50. Pl, F.; Alexander, L.; Della-Marta, P.; Gleason, B.; Haylock, M.; Klein, T.; Tc, P. Observed coherent changes in climatic extremes during 2nd half of the 20th century. Clim. Res. 2002, 19. [Google Scholar] [CrossRef]
  51. Yu, C.; Huang, X.; Chen, H.; Huang, G.; Ni, S.; Wright, J.S.; Hall, J.; Ciais, P.; Zhang, J.; Xiao, Y.; et al. Assessing the Impacts of Extreme Agricultural Droughts in China Under Climate and Socioeconomic Changes. Earth’s Future 2018, 6, 689–703. [Google Scholar] [CrossRef]
  52. Arnold, J.G.; Srinivasan, R.; Muttiah, R.S.; Williams, J.R. Large Area Hydrologic Modeling And Assessment Part I: Model Development. JAWRA J. Am. Water Resour. Assoc. 1998, 34, 73–89. [Google Scholar] [CrossRef]
  53. Eheart, J.W.; Wildermuth, A.J.; Herricks, E.E. The Effects of Climate Change and Irrigation on Criterion Low Streamflows Used for Determining Total Maximum Daily Loads. JAWRA J. Am. Water Resour. Assoc. 1999, 35, 1365–1372. [Google Scholar] [CrossRef]
  54. Li, X.; Cheng, G.; Ge, Y.; Li, H.; Han, F.; Hu, X.; Tian, W.; Tian, Y.; Pan, X.; Nian, Y.; et al. Hydrological Cycle in the Heihe River Basin and Its Implication for Water Resource Management in Endorheic Basins. J. Geophys. Res. Atmos. 2018, 123, 890–914. [Google Scholar] [CrossRef]
  55. Cleveland, C.C.; Wieder, W.R.; Reed, S.C.; Townsend, A.R. Experimental drought in a tropical rain forest increases soil carbon dioxide losses to the atmosphere. Ecology 2010, 91, 2313–2323. [Google Scholar] [CrossRef] [PubMed]
  56. Vasconcelos, S.S.; Zarin, D.J.; Capanu, M.; Littell, R.; Davidson, E.A.; Ishida, F.Y.; Santos, E.B.; Araújo, M.M.; Aragão, D.V.; Rangel-Vasconcelos, L.G.T.; et al. Moisture and substrate availability constrain soil trace gas fluxes in an eastern Amazonian regrowth forest. Glob. Biogeochem. Cycles 2004, 18. [Google Scholar] [CrossRef]
  57. Xiao, C.; Janssens, I.A.; Liu, P.; Zhou, Z.; Sun, O.J. Irrigation and enhanced soil carbon input effects on below-ground carbon cycling in semiarid temperate grasslands. New Phytol. 2007, 174, 835–846. [Google Scholar] [CrossRef] [PubMed]
  58. Ruehr, N.K.; Martin, J.G.; Law, B.E. Effects of water availability on carbon and water exchange in a young ponderosa pine forest: Above- and belowground responses. Agric. For. Meteorol. 2012, 164, 136–148. [Google Scholar] [CrossRef]
  59. Zhou, L.; Zhou, X.; Shao, J.; Nie, Y.; He, Y.; Jiang, L.; Wu, Z.; Hosseini Bai, S. Interactive effects of global change factors on soil respiration and its components: A meta-analysis. Glob. Chang. Biol. 2016, 22, 3157–3169. [Google Scholar] [CrossRef]
  60. Chen, X.; Jeong, S.-J. Irrigation enhances local warming with greater nocturnal warming effects than daytime cooling effects. Environ. Res. Lett. 2018, 13, 024005. [Google Scholar] [CrossRef]
  61. Zhang, X.; Pu, C.; Zhao, X.; Xue, J.; Zhang, R.; Nie, Z.; Chen, F.; Lal, R.; Zhang, H. Tillage effects on carbon footprint and ecosystem services of climate regulation in a winter wheat–summer maize cropping system of the North China Plain. Ecol. Indic. 2016, 67, 821–829. [Google Scholar] [CrossRef]
  62. Mustafee, N.; Katsaliaki, K.; Fishwick, P. Exploring the modelling and simulation knowledge base through journal co-citation analysis. Scientometrics 2014, 98, 2145–2159. [Google Scholar] [CrossRef]
  63. Adams, R.M.; Rosenzweig, C.; Peart, R.M.; Ritchie, J.T.; McCarl, B.A.; Glyer, J.D.; Curry, R.B.; Jones, J.W.; Boote, K.J.; Allen, L.H. Global climate change and US agriculture. Nature 1990, 345, 219–224. [Google Scholar] [CrossRef]
  64. Reid, J.B. Growth and water use of faba beans (Vicia faba) in a subhumid climate II. Simulation analysis of crop responses to drought. Field Crops Res. 1990, 23, 19–38. [Google Scholar] [CrossRef]
  65. Mitchell, T.D.; Jones, P.D. An improved method of constructing a database of monthly climate observations and associated high-resolution grids. Int. J. Climatol. 2005, 25, 693–712. [Google Scholar] [CrossRef]
  66. Feddema, J.; Oleson, K.; Bonan, G.; Mearns, L.; Buja, L.; Meehl, G.; Washington, W. The Importance of Land-Cover Change in Simulating Future Climates. Science 2006, 310, 1674–1678. [Google Scholar] [CrossRef] [PubMed]
  67. Birthal, P.S.; Hazrana, J.; Negi, D.S.; Pandey, G. Benefits of irrigation against heat stress in agriculture: Evidence from wheat crop in India. Agric. Water Manag. 2021, 255, 106950. [Google Scholar] [CrossRef]
  68. Jägermeyr, J.; Pastor, A.; Biemans, H.; Gerten, D. Reconciling irrigated food production with environmental flows for Sustainable Development Goals implementation. Nat. Commun. 2017, 8, 15900. [Google Scholar] [CrossRef] [PubMed]
  69. Zhao, C.; Liu, B.; Piao, S.; Wang, X.; Lobell, D.B.; Huang, Y.; Huang, M.; Yao, Y.; Bassu, S.; Ciais, P.; et al. Temperature increase reduces global yields of major crops in four independent estimates. Proc. Natl. Acad. Sci. USA 2017, 114, 9326–9331. [Google Scholar] [CrossRef]
  70. Adegoke, J.O.; Pielke, R.A.; Eastman, J.; Mahmood, R.; Hubbard, K.G. Impact of Irrigation on Midsummer Surface Fluxes and Temperature under Dry Synoptic Conditions: A Regional Atmospheric Model Study of the U.S. High Plains. Mon. Weather Rev. 2003, 131, 556–564. [Google Scholar] [CrossRef]
  71. Haddeland, I.; Lettenmaier, D.P.; Skaugen, T. Effects of irrigation on the water and energy balances of the Colorado and Mekong river basins. J. Hydrol. 2006, 324, 210–223. [Google Scholar] [CrossRef]
  72. Siebert, S.; Döll, P.; Hoogeveen, J.; Faures, J.M.; Frenken, K.; Feick, S. Development and validation of the global map of irrigation areas. Hydrol. Earth Syst. Sci. 2005, 9, 535–547. [Google Scholar] [CrossRef]
  73. Leff, B.; Ramankutty, N.; Foley, J.A. Geographic distribution of major crops across the world. Glob. Biogeochem. Cycles 2004, 18. [Google Scholar] [CrossRef]
  74. Ozdogan, M.; Rodell, M.; Beaudoing, H.K.; Toll, D.L. Simulating the Effects of Irrigation over the United States in a Land Surface Model Based on Satellite-Derived Agricultural Data. J. Hydrometeorol. 2010, 11, 171–184. [Google Scholar] [CrossRef]
  75. Mann, M.E.; Gleick, P.H. Climate change and California drought in the 21st century. Proc. Natl. Acad. Sci. USA 2015, 112, 3858–3859. [Google Scholar] [CrossRef]
  76. Hirsch, A.L.; Wilhelm, M.; Davin, E.L.; Thiery, W.; Seneviratne, S.I. Can climate-effective land management reduce regional warming? J. Geophys. Res. Atmos. 2017, 122, 2269–2288. [Google Scholar] [CrossRef]
  77. Mishra, V.; Ambika, A.K.; Asoka, A.; Aadhar, S.; Buzan, J.; Kumar, R.; Huber, M. Moist heat stress extremes in India enhanced by irrigation. Nat. Geosci. 2020, 13, 722–728. [Google Scholar] [CrossRef]
  78. Krakauer, N.Y.; Cook, B.I.; Puma, M.J. Effect of irrigation on humid heat extremes. Environ. Res. Lett. 2020, 15, 094010. [Google Scholar] [CrossRef]
  79. Yang, Y.; Smith, J.; Yang, L.; Baeck, M.L.; Ni, G. Regional Impacts of Urban Irrigation on Surface Heat Fluxes and Rainfall in Central Arizona. J. Geophys. Res. Atmos. 2019, 124, 6393–6410. [Google Scholar] [CrossRef]
  80. Gao, K.; Santamouris, M.; Feng, J. On the cooling potential of irrigation to mitigate urban heat island. Sci. Total Environ. 2020, 740, 139754. [Google Scholar] [CrossRef]
  81. Karstens, K.; Bodirsky, B.L.; Dietrich, J.P.; Dondini, M.; Heinke, J.; Kuhnert, M.; Müller, C.; Rolinski, S.; Smith, P.; Weindl, I.; et al. Management-induced changes in soil organic carbon on global croplands. Biogeosciences 2022, 19, 5125–5149. [Google Scholar] [CrossRef]
  82. Nkwasa, A.; Chawanda, C.J.; Jägermeyr, J.; van Griensven, A. Improved representation of agricultural land use and crop management for large-scale hydrological impact simulation in Africa using SWAT+. Hydrol. Earth Syst. Sci. 2022, 26, 71–89. [Google Scholar] [CrossRef]
  83. Grogan, D.S.; Zuidema, S.; Prusevich, A.; Wollheim, W.M.; Glidden, S.; Lammers, R.B. Water balance model (WBM) v.1.0.0: A scalable gridded global hydrologic model with water-tracking functionality. Geosci. Model Dev. 2022, 15, 7287–7323. [Google Scholar] [CrossRef]
  84. Xie, Z.; Chen, S.; Qin, P.; Jia, B.; Xie, J. Research on Climate Feedback of Human Water Use and Its Impact on Terrestrial Water Cycles—Advances and Challenges. Adv. Earth Sci. 2019, 34, 801–813. [Google Scholar] [CrossRef]
Figure 1. The research layout of scientometric analysis in the climate effects of irrigation (CEI) research. Notice: the “*” in the figure is the name of .txt format file with the prefix of “Download_”.
Agronomy 13 02482 g001
Figure 2. The annual distribution of the CEI publications and citations from 1993 to 2022.
Agronomy 13 02482 g002
Figure 3. The dual-map overlay of the journals and disciplines. (a). The global base map of dual-map in CiteSpace. Left-side map is citing journals/disciplines and the right-side map is cited journals/disciplines. (b) The dual-map overlay of the CEI research in disciplines. The content of the red dashed box has been enlarged in the red dashed rounded quadrilateral, and the overlap texts in the red dashed box are 4. CHEMISTRY, MATERIALS, PHYSICS, 6. MATHEMATICAL, MATHEMATICS, MECHANICS, 3. EARTH, GEOLOGY, GEOPHYSICS, 8. MOLECULAR, BIOLOGY, GENETICS, and 10. PLANT, ECOLOGY, ZOOLOGY, 19. FORENSIC, ANATOMY, MEDICINE respectively.
Agronomy 13 02482 g003
Figure 4. Publication output and annual publication trends in collaboration countries. (a) Interval distribution of the countries’ publication outputs. The horizontal axis represents the interval between published quantity classification components. The vertical axis represents the number of publications. The purple triangle represents countries that have published 1 to 9 articles. The green triangle represents countries that have published 10 to 49 articles. The red triangle represents countries that have published 50 to 99 articles. The purple triangle represents countries that have published no less than 100 articles. (b) Annual trends of published articles in the top ten productive countries. In (b), the countries with * have strong citation bursts, which is counted by the CiteSpace burst detection in Table 3.
Agronomy 13 02482 g004
Figure 5. The institution co-citation network of CEI research from 1993 to 2022 with one-year time. (The closer the color of the tree ring approaches yellow, the later the institutional citation appears. The larger the circles, the higher the frequency of citations. The red ring is a mechanism with strong citation bursts. The purple circle is a pivot node with high betweenness centrality).
Agronomy 13 02482 g005
Figure 6. The co-authorship network of authors in CEI research with three-year time slice. (The red lines are the citation year in 2020–2022. Different colored boxes represent different author collaboration networks and the overlay authors in yellow dashed box are Bindi, Marco, Ewert, Frank and Gaiser, Thomas respectively. The line chart in the lower left corner shows the relationship between the number of articles published by the author and the number of authors).
Agronomy 13 02482 g006
Figure 7. The timeline diagram of keyword co-occurrence analysis in CEI research with 8 clusters from 1993 to 2022 with three-year time slice. (Each node represents a keyword, and the color of the co-citation link signifies the earliest period that the link was established. Nodes below the threshold were not labelled. The closer the color of the tree ring approaches yellow, the later the institutional citation appears. The larger the circles, the higher the frequency of citations. The purple circle has high betweenness centrality, and the red rings are the keywords with a higher burst strength). The overlap texts are “atmospheric CO2”, “climate change”, “temperature”, “management”, “stomata”, and “climate change impacts”, “region” and “climate change adaptation” respectively.
Agronomy 13 02482 g007
Figure 8. The timeline chart of the top 14 document co-citation analysis (DCA) clusters. (#number is the cluster ID of DCA. As the number increases, the cluster size decreases. Y is the publication year of the document. C is the cluster size).
Agronomy 13 02482 g008
Table 1. The top 5 meso citation topics of CEI research across different research periods (stage 1: 1993–2005, stage 2: 2006–2012, stage 3: 2013–2022).
Citation Topics MesoRecord
Stage 1Stage 2Stage 32018–20221993–2022
Oceanography, Meteorology and Atmospheric Sciences571587954691010
Soil Science2353255173331
Forestry212916483214
Crop Science1219164176263
Climate Change1021184129215
Table 2. The top 30 most cited articles in the CEI field in 1993–2022. (Year: publication year, citations: times cited).
TitleYearCitations
China and India lead in greening of the world through land-use management20191084
Impacts of soil and water pollution on food safety and health risks in China2015630
Constraints and potentials of future irrigation water availability on agricultural production under climate change2014615
Agricultural green and blue water consumption and its influence on the global water system2008535
Effective sea-level rise and deltas: Causes of change and human dimension implications2006518
Development and testing of the WaterGAP 2 global model of water use and availability2003511
Climate change, wine, and conservation2013441
A global perspective on wetland salinization: ecological consequences of a growing threat to freshwater wetlands2015436
Climate Change Effects on Runoff, Catchment Phosphorus Loading and Lake Ecological State, and Potential Adaptations2009426
Water conservation in irrigation can increase water use2008414
Impact of land use and land cover change on groundwater recharge and quality in the southwestern US2005401
Potential uses and limitations of crop models1996380
Effects of climate change on hydrology and water resources in the Columbia River basin1999350
Influences of natural and anthropogenic factors on surface and groundwater quality in rural and urban areas2015345
Climate change impacts on groundwater and dependent ecosystems2014325
Ecological impacts of global warming and water abstraction on lakes and reservoirs due to changes in water level and related changes in salinity2015304
Climate change and drought: a risk assessment of crop-yield impacts2009279
Impact of reservoirs on river discharge and irrigation water supply during the 20th century2011277
Irrigation cooling effect: Regional climate forcing by land-use change2007275
From leaf to whole-plant water use efficiency (WUE) in complex canopies: Limitations of leaf WUE as a selection target2015267
A reservoir operation scheme for global river routing models2006265
Effects of global irrigation on the near-surface climate2009260
ICBM: The introductory carbon balance model for exploration of soil carbon balances1997253
Global long-term observations of coastal erosion and accretion2018244
An investigation of enhanced recessions in Poyang Lake: Comparison of Yangtze River and local catchment impacts2014241
US agriculture and climate change: New results2003240
The Land Use Model Intercomparison Project (LUMIP) contribution to CMIP6: rationale and experimental design2016238
Climate change sensitivity assessment of a highly agricultural watershed using SWAT2009238
Simulating the effects of climate and agricultural management practices on global crop yield2011220
Drought predisposes pinon-juniper woodlands to insect attacks and mortality2013219
Table 3. The top 8 countries with the strongest citation bursts. (Year: the first publication year; strength: the strength of citation bursts; begin: the first burst year; end: the end burst year).
CountriesYearStrengthBeginEnd
USA199330.2319932008
Sweden19953.9119952010
The Netherlands19956.6920002011
Germany19994.6820082009
Spain20014.5420112012
Australia19937.7520132016
Finland20104.4720152018
Iran20014.8820202022
Table 4. The top 30 institutions with the strongest citation bursts in collaboration institution map (Year: the earliest publication year of institutions; Strength: the strength of burst detection in CiteSpace; Span: the burst year span; Country: the country of institutions; Freq: the amount of publications of the institutions).
InstitutionsYearStrengthSpanCountryFreq
Wageningen University & Research20006.9613The Netherlands63
University of Nebraska Lincoln20053.453USA20
University of Florida19944.0411USA29
University of Florence20113.882USA15
University of Copenhagen20094.036Denmark14
University of Colorado System19993.647USA9
University of Colorado Boulder19993.647USA9
University of California System20073.638USA82
University of Arizona20053.789USA7
University of Agriculture Faisalabad20184.333Pakistan23
United States Department of Energy (DOE)19943.995USA54
UDICE-French Research Universities20167.094France27
Texas A&M University System19954.755USA29
Texas A&M University College Station19953.515USA25
Sun Yat-Sen University20203.813China8
State University System of Florida19944.3215USA42
Seoul National University (SNU)20053.633Republic of Korea8
Potsdam Institut fur Klimafolgenforschung19994.1915Germany25
National Center Atmospheric Research (NCAR)—USA19983.567USA14
National Aeronautics & Space Administration (NASA)19954.2616USA26
NASA Goddard Space Flight Center19954.2820USA16
Lawrence Livermore National Laboratory20064.613USA7
Institute of Geographic Sciences & Natural Resources Research20063.662China74
Indian Institute of Technology System (IIT System)19985.45India27
Hohai University20145.583China41
CSIC—Estacion Experimental de Aula Dei (EEAD)20063.964Spain13
Commonwealth Scientific & Industrial Research Organisation (CSIRO)19936.472016Australia63
Columbia University19953.772014USA29
China Institute of Water Resources & Hydropower Research20093.62020China27
CGIAR19986.162017France70
Table 5. The clusters’ features and the composition of co-occurrence keywords. (cluster ID: the cluster ID of co-occurrence keywords is ranked by cluster size. The bigger the cluster size, the smaller the cluster ID. Size: the cluster size is the set of keyword numbers. Mean year: the average year of the cluster occurrence. Label: label is the name of the clusters. Cluster members: the keywords in the corresponding cluster with its occurrence frequency in brackets).
Cluster IDSizeMean YearLabelCluster Members (Occurrence Frequency)
0892015water scarcityresources (110), evapotranspiration (98), river basin (96)
1762011photosynthesisgrowth (327), photosynthesis (109), use efficiency (143)
2682005climate changeclimate change (1381), model (326), irrigation (447)
3562010greenhouse gas emissionsdynamics (104), carbon dioxide (80), soil (136)
4462011food securityproductivity (163), winter wheat (122), food security (106)
5452004soil temperaturesoil moisture (103), nitrogen (127), carbon (78)
6352016remote sensingscale (26), ecosystem services (33), index (30)
7202002risk assessmentyield (306), co2(43), model comparison (4)
8142015irrigation managementchange impacts (99), quality (132), crop production (40)
Table 6. The 33 keywords with the strongest citation bursts with a five-year minimum duration. (Year: the first publication year; Strength: the strength of citation bursts. The length of red short lines is the burst detection time span; the length of blue short lines is the whole time span life time before and after the year of burst detection time).
KeywordsYearStrength1993–2022
carbon dioxide199411.01Agronomy 13 02482 i001
trends200710Agronomy 13 02482 i002
United States20059.91Agronomy 13 02482 i003
vegetation20079.2Agronomy 13 02482 i004
climate19958.88Agronomy 13 02482 i005
scenarios20097.88Agronomy 13 02482 i006
model19957.53Agronomy 13 02482 i007
growth19937.51Agronomy 13 02482 i008
temperature19987.42Agronomy 13 02482 i009
water resources20057.37Agronomy 13 02482 i010
elevated CO220016.71Agronomy 13 02482 i011
biomass19995.92Agronomy 13 02482 i012
global warming20025.6Agronomy 13 02482 i013
stomatal conductance20095.37Agronomy 13 02482 i014
land use20085.25Agronomy 13 02482 i015
precipitation19975.22Agronomy 13 02482 i016
CO219945.13Agronomy 13 02482 i017
soil moisture20025.06Agronomy 13 02482 i018
hydrology20134.82Agronomy 13 02482 i019
sensitivity19974.71Agronomy 13 02482 i020
dynamics19994.65Agronomy 13 02482 i021
global change19994.53Agronomy 13 02482 i022
gas exchange20094.36Agronomy 13 02482 i023
spring wheat20114.08Agronomy 13 02482 i024
organic matter20074.03Agronomy 13 02482 i025
adjustments19953.97Agronomy 13 02482 i026
California20093.84Agronomy 13 02482 i027
respiration20113.78Agronomy 13 02482 i028
swat model20153.71Agronomy 13 02482 i029
simulations20093.63Agronomy 13 02482 i030
tallgrass prairie19993.51Agronomy 13 02482 i031
Disclaimer/Publisher’s Note: The statements, opinions and data contained in all publications are solely those of the individual author(s) and contributor(s) and not of MDPI and/or the editor(s). MDPI and/or the editor(s) disclaim responsibility for any injury to people or property resulting from any ideas, methods, instructions or products referred to in the content.

