Abstract
The determination of the optimal harvest date is very important to obtain the desired apple quality. This study was aimed at evaluating the impact of the harvest date on selected properties of the following red-fleshed apples: ‘Alex Red’, ‘Trinity’, and ‘Roxana’. The color parameters of skin and flesh were measured using a portable spectrophotometer. The apple slices were imaged using a digital camera to extract flesh image textures. Then, the contents of chemical compounds, such as sugars, acids, and polyphenols were measured. The greatest significant changes with the delay in the harvest date were observed in the values of parameter a* of red-fleshed apple skin (from 21.57 to 25.42 for ‘Alex Red’, from 22.65 to 26.81 for ‘Trinity’, and from 21.82 to 30.00 for ‘Roxana’) and apple flesh (from 29.06 to 32.80 for ‘Alex Red’ and from 32.96 to 36.30 for ‘Trinity’); image textures (RHMean—from 227.6 to 236.5 for ‘Alex Red’, from 231.8 to 236.3 for ‘Trinity’, and from 217.8 to 227.9 for ‘Roxana’, and SHMean—from 126.0 to 135.6 for ‘Alex Red’, from 127.4 to 143.4 for ‘Trinity’, and from 58.4 to 96.0 for ‘Roxana’); the total sugar content—from 85.6 to 90.9 g kg−1 for ‘Alex Red’ and from 112 to 128 g kg−1 for ‘Trinity’; total pectin—from 6278 to 6008 mg·100 g−1 for ‘Alex Red’, from 6196 to 6401 mg·100 g−1 for ‘Trinity’, and from 5912 to 6807 mg·100 g−1 for ‘Roxana’; and total phenolic content—from 536.1 to 501.9 mg kg−1 for ‘Alex Red’, from 515.5 to 573.3 mg kg−1 for ‘Trinity’, and from 1121.3 to 1293.3 mg kg−1 for ‘Roxana’. The linear relationships with the Pearson’s correlation coefficients (R) reaching 0.999 between the image texture from color channel a and color parameter L*, and −0.999 for the image feature from color channel R vs. color parameter a* of the flesh, and image texture from channel X vs. anthocyanins were confirmed.
Keywords:
red-fleshed apple cultivars; harvest date; color; image textures; sugars; acids; pectin; phenols; correlation 1. Introduction
Red-fleshed apples with a pigmented pericarp are considered a novel fruit of great interest because of the enhanced content of beneficial compounds including anthocyanins and flavan-3-ols [1,2], as well as other polyphenolic compounds, acids, sugars, volatile components, and mineral elements [3]. The apple color and flavor can mainly be determined by phenolic compounds, sugars, and organic acids, which depend on the growing season, climatic conditions, orchard management system, cultivar, and storage [4,5,6,7]. Additionally, in apples, the content of five important individual groups of phenolic compounds, including flavanols, flavonols, dihydrochalcones, hydroxycinnamic acids, and anthocyanins, may vary among the cultivars [8,9,10]. Furthermore, it was found that red-fleshed apples can be richer in anthocyanins, citric acid, malic acid, ascorbic acid, and total organic acids than commercial, white-fleshed cultivars [10,11].
The harvest date can influence the maturity indices and physicochemical properties of apples. In the case of white-fleshed fruit, an increase in starch index and a decrease in total phenols, weight loss, firmness, electrolyte leakage, and antioxidant activity with harvest delay was found [12]. However, there was an effect of the harvest date on color parameters, bitter pit, and scald [12,13]. In the case of red-fleshed apples, the strong influence of maturation on anthocyanins was confirmed. There are transcription factors responsible for the biosynthesis of anthocyanins in the flesh. During red-fleshed apple maturation, there is a strong relationship between the overexpression of the MdMYB10 gene and the expression of anthocyanin levels, which induce the red color of apple flesh [10]. Color is an important maturity index and determines apple quality [14,15]. Generally, red-fleshed apple genotypes can be divided into two types. Type 1 includes dark-colored and strongly pigmented genotypes. The red color of the apple flesh forms at an early stage of fruit development and the shoots and leaves are colored. The regulation of anthocyanin biosynthesis is dependent on the transcription factor MdMYB10, whereas genotypes belonging to type 2 are less intensely colored. The red coloration occurs late in fruit development, and shoots and leaves are not red. The regulation of anthocyanin biosynthesis is related to the transcription factor MdMYB110a [16]. Anthocyanins are color-presenting substances. They have highly hydrophilic properties. Thus, these substances have a protective role in pathophysiological conditions [17].
Because of their health-related benefits and appearance, red-fleshed apple cultivars can be attractive to consumers [18]. Red-fleshed apple products can be considered functional foods [3]. However, the red-fleshed apple is a challenging fruit in terms of oxidation damage during processing. Anthocyanins are not very stable during apple storage and processing. Furthermore, anthocyanins are susceptible to degradation in the presence of ascorbic acid. Therefore, the prevention of oxidation by adding ascorbic acid or sodium ascorbate needs to be avoided [19].
There is limited available literature on the correlation of different quality attributes of apples harvested on different dates assessed using non-destructive and destructive techniques. However, demonstrating such relationships can be extremely important for researchers working in the field of non-destructive fruit testing [15]. The relationships between physicochemical properties and spectral data or image parameters allowing for the prediction of the apple quality in a robust, objective, and non-destructive manner were revealed [18,20,21]. Red-fleshed apple cultivars may vary in color intensity, which may be related to the content of anthocyanins [18]. Due to this relationship, the anthocyanin content can be estimated from color images of the apple flesh. The application of color parameters from apple flesh images obtained using a scanner may be more objective and less expensive than colorimeters and there is no need to use a laboratory, expensive equipment, or chemicals as in the case of chemical methods [18]. Hyperspectral imaging combined with machine learning was applied as a non-destructive approach to predict the physicochemical quality (pH, firmness, moisture content, and soluble solids content) of apples [20]. In addition to imaging, spectroscopic techniques are considered non-destructive, accurate, and less time-consuming in the monitoring of apple quality. Visible and near-infrared (VIS-NIR) spectroscopy has turned out to be useful for the prediction of the optimal harvest date of apples based on their maturity index [21]. Furthermore, acoustic techniques and machine vision have allowed for the successful prediction of the optimum harvesting dates of apples [15].
The objective of this study was to compare the physicochemical properties and image texture parameters of red-fleshed apples harvested at a weekly interval. The impact of the harvest date on fruit weight, percentage of blush, starch index, internal ethylene concentration, fruit firmness, color parameters L*, a*, and b* of the skin and flesh, texture HMean for apple flesh images in the individual color channels R, G, B, L, a, b, X, Y, Z, U, V, and S, dry mass, and chemical properties, including the content of sugars (sucrose, glucose, fructose, total sugars), sorbitol, acids (L-ascorbic acid, malic acid, citric acid, total acids), total pectins, and phenolic compounds (flavanols, dihydrochalcones, phenolic acids, flavonols, anthocyanins, total phenolic content), of red-fleshed apples ‘Alex Red’, ‘Trinity’, and ‘Roxana’, was evaluated. The innovative part of this study was also related to the determination of correlations between selected physicochemical properties and texture parameters of flesh images in the color channels R, G, B, L, a, b, X, Y, Z, U, V, and S of red-fleshed apples sampled on different harvest dates.
2. Materials and Methods
2.1. Materials
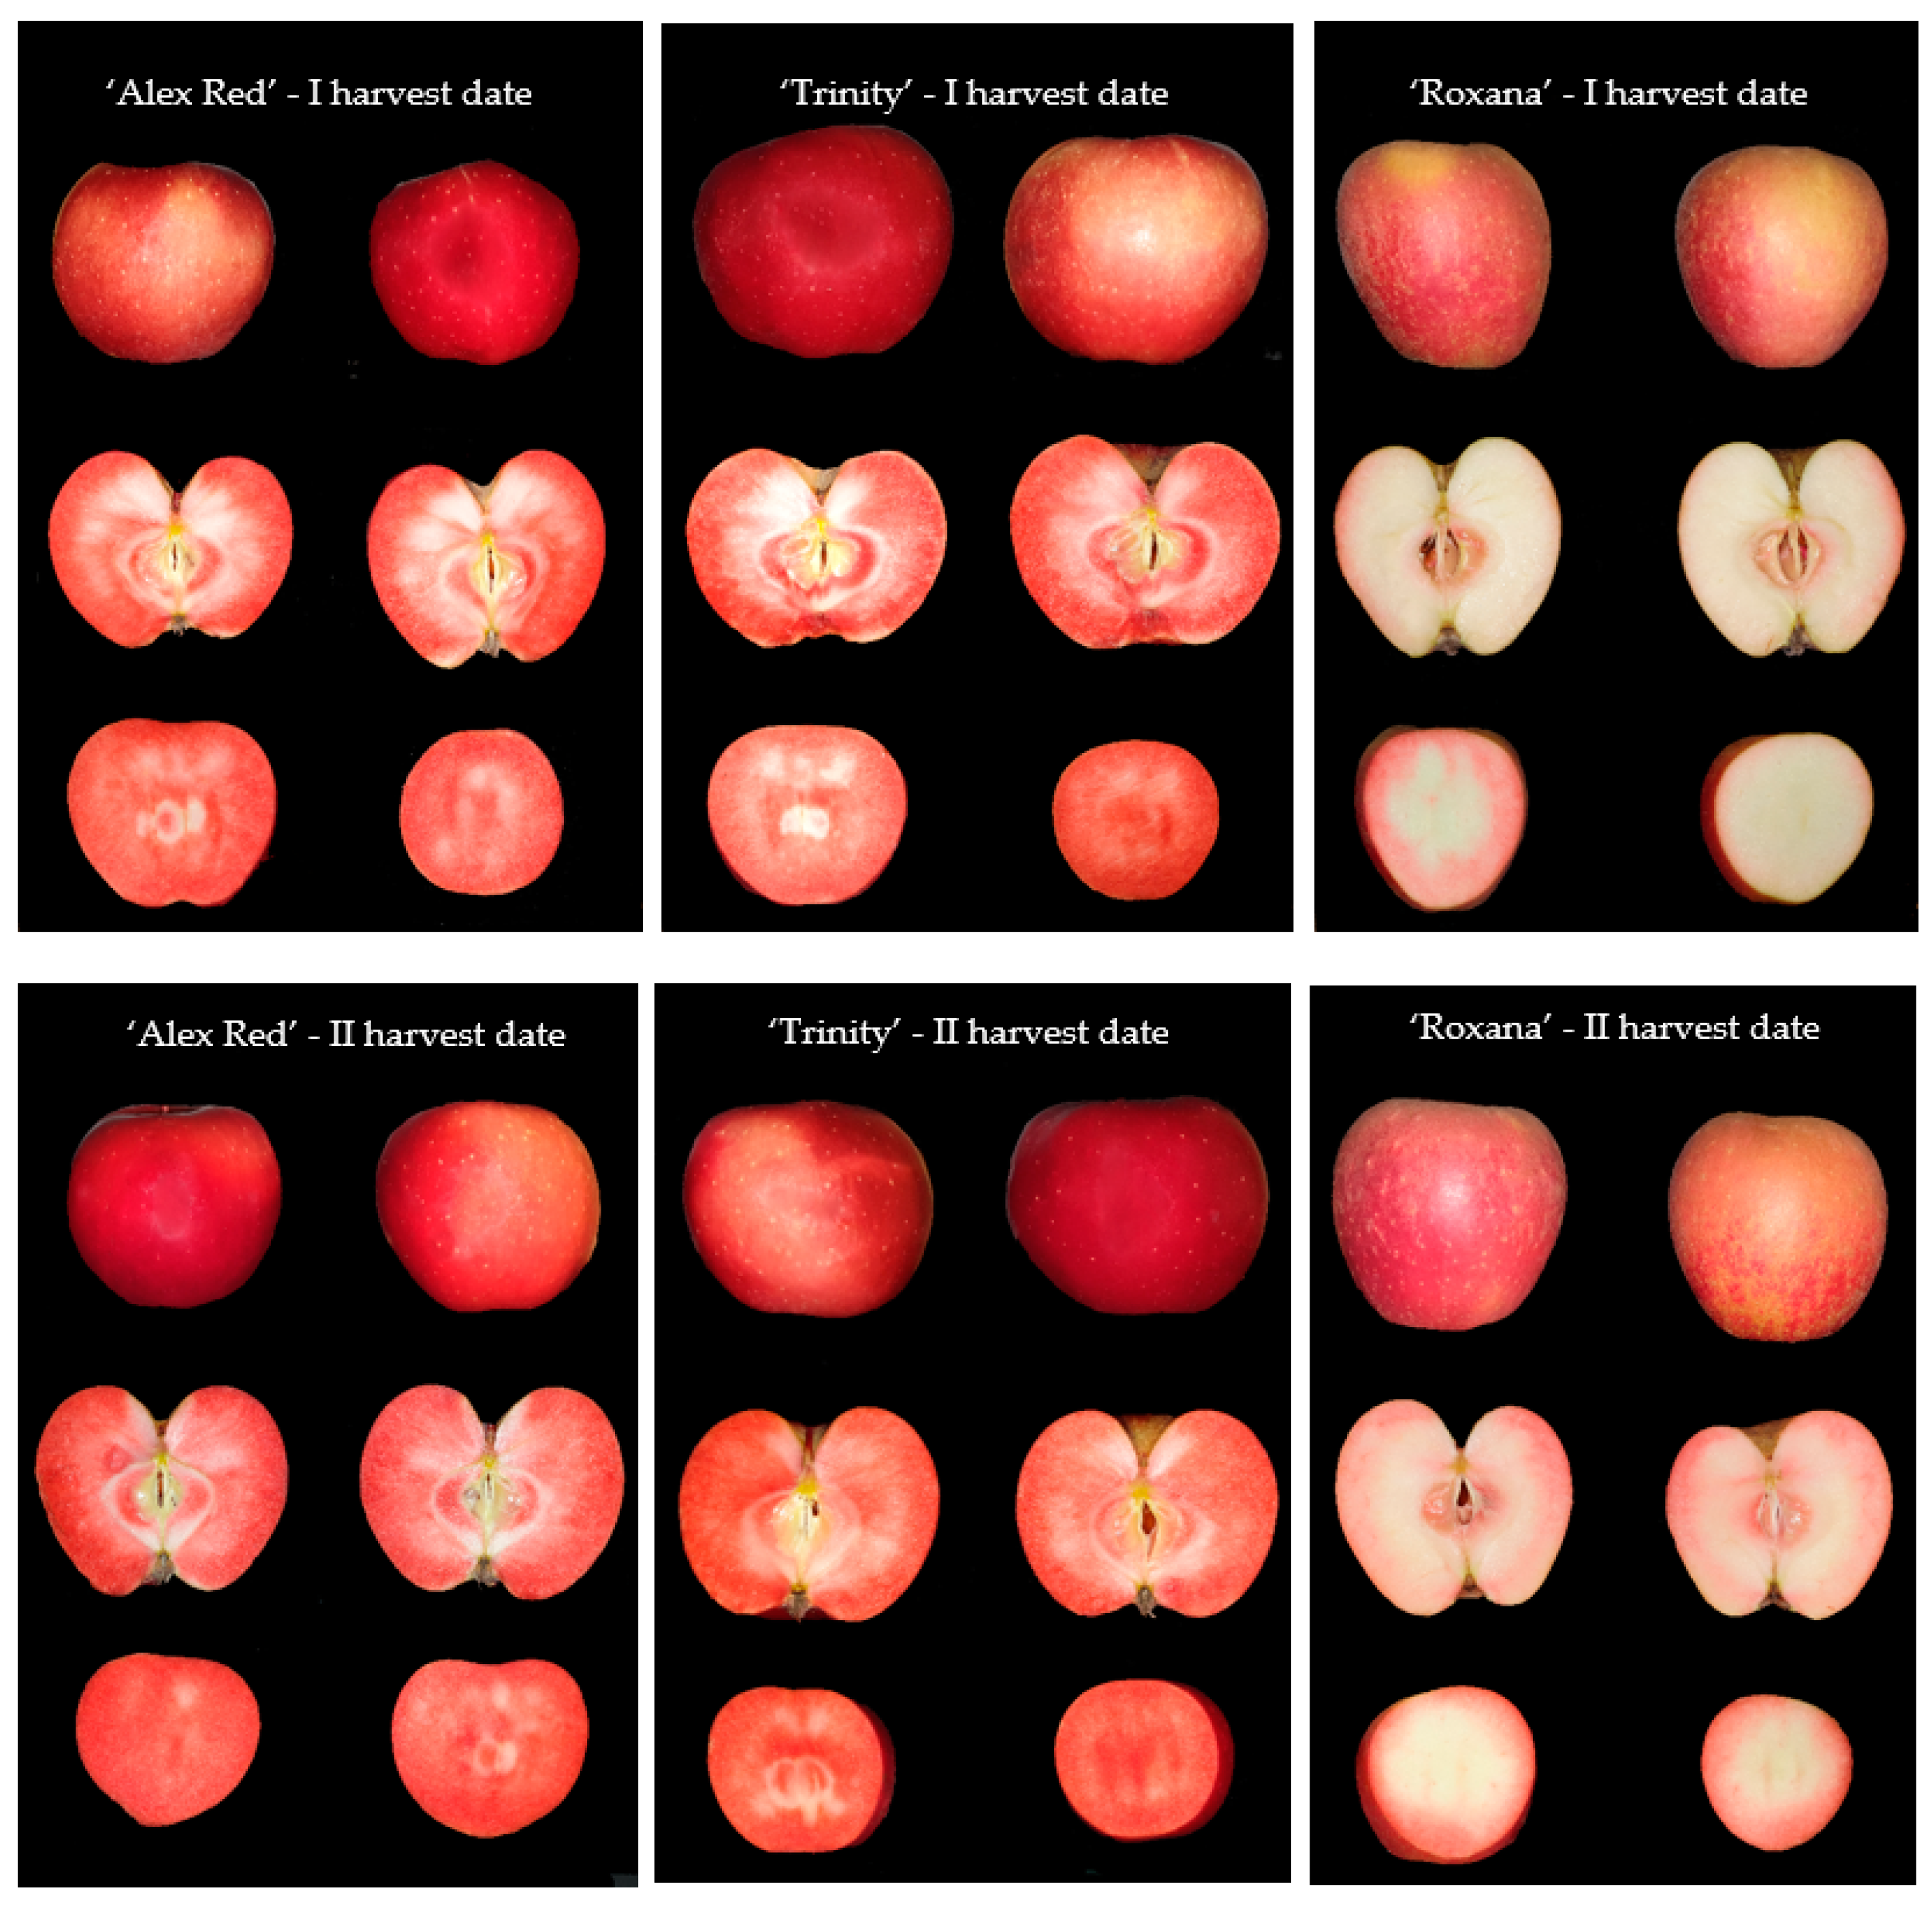
The apples belonging to three red-fleshed cultivars of ‘Alex Red’, ‘Trinity’, and ‘Roxana’ were harvested on two dates, 31 August 2021, and 6 September 2021. The characteristics of examined red-fleshed apples in terms of fruit size, percentage of blush, maturity, and fruit firmness at two harvest dates are given in Section 3.1. Fruits were sampled from the Experimental Orchard of the National Institute of Horticultural Research in Dabrowice (central Poland). For each cultivar and harvest date, 50 fully developed undamaged apples were selected. Immediately after harvesting, the apples were subjected to color measurements and imaging. Then, the same samples were used for chemical analyses. Therefore, in the case of each fruit, representative parts of the flesh with the skin were collected and frozen for the measurements of the content of chemical compounds. The exemplary images of whole red-fleshed apples and slices of ‘Alex Red’, ‘Trinity’, and ‘Roxana’ harvested on the I and II dates are presented in Figure 1.

Figure 1.
The images of whole red-fleshed fruit, half of an apple, and a slice of apple of the types ‘Alex Red’, ‘Trinity’, and ‘Roxana’ harvested on the I (31 August) and II (6 September) dates.
2.2. Maturity and Quality of Apples at Harvest
All harvests’ fruit weight, percentage of blush, internal ethylene concentration, starch index, and fruit firmness were measured as indicators of maturity and quality of the red-fleshed apples.
To assess the fruit weight, apples were weighed individually on a laboratory balance (Radwag, Radom, Poland). Fruit weight was expressed in grams (g), and in Table 1 the mean values are given. The blush area was assessed subjectively on a scale from 0% (no blush) to 100% (the entire surface of the fruit covered with blush).

Table 1.
The influence of harvest date on fruit weight, percentage of blush, internal ethylene concentration, starch index, and fruit firmness (mean value of 30 fruits).
The starch index was evaluated on a 10-point scale using the color reaction of starch with a solution of iodine in potassium iodide (1—completely colored cross-section of the fruit, 10—no color reaction, uncolored cross-section). The Ctifl starch conversion chart for Apples (Centre Technique Interprofessionnel des Fruits et Legumes, Saint Remy de Provence, France) was used.
Internal ethylene concentration (IEC) was measured using the modified method proposed by Jung and Watkins [22]. For IEC measurements, a 1 mL gas sample was taken from the apple core and injected into an HP 5890 II gas chromatograph equipped with an alumina-packed glass column (6 mm diameter and 1200 mm length, packed with Alumina F-1, 60/80 mesh) and detector FID (Hewlett Packard, Palo Alto, CA, USA). The results were expressed in µL L−1 (ppm).
Flesh firmness was measured on two opposite sides of the fruit (after skin removal) using Zwick Roell Z010 (Zwick/Roell, Ulm, Germany) equipped with a Magness–Taylor 11.1 mm probe. The speed with which the head moved during a single firmness measurement was 100 mm/min. Firmness was defined as the maximum force needed to penetrate the plunger into the flesh to a depth of 8.7 mm. The results were expressed in newtons [N].
2.3. Color Measurements
Color measurements were carried out using the Konica Minolta CM-2500c portable spectrophotometer. The device was calibrated using Zero Calibration and White Calibration. The parameters L* (lightness, 0 (dark)–100 (light)), a* (green (-)–red (+)), and b* (blue (-)–yellow (+)) were determined for apple skin and flesh at the CIE standard illuminant D65. In the case of skin, the parameters were measured for two opposite sides of the outer surface of apples. For apple flesh, each apple was cut with a sharp knife to obtain a longitudinal section and the determination of color parameters was carried out for the flesh of two halves. The measurements were performed in 50 repetitions for apple skin and flesh for each cultivar and harvest date.
2.4. Image Analysis
Red-fleshed apple slices with a thickness of 10 mm were intended for imaging. Four slices of each of the 25 apples of ‘Alex Red’, ‘Trinity’, and ‘Roxana’ harvested on 31 August 2021 and 6 September 2021 were imaged with the use of a smartphone camera (Samsung Galaxy S9, Samsung Group, Suwon, Republic of Korea) using an aperture of F2.4, ISO 50, Auto White Balance, and a flash. Image acquisition was carried out on a black background. In total, the images of one hundred slices for each apple group were acquired. The slice images were uploaded to the computer with Microsoft’s Windows operating system using a USB cable and saved in the BMP file format.
The image processing was performed using the MaZda 4.7 software (Łódź University of Technology, Institute of Electronics, Łódź, Poland) [23,24,25]. The black background facilitated the image segmentation by the manually determined brightness threshold and separation of the apple slices. Each slice was considered as a region of interest (ROI). In the case of each ROI, the feature extraction was performed for images converted to the individual color channels R, G, B, L, a, b, X, Y, Z, U, V, and S. In total, 2172 image textures based on the histogram, gradient map, run-length matrix, co-occurrence matrix, autoregressive model, and Haar wavelet transform were computed for each red-fleshed apple slice.
2.5. Chemical Properties
For the analysis, samples were finely sliced and frozen, after which they were powdered and stored at −20 °C.
2.5.1. Dry Matter
Dry matter was determined by the weight-drying method in accordance with PN-90/A-75101/03. The apples were dried at 70 °C under vacuum (3 kPa) to a constant weight. The results are expressed in %.
2.5.2. Analysis of Sugars
An analysis of total sugars (sucrose, glucose, and fructose) was determined by high-performance liquid chromatography (Agilent 1200 HPLC system, equipped with a differential refractometric detector), using Aminex HPX-87C (300 mm × 7.5 mm) with a precolumn. The isocratic flow was 0.6 mL·min−1, temperature 80 °C, and mobile phase—0.1 N edetate calcium disodium (Ca-EDTA). The samples were dissolved in redistilled water, homogenized, and purified on a Waters SepPak PLUS C18 filter. The sugars were quantified by a calibration curve for sucrose, glucose, and fructose, and the results were expressed in mg g·kg−1 f.m.
2.5.3. Analysis of Acids
The content of L-ascorbic, malic, and citric acid was determined by high-performance liquid chromatography (Agilent 1200 HPLC system, equipped with a DAD detector). Separation was performed using a Supelco LC-18 column (250 mm × 4.6 mm; 5 µm) with a precolumn according to IFU (Instructions for Use) procedures. The isocratic flow was 0.8 mL·min−1, temperature 30 °C, mobile phase—1% phosphate-buffered solution KH2PO4, pH 2.5. The detection of L-ascorbic acid was by absorbance at 244 nm and 210 nm for malic and citric acid. The samples were dissolved in 6% HPO3, homogenized, and filtered. The results were expressed in mg·100 g−1 f.m. The acids were quantified by a calibration curve for L-ascorbic, malic, and citric acids, and the results were expressed in mg·100 g−1 f.m.
2.5.4. Analysis of Phenolic Compounds
The polyphenol content was determined by a modified method according to Tsao and Yang [26]. The sample was homogenized in 70% methanol. The extracts before injection were filtered through a PTFE filter (0.45 µm, 15 mm).
The content of polyphenol was determined by high-performance liquid chromatography (HPLC). Separation was performed using a Phenomenex®Fusion-RP 80A column (250 mm × 4.6 mm; particle size 4 µm) on an Agilent 1200 HPLC system equipped with a DAD detector. The elution conditions were as follows: 0.5 mL min−1, temperature 25 °C, and wavelengths: 280 nm (flavan-3-ols), 320 nm (phenolic acids), 360 nm (flavonol), and 520 nm (anthocyanins). The mobile phase consisted of 10.2% acetic acid in 2 mM sodium acetate (solvent A) and acetonitrile (B). HPLC analysis was run in gradient flow: 0–20min, 3% B; 20–40 min, 17% B; 40–65 min 40% B; 65–68 min, 90% B; 68–72 min, 90% B isocratic; 72–73 min, 0% B. The calculations of polyphenols were quantified by calibration with the standards of polyphenols and were expressed in mg·kg−1 f.m.
2.5.5. Analysis of Pectin
The content of pectins (total and water-soluble) was determined by the carbazole method. The pectins from the fruit sample were precipitated with a hot 96% ethanol solution. The precipitate for the determination of total pectins was quantitatively transferred with water to 100 mL flasks, 5 mL of 1N NaOH was added, made up to the mark with water, and filtered. Distilled water was added to the precipitate intended for the determination of water-soluble pectins and stirred with a strong stream of air for 10 min. The sample was centrifuged for 15 min at 3500 rpm and the resulting supernatant was decanted into 100 mL flasks. The above steps were performed twice. A total of 5 mL of 1N NaOH was added to the combined supernatants and the flask was filled with distilled water and filtered after 15 min. Extracts prepared in this way, both for total and water-soluble pectins, were collected for the following color reaction with carbazole: 0.1 mL of the extract + 0.9 mL of H2O + 0.5 mL of carbazole + 6 mL of concentrated H2SO4. The reaction was carried out at 85 °C for 5 min, then the reaction mixture was cooled before measuring the extinction at a wavelength of 525 nm. The measurement was made against a blank sample (1 mL H2O + 0.5 mL carbazole + 6 mL concentrated H2SO4). Calculations were made according to standard curves for galacturonic acid standards (Fluka, Switzerland). The results were expressed in mg·kg−1 f.m.
2.6. Statistical Analysis
The statistical analysis was carried out using STATISTICA 13.1 (Dell Inc., Tulsa, OK, USA, StatSoft Polska, Kraków, Poland). The differences in color parameters, image texture HMean for each of the color channels R, G, B, L, a, b, X, Y, Z, U, V, and S, and chemical properties between red-fleshed apples sampled on both harvest dates were determined separately for ‘Alex Red’, ‘Trinity’, and ‘Roxana’ at a significance level of p < 0.05. The homogeneity of variance and normality of the distribution of variables were checked to determine whether the assumptions were met. Then, Tukey’s test was used to compare the means.
The color difference (ΔE) was computed using the following Equation (1):
The linear relationships between the image parameters and chemical properties of red-fleshed apples were determined. Among 2172 textures of images in color channels R, G, B, L, a, b, X, Y, Z, U, V, and S, the parameters the most correlated with sugars, acids, and phenols were selected. Pearson’s correlation coefficients (R) at a significance level of p < 0.05 were determined. Scatter plots for selected image textures with color parameters and chemical compounds of apple samples were created.
2.7. Discrimination of Red-Fleshed Apples in Terms of Harvest Date
The red-fleshed apples belonging to individual cultivars were discriminated in terms of harvest date based on selected texture parameters of the flesh images using WEKA 3.8.4 machine learning software (Machine Learning Group, University of Waikato) [27,28,29]. The textures from images in color channels L, a, b, R, G, B, X, Y, Z, U, V, and S with the highest discriminative power were selected using the Best First algorithm. The discrimination was performed with the use of a 10-fold cross-validation and Multilayer Perceptron algorithm from the group of Functions. The correctly and incorrectly classified instances, average accuracies, and the values of True Positive Rate (TPR), False Positive Rate (FPR), Precision, Recall, F-Measure, Matthews Correlation Coefficient (MCC), Receiver Operating Characteristic Area (ROC Area), and Precision-Recall Area (PRC Area) were determined [30,31,32,33].
3. Results
3.1. Characteristics of Examined Red-Fleshed Apples in Terms of Fruit Size, Percentage of Blush, Maturity, and Fruit Firmness
For all examined cultivars, a delay in harvest resulted in increasing fruit weight (for ‘Alex Red’ and ‘Trinity’ it was statistically significantly). Regardless of the harvest date, the skin of the apples ‘Alex Red’ and ‘Trinity’ was fully covered by a nice red blush. For ‘Roxana’ apples, the delay in harvest resulted in better-colored fruits (Table 1). Taking into account the internal ethylene concentration (IEC) and starch index as indicators of maturity stage, ‘Roxana’ apples were less mature compared to ‘Alex Red’ and ‘Trinity’. The fruits of ‘Trinity’ cultivars were more advanced in maturity (even on the first harvest date) compared to other cultivars. The IEC indicates that both harvest dates for ‘Alex Red’ and ‘Trinity’ were provided when the climacteric increase in ethylene production had already begun. In the case of ‘Alex Red’, it was single ppm, and in the case of ‘Trinity’, the IEC was already several ppm. In the case of the ‘Roxana’ variety, the harvest was provided in the initial phase of climatic growth. For ‘Roxana’ apples, the delay in harvest resulted in a significant increase in IEC, so it indicated the beginning of the climacteric phase. However, relationships between ethylene production or internal ethylene concentration and optimum harvest dates are not always strong. With the delay in harvest, for all examined cultivars, the firmness of the flesh decreased.
3.2. Color Parameters of Red-Fleshed Apple Skin and Flesh
The values of color parameters L*, a*, and b* of the skin of the red-fleshed apples ‘Alex Red’, ‘Trinity’, and ‘Roxana’ harvested on the I harvest date—31 August 2021—and II harvest date—6 September 2021—are presented in Table 2. There were no statistically significant changes in the parameter L* between apples collected on the first and second harvest dates for any of the cultivars. The parameter L* ranged from 34.41 (‘Alex Red’) to 40.05 (‘Roxana’) for apples harvested earlier and from 32.81 (‘Trinity’) to 39.37 (‘Roxana’) for samples harvested later. The statistically significant differences in color parameter a* of the skin of red-fleshed apples were observed for all red-fleshed apple cultivars. The values of parameter a* significantly increased from 21.57 to 25.42 for ‘Alex Red’, from 22.65 to 26.81 for ‘Trinity’, and from 21.82 to 30.00 for ‘Roxana’, for I and II harvest dates, respectively. Comparatively, a statistically significant increase in parameter b* was noticed for ‘Alex Red’ (8.62 for I harvest date and 11.39 for II harvest date) and ‘Roxana’ (18.67 for I harvest date and 21.95 for II harvest date).
Table 2.
The influence of harvest date on color parameters of the skin of red-fleshed apples.
In the case of the color of apple flesh (Table 3), the values of parameter L* statistically significantly decreased for apples sampled on the second date, from 54.36 to 50.50 for ‘Alex Red’, from 51.56 to 47.04 for ‘Trinity’, and from 71.91 to 69.52 for ‘Roxana’. Furthermore, the significant increases in parameter a* for ‘Alex Red’ (29.06 to 32.80) and ‘Trinity’ (32.96 to 36.30) and parameter b* for ‘Trinity’ (11.11 to 12.69) and ‘Roxana’ (11.80 to 13.97) were determined.
Table 3.
The color parameters of the flesh of red-fleshed apples sampled on different harvest dates.
3.3. Flesh Image Textures
The texture parameters of the flesh images of red-fleshed apples changed in terms of harvest date (Table 4). The significant changes in image textures RHMean, LHMean, aHMean, bHMean, YHMean, UHMean, VHMean, and SHMean were found for all apple cultivars of ‘Alex Red’, ‘Trinity’, and ‘Roxana’. The greatest significant increase in image texture was found for RHMean, from 227.6 to 236.5 for ‘Alex Red’, from 231.8 to 236.3 for ‘Trinity’, and from 217.8 to 227.9 for ‘Roxana’, as well as for SHMean from 126.0 to 135.6 for ‘Alex Red’, from 127.4 to 143.4 for ‘Trinity’, and from 58.4 to 96.0 for ‘Roxana’.
Table 4.
The texture parameters of the flesh images of red-fleshed apples depending on the harvest date.
3.4. Chemical Properties of Red-Fleshed Apples
The results of the analysis of three cultivars of red-fleshed apples showed the influence of harvest time on selected physicochemical parameters and the content of bioactive compounds. The highest dry matter content was found in the cultivar ‘Roxana’ (22.3%). For the remaining cultivars, the dry matter content was within the range of 15.0–15.7% (Table 5). A significant effect of the harvest date on the dry matter content was observed only for the cultivar ‘Roxana’; in the case of ‘Alex Red’ and ‘Trinity’, no significant differences were found. It could be affected by the maturity stage of apples at harvest. Only for ‘Roxana’ apples was there a significant effect of harvest date on IEC (Table 1), which is closely related to maturity and ripening.
Table 5.
Selected physical and chemical parameters of red-fleshed apples for two harvest dates.
The results depicted in Table 5 showed that the content of total sugars increased significantly with the delay in the harvest date and ranged from 85.6 to 90.9 g·kg−1 for ‘Alex Red’ and from 112.3 to 128.0 g·kg−1 for ‘ Trinity’. In the cultivar of ‘Roxana’, no significant difference in the total sugar content was found between the harvest dates. The red-fleshed apples contain sucrose, glucose, fructose, and sugar alcohol (sorbitol). The dominant sugar in red-fleshed apples from both harvest dates was sucrose, the average share of which was 55–57%, followed by fructose at 31–34% and glucose at 1.8–3.1%. In the apple cultivar of ‘Trinity’, a high content of sorbitol was found on both harvest dates, which was about three times higher than those in ‘Roxana’ and ‘Alex Red’ on both harvest dates (Table 5).
In red-fleshed apples, there are organic acids, including the dominant malic acid, as well as citric and L-ascorbic acid. In our research, significant differences in the content of organic acids were observed between the dates of harvesting (Table 5). In the case of the cultivar of ‘Alex Red’, a significantly higher content of malic acid was recorded on the first date of harvest (2004 mg·100 g−1), on average by 8%, while in the cultivar of ‘Trinity’, a significantly higher content (1631 mg·100 g−1) was found on the second date of harvest, on average by 4.6%. For the ‘Roxana’ cultivar, no significant difference was found between the two harvest dates. The content of citric acid in all apple cultivars was at a similar level and ranged from 17.7 to 23.9 mg·100 g−1. There was no significant difference in the content of this component depending on the date of harvest. The exception was the cultivar of ‘Alex Red’, where a significantly higher content of citric acid was noted on the first harvest date. All cultivars of red-fleshed apples also differed in the content of L-ascorbic acid, the content of which was within the range of 17.1–24 mg·100 g−1. The ‘Trinity’ and ‘Roxana’ apples harvested on the second date were characterized by a significantly higher content of this component, on average 17.6%, and the ‘Alex’ Red’ variety on the first date by 2.3% (Table 5).
The results depicted in Table 5 showed that the total pectin content in three cultivars of red-fleshed apples ranged from 5912–6807 mg·kg−1. For each cultivar, the effect of the harvest date on the total pectin content was observed. In our studies, an increase in the content of these compounds was observed for the cultivars of ‘Trinity’ and ‘Roxana’ with the delay in the harvest date. The exception was the ‘Alex Red’ cultivar, in which a decrease in pectin content was observed on the second harvest date.
The total phenolic content significantly decreased with harvest delay, from 536.1 to 501.9 mg·kg−1 for ‘Alex Red’ and increased from 515.5 to 573.3 mg·kg−1 for ‘Trinity’, and from 1121.3 to 1293.3 mg·kg−1 for ‘Roxana’ (Table 6). The five classes of phenolic compounds were identified in the studied red-fleshed apples: flavanols, dihydrochalcones, flavonols, phenolic acids, and anthocyanins. In the tests carried out, a varied content of individual groups of phenolic compounds was observed, depending on the date of harvest. The highest share in the determined phenolic compounds in the ‘Alex Red’ and ‘Trinity’ cultivars were anthocyanins, respectively 46.9% and 46.7 %, the content of which is characteristic of apples with red flesh and is responsible for the color of these fruits. An exception was the cultivar of ‘Roxana’, in which the dominant group was flavanols 77.4 %, while the share of anthocyanins was low—3.8%. There was no significant difference in anthocyanin content depending on the date of harvest. Only in the case of apples of the ‘Alex Red’ cultivar was a higher content of these compounds observed on the first date of harvest, which may be due to the fact that these apples have already reached full coloration on this date (Table 6).
Table 6.
The content of individual groups of phenolic compounds in red-fleshed apples for two harvest dates.
3.5. Relationship between Image Textures and Physicochemical Properties of Red-Fleshed Apples Collected on Different Harvest Dates
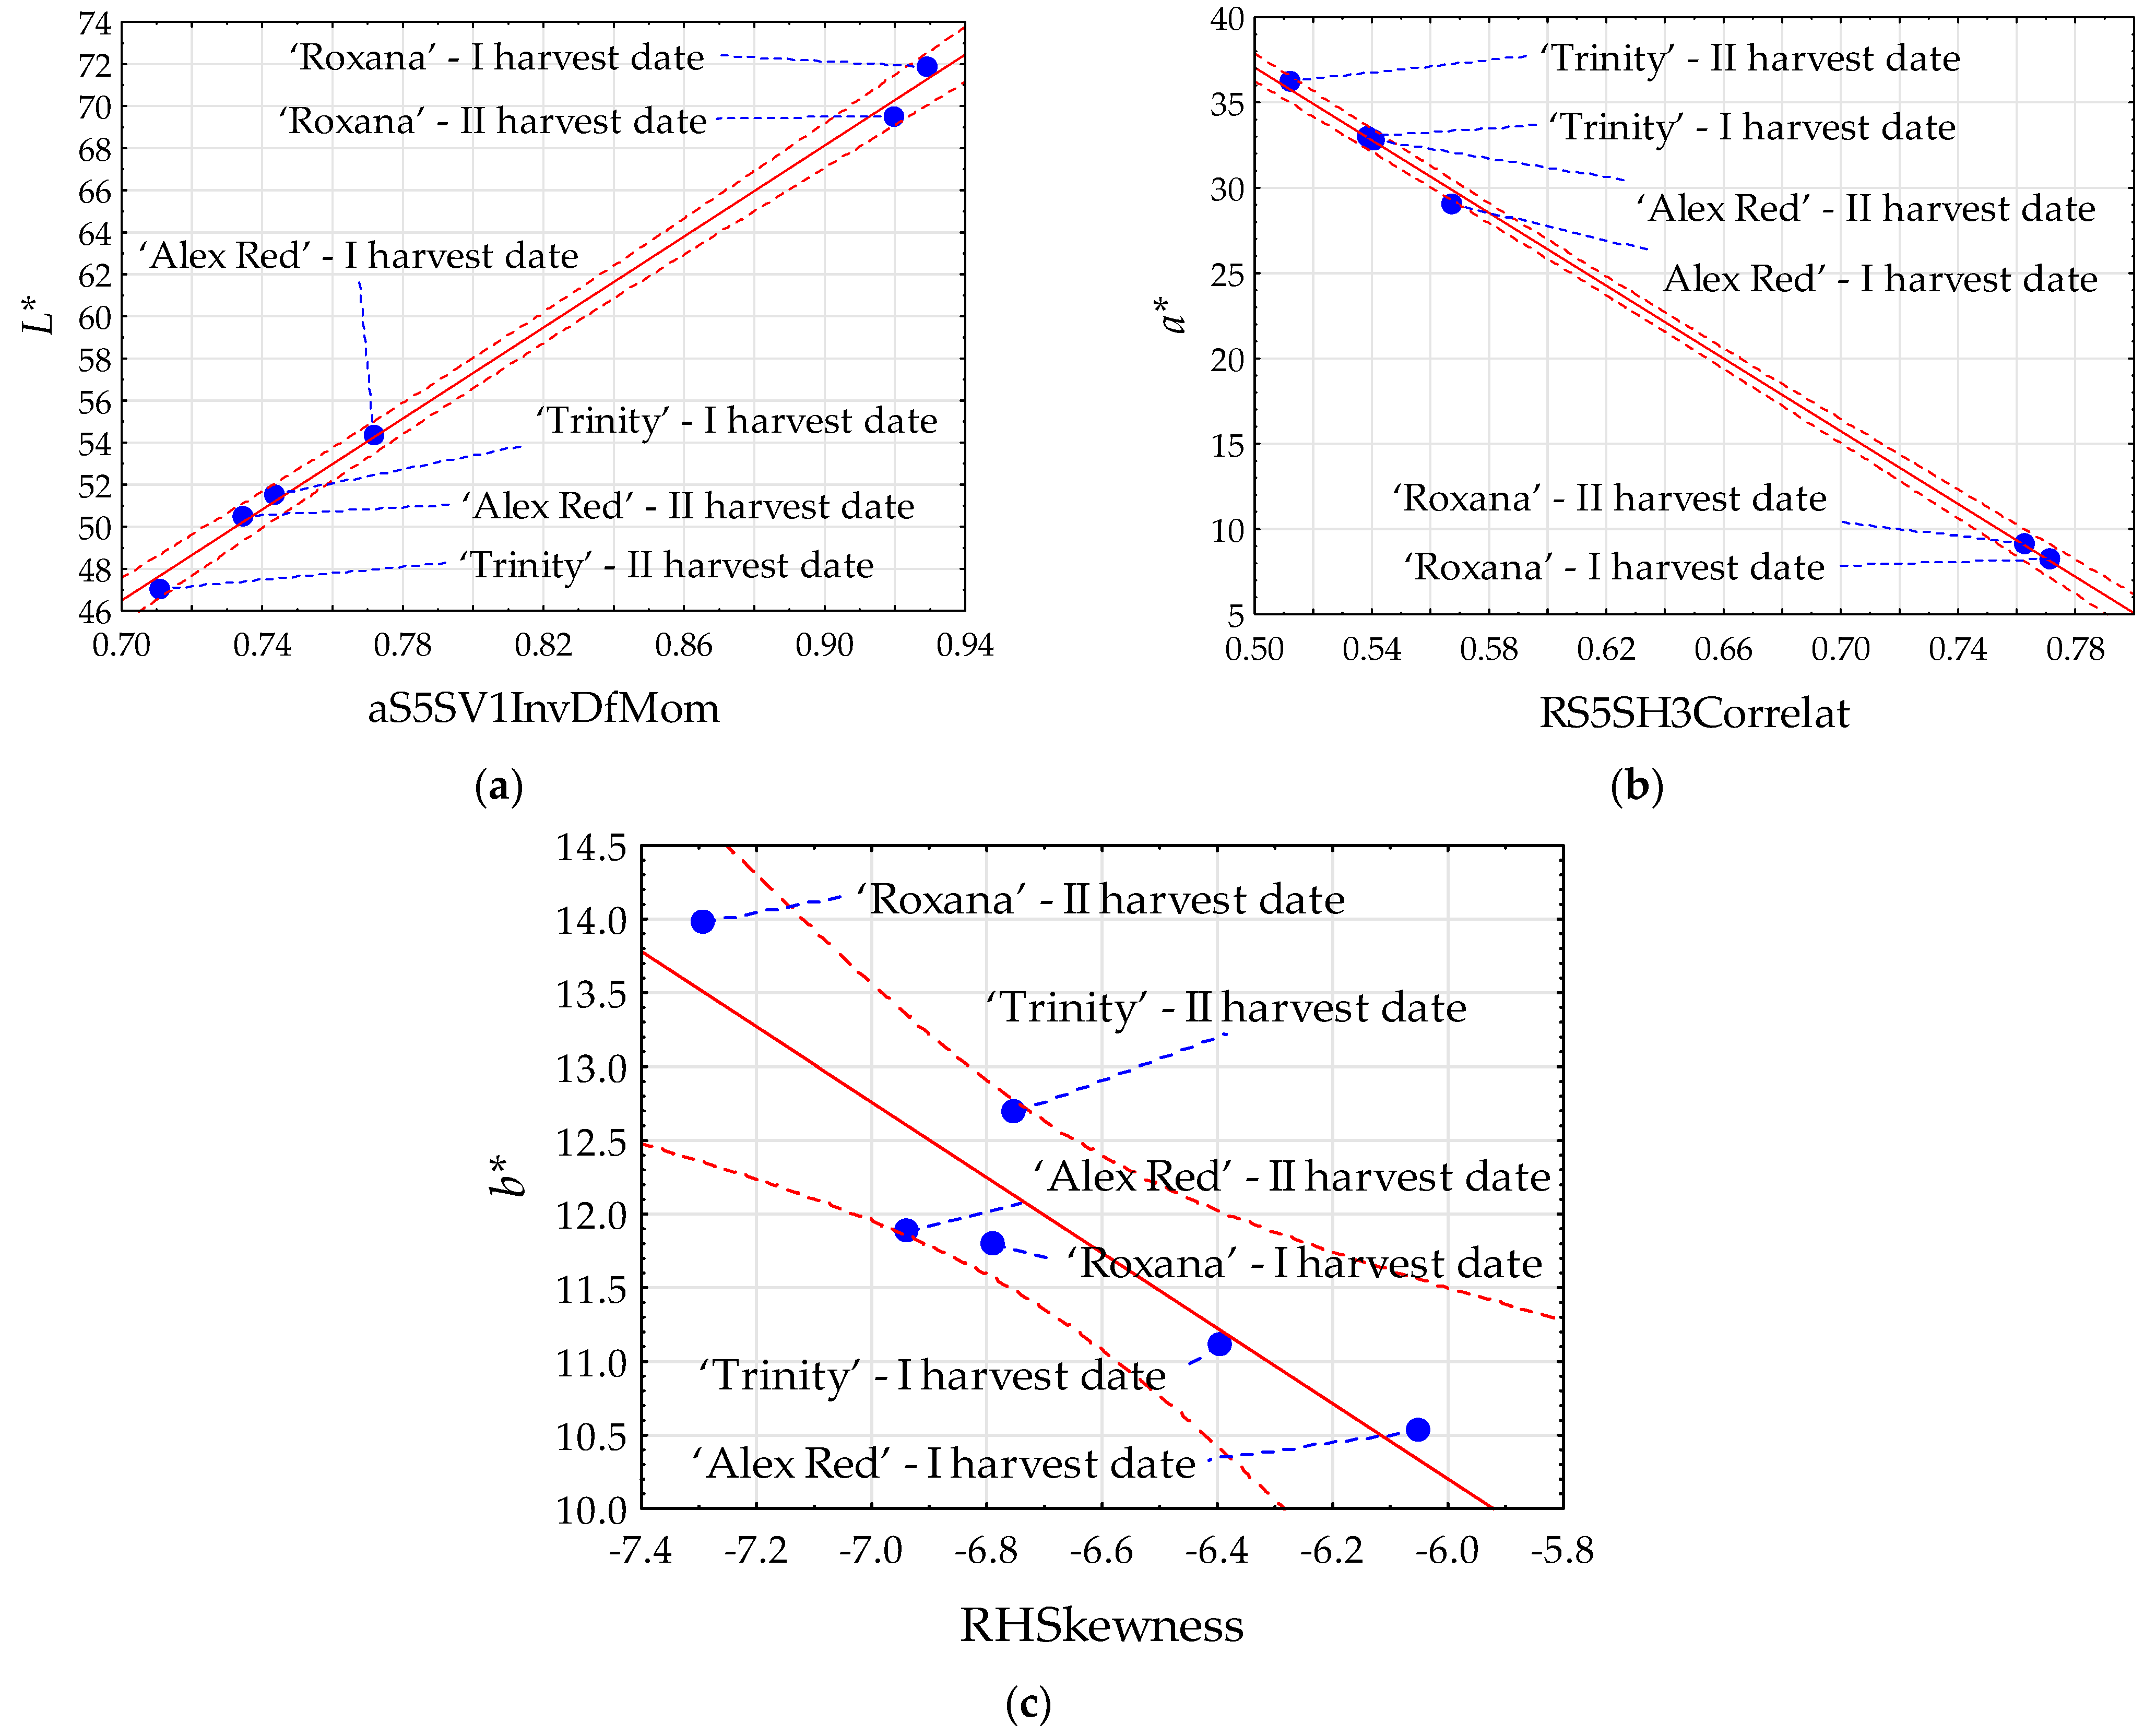
The strongest statistically significant linear relationships between the image features and color parameters were found for parameters L* and a* of the flesh. In the case of parameter L*, Pearson’s correlation coefficients (R) reached 0.999 for the texture aS5SV1InvDfMom extracted from images in the color channel a (Figure 2a). The parameter a* was the strongest correlated (R = −0.999) with the texture RS5SH3Correlat from images in color channel R (Figure 2b). Comparatively, the strongest correlation of the parameter b* (−0.909) was found with the texture RHSkewness. For the parameter L*, the highest correlation with image textures was positive, and for the parameters a* and b* it was negative.
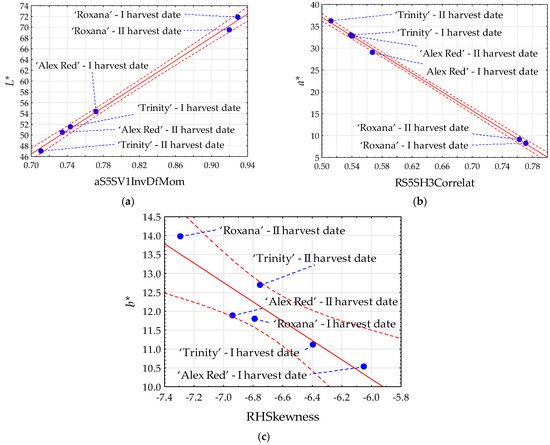
Figure 2.
Scatter plots for color parameters L* (a), a* (b), and b* (c) with image textures of the flesh of red-fleshed apples harvested on different dates. I harvest date—31 August 2021, II harvest date—6 September 2021. The first letter in the name of image textures denotes the color channel (a or R); InvDfMom—inverse difference moment; Correlat—correlation; HSkewness—histogram’s skewness. Blue dot—mean value; red dashed line—confidence interval (95%); solid red line—regression line; and blue dashed line—line connecting the mean value to the sample name.
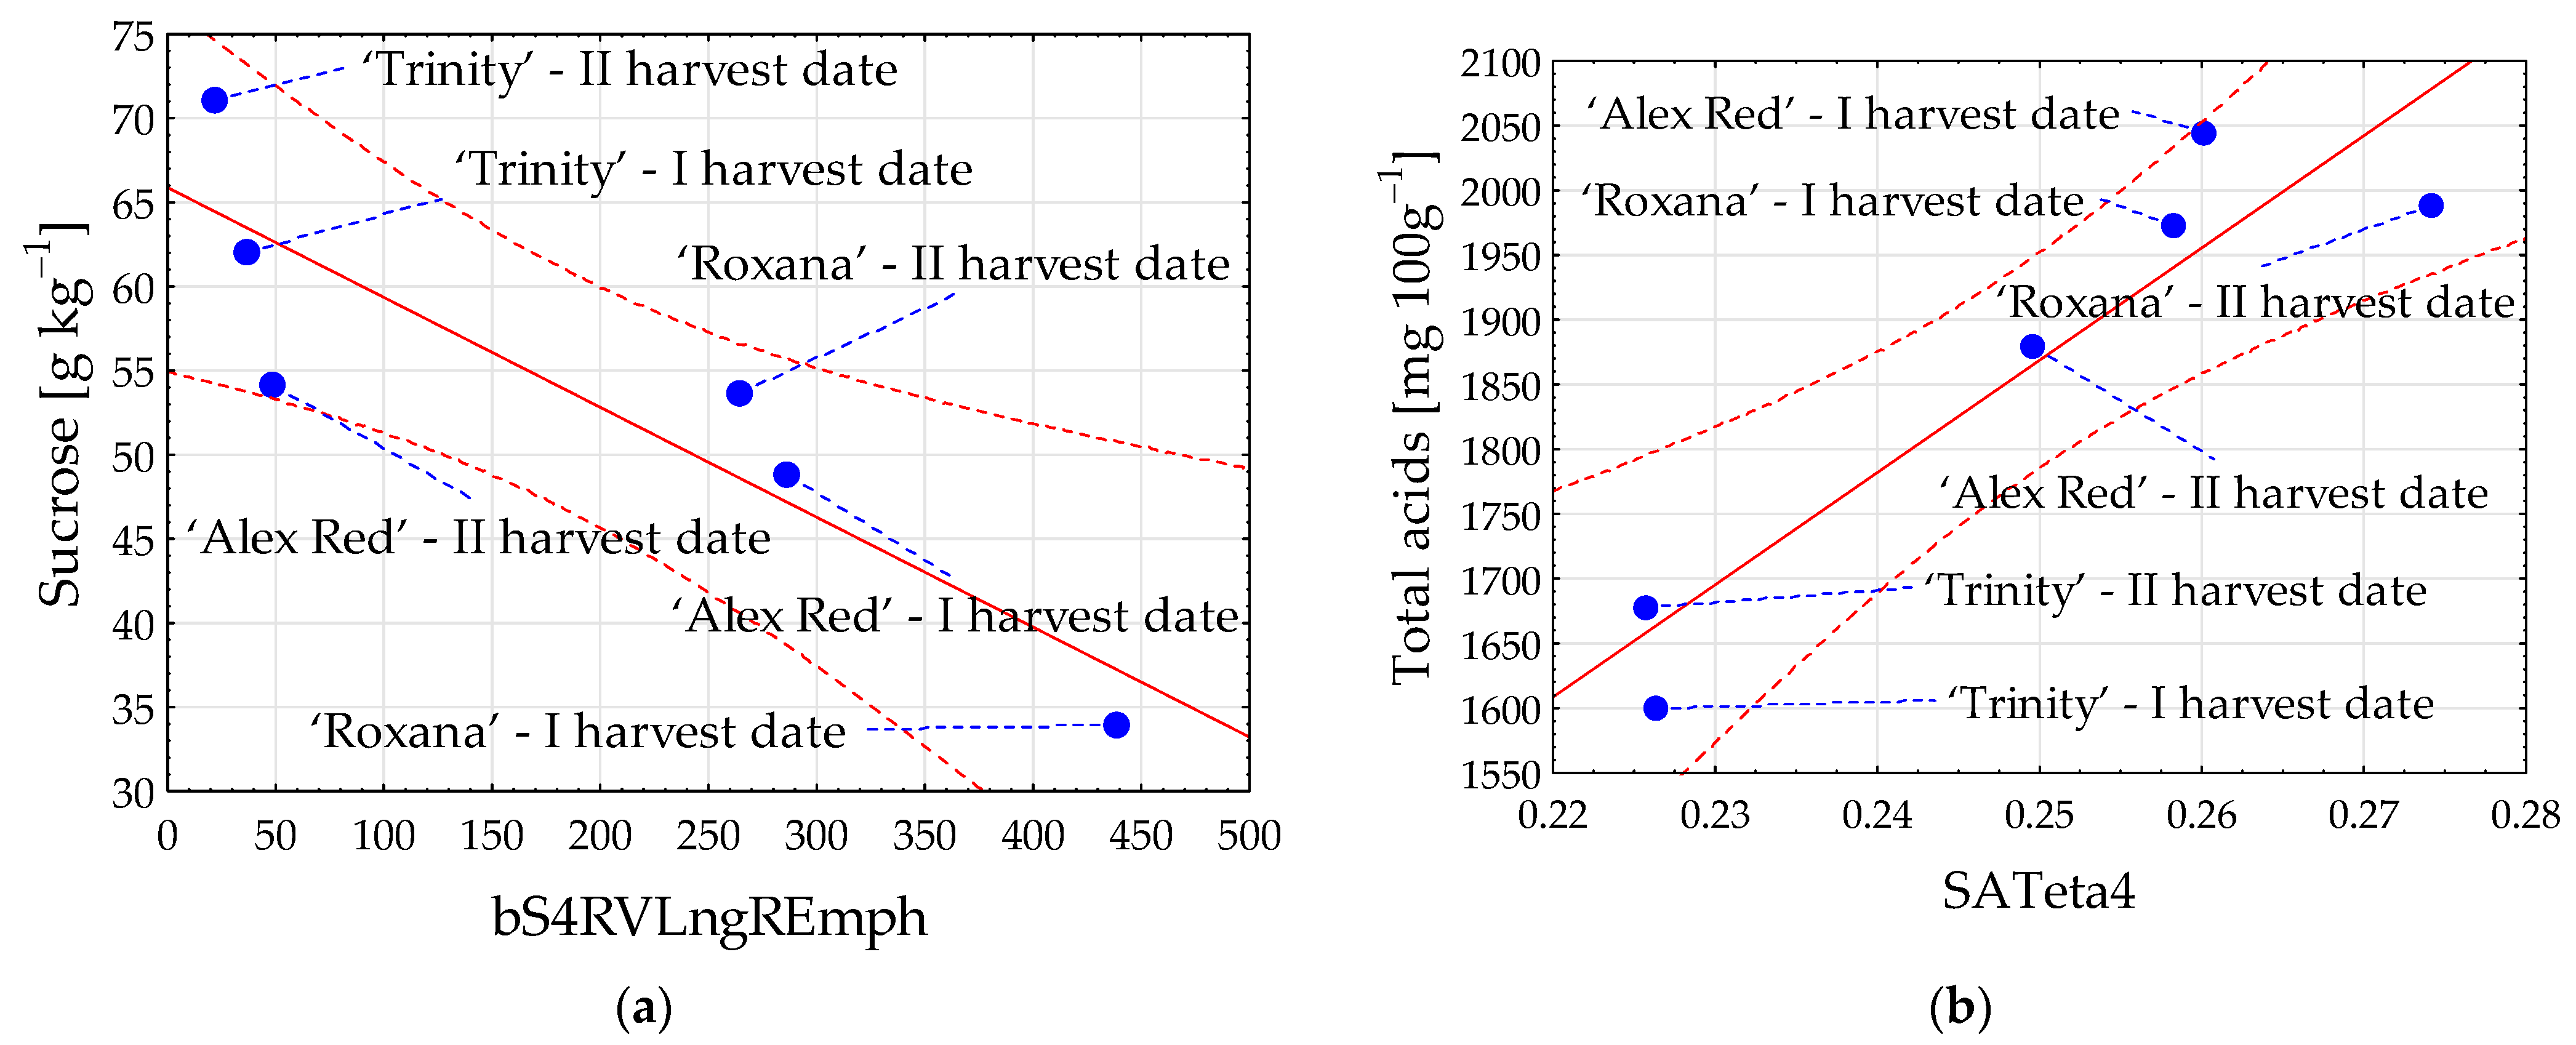
Among sugars, the highest correlation coefficient with image textures was determined for sucrose (Figure 3a). The content of sucrose in red-fleshed apples harvested on different dates was the strongest when correlated with flesh image texture bS4RVLngREmph from color channel b, and the observed relationship was negative (R = −0.894). Comparatively, among acids, the strongest relationship with flesh image textures was found for the content of total acids. The highest positive Pearson’s correlation coefficient (R) equal to 0.932 was observed with SATeta4 from color channel S (Figure 3b).
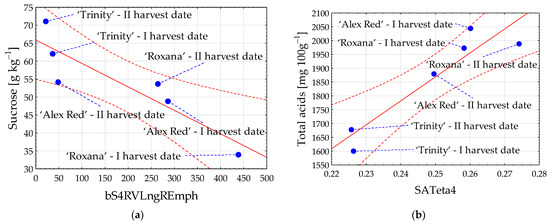
Figure 3.
Scatter plots for sucrose (a) and total acids (b) with image textures of the flesh of red-fleshed apples harvested on different dates. I harvest date—31 August 2021, II harvest date—6 September 2021. The first letter in the name of image textures denotes the color channel (b or S); LngREmph—long run emphasis; Teta4—parameter θ4. Blue dot—mean value; red dashed line—confidence interval (95%); solid red line—regression line; and blue dashed line—line connecting the mean value to the sample name.
The content of phenolic compounds in red-fleshed apples was strongly correlated with flesh image textures. The correlation coefficient (R) reached 0.993 in the case of total phenolic content and image texture ZS5SV3SumOfSqs from color channel R (Figure 4a). Among the individual groups of phenolic compounds, the strongest relationship with image parameters was found for anthocyanins. The coefficient R between the content of anthocyanins and texture XHMean reaching −0.999 was determined (Figure 4b).
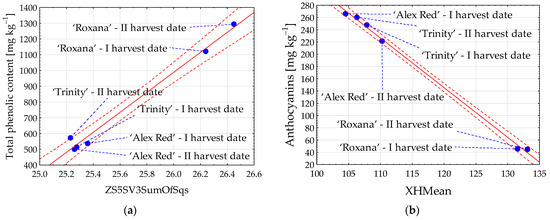
Figure 4.
Scatter plots for total phenolic content (a) and anthocyanins (b) with image textures of the flesh of red-fleshed apples sampled on different harvest dates. I harvest date—31 August 2021, II harvest date—6 September 2021. The first letter in the name of image textures denotes the color channel (Z or X); SumOfSqs—sum of squares; HMean—histogram’s mean. Blue dot—mean value; red dashed line—confidence interval (95%); solid red line—regression line; and blue dashed line—line connecting the mean value to the sample name.
3.6. Discrimination of Red-Fleshed Apples in Terms of Harvest Date Based on Selected Texture Parameters of the Flesh Images
The red-fleshed apples were correctly discriminated between in terms of harvest date based on selected texture parameters of the flesh images in the case of each cultivar (Table 7). The ‘Alex Red’ apples harvested on the I and II dates were distinguished from each other with a 95.5% accuracy. The average accuracy of the discrimination of red-fleshed ‘Trinity’ apples collected on both dates was equal to 93.0%, whereas apples belonging to ‘Roxana’ sampled on two dates were characterized by the lowest average discrimination accuracy of 90%. The values of TPR, Precision, Recall, F-Measure, and MCC were the highest and the values of FPR were the lowest for ‘Alex Red’ apples.
Table 7.
The discrimination between red-fleshed apples in terms of harvest date based on selected texture parameters of the flesh images using Multilayer Perceptron.
4. Discussion
The novelty of the performed study is related to the determination of the impact of the harvest date on physicochemical properties including fruit weight, percentage of blush, starch index, internal ethylene concentration, fruit firmness, color parameters L*, a*, and b* of the skin and flesh, dry mass, chemical properties (the content of sugars, sorbitol, acids, total pectins, and phenolic compounds), and image texture parameters of red-fleshed apples. This is the first report on the comparison of so many physicochemical properties and image features of red-fleshed apples collected on different dates. An innovative approach also concerns determining correlations between selected physicochemical properties and flesh image textures of red-fleshed apples harvested on two dates.
In our research, the delay in the harvest date caused the increase in fruit weight. This confirms the theory that fruits increase in diameter and weight until harvest [34,35,36]. During the first harvest date, the IEC was approximately 0.1 ppm, which is often taken as the beginning of the climacteric stage [37]. The measuring of IEC or rate of ethylene production is a good method for determining the harvest date for apples [22,38]. Several factors, such as the growing region, orchard location, cultivar mutants, conditions during the growing season, and nutrition may be significantly affected even within a cultivar [39].
It was found that the color of apple samples differed statistically significantly depending on the harvest date. Wang et al. [40] also reported that red-fleshed apple cultivars can be differed in skin and flesh color. Color is an important characteristic considered in breeding programs [41]. Furthermore, color is a widely used ripening index [14,42,43]. For determining the apple quality, color is an important maturity index [15]. Pigments that are responsible for color are synthesized during fruit ripening [44]. In our study, decreasing the values of parameter L* along with delaying the harvest date revealed that the apples became darker. Higher positive values of color parameter a* indicated that the apples harvested on the later date were redder, whereas higher positive b* values showed that the color was also more yellow. Wani et al. [15] confirmed an increase in redness (a*) observed with harvest delay. Due to consumer acceptance, a red color can be preferred and apples with higher redness can be more appealing. Additionally, the red color may indicate anthocyanin accumulation [11]. This may have health benefits.
The involved image parameters allowed for an objective assessment of the impact of harvest date on the quality of red-fleshed apples. The application of the image analysis resulted in a reduction in the labor intensity, time, and costs of analysis [45]. Determining the impact of harvest date on fruit quality based on image textures may be beneficial. Image textures are a function of the spatial variation of the intensity of pixel brightness. Texture parameters provide information about the structure and quantitative analyses of these features give insights into the product quality [23,24,25]. Therefore, image features can be very useful for non-destructive sample evaluation alongside destructive chemical analyses or can be used to estimate the physicochemical properties of samples without the need for more expensive, time-consuming, and labor-intensive measurements.
Only for one cultivar was a statistically significant impact of the harvest delay on the dry matter content determined. The content of dry matter in apples depends not only on the variety but also on the degree of maturity, climatic and agrotechnical conditions, as well as on the position of the fruit in the crown of the tree. Vieria et al. [46] found that the dry matter content of ‘Fuji’ apples is not an indicator for estimating fruit maturity stage and, therefore, does not complement information obtained by fruit maturity indicators such as flesh firmness, traditionally used by apple growers to determine the harvest date. In our study, the impact of the harvest date on the selected sugars and acids was also confirmed. The taste and aroma of apples are determined by the level of acids and sugars in them, which affect the overall organoleptic quality and stability of the fruit [47]. The quantitative and qualitative composition of sugars and acids was determined in the performed research. Bhat et al. [48] and Wani et al. [15] also found an increase in total sugars, which could be attributed to the hydrolysis of polysaccharides to monosaccharides and an increase in juice content by moisture loss due to transpiration. In the flesh of many fruits, such as grapes, cherries, and some soft fruits, the malate and citrate (mg∙g−1 f.m.) content increases at the beginning of ripening and then decreases because stored organic acids can be metabolized [44,49,50]. In the research of Lemmens et al. [41], it was found that the content of L-ascorbic acid in the apple peel and flesh does not depend on the harvest date, but is closely related to the variety and genetic basis. According to Mahmood et al. [51], the levels of acids in apples depends on the balance between the biosynthesis of organic acids, their degradation, and their vacuolar storage.
In our study, ‘Trinity’ and ‘Roxana’ apple cultivars, for which an increase in pectin content was observed, may not have reached the appropriate degree of maturity yet. In the study of Wani et al. [15], a decrease in the content of pectin substances in apples was also noted along with the delay in the harvest date, which could be attributed to the loss of fruit firmness. It has been suggested that this may also be related to the depolymerization of pectins that occurs during ripening. Additionally, in the study by Ornelas-Paz et al. [43], it was found that the pectin content in ‘Golden Delicious’ apples varied depending on the date of harvest and the degree of ripeness of the fruit.
Furthermore, the red-fleshed apples are a rich source of anthocyanins and other phenolic compounds that are considered to have health-promoting properties, according to Wang et al. [40]. In the conducted research, the influence of the harvest date was marked in the content of these compounds. In the studies by Zhang et al. [52], a decrease in the content of anthocyanins in red-fleshed apples was also observed along with the delay in their harvest and their constant level, regardless of the variety. In turn, Wani et al. [15] found the highest level of these compounds in apples on the last harvest date. Research by Juhart et al. [10] confirmed the strong influence of the ripening process on the content of anthocyanins the red-fleshed apples. Wagner et al. [19] reported that the anthocyanin content in the red-fleshed apples was up to 381 mg·kg−1 in the flesh and 1203 mg·kg−1 in the peel.
Our study confirmed the relationship between image features and physicochemical properties of red-fleshed apples. Wani et al. [15] reported the correlations of color parameters of apples estimated by the machine vision system with the colorimetric index values, which can be used as standards. In addition, the texture parameters of images can be correlated with the physicochemical properties of fruit [53,54]. Therefore, determining the relationship between image features and color and chemical parameters can be important for the assessment of apple quality.
It Is very important to determine the optimal date for the apple harvest. Apples harvested too early can be characterized by greater susceptibility to physiological disorders that can result in inferior surface color, less sugar content, poor production of aroma compounds, poor flavor, smaller fruit weight, poor eating qualities, and stored fruit can be more prone to bruise damage. Comparatively, harvesting too late can result in a higher susceptibility to mechanical damage, rot, CO2 injury, minimum storage life, and senescence. Such fruits harvested too late are less juicy and crispy with a high sugar/acidity ratio. It causes poor sensory quality [15]. Generally, apples harvested too early or too late are easily damaged and are susceptible to fungal diseases and physiological disorders. Over-mature fruits lose their flesh structure (softening), which causes their vulnerability to mechanical damage [55]. The susceptibility of apples to bruising depends on cultivars, storage conditions, and postharvest treatment. The shape of the apple fruit is also an important factor because apples of regular shape are less susceptible to bruising [56].
5. Conclusions
This study revealed the influence of harvest date on the physicochemical properties and image textures of red-fleshed apples. Statistically significant differences in color parameters a* and b* of apple skin, parameters L*, a* and b* of image textures of the flesh, and the content of chemical compounds were noticed for selected cultivars. Along with the delay in the harvest date, an increase in selected physicochemical parameters and bioactive compounds was observed in the case of ‘Trinity’ and ‘Roxana’ cultivars, although not always statistically significant. In the ‘Alex Red’ cultivar, a decrease in the content of selected parameters and bioactive compounds was observed, except for total sugars. This means that the behavior of the examined bioactive compounds depends more on cultivars than on harvest date. For better understating the relationship between the content of bioactive compounds and cultivars/maturity/ripening stage, further experiments are needed. Furthermore, linear relationships between the image textures and physicochemical characteristics of red-fleshed apples were found. Future studies may involve more cultivars harvested on more dates. Besides the raw material, the examination of the impact of harvest date on the properties of processed apples may be performed. The regression equations for the estimation of the physicochemical properties of red-fleshed apples based on image parameters may be developed.
Author Contributions
Conceptualization: E.R., M.M.-F., K.C., D.E.K., K.P.R. and D.K.; methodology: E.R., J.S.-G., M.M.-F. and K.P.R.; software: E.R.; validation: E.R.; formal analysis: E.R. and J.S.-G.; investigation: E.R., J.S.-G. and K.P.R.; resources: D.E.K. and E.R.; data curation: E.R., J.S.-G. and K.P.R.; writing—original draft preparation: E.R., J.S.-G. and K.P.R.; writing—review and editing: E.R., J.S.-G., M.M.-F., D.E.K. and K.P.R.; visualization: E.R., funding acquisition: K.C., D.K., M.M.-F. and E.R. All authors have read and agreed to the published version of the manuscript.
Funding
The study was performed within the framework of the research project ‘Determining the suitability of red-fleshed apples as a raw material for the production of high-quality dried fruit and creating a raw-material base in the form of a commercial orchard of red-fleshed apples’ (ZPiPOiW/4/2021-6.4.21), financed by the Ministry of Education and Science, as part of the research subsidy granted to the National Institute of Horticultural Research.
Institutional Review Board Statement
Not applicable.
Data Availability Statement
The data presented in this study are available upon request from the corresponding author.
Conflicts of Interest
The authors declare no conflict of interest.
References
- Ceci, A.T.; Bassi, M.; Guerra, W.; Oberhuber, M.; Robatscher, P.; Mattivi, F.; Franceschi, P. Metabolomic Characterization of Commercial, Old, and Red-Fleshed Apple Varieties. Metabolites 2021, 11, 378. [Google Scholar] [CrossRef]
- Catalán, Ú.; Pedret, A.; Yuste, S.; Rubió, L.; Piñol, C.; Sandoval-Ramírez, B.A.; Companys, J.; Foguet, E.; Herrero, P.; Canela, N.; et al. Red-Fleshed Apples Rich in Anthocyanins and White-Fleshed Apples Modulate the Aorta and Heart Proteome in Hypercholesterolaemic Rats: The AppleCOR Study. Nutrients 2022, 14, 1047. [Google Scholar] [CrossRef] [PubMed]
- Wojdyło, A.; Lech, K.; Nowicka, P. Effects of Different Drying Methods on the Retention of Bioactive Compounds, On-Line Antioxidant Capacity and Color of the Novel Snack from Red-Fleshed Apples. Molecules 2020, 25, 5521. [Google Scholar] [CrossRef] [PubMed]
- Slatnar, A.; Licznar-Malanczuk, M.; Mikulic-Petkovsek, M.; Stampar, F.; Veberic, R. Long-Term Experiment with Orchard Floor Management Systems: Influence on Apple Yield and Chemical Composition. J. Agric. Food Chem. 2014, 62, 4095–4103. [Google Scholar] [CrossRef] [PubMed]
- Oszmiański, J.; Lachowicz, S.; Gławdel, E.; Cebulak, T.; Ochmian, I. Determination of phytochemical composition and antioxidant capacity of 22 old apple cultivars grown in Poland. Eur. Food Res. Technol. 2018, 244, 647–662. [Google Scholar] [CrossRef]
- Szot, I.; Lipa, T. Apple trees yielding and fruit quality depending on the crop load, branch type and position in the crown. Acta Sci. Pol. Hortorum Cultus 2019, 18, 205–215. [Google Scholar] [CrossRef]
- Juhart, J.; Medic, A.; Jakopic, J.; Veberic, R.; Hudina, M.; Stampar, F. Using HPLC-MS/MS to Determine the Loss of Primary and Secondary Metabolites in the Dehydration Process of Apple Slices. Foods 2023, 12, 1201. [Google Scholar] [CrossRef]
- Łata, B.; Tomala, K. Apple Peel as a Contributor to Whole Fruit Quantity of Potentially Healthful Bioactive Compounds. Cultivar and Year Implication. J. Agric. Food Chem. 2007, 55, 10795–10802. [Google Scholar] [CrossRef]
- Łata, B.; Trampczynska, A.; Paczesna, J. Cultivar variation in apple peel and whole fruit phenolic composition. Sci. Hortic. 2009, 121, 176–181. [Google Scholar] [CrossRef]
- Juhart, J.; Medic, A.; Veberic, R.; Hudina, M.; Jakopic, J.; Stampar, F. Phytochemical Composition of Red-Fleshed Apple Cultivar ‘Baya Marisa’ Compared to Traditional, White-Fleshed Apple Cultivar ‘Golden Delicious’. Horticulturae 2022, 8, 811. [Google Scholar] [CrossRef]
- Contessa, C.; Botta, R. Comparison of physicochemical traits of red-fleshed, commercial and ancient apple cultivars. Hortic. Sci. 2016, 43, 159–166. [Google Scholar] [CrossRef]
- Gago, C.M.; Guerreiro, A.C.; Miguel, G.; Panagopoulos, T.; Sánchez, C.; Antunes, M.D. Effect of harvest date and 1-MCP (SmartFresh™) treatment on ‘Golden Delicious’ apple cold storage physiological disorders. Postharvest Biol. Technol. 2015, 110, 77–85. [Google Scholar] [CrossRef]
- Tomala, K. Orchard factors affecting fruit storage quality and prediction harvest date of apples. In Proceedings of the International Symposium Effect of Pre-& Postharvest factors in Fruit Storage, Warsaw, Poland, 3–7 August 1997; Volume 485, pp. 373–382. [Google Scholar]
- Łysiak, G.; Kurlus, R.; Zydlik, Z.; Walkowiak-Tomczak, D. Apple skin colour changes during harvest as an indicator of maturity. Acta Sci. Pol. Hortorum Cultus 2014, 13, 71–83. [Google Scholar]
- Wani, N.R.; Hussain, S.Z.; Bej, G.; Naseer, B.; Beigh, M.; Fayaz, U.; Dey, T.; Pal, A.; Akuli, A.; Ghosh, A.; et al. Predicting the optimum harvesting dates for different exotic apple varieties grown under North Western Himalayan regions through acoustic and machine vision techniques. Food Chem. X 2023, 19, 100754. [Google Scholar] [CrossRef]
- Wellner, A.; Grimm, E.; Knoche, M. Effect of Orchard Management Factors on Flesh Color of Two Red-Fleshed Apple Clones. Horticulturae 2019, 5, 54. [Google Scholar] [CrossRef]
- Wang, B.; Jiang, S.; Wang, Y.; Xu, J.; Xu, M.; Sun, X.; Zhu, J.; Zhang, Y. Red-Fleshed Apple Anthocyanin Extract Reduces Furan Content in Ground Coffee, Maillard Model System, and Not-from-Concentrate Apple Juice. Foods 2021, 10, 2423. [Google Scholar] [CrossRef] [PubMed]
- Grimm, E.; Kuhnke, F.; Gajdt, A.; Ostermann, J.; Knoche, M. Accurate Quantification of Anthocyanin in Red Flesh Apples Using Digital Photography and Image Analysis. Horticulturae 2022, 8, 145. [Google Scholar] [CrossRef]
- Wagner, A.; Dussling, S.; Scansani, S.; Bach, P.; Ludwig, M.; Steingass, C.B.; Will, F.; Schweiggert, R. Comparative Evaluation of Juices from Red-Fleshed Apples after Production with Different Dejuicing Systems and Subsequent Storage. Molecules 2022, 27, 2459. [Google Scholar] [CrossRef]
- Khaled, A.Y.; Ekramirad, N.; Donohue, K.D.; Villanueva, R.T.; Adedeji, A.A. Non-Destructive Hyperspectral Imaging and Machine Learning-Based Predictive Models for Physicochemical Quality Attributes of Apples during Storage as Affected by Codling Moth Infestation. Agriculture 2023, 13, 1086. [Google Scholar] [CrossRef]
- Peirs, A.; Schenk, A.; Nicolaï, B.M. Effect of natural variability among apples on the accuracy of VIS-NIR calibration models for optimal harvest date predictions. Postharvest Biol. Technol. 2005, 35, 1–13. [Google Scholar] [CrossRef]
- Jung, S.-K.; Watkins, C. Internal ethylene concentrations in apple fruit at harvest affect persistence of inhibition of ethylene production after1-methylcyclopropene treatment. Postharvest Biol. Technol. 2014, 96, 1–6. [Google Scholar] [CrossRef]
- Szczypiński, P.M.; Strzelecki, M.; Materka, A. Mazda—A software for texture analysis. In Proceedings of the 2007 International Symposium on Information Technology Convergence (ISITC 2007), Jeonju, Republic of Korea, 23–24 November 2007; pp. 245–249. [Google Scholar]
- Szczypiński, P.M.; Strzelecki, M.; Materka, A.; Klepaczko, A. MaZda—A software package for image texture analysis. Comput. Methods Programs Biomed. 2009, 94, 66–76. [Google Scholar] [CrossRef] [PubMed]
- Strzelecki, M.; Szczypiński, P.; Materka, A.; Klepaczko, A. A software tool for automatic classification and segmentation of 2D/3D medical images. Nucl. Instrum. Methods Phys. Res. Sect. A Accel. Spectrometers Detect. Assoc. Equip. 2013, 702, 137–140. [Google Scholar] [CrossRef]
- Tsao, R.; Yang, R. Optimization of a new mobile phase to know the complex and real polyphenolic composition: Towards a total phenolic index using high-performance liquid chromatography. J. Chromatogr. A 2003, 1018, 29–40. [Google Scholar] [CrossRef] [PubMed]
- Witten, I.H.; Frank, E. Data Mining: Practical Machine Learning Tools and Techniques, 2nd ed.; Elsevier: San Francisco, CA, USA, 2005. [Google Scholar]
- Bouckaert, R.R.; Frank, E.; Hall, M.; Kirkby, R.; Reutemann, P.; Seewald, A.; Scuse, D. WEKA Manual for Version 3-9-1; University of Waikato: Hamilton, New Zealand, 2016. [Google Scholar]
- Frank, E.; Hall, M.A.; Witten, I.H. The WEKA Workbench. Online Appendix for Data Mining: Practical Machine Learning Tools and Techniques, Morgan Kaufmann, 4th ed.; University of Waikato: Hamilton, New Zealand, 2016. [Google Scholar]
- Ropelewska, E.; Szwejda-Grzybowska, J. A comparative analysis of the discrimination of pepper (Capsicum annuum L.) based on the cross-section and seed textures determined using image processing. J. Food Process Eng. 2021, 44, e13694. [Google Scholar] [CrossRef]
- Ropelewska, E. Diversity of Plum Stones Based on Image Texture Parameters and Machine Learning Algorithms. Agronomy 2022, 12, 762. [Google Scholar] [CrossRef]
- Sabanci, K.; Aslan, M.F.; Ropelewska, E.; Unlersen, M.F. A convolutional neural network-based comparative study for pepper seed classification: Analysis of selected deep features with support vector machine. J. Food Process Eng. 2022, 45, e13955. [Google Scholar] [CrossRef]
- Matysiak, B.; Ropelewska, E.; Wrzodak, A.; Kowalski, A.; Kaniszewski, S. Yield and quality of romaine lettuce at different daily light integral in an indoor controlled environment. Agronomy 2022, 12, 1026. [Google Scholar] [CrossRef]
- Lakso, A.N.; Corelli Grappadelli, L.; Barnard, J.; Goffinet, M.C. An expolinear model of the growth pattern of the apple fruit. J. Hortic. Sci. 1995, 70, 389–394. [Google Scholar] [CrossRef]
- Zadravec, P.; Veberic, R.; Stampar, F.; Schmitzer, V.; Eler, K. Fruit Growth Patterns of Four Apple Cultivars Using Nonlinear Growth Models. Eur. J. Hort. Sci. 2014, 79, 52–59. [Google Scholar]
- Tijero, V.; Girardi, F.; Botton, A. Fruit Development and Primary Metabolism in Apple. Agronomy 2021, 11, 1160. [Google Scholar] [CrossRef]
- Blanpied, G.D. Measurements of internal ethylene concentration and studies of its efficacy as a predictor of Empire apple storage life. Acta Hortic. 1989, 258, 429–436. [Google Scholar] [CrossRef]
- Łysiak, G. Measurement of ethylene production as a method for determining the optimum harvest date of ‘Jonagored’ apples. Folia Hort. 2014, 26, 117–124. [Google Scholar] [CrossRef]
- Watkins, C.B. Principles and practices of postharvest handling and stress. In Apples: Crop Physiology, Production and Uses; Feree, D., Warrington, I.J., Eds.; CAB International: Wallingford, UK, 2003; pp. 585–614. [Google Scholar]
- Wang, X.; Li, C.; Liang, D.; Zou, Y.; Li, P.; Ma, F. Phenolic compounds and antioxidant activity in red-fleshed apples. J. Funct. Foods 2015, 18, 1086–1094. [Google Scholar] [CrossRef]
- Lemmens, E.; Alós, E.; Rymenants, M.; De Storme, N.; Keulemans, W.J. Dynamics of ascorbic acid content in apple (Malus x domestica) during fruit development and storage. Plant Physiol. Biochem. 2020, 151, 47–59. [Google Scholar] [CrossRef]
- Hoehn, E.; Gasser, F.; Guggenbühl, B.; Künsch, U. Efficacy of instrumental measurements for determination of minimum requirements of firmness, soluble solids, and acidity of several apple varieties in comparison to consumer expectations. Postharvest Biol. Technol. 2003, 27, 27–37. [Google Scholar] [CrossRef]
- Ornelas-Paz, J.; Quintana-Gallegos, B.M.; Escalante-Minakata, P.; Reyes-Hernandez, J.; Perez-Martınez, J.D.; Rios-Velasco, C. Saul Ruiz-Cruz Relationship between the firmness of Golden Delicious apples and the physicochemical characteristics of the fruits and their pectin during development and ripening. J. Food Sci. Technol. 2018, 55, 33–41. [Google Scholar] [CrossRef]
- Famiani, F.; Farinelli, D.; Palliotti, A.; Moscatello, S.; Battistelli, A.; Walker, R.P. Is stored malate the quantitatively most important substrate utilised by respiration and ethanolic fermentation in grape berry pericarp during ripening? Plant Physiol. Biochem. 2014, 76, 52–57. [Google Scholar] [CrossRef]
- Ropelewska, E. The Application of Machine Learning for Cultivar Discrimination of Sweet Cherry Endocarp. Agriculture 2021, 11, 6. [Google Scholar] [CrossRef]
- Vieria, M.; Argenta, L.; Mattheis, J.P. Relationship between dry matter content at harvest and maturity index and post-harvest quality of “Fuji” apples. Rev. Bras. Frutic. 2018, 40, e-596. [Google Scholar] [CrossRef]
- Borsani, J.; Budde, C.O.; Porrini, L.; Lauxmann, M.A.; Lombardo, V.A.; Murray, R.; Andreo, C.S.; Drincovich, M.F.; Lara, M.V. Carbon metabolism of peach fruit after harvest: Changes in enzymes involved in organic acid and sugar level modifications. J. Exp. Bot. 2009, 60, 1823–1837. [Google Scholar] [CrossRef] [PubMed]
- Bhat, M.Y.; Ahsan, H.; Banday, F.A.; Dar, M.A.; Wani, A.I.; Hassan, G.I. Effect of harvest dates, pre harvest calcium sprays and storage period on physico-chemical characteristics of pear cv. Bartlett. J. Agric. Res. Dev. 2012, 2, 101–106. [Google Scholar]
- Walker, R.P.; Battistelli, A.; Moscatello, S.; Chen, Z.H.; Leegood, R.C.; Famiani, F. Phosphoenolpyruvate carboxykinase in cherry (Prunus avium L.) fruit during development. J. Exp. Bot. 2011, 62, 5357–5365. [Google Scholar] [CrossRef]
- Famiani, F.; Walker, R.P. Changes in abundance of enzymes involved in organic acid, amino acid and sugar metabolism, and photosynthesis during the ripening of blackberry fruit. J. Am. Soc. Hortic. Sci. 2009, 134, 167–175. [Google Scholar] [CrossRef]
- Mahmood, T.; Anwar, F.; Abbas, M.; Boyce, M.C.; Saari, N. Compositional variation in sugars and organic acids at different maturity stages in selected small fruits from Pakistan. Int. J. Mol. Sci. 2012, 13, 1380–1392. [Google Scholar] [CrossRef]
- Zhang, X.; Xu, J.; Xu, Z.; Sun, X.; Zhang, Y. Analysis of Antioxidant Activity and Flavonoids Metabolites in Peel and Flesh of Red-Fleshed Apple Varieties. Molecules 2020, 25, 1968. [Google Scholar] [CrossRef]
- Ropelewska, E.; Szwejda-Grzybowska, J. Relationship of Textures from Tomato Fruit Images Acquired Using a Digital Camera and Lycopene Content Determined by High-Performance Liquid Chromatography. Agriculture 2022, 12, 1495. [Google Scholar] [CrossRef]
- Ropelewska, E.; Szwejda-Grzybowska, J. The Estimation of Chemical Properties of Pepper Treated with Natural Fertilizers Based on Image Texture Parameters. Foods 2023, 12, 2123. [Google Scholar] [CrossRef]
- Walkowiak-Tomczak, D.; Idaszewska, N.; Łysiak, G.P.; Bieńczak, K. The Effect of Mechanical Vibration during Transport under Model Conditions on the Shelf-Life, Quality and Physico-Chemical Parameters of Four Apple Cultivars. Agronomy 2021, 11, 81. [Google Scholar] [CrossRef]
- Lipa, T.; Szot, I.; Dobrzański, B., Jr.; Kapłan, M. The assesment of ten apple cultivars and their susceptibility on bruising after storage and shelf-life of fruit treated with 1-MCP. Acta Sci. Pol. Hortorum Cultus 2019, 18, 129–140. [Google Scholar] [CrossRef]

Disclaimer/Publisher’s Note: The statements, opinions and data contained in all publications are solely those of the individual author(s) and contributor(s) and not of MDPI and/or the editor(s). MDPI and/or the editor(s) disclaim responsibility for any injury to people or property resulting from any ideas, methods, instructions or products referred to in the content. |
© 2023 by the authors. Licensee MDPI, Basel, Switzerland. This article is an open access article distributed under the terms and conditions of the Creative Commons Attribution (CC BY) license (https://creativecommons.org/licenses/by/4.0/).