Article

Response of Strawberry to the Substitution of Blue Light by Green Light in an Indoor Vertical Farming System

by
Víctor H. Avendaño-Abarca
1,
Daniela Alvarado-Camarillo
2,*,
Luis Alonso Valdez-Aguilar
1,
Estanislado A. Sánchez-Ortíz
3,
José A. González-Fuentes
1 and
Andrew D. Cartmill
4
1
Departamento de Horticultura, Universidad Autónoma Agraria Antonio Narro, Calz. Antonio Narro No. 1923, Saltillo 25315, Mexico
2
Departamento de Ciencias del Suelo, Universidad Autónoma Agraria Antonio Narro, Calz. Antonio Narro No. 1923, Saltillo 25315, Mexico
3
Departamento de Riego, Universidad Autónoma Agraria Antonio Narro, Calz. Antonio Narro No. 1923, Saltillo 25315, Mexico
4
School of Agriculture, University of Wisconsin-Platteville, 1 University Plaza, Platteville, WI 53818, USA
*
Author to whom correspondence should be addressed.
Agronomy 2023, 13(1), 99; https://doi.org/10.3390/agronomy13010099
Submission received: 29 November 2022 / Revised: 23 December 2022 / Accepted: 26 December 2022 / Published: 28 December 2022
(This article belongs to the Section Innovative Cropping Systems)

Abstract

:
Indoor production systems with light emitting diode (LED) lamps are a feasible alternative for increasing strawberry productivity by reducing the incidence of pests and diseases and the damage caused by extreme weather events. Blue (BL) and red (RL) LED light are considered the most important light spectra for photosynthesis and crop yield; however, recent studies have demonstrated that the beneficial effects of green light (GL) have been underestimated. This information would be of particular importance for strawberry production in controlled-environments/vertical farming systems as it may lower input costs and enhance production efficiency and quality and marketability. The present study aimed to define the effect of GL in combination with BL in strawberry. A proportion of 20% GL (20% BL + 60% RL) of total photosynthetic photon flux density was beneficial for plant growth and productivity; however, a 27% GL (12% BL + 61% RL) proportion was detrimental or comparable to that with 6% GL (36% BL + 58% RF). Total dry mass increased 51% when plants were illuminated with 20% GL lamps compared to those with 6% GL; the most impacted plant part was the root as it increased by 155%. The higher yield was observed with GL at 20%, but further increasing GL to 27% resulted in reduced yield. GL at 20% and 27% exhibited higher photosynthesis but reduced transpiration, stomatic conductance, and internal CO2, which in turn increased instantaneous and intrinsic water-use efficiency. Plants with the highest yield (20% GL) exhibited lower total soluble solids in fruits but still the values obtained were acceptable (8.25 °Brix); these fruits contained a high total sugars and phenolics concentration but a reduced antioxidant scavenging capacity. High proportions of GL were associated with a higher leaf and fruit Ca and a higher leaf P and K, which may be due to the increased allocation of biomass to the roots. In conclusion, GL at 20% and BL at 20% resulted in the best growth and yield parameters, enhanced net photosynthesis rate, water-use efficiency and fruit quality attributes. The effects of GL observed in this study may also be important for other high-value horticultural crops suitable for indoor vertical farming.

1. Introduction

Strawberry (Fragaria × ananassa Duch.) growers face several challenges that affect productivity, quality, yield, and marketability. Transplants of strawberries, free of pests and diseases, are increasingly difficult to source and thus strawberry production necessitates increasing pesticide application, thereby raising environmental concerns and increasing input costs and potentially decreasing profitability. Similarly, more frequent extreme weather events, including frosts and hailstorms, are causing significant losses and creating uncertainty for growers. Controlled-environmental growing systems, including indoor agriculture and vertical farming, offer the potential to increase strawberry productivity, with smaller space requirements, reduced incidence of pests and diseases as well as reduced damage caused by extreme weather conditions. Indoor production systems with artificial lighting based on light emitting diode (LED) lamps can be an economically feasible alternative for food production [1] on which environmental conditions such as temperature, light, and humidity can be controlled, allowing crop production without being affected by extreme weather [2].
Light is the environmental factor that most affects plant growth since it directly influences photosynthesis and strawberry yield [2,3]. LED technology for crop lighting has proven to be a useful tool in maintaining high photosynthetic rates under indoor growing conditions. A high photosynthesis rate promotes the growth of strawberry plants, resulting in increased biomass, leaf area, leaf specific mass, fruit size, and yield [2,4].
Light intensity is a parameter of great importance since an excess or deficiency has repercussions on the growth and performance of plants. Maeda and Ito [5] showed that strawberry plants grown under LED lighting with a photosynthetic photon flux density (PPFD) above 300 µmol m−2 s−1 produced the highest fruit yield, which was even more favorable if this light intensity was combined with a 24 h photoperiod, while a PPFD of 200 µmol m−2 s−1 significantly reduced yield. Light spectra are another important aspect; usually, blue light (400–500 nm) (BL) and red light (600–700 nm) (RL) are used in plant factories [6] as they are considered the most important light spectra for photosynthesis and crop yield [7].
According to Bian et al. [7], it has been demonstrated that the effects of green light (500–600 nm) (GL) have been underestimated and/or misunderstood, as recent reports indicate substantial beneficial effects on plant growth and physiology. For example, GL supplemented to lettuce plants, along with RL and BL, showed increased nitrate and nitrite reductase activities, glutamate synthase and glutamine synthetase activities, high net photosynthetic rate and maximal photochemical efficiency [7]. Similarly, GL in tomato was associated with increased tolerance to drought through increased control of the stomatal aperture and ABA accumulation [8], while in cucumber, GL combined with RL resulted in enhanced net photosynthesis compared to the respective monochromatic treatments and compared to BL light treatments [9]; GL was also reported to decrease stomatic conductance in that study.
Strawberries are ideally suited for controlled-environment production due to their small size and relatively lower light requirements [2]; however, there is limited information on the effect of GL on strawberries. The recent reports indicating that GL positively affected the growth of various high-value horticultural crops rises the interest to investigate if strawberry also responds positively to GL. This information would be of particular importance for strawberry production in controlled-environment/vertical farming systems as it may lower input costs and enhance production efficiency, quality, and marketability. The objective of this study was to investigate the effect of substituting partially BL with varying proportions of GL using LED lamps on the growth, yield, nutritional status, production of various bioactive substances, and gas exchange parameters in strawberry plants grown in a controlled environment vertical system. Our hypothesis was that GL may affect physiological and nutritional parameters and therefore modify the growth of plants and the productivity and quality of fruits.

2. Materials and Methods

2.1. Study Site and Cultural Conditions

The study was installed in the Departmento de Ciencias del Suelo at Universidad Autónoma Agraria Antonio Narro, located in Saltillo, Coahuila, México at lat. 25°21′24″ N, long. 101°02′05″ W, 1765 m above sea level. Strawberry transplants (cv. Albion) were planted in 3 L containers with a sphagnum peat (Premier Horticulture Inc., Quakertown PA, USA) and perlite based medium (50% to 50% v/v); initial substrate pH and electrical conductivity (EC) were 5.7 and 0.25 dS m–1, respectively. Plant density was 5.8 plants/m2. During the vegetative growth, older leaves and stolons were eliminated as well as the first flower truss.
Plants were irrigated with enough nutrient solution to achieve a leaching fraction of 35% when a tensiometer (Irrometer model MLT, Riverside, CA, USA) indicated a water tension of 8 cb. Nutrient solution contained 9 meq L–1 NO3, 0.75 meq L–1 H2PO4, 5.25 meq L–1 SO4–2, 5.25 meq L–1 K+, 6.75 meq L–1 Ca+2, 3.0 meq L–1 Mg+2, and 5 ppm Fe-EDTA, 0.05 ppm Zn-EDTA, 0.02 ppm Cu-EDTA, 0.65 ppm Mn-EDTA, 0.11 ppm Mo, and 0.5 ppm B. The composition of tap water was considered to calculate the nutrient solution, and the final alkalinity was 1.0 meq L–1, pH 5.7 and EC 1.5 dS m–1.

2.2. Indoor Vertical Farming System and Growing Conditions

A rack of 1.72 m in length, 0.80 m width and 2.45 m height was used for the study (Karma Verde Fresh model KVF7, Monterrey, México). The rack had three levels separated 0.45 m (Figure 1). Each level consisted of an aluminum tray measuring 0.80 m width, 1.72 m length and 0.095 m depth (total area of 1.38 m2), which was covered with a black acrylonitrile butadiene styrene plastic tray fitting in the aluminum tray. On the top of each level, the artificial LED lighting system consisting of six light lamps was placed.
During the study, average temperature was maintained at 22.2 °C (26.8 °C day/17.6 °C night) (WatchDog model 1000, Spectrum Technologies Inc., Plainfield, IL, USA) with a 2 ton minisplit (Whirlpool, model WA5260Q, Grand Rapids, MI, USA), while relative humidity (RH) was set at 60% ± 5% with a 0.5 L h−1 ultrasonic humidifier (MistCloud, model MXCUD-001-001, México, México) and a 25 cm diameter extractor, which was connected to a programmable plug digital humidity controller (IHC-200, Inkbird Tech, Guangdong, China). Circulating fans maintained air circulation and average CO2 concentration was 400 ppm (Telaire, model 7001, Amphenol Advanced Sensors, St. Marys, PA, USA).

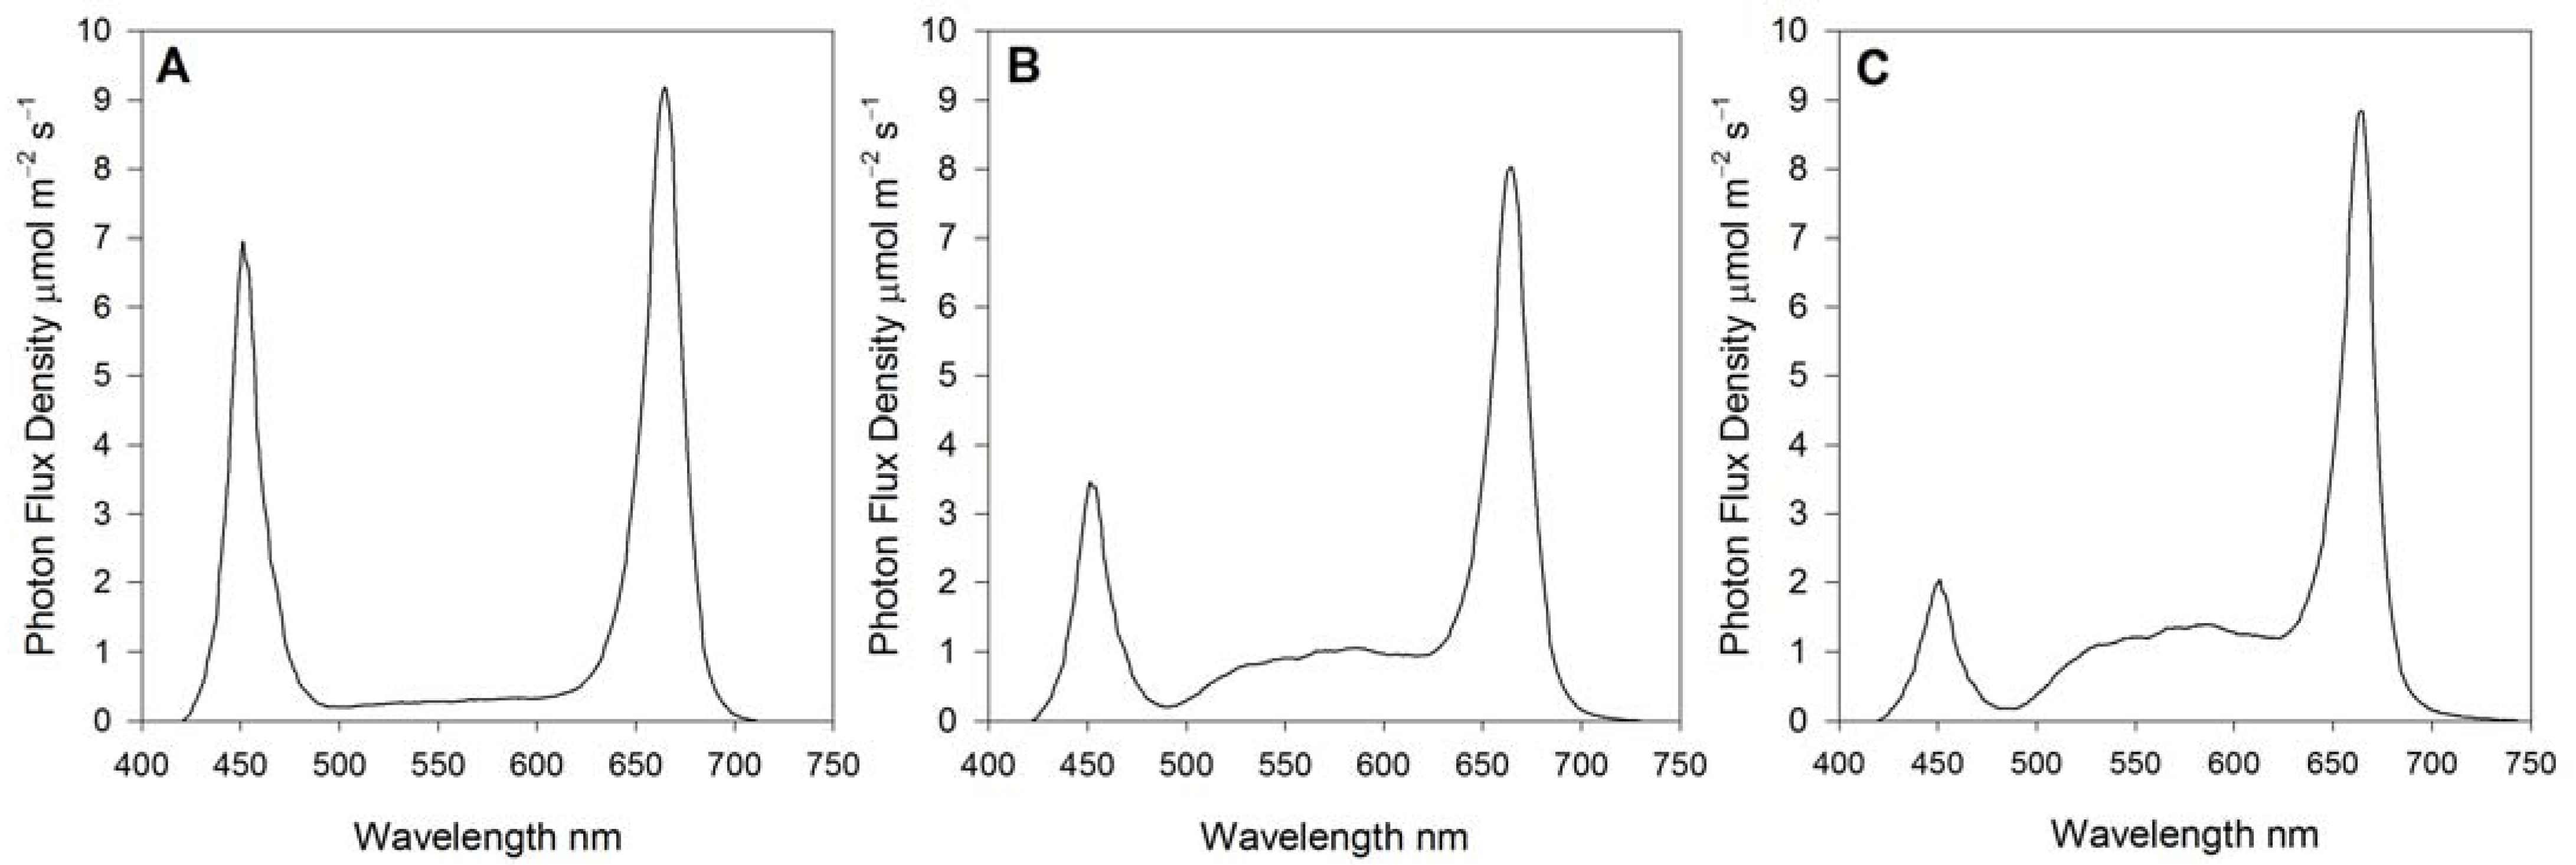
2.3. Green and Blue Light Treatments

A spectroradiometer (Apogee Instruments, model SS-110, Logan, UT, USA) was used to characterize LED lamps (Karma Verde Fresh, Monterrey, México); the spectroradiometer had a 340 to 820 nm measurement range and a ± 4% accuracy in clear and unpolluted days. To determine the average PPFD, the entire area of each rack was divided into a grid of 18 equally spaced sections per level (each section was 26.7 cm × 29.7 cm); at 20 cm from the light source, the average PPFD was 427.7 µmol m−2 s−1.
To avoid light contamination among treatments, an aluminized plastic sheet was installed to cover the levels for homogeneous distribution of light to all the sampling sites. The spectral distribution and the GL and BL balances assessed in this study are shown in Table 1 and Figure 2. In our study, RL was considered comparable in the three treatments as the partial photosynthetic photon flux density (PPFD) and the balance was very similar (Table 1).

2.4. Growth Parameters

The number of leaves and crowns per plant, and root, crowns and leaves fresh and dry mass (oven dried at 70 °C for three days) were measured 115 days after transplanting. Fully mature fruits from the first and second truss were harvested from 27 June 2020 and weighed.

2.5. Leaf Nutrient Status

Dried leaves were ground to pass a 40-mesh (Mini Willey Mill, Thomas Scientific, Swedesboro, NJ, USA) for mineral analysis. Nitrogen (N), phosphorus (P), potassium (K), calcium (Ca) and magnesium (Mg) concentrations were determined in a 0.25 g sample of ground leaf tissue digested in 2 mL of a 2:1 mixture of H2SO4 and HClO4, and 1 mL of 30% H2O2. The digest was brought to 25 mL with distilled and filtered water before measuring the concentration of P, K, Ca and Mg with an inductively coupled plasma atomic emission spectrometer (Liberty Model, VARIAN, Santa Clara, CA, USA) [10]. Nitrogen was determined by the semi-micro Kjeldahl procedure [11].

2.6. Gas Exchange Parameters

Photosynthetic rate, stomatal conductance, transpiration rate, and internal CO2 concentration were measured with a portable photosynthesis system (LI-COR 6400XT, Biosciences, Lincoln, NE, USA) on young fully developed leaves. Measurements were replicated three times and were conducted from 1 p.m. to 2 p.m. at two measuring dates: 5 and 26 July 2002. During the measurements, CO2 concentration was set at 376 μmol mol–1, air temperature at 33.2 °C, and the relative humidity at 55%.

2.7. Fruit Firmness and Selected Ion Content

Firmness of recently harvested mature fruits was measured with a portable penetrometer with a 3 mm flat probe (QA Supplies LLC, Norfolk, VA, USA). Nitrate (NO3), K and Ca concentration was measured in the juice extracted from fully mature fruits with a portable ionmeter (LAQUAtwin, Horiba Scientific, Kyoto, Japan).

2.8. Fruit Organoleptic and Bioactive Compounds

2.8.1. Total and Reducing Sugars

A 1 g sample of frozen tissue from fruits was crushed in a mortar, boiled in 40 mL of an 80% ethylic alcohol solution for 5 min, and filtered. The alcohol extract (1 mL) was evaporated in a water bath at 80 °C and dissolved in 30 mL of deionized water. Total and reducing sugars were determined in the alcohol solution as described by Somogyi [12] with a spectrophotometer (DR-5000 Hach Co., Loveland, CO, USA) at 600 and 540 nm, respectively.

2.8.2. Anthocyanins

Anthocyanins concentration was determined in a 0.5 g crushed fruit sample, which was homogenized (T25 Disperser, ULTRA-TURRAX, IKA-Werke GmbH and Co. KG, Staufen, Germany) with 5 mL of a pH 1.0 and pH 4.5 buffer, filtered and then centrifuged for 30 min at 4500 rpm (Z326K Hermle, Wehingen, Germany). Once the extract was ready, each of both 1.0 and 4.5 pH samples were read with a spectrophotometer (DR-5000 Hach Co., Loveland, CO, USA) at 520 nm and 700 nm, respectively. Data were transformed to anthocyanins concentrations using the formula by Lee et al. [13].

2.8.3. Antioxidant Activity by DPPH

Antioxidant activity by the 2.2-Diphenyl-l-pict3,1hydrazyl (DPPH) method by Brand-Williams et al. [14] was determined. One gram of frozen fruit tissue was homogenized (T25 Disperser, ULTRA-TURRAX, IKA-Werke GmbH and Co. KG, Staufen, Germany) with 10 mL of deionized water for 20 s and then centrifuged at 4000 rpm g for 20 s at 4 °C (Z326K Hermle, Wehingen, Germany). The supernatant was used to evaluate the antioxidant activity. A total of 100 µL of the supernatant was added to the DPPH solution of 6.1 × 10⁻⁵ M (Sigma Aldrich, Saint Louis, MO, USA) and incubated in darkness for 30 min after which the absorbance was measured at 517 nm. Antioxidant activity was evaluated using a standard curve with ascorbic acid (0–100 mg L−1) and data were expressed as mg of ascorbic acid equivalents per 100 g of fresh mass (mg EAA/100 gfw).

2.8.4. Antioxidant Activity by FRAP

Antioxidant activity in 1 g samples of fresh fruit tissue was also measured by the ferric reducing antioxidant power (FRAP) method by Benzie and Strain [15]. The tissue was homogenized (T25 Disperser, ULTRA-TURRAX, IKA-Werke GmbH and Co. KG, Staufen, Germany) in 10 mL deionized water for 20 s, filtered and centrifuged at 4000 rpm for 15 min (Z326K Hermle, Wehingen, Germany). The FRAP reagent (TPTZ, FeCl3 and acetate buffer) at 1.9 mL was mixed with 100 µL of deionized water and it was incubated for 10 min at 37 °C and then the absorbance was measured at 593 nm. Data were expressed as mg ascorbic acid equivalents per 100 g of fresh mass (mg EAA/100 gfw).

2.8.5. Antioxidant Activity by ABTS

Antioxidant activity by the 2,2′-azino-bis (3-ethylbenzothiazoline-6-sulfonic acid) (ABTS) method was measured by the technique reported by Re et al. [16] in a 1 g frozen fruit sample homogenized (T25 Disperser, ULTRA-TURRAX, IKA-Werke GmbH and Co. KG, Staufen, Germany) in 10 mL deionized water for 20 s, filtered and centrifuged at 4000 rpm for 15 min (Z326K Hermle, Wehingen, Germany). The ABTS reagent at mixed 7 mM and 2.45 mM potassium persulfate (K2S2O8) which were mixed at 1:1 proportion (v/v). The mixture was incubated during 16 h and then diluted in 20% ethanol until reaching an absorbance of 0.7 at 734 nm. An aliquot of 100 μL mixed with 3 mL of ABTS was incubated for 15 min and then the absorbance was measured at the wavelength previously mentioned. Data were expressed as mg of ascorbic acid equivalents per 100 g of fresh mass (mg EAA/100 gfw).

2.8.6. Total Phenols and Flavonoids

The concentration of total phenols was determined according to the Folin–Ciocalteu methodology [17]; 1 g of strawberry frozen fruit tissue was homogenized (T25 Disperser, ULTRA-TURRAX, IKA-Werke GmbH and Co. KG, Staufen, Germany) for 20 s and 12 mL of deionized water was added, then filtered and the solution recovered was later centrifuged at 4000 rpm (Z326K Hermle, Wehingen, Germany). An aliquot of 300 µL plus 700 µL was taken and 2.5 mL of Folin–Ciocalteu reagent (1:10 diluted with deionized water) was added; after 5 to 8 min, 2 mL of sodium carbonate (7.5% weight/volume) was added and the mixture was incubated in diffused light for 2 h prior to reading the absorbance with a spectrophotometer (DR-5000 Hach Co., Loveland, CO, USA) at 760 nm. The results were expressed as mg equivalents of gallic acid per 100 g of fresh mass (mg GAE/100 gfw).
Flavonoids were determined according to the Woisky and Salatino method [18]. An extract was prepared with 1 g of strawberry fruit tissue and adding 10 mL of methanol and the mixture homogenized (T25 Disperser, ULTRA-TURRAX, IKA-Werke GmbH and Co. KG, Staufen, Germany) for 20 s and filtered. From the filtered mixture, a 2 mL sample was mixed with 2 mL of aluminum trichloride at 2% (w/v), and left for 15 min in the dark. The absorbance was recorded at 415 nm in a spectrophotometer (DR-5000 Hach Co., Loveland, CO, USA) and the results were expressed as equivalent mg of quercetin per 100 g of fresh mass (mg EQ/1000 gfw).

2.8.7. Total Soluble Solids and Titratable Acidity

Total soluble solids and titratable acidity extracts were prepared with 1 g of strawberry fruits homogenized (T25 Disperser, ULTRA-TURRAX, IKA-Werke GmbH and Co. KG, Staufen, Germany) with 10 or 20 mL of deionized water, respectively, and then filtered. Total soluble solids were determined in two drops of the filtrate placed in a digital refractometer (PAL-1, Atago, Japan) and the results reported in °Brix. Titratable acidity was determined according to the methodology described by AOAC [19], using 3 drops of phenolphthalein as indicator in a 5 mL aliquot from the homogenized tissues and titrated with NaOH 0.1 N; the results were expressed as percent of citric acid.

2.9. Experimental Design and Statistical Analysis

Each level of the rack contained LED lamps that rendered the three green and blue light balances assessed in this study. On each level, 18 strawberry plants were placed, considering each plant as a replicate. Data were analyzed with a one-way analysis of variance (SAS Institute Inc., Cary, NC, USA) and when significance was detected, means were separated using Duncan’s procedure with p < 0.05.

3. Results

3.1. Fruit Yield and Vegetative Growth

Compared to plants with low GL proportions, strawberry produced a higher fruit yield when grown in a GL and BL balance of 20% and 20%, respectively (Figure 3), although the number of fruits harvested was not significantly different (Table 2).
Increasing GL up to 27% of the total PPFD resulted in a higher number of leaves and crowns than those in plants grown with only 6% of GL (Table 2); however, the fresh (Figure 4) and dry (Table 3) total dry mass and that of the roots and crowns were higher when the GL was at 20%.

3.2. Gas Exhange Parameters

GL at 20% of PPFD increased net photosynthesis (Figure 5) and transpiration (Table 4 and Table 5) rate in both sampling dates, although further increases in GL resulted in a significant reduction in both gas exchange parameters. Carbon dioxide internal concentration and stomatic conductance tended to decrease as the proportion of GL increased during the first sampling date (Table 4); however, at the second sampling date there was not a consistent pattern (Table 5). In general, the higher photosynthetic rates (Figure 5) were associated with low CO2 internal concentrations and higher stomatic conductance (Table 4 and Table 5), while the reduced transpiration rates were associated with the higher stomatic conductance (Table 4 and Table 5).

3.3. Leaf Nutrient Status

Leaf N and Mg were not affected by the GL and BL balance (Table 6); however, P, K and Ca (Figure 6) concentrations increased when plants were grown with a GL balance of 20%; further increases in P and K were observed when GL balance was increased up to 27% of the PPFD (Figure 6).

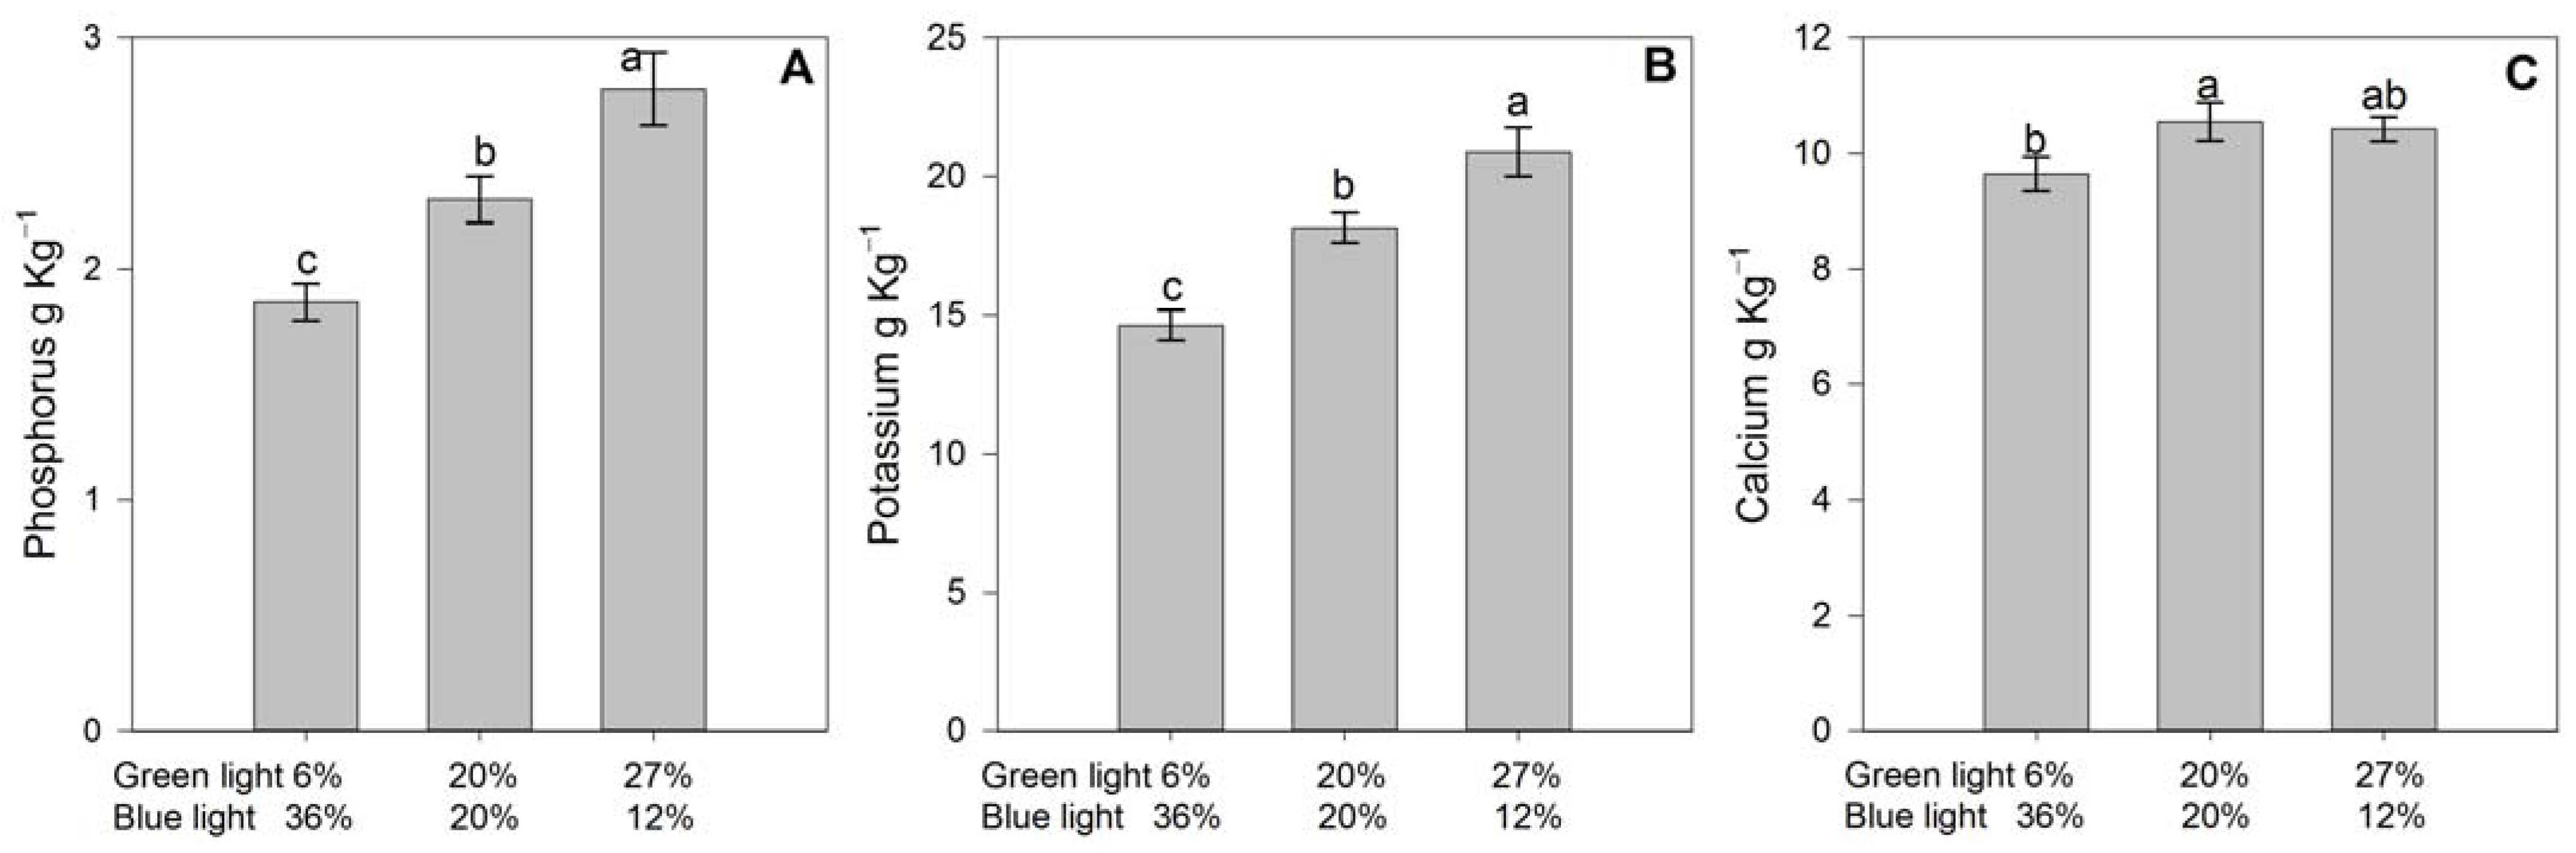
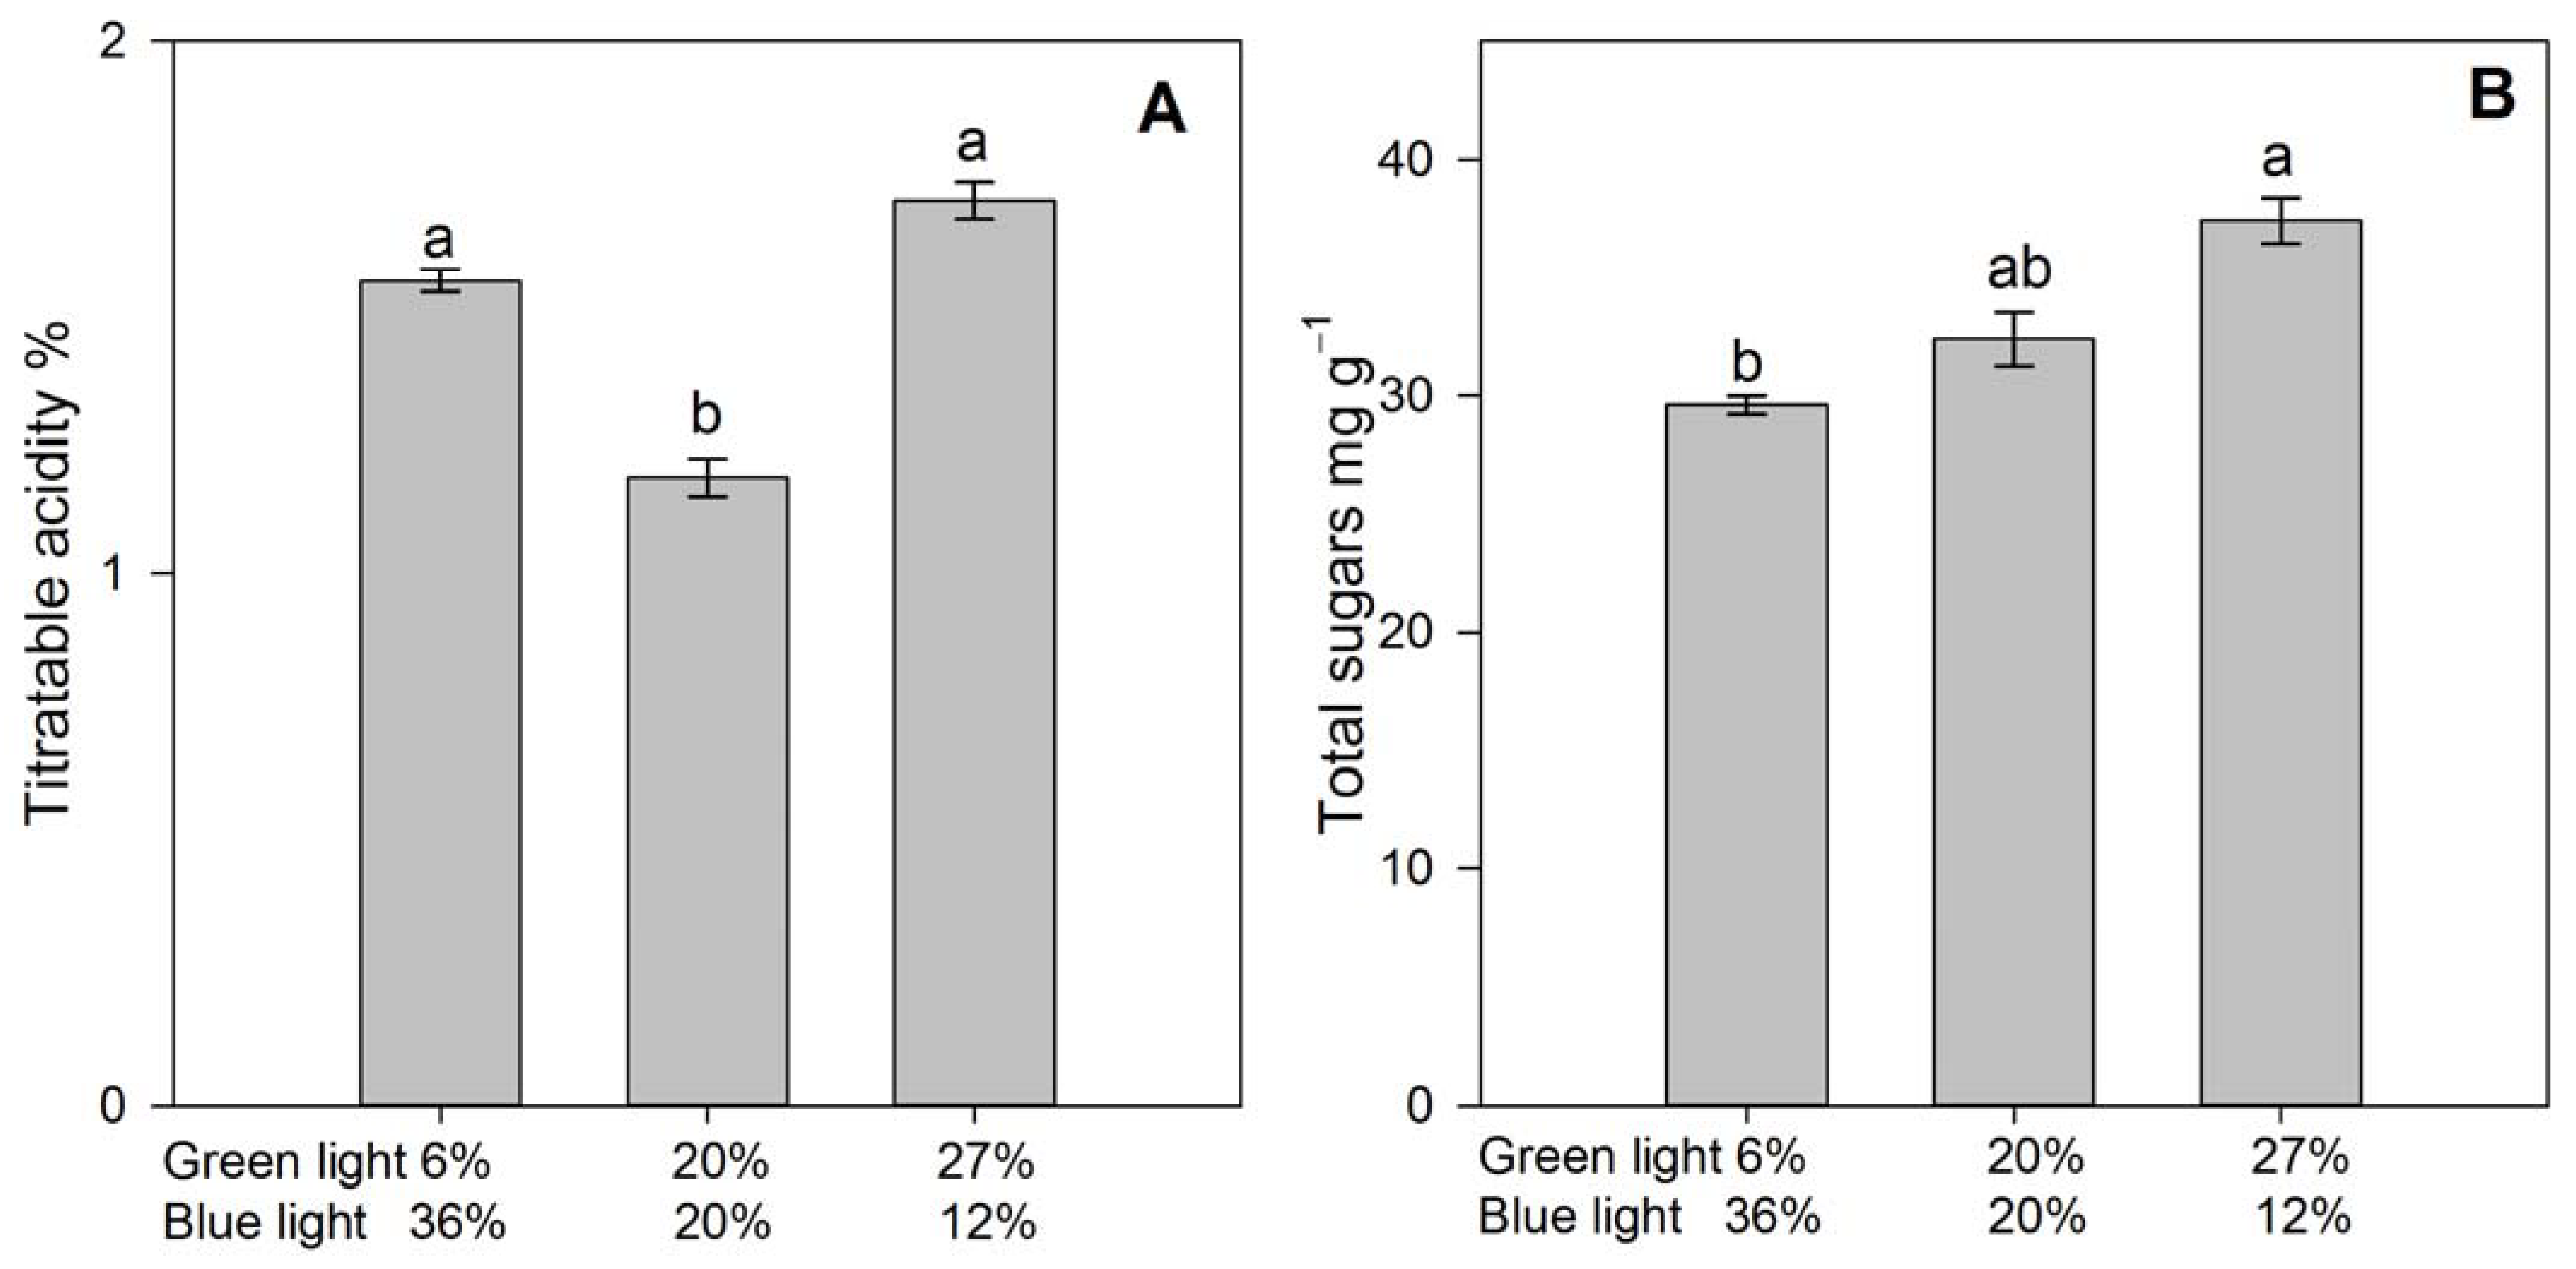
3.4. Fruit Quality and Selected Ion Concentrations in Fruit Extract

Fruit firmness and reducing sugars content were not affected by the GL and BL balance (Table 6), nonetheless, total soluble solids (Table 6), titratable acidity (Figure 7) and total sugars content (Figure 7) was higher in fruits from plants grown with a 27%/12% GL/BL balance. A high proportion of GL was also associated with higher fruit Ca concentration (Figure 8), while there was not a significant effect on NO3 and K (Table 7).

3.5. Fruit Bioactive Compounds

Increasing GL proportions up to 27% resulted in increased fruit phenols concentration but decreased antioxidant activity determined by the DPPH and ABTS methods (Figure 9), while flavonoids and anthocyanins concentration and antioxidant activity, measured by the FRAPS method, were unaffected by GL (Table 7).

4. Discussion

4.1. Plant Growth and Yield

The results obtained in the present study indicated that proportions of GL of 20% were beneficial for plant growth and productivity; however, proportions of 27% were detrimental or comparable to those of plants grown with 6% of GL. When compared to plants receiving only 6% GL, strawberry plants produced higher biomass when GL was provided at 20% and 27% of total PPFD. However, higher yield of fruits was observed when GL was 20%, but further increases in GL resulted in decreased fruit productivity. Guiamba et al. [20] reported comparable results, as GL at 20%, combined with BL and RL at 30% and 50%, respectively, resulted in high strawberry yields but only when PPFD was 250 µmol m−2 s−1, while lower light intensity resulted in yield reductions even though GL had been provided. Trojak et al. [21] also reported comparable results in tomato transplants grown with GL at proportions of 10% and 20%, which exhibited increased root and stem biomass.
The detrimental effects when the proportions of GL were close to 30%, observed in the present study, were reported in spinach by Nguyen et al. [22] as biomass decreased when plants were supplied with a blue–green–red light balance of 20%B/30%G/50%R and 33%B/33%G/33%R compared to plants with no GL, whereas Trojak et al. [21] in 24-day-old tomato transplants reported that proportions of GL of 40%, substituting RL, resulted in a significant reduction in total dry mass. The adverse effect of high proportions of GL was also observed in the present study, as at 20% of the total PPFD, GL had no effect on the crown biomass, but a 27% GL resulted in a 43% reduction in fresh and dry mass. The higher crown biomass at 20% of GL would explain the increased fruit yields observed as, according to Torres-Quezada et al. [23], larger strawberry crowns render 21% to 36% higher yields compared to plants with smaller crowns.
In our study, the roots were the most sensitive plant part to GL, as its biomass increased by 155% and 110% under 20% and 27% GL, compared to plants grown with 6%; these results suggest that under adequate proportions of GL, strawberry plants prioritize biomass partitioning towards the root instead of the shoot, as also shown by Trojak et al. [21] in tomato.

4.2. Gas Exchange Parameters

The artificial lighting used in vertical agricultural systems usually contains little or no GL as it has been considered photosynthetically less efficient compared to BL and RL [21]. However, current knowledge indicates that GL stimulates net carbon fixation at canopy levels where shading is more intense and in deeper zones of the mesophyll [24]. Recent reports indicate that compared to monochromatic BL or RL, plants show increased gross photosynthesis when supplied with increasing proportions of GL (Liu and Van Iersel, 2021) [25]. Our results indicate that strawberries growth is also enhanced by GL, as net photosynthesis was highest when it was provided at 20% of total PPFD. Liu and Van Iersel [25] suggested that this is due to the more uniform distribution of GL, thereby allowing higher photosynthesis in the deeper mesophyll cells. Trojak et al. [21] reported that tomato exhibited no increase in photosynthesis when GL was supplied under a reduction in RL; however, it was significantly decreased at extreme low (10%) or extreme high (40%) GL, which is in agreement with our results with 6% and 27% of GL.
In our study, decreasing the proportion of GL was accomplished by increasing the proportion of BL. BL is known as a signal for stomatal aperture [26], thus impacting leaf gas exchange parameters, including transpiration, photosynthesis, internal CO2 concentration, and stomatic conductance. This is in agreement with the results observed in our study, as a high balance of BL (36%) was associated with a high transpiration rate, stomatic conductance, and internal CO2 concentration on the first sampling date, although the photosynthesis rate was not the maximum. However, decreasing the BL to 20% also resulted in a high transpiration rate and stomatic conductance, but net photosynthesis was the maximum, probably as a result of the increase of GL proportion to 20%. Furthermore, increasing GL up to 27% reduced transpiration rate and stomatal conductance, although these responses may be ascribed to the concurrent reduction in BL and its effect on controlling stomata opening [27].
The effect of GL on transpiration and conductance also had an effect on plant instantaneous water-use efficiency (µmol CO2 fixed on photosynthesis per mmol of H2O transpired). Averaged across both sampling dates, instantaneous water-use efficiency was 2.64, 3.71 and 3.62 µmol CO2 mmol−1 H2O when the GL proportion increased from 6%, 20% and 27%, respectively, suggesting that strawberry is more efficient in water use when GL is higher than BL. Similarly, intrinsic water-use efficiency (µmol CO2 fixed on photosynthesis per mol−1 H2O of stomatic conductance) exhibited similar tendencies (60.8, 77.0 and 70.8 µmol CO2 mol−1 H2O). Trojak et al. [21] reported similar results in tomato when GL was increased from 10% up to 40%.

4.3. Fruit Quality Atributes

Despite the lower yield, fruits from plants illuminated with 27% GL had a high content of total soluble solids. In contrast, the fruits harvested from plants with the highest yield (20% GL) exhibited a lower content of total soluble solids. However, despite the lower total soluble solids, the values obtained were still acceptable as they were close to those reported by Maeda and Ito [5] in strawberries grown under different conditions of photon flux density (7.4 and 8.9 °Brix,) and by Díaz-Galián et al. [28] (7.66 and 7.99 °Brix).
The sweet–sour taste in fruits is caused by the balance between the acidity caused by organic acids [29] and by sugars concentration [30]. Accordingly, the taste of strawberry fruits in the present study was affected by the BL and GL balances as both parameters were significantly affected. The fruits from plants with a 20% GL resulted in a sweeter flavor as they contained a high total sugars concentration, probably due to the higher photosynthetic capacity exhibited by such plants; however, the fruits from plants with a higher proportion of GL (27%) also had a high total sugars concentration and a high acidity, thereby enhancing the flavor, and potentially the marketability.
Choi et al. [31,32] reported that in strawberries illuminated with BL there was a low sucrose concentration compared to those plants that received mixed RL and BL; this is in line with our results, as plants that received the highest BL proportion turned out to have the lowest total sugars concentration in the fruits, whereas illuminating them with a low proportion of BL resulted in fruits with high sugar and high total soluble solids.

4.4. Fruit Antioxidant Capacity

The quality of strawberry fruits is determined, in addition to soluble sugars, organic acids, and antioxidants, by functional substances such as anthocyanins, flavonoids, and phenolics, which reduce the damage caused by reactive oxygen species [32]. The production of phenolics has been demonstrated to be enhanced by RL [31]; however, other authors have reported that BL is as well associated with increased phenolics concentration in the leaves of lettuce [33]. Our results indicate that plants grown with higher proportions of GL resulted in fruits of better quality, as they contained the highest concentration of phenolics; however, concurrently with that increase in phenolics, the fruits also exhibited a lower antioxidant scavenging capacity. Similar results were reported in lettuce as total phenolic compounds increased after 12 h of exposure to continuous GL, in addition to RL and BL, and the free radical scavenging capacity determined by DPPH was reduced [34].
The generation of reactive oxygen species that cause oxidative damage in cell membranes has been associated with the stress caused by continuous lighting in lettuce plants, causing plants to respond by increasing the DPPH radical scavenging activity [34]. The decrease in the scavenging capacity observed in our study under high proportions of GL may be due to the effect of GL partially reducing lipid peroxidation, as reported by Bian et al. [7] in lettuce plants; thus, suggesting that plants grown with 6% of GL and 36% of BL were under stress and that higher proportions of GL ameliorated this stress.

4.5. Leaf and Fruit Nutrient Status

In the present study, high proportions of GL (27%) were associated with higher leaf and fruit Ca status and higher leaf P and K concentration. Our results are in contrast to those reported in lettuce by Razzak et al. [6] as shoot K tended to decrease when GL irradiance was increased from 0 to 70 µmol m−2 s−1 while RL and BL were sustained at 188 and 47 µmol m−2 s−1, respectively. The enhanced nutrient status observed in our study may be due to the increased allocation of biomass to the roots in plants treated with high proportions of GL, as suggested by the increased root dry mass, thus providing the roots with more energy for nutrient uptake.
Calcium translocation takes place mainly through the xylem and it is driven by the transpirational stream [35]. Therefore, a higher transpiration rate would be expected to be associated with a higher Ca status in plants. However, in our study, leaf and fruit Ca were highest in plants grown under high GL proportion (27%) despite its low transpiration rate. This result may be due to the high root biomass compared to plants with 6% of GL (52% and 61% in dry biomass increase in plants with 27% and 20% GL), thus, the promotion of root growth may have resulted in higher root branching and formation of root apices, as reported by Ma et al. [36] in cucumber plants under increased GL proportion. As Ca is preferably acquired in the root’s tip where the Casparian strip is not formed [37], the promoted root growth observed in plants illuminated with GL may have resulted in increased Ca uptake.

5. Conclusions

The present study suggests that using GL may impact positively on the cultivation of plants in indoor vertical production systems, as it promotes the growth of strawberries. Strawberry plants receiving GL at a proportion of 20% of total PPFD resulted in enhanced photosynthesis, which was associated with an increased biomass accumulation. Biomass was preferably allocated towards the roots, which, in turn, was associated with a higher accumulation of leaf and fruit Ca and higher leaf P and K. The increase in GL, associated with the decrease in BL, caused an increase in water use efficiency due to a decrease in transpiration and stomatic conductance. Strawberry fruit quality was not affected by GL at 20% in terms of sugar concentration and it was increased due to a higher phenolics content, although the scavenging capacity was reduced. The effects of GL observed in our study may also be important on other high-value horticultural crops suitable for indoor vertical farming.

Author Contributions

Conceptualization, D.A.-C. and V.H.A.-A.; methodology, V.H.A.-A., D.A.-C., L.A.V.-A., E.A.S.-O. and D.A.-C.; validation, E.A.S.-O. and D.A.-C.; formal analysis, A.D.C., L.A.V.-A. and J.A.G.-F.; investigation, V.H.A.-A., D.A.-C., L.A.V.-A. and E.A.S.-O.; resources, A.D.C.; data curation, A.D.C. and J.A.G.-F.; writing—original draft, D.A.-C.; writing—review and editing, J.A.G.-F. and A.D.C.; visualization, L.A.V.-A.; project administration, A.D.C., L.A.V.-A. and J.A.G.-F. All authors have read and agreed to the published version of the manuscript.

Funding

This research and the APC was funded by KARMA VERDE FRESH.

Data Availability Statement

Not applicable.

Conflicts of Interest

The authors declare no conflict of interest.

References

  1. Kosai, T.; Niu, G.; Takagaki, M. Plant Factory: An Indoor Vertical Farming System for Efficient Quality Food Production; Associated Press: London, UK, 2019; p. 405. [Google Scholar]
  2. Yoshida, H.; Mizuta, D.; Fukuda, N.; Hikosaka, S.; Goto, E. Effects of varying light quality from single-peak blue and red light-emitting diodes during nursery period on flowering, photosynthesis, growth, and fruit yield of everbearing strawberry. Plant Biotechnol. 2016, 33, 267–276. [Google Scholar] [CrossRef] [PubMed] [Green Version]
  3. Hidaka, K.; Ito, E.; Sago, Y.; Yasutake, D.; Miyoshi, Y.; Kitano, M.; Miyauchi, K.; Okimura, M.; Imai, S. High yields of strawberry by applying vertically-moving beds on the basis of leaf photosynthesis. Environ. Control. Biol. 2012, 50, 143–152. [Google Scholar] [CrossRef] [Green Version]
  4. Hidaka, K.; Dan, K.; Imamura, H.; Miyoshi, Y.; Takayama, T.; Sameshima, K.; Okimura, M. Effect of supplemental lighting from different light sources on growth and yield of strawberry. Environ. Control. Biol. 2013, 51, 41–47. [Google Scholar] [CrossRef] [Green Version]
  5. Maeda, K.; Ito, Y. Effect of different PPFDs and photoperiods on growth and yield of everbearing strawberry ‘Elan’ in plant factory with white LED lighting. Environ. Control. Biol. 2020, 58, 99–104. [Google Scholar] [CrossRef]
  6. Razzak, M.A.; Asaduzzaman, M.; Tanaka, H.; Asao, T. Effects of supplementing green light to red and blue light on the growth and yield of lettuce in plant factories. Sci. Hortic. 2022, 305, 111429. [Google Scholar] [CrossRef]
  7. Bian, Z.; Yang, Q.; Li, T.; Cheng, R.; Barnett, Y.; Lu, C. Study of the beneficial effects of green light on lettuce grown under short-term continuous red and blue light-emitting diodes. Physiol. Plant. 2018, 164, 226–240. [Google Scholar] [CrossRef] [Green Version]
  8. Bian, Z.; Wang, Y.; Zhang, X.; Grundy, S.; Hardy, K.; Yang, Q.; Lu, C. A transcriptome analysis revealing the new insight of green light on tomato plant growth and drought stress tolerance. Front. Plant Sci. 2021, 12, 2325. [Google Scholar] [CrossRef]
  9. Claypool, N.B.; Lieth, J.H. Green light improves photosystem stoichiometry in cucumber seedlings (Cucumis sativus) compared to monochromatic red light. Plants 2021, 10, 824. [Google Scholar] [CrossRef]
  10. Soltanpour, P.N.; Johnson, G.W.; Workman, S.M.; Jones, J.B.; Miller, R.O. Inductively coupled plasma emission spectrometry and inductively coupled plasma mass spectrometry. In Methods of Soil Analysis. Part 3. Chemical Methods; Sparks, D.L., Ed.; Soil Science Society of North America: Madison, WI, USA, 1996; pp. 91–139. [Google Scholar]
  11. Bremner, J.M. Total nitrogen. In Methods of Soil Analysis. Part II. Chemical Methods; Sparks, D.L., Ed.; Springer Soil Science Society of America: Madison, WI, USA, 1996; pp. 1085–1086. [Google Scholar]
  12. Somogy, A.; Rosta, K.; Puszyai, P.; Tulassay, Z.; Nagy, G. Antioxidant measurements. Physiol. Meas. 2007, 8, 41–55. [Google Scholar] [CrossRef]
  13. Lee, J.; Durst, R.W.; Wrolstad, R.E. Determination of total monomeric anthocyanin pigment content of fruit juices, beverages, natural colorants and wines by the pH differential method: Collaborative study. J. AOAC Int. 2005, 88, 1269–1278. [Google Scholar] [CrossRef]
  14. Brand-Williams, W.; Culiver, M.E.; Berset, C. Use of a free radical method to evaluate antioxidant activity. In Lebensmittel Wissenschaft and Technologie. Food Science Technology; Springer: Amsterdam, The Netherlands, 1995; Volume 28, pp. 25–30. [Google Scholar]
  15. Benzie, I.F.F.; Strain, J.J. The ferric reducing ability of plasma (FRAP) as a measure of “antioxidant power”: The FRAP assay. Anal. Biochem. 1996, 239, 70–76. [Google Scholar] [CrossRef] [PubMed] [Green Version]
  16. Re, R.; Pellegrini, N.; Proteggente, A.; Pannala, A.; Yang, M.; Rice-Evans, C. Antioxidant activity applying an improved ABTS radical action decolonization assay free. Radic. Biol. Med. 1999, 26, 1231–1337. [Google Scholar] [CrossRef] [PubMed]
  17. Margraf, T.; Karnopp, A.R.; Rosso, N.D.; Granato, D. Comparison between Folin-Ciocalteu and Prussian blue assays to estimate the total phenolic content of juices and teas using 96 well microplates. J. Food Sci. 2015, 80, 2397–2403. [Google Scholar] [CrossRef] [PubMed]
  18. Woisky, R.G.; Salatino, A. Analysis of propolis: Some parameters and procedures for chemical quality control. J. Aplicultural Res. 1998, 37, 99–105. [Google Scholar] [CrossRef]
  19. AOAC. Official Methods of Analysis, 15th ed.; Association of Official Analytical Chemist: Arlington, VA, USA, 1990; p. 1298. [Google Scholar]
  20. Guiamba, H.; Zhang, X.; Sierka, E.; Lin, K.; Ali, M.M.; Ali, W.M.; Lamlon, S.F.; Kalaji, H.M.; Telesinski, A.; Yousef, A.F.; et al. Enhancement of photosynthesis efficiency and yield of strawberry (Fragaria ananassa Duch.) plants via LED systems. Front. Plant Sci. 2022, 13, 918038. [Google Scholar] [CrossRef]
  21. Trojak, M.; Skowron, E.; Sobala, T.; Kocurek, M.; Pałyga, J. Effects of partial replacement of red by green light in the growth spectrum on photomorphogenesis and photosynthesis in tomato plants. Photosynth. Res. 2022, 151, 295–312. [Google Scholar] [CrossRef]
  22. Nguyen, T.P.D.; Jang, D.C.; Tran, T.T.H.; Nguyen, Q.T.; Kim, I.S.; Hoang, T.L.H.; Vu, N.T. Influence of green light added with red and blue LEDs on the growth, leaf microstructure and quality of spinach (Spinacia oleracea L.). Agronomy 2021, 11, 1724. [Google Scholar] [CrossRef]
  23. Torres-Quezada, E.A.; Zotarelli, L.; Whitaker, V.M.; Santos, B.M.; Hernandez-Ochoa, I. Initial crown diameter of strawberry bare-root transplants affects early and total fruit yield. HortTechnology 2015, 25, 203–208. [Google Scholar] [CrossRef] [Green Version]
  24. Smith, H.L.; McAusland, L.; Murchie, E.H. Don’t ignore the green light: Exploring diverse roles in plant processes. J. Exp. Bot. 2017, 68, 2099–2110. [Google Scholar] [CrossRef] [Green Version]
  25. Liu, J.; Van Iersel, M.W. Photosynthetic physiology of blue, green, and red light: Light intensity effects and underlying mechanisms. Front. Plant Sci. 2021, 12, 619987. [Google Scholar] [CrossRef]
  26. Inoue, S.I.; Kinoshita, T. Blue light regulation of stomatal opening and the plasma membrane H+-ATPase. Plant Physiol. 2017, 174, 531–538. [Google Scholar] [CrossRef] [PubMed] [Green Version]
  27. Vialet-Chabrand, S.; Matthews, J.S.; Lawson, T. Light, power, action! Interaction of respiratory energy-and blue light-induced stomatal movements. New Phytol. 2021, 231, 2231–2246. [Google Scholar] [PubMed]
  28. Díaz-Galián, M.V.; Torres, M.; Sanchez-Pagán, J.D.; Navarro, P.J.; Weiss, J.; Egea-Cortines, M. Enhancement of strawberry production and fruit quality by blue and red LED lights in research and commercial greenhouses. S. Afr. J. Bot. 2021, 140, 269–275. [Google Scholar] [CrossRef]
  29. Pašalić, B.; Todorović, V.; Koleška, I.; Bosančić, B.; Đekić, N. Effects of salinity on color changes, sugar and acid concentration in tomato fruit. Agriclturae Conspec. Sci. 2017, 81, 137–142. [Google Scholar]
  30. Iglesias, M.J.; García-López, J.; Collados-Luján, J.F.; López-Ortiz, F.; Díaz, M.; Toresano, F.; Camacho, F. Differential response to environmental and nutritional factors of high-quality tomato varieties. Food Chem. 2015, 176, 278–287. [Google Scholar] [CrossRef] [PubMed]
  31. Choi, H.G.; Kwon, J.K.; Moon, B.Y.; Kang, N.J.; Park, K.S.; Cho, M.W.; Kim, Y.C. Effect of different light emitting diode (LED) lights on the growth characteristics and the phytochemical production of strawberry fruits during cultivation. Korean J. Hortic. Sci. Technol. 2013, 31, 56–64. [Google Scholar] [CrossRef] [Green Version]
  32. Choi, H.G.; Moon, B.Y.; Kang, N.J. Effects of LED light on the production of strawberry during cultivation in a plastic greenhouse and in a growth chamber. Sci. Hortic. 2015, 189, 22–31. [Google Scholar] [CrossRef]
  33. Ouzounis, T.; Razi Parjikolaei, B.; Fretté, X.; Rosenqvist, E.; Ottosen, C.O. Predawn and high intensity application of supplemental blue light decreases the quantum yield of PSII and enhances the amount of phenolic acids, flavonoids, and pigments in Lactuca sativa. Front. Plant Sci. 2015, 6, 19. [Google Scholar] [CrossRef] [Green Version]
  34. Bian, Z.H.; Cheng, R.F.; Yang, Q.C.; Wang, J.; Lu, C. Continuous light from red, blue, and green light-emitting diodes reduces nitrate content and enhances phytochemical concentrations and antioxidant capacity in lettuce. J. Am. Soc. Hortic. Sci. 2016, 141, 186–195. [Google Scholar] [CrossRef] [Green Version]
  35. Hawkesford, M.; Horst, W.; Kichey, T.; Lambers, H.; Schjoerring, J.; Møller, I.S.; White, P. Functions of macronutrients. In Marschner’s Mineral Nutrition of Higher Plants, 3rd ed.; Marschner, P., Ed.; Academic Press: London, UK, 2012; pp. 135–189. [Google Scholar]
  36. Ma, Y.; Hu, L.; Wu, Y.; Tang, Z.; Xiao, X.; Lyu, J.; Xie, J.; Yu, J. Green light partial replacement of red and blue light improved drought tolerance by regulating water use efficiency in cucumber seedlings. Front. Plant Sci. 2022, 13, 878932. [Google Scholar] [CrossRef]
  37. Wang, Z.; Yamaji, N.; Huang, S.; Zhang, X.; Shi, M.; Fu, S.; Guangzhe, Y.; Jian, F.M.; Xia, J. OsCASP1 is required for Casparian strip formation at endodermal cells of rice roots for selective uptake of mineral elements. Plant Cell 2019, 31, 2636–2648. [Google Scholar] [CrossRef] [PubMed]
Figure 1. The vertical farming rack used for the experiment to assess the green and blue light balance in strawberry plants.
Agronomy 13 00099 g001
Figure 2. Spectral distribution of light of three LED lamps recorded with a spectroradiometer at 20 cm of distance. (A) = 36% blue, 6% green, 58% red light. (B) = 20% blue, 20% green, 60% red light. (C) = 12% blue, 27% green, 61% red light.
Agronomy 13 00099 g002
Figure 3. Effect of the green (500–600 nm) and blue (400–500 nm) light balance on fruit yield of strawberry plants grown in an indoor vertical system with LED lighting. Bars represent the standard error of the mean. Bars represent the standard error of the mean. Columns with different letters indicate significant differences according to Duncan’s multiple comparison test with p < 0.05.
Agronomy 13 00099 g003
Figure 4. Effect of the green (500–600 nm) and blue (400–500 nm) light balance on total fresh mass of strawberry plants grown in an indoor vertical system with LED lighting. Bars represent the standard error of the mean. Columns with different letters indicate significant differences according to Duncan’s multiple comparison test with p < 0.05.
Agronomy 13 00099 g004
Figure 5. Effect of the green (500–600 nm) and blue (400–500 nm) light balance on photosynthesis rate of strawberry plants grown in an indoor vertical system with LED lighting. (A) sampling date 5 July 2002; (B) sampling date 26 July 2002. Bars represent the standard error of the mean. Columns with different letters indicate significant differences according to Duncan’s multiple comparison test with p < 0.05.
Agronomy 13 00099 g005
Figure 6. Effect of the green (500–600 nm) and blue (400–500 nm) light balance on leaf phosphorus (A), potassium (B) and calcium (C) concentration in strawberry plants grown in an indoor vertical system with LED lighting. Bars represent the standard error of the mean. Columns with different letters indicate significant differences according to Duncan’s multiple comparison test with p < 0.05.
Agronomy 13 00099 g006
Figure 7. Effect of the green (500–600 nm) and blue (400–500 nm) light balance on titratable acidity (A) and total sugars (B) concentration in fruits from strawberry plants grown in an indoor vertical system with LED lighting. Bars represent the standard error of the mean. Columns with different letters indicate significant differences according to Duncan’s multiple comparison test with p < 0.05.
Agronomy 13 00099 g007
Figure 8. Effect of the green (500–600 nm) and blue (400–500 nm) light balance on calcium from fruit extracts of strawberry grown in an indoor vertical system with LED lighting. Bars represent the standard error of the mean. Columns with different letters indicate significant differences according to Duncan’s multiple comparison test with p < 0.05.
Agronomy 13 00099 g008
Figure 9. Effect of the green (500–600 nm) and blue (400–500 nm) light balance on phenols (A) and antioxidant capacity measured by DPPH (B) and ABTS (C) in fruits of strawberry plants grown in an indoor vertical system with LED lighting. Bars represent the standard error of the mean. Columns with different letters indicate significant differences according to Duncan’s multiple comparison test with p < 0.05.
Agronomy 13 00099 g009
Table 1. Spectral characterization of LED lamps and the blue, green and red light balance.
Blue Light
400–500 nm
Green Light
500–600 nm
Red Light
600–700 nm
Photosynthetic Photon Flux DensityBlue Light
400–500 nm
Green Light
500–600 nm
Red Light
600–700 nm
µmol m−2 s−1%
155.627.7251.6434.936658
84.584.1252.0420.6202060
52.8112.9261.9427.5122761
Table 2. Effect of the green (500–600 nm) and blue (400–500 nm) light balance on the number of leaves and crowns and on the fresh mass of plant parts of strawberry grown in an indoor vertical system with LED lighting.
Green/Blue LightFruit NumberLeaf Number *Number of CrownsFresh Mass (g)
RootLeavesCrowns
6%/36%5.75 ± 0.4420.7 ± 2.94b1.63 ± 0.33b12.4 ± 1.97b15.9 ± 1.409.28 ± 1.23
20%/20%7.67 ± 1.4525.8 ± 3.22ab1.80 ± 0.27b34.3 ± 8.49a22.1 ± 2.6611.3 ± 1.22
27%/12%5.40 ± 0.3033.9 ± 5.84a3.47 ± 0.21a24.7 ± 3.10ab21.5 ± 3.2212.6 ± 0.34
ANOVAp = 0.207p = 0.018p < 0.001p = 0.018p = 0.119p = 0.278
* Means followed by the same letter are not significantly different according to Duncan’s multiple comparison test (p < 0.05).
Table 3. Effect of the green (500–600 nm) and blue (400–500 nm) light balance on the dry mass of strawberry plants grown in an indoor vertical system with LED lighting.
Green/Blue LightDry Mass (g)
Total *RootLeavesCrowns
6%/36%12.9 ± 1.13b4.00 ± 0.46b5.88 ± 0.343.08 ± 0.60
20%/20%19.5 ± 6.47a10.2 ± 1.84a6.85 ± 0.404.11 ± 0.52
27%/12%15.8 ± 2.03ab8.39 ± 0.47a6.19 ± 0.764.12 ± 0.16
ANOVAp = 0.021p = 0.013p = 0.527p = 0.312
* Means followed by the same letter are not significantly different according to Duncan’s multiple comparison test (p < 0.05).
Table 4. Effect of the green (500–600 nm) and blue (400–500 nm) light balance on gas exchange parameters of young mature leaves of strawberry plants grown in an indoor vertical system with LED lighting. Sampling date 5 July 2021.
Green/Blue LightTranspiration Rate
mmol H2O m−2 s−1 *
CO2 Internal Concentration
ppm
Stomatic Conductance
mmol H2O m−2 s−1
6%/36%3.26 ± 0.30a281.2 ± 8.92a0.138 ± 0.02a
20%/20%3.23 ± 0.29a250.8 ± 5.49b0.147 ± 0.02a
27%/12%2.21 ± 0.19b262.1 ± 8.03b0.108 ± 0.01b
ANOVAp < 0.001p = 0.002p = 0.048
* Means followed by the same letter are not significantly different according to Duncan’s multiple comparison test (p < 0.05).
Table 5. Effect of the green (500–600 nm) and blue (400–500 nm) light balance on gas exchange parameters of young mature leaves of strawberry plants grown in an indoor vertical system with LED lighting. Sampling date 26 July 2021.
Green/Blue LightTranspiration Rate
mmol H2O m−2 s−1 *
CO2 Internal Concentration
ppm
Stomatic Conductance
mmol H2O m−2 s−1
6%/36%1.76 ± 0.23ab267.9 ± 10.18a0.0783 ± 0.012b
20%/20%2.00 ± 0.18a239.5 ± 6.93b0.1008 ± 0.010a
27%/12%1.71 ± 0.21b262.9 ± 7.97a0.0921 ± 0.014ab
ANOVAp = 0.049p < 0.001p = 0.036
* Means followed by the same letter are not significantly different according to Duncan’s multiple comparison test (p < 0.05).
Table 6. Effect of the green (500–600 nm) and blue (400–500 nm) light balance on N and Mg nutrient status in leaves and on quality parameters in fruits of strawberry plants grown in an indoor vertical system with LED lighting.
Green/Blue LightN
g Kg−1
Mg
g Kg−1
Firmness
N
Total Soluble Solids *
°Brix
Reducing Sugars
mg g−1
6%/36%21.6 ± 1.713.27 ± 0.190.54 ± 0.049.08 ± 0.28b3.66 ± 0.16
20%/20%23.3 ± 1.563.39 ± 0.170.49 ± 0.148.25 ± 0.29b3.45 ± 0.23
27%/12%23.9 ± 2.243.15 ± 0.130.50 ± 0.0212.79 ± 1.23a3.41 ± 0.17
ANOVAp = 0.186p = 0.129p = 0.282p < 0.001p = 0.627
* Means followed by the same letter are not significantly different according to Duncan’s multiple comparison test (p < 0.05).
Table 7. Effect of the green (500–600 nm) and blue (400–500 nm) light balance on selected ions concentration and on flavonoids, anthocyanins and antioxidant activity measured by FRAPS from extracts of strawberry fruits of plants grown in an indoor vertical system with LED lighting.
Green/Blue LightNO3
mg kg−1
K
mg kg−1
Flavonoids
mg EQ/100 gfw
Anthocyanins
mg g−1
FRAPS
mg EAA/100 gfw
6%/36%157 ± 14.055290 ± 281.2811.63 ± 0.8825.11 ± 3.0932.48 ± 5.60
20%/20%158 ± 10.845497 ± 276.0112.96 ± 0.2323.75 ± 2.6521.67 ± 3.10
27%/12%173 ± 10.906077 ± 257.7412.62 ± 1.2123.50 ± 1.2922.97 ± 4.14
ANOVAp = 0.617p = 0.170p = 0.448p = 0.852p = 0.244
Disclaimer/Publisher’s Note: The statements, opinions and data contained in all publications are solely those of the individual author(s) and contributor(s) and not of MDPI and/or the editor(s). MDPI and/or the editor(s) disclaim responsibility for any injury to people or property resulting from any ideas, methods, instructions or products referred to in the content.

