Article

Height Estimation of Soil Erosion in Olive Groves Using a Time-of-Flight Sensor

by
Francisco Lima
1,
Hugo Moreno
2,
Rafael Blanco-Sepúlveda
1 and
Dionisio Andújar
2,*
1
Geographic Analysis Research Group, Department of Geography, University of Malaga, Campus of Teatinos, s/n, 29071 Malaga, Spain
2
Centre for Automation and Robotics, Consejo Superior Investigaciones Científicas (CSIC), Ctra. de Campo Real km 0.200, La Poveda, 28500 Madrid, Spain
*
Author to whom correspondence should be addressed.
Agronomy 2023, 13(1), 70; https://doi.org/10.3390/agronomy13010070
Submission received: 28 November 2022 / Revised: 20 December 2022 / Accepted: 21 December 2022 / Published: 25 December 2022

Abstract

:
The olive groves’ relevance has historically been ingrained in Mediterranean cultures. Spain stands out as a leading producer worldwide, where olive trees are extensively grown in the Andalusian region. However, despite the importance of this strategic agricultural sector, cultivation through the years has given rise to various crop management practices that have led to disruptive erosion processes. The objective is to measure land erosion in over 100-year-old olive groves considering the 3D reconstructed recent relief of olive tree mounds. A time-of-flight depth sensor, namely, Kinect v2, was employed to 3D model the target areas, i.e., trunk and exposed roots, to determine the height as a surrogate of the difference between the historical and recent relief. In three plots in southern Spain, the height of relic tree mounds was measured in olive trees at the upper and bottom parts to determine soil profile truncation. The results were compared and validated with manual measurements (ground truth values). Olive trees were grouped into high, moderate, and low slope gradient classes. The results showed, in all cases, high consistency in the correlation equations (Pearson’s coefficients over 0.95) between the estimated values in the models and the actual values measured in the olive trees. Consequently, these excellent results indicate the potential of this low-budget system for the study of historical erosion. Notably, the Kinect v2 can generate 3D reconstructions of tree mounds at microtopographic scales in outdoor situations that would be challenging for other depth cameras under variable lighting conditions, as found outdoors.

1. Introduction

Olive groves (Olea europaea L.) cover around 10.2 million hectares and spread over more than 60 countries worldwide. The Mediterranean basin concentrates 93% of global production, whereas Spain represents the leading producer accounting for 24% of the global surface [1]. Over the past few decades, this expansion, linked in some cases to intensification and mechanization processes [2], has increased the soil erosion rates [3]. The erosion is particularly severe in areas with less agricultural aptitude [4] due to the prolongation, over time, of inappropriate land management practices, such as irrational tillage on steep slopes [5]. Furthermore, removing the vegetation between olive trees that help anchor the soil in place has also contributed significantly to erosion [6]. Erosion has become more severe and extensive over the centuries [7,8], thus leading to a general concern about soil degradation [9]. The adverse effects of erosion have been extensively studied, including the reduction in organic matter content [10], loss of biodiversity [11], loss of crop yield surface [12], degradation of water quality [13], increased muddy flood [14] and global warming due to soil organic carbon emissions in the form of Carbon dioxide (CO2) and methane (CH4). Consequently, these disruptive impacts result in additional production expenses incurred by the farmer, often unknowingly [10,15], which affect the viability of the farms. Olive groves suffer among the most severe erosion rates of all current land uses in the Mediterranean area [16], being the primary concern related to agriculture [17]. To date, a wide range of methods for calculating soil loss in terms of volume has been employed. These range from (i) traditional generic erosion models, such as the Universal Soil Loss Equation (USLE) [18] with their respective revisions [19,20] to (ii) in-field direct measurements of the soil loss rate. However, these approaches can be improved with the use of technology. Technological advances have expanded the horizon of possibilities, emerging new approaches for agricultural applications in optimizing workflows and minimizing manual labor [21]. Sensing devices allow soil and plant characterization. Creating digital models provides a better understanding of the evolution of the surroundings and the development of the plant over the years. The digital models can be used to extract several parameters related to soil erosion and plant growth. This information can lead to better insight into devising farm management protocols that can improve tillage or crop management decisions. The analysis of permanent changes in how topography influences soil development in agricultural fields has also been considered a suitable approach to studying erosion and deposition [22].
According to ground-based measurements, different approaches can be found, from simple approaches, such as survey marking stakes and profile meters [23] to more sophisticated techniques, such as terrestrial photogrammetry [24]. Ultrasonic sensors can also be used for electronic terrain characterization by placing different sensors pointing to the ground. The soil surface roughness can be scanned to measure surface elevation. This principle has been used for tillage characterization and the differential behavior of soil movement using different cultivation systems, such as chisel plow, moldboard plow, or field cultivator [25]. Although most of the research on soil characterization using ultrasonic sensors is based on the characterization of structural properties [26], machinery control for tillage aggressiveness [27], or characterization of soil aggregate stability [28]. However, the employment of ultrasonic sensors for the long-term effects of tillage and soil erosion assessment has not yet been studied.
In contrast to ultrasonic sensors, LiDAR sensors provide higher accuracy, wider field of view, and resolution, i.e., lower light beam divergence and directionality [29,30,31]. LiDAR sensors enable the comprehensive reconstruction of an agricultural area [32], even assessing surface roughness [33] as one of the complex applications [34]. LiDAR sensors have been employed in studies, such as quantifying erosion and deposition in gully systems [35] or water erosion [36]. However, despite the LIDAR technology to detect terrain elevation changes, this technology has not been applied to estimate soil loss considering mounds.
On the other hand, in recent years, the rapid evolution of 3D modeling has been spurred by the development of depth sensors [37,38]. The use of depth cameras can open a new window to reconstruct 3D models for agricultural and erosion assessment applications. The use of these devices allows a budget solution at a high-resolution level. Concerning the market, the most used ones are the inexpensive Kinect sensors v1 and v2 developed by Microsoft. These RGB-D sensors (Red Green Blue-Depth) and particularly the inexpensive Microsoft Kinect v2 sensor, have become popular as a viable technology to make 3D reconstructions. Kinect v2 stands out for its versatility, robustness, and high performance. Initially addressed to the gaming industry, it was rapidly adopted by scientists, robotics enthusiasts, and hobbyists worldwide [39]. Even though the Kinect v2 has lower reliability [40] than LiDAR systems, it is a viable alternative to costly laser-based sensors due to the additional information it provides [41]. Kinect v1 and v2 have been widely used for agricultural purposes [42,43,44]. Furthermore, the flexible open-source SDK (Software Development Kit) and libraries, such as OpenNI, OpenCV, and Point Cloud Library in C++, have permitted the fast spread of software tools and packages for 3D cameras, such as the Kinect and Xtion [45]. The use of time-of-flight cameras such as Kinect v2 is also used for crop reconstruction. Andújar et al. [46] estimated the plant biomass based on poplar seedling geometry by reconstructing several trees from different sensor positions. Moreover, in contrast to LiDAR and ultrasonic sensors, Kinect v2 includes a high-definition (HD) color camera apart from the IR sensor that captures the depth values. Thus, the RGB channel provides valuable information to extract more characteristics from the built 3D models.
In summary, despite the potential of the Kinect v2 sensor, no research has investigated the use of depth cameras to measure soil erosion. Accurate and rapid quantification of large-scale soil erosion has become an urgent task to assess environmental impacts and devise practical management guidelines and erosion control policies [19] to improve farm sustainability. This study aims to show the ability of a low-cost flight time sensor to estimate soil erosion on different slopes in olive groves. The system allowed the creation of 3D models to be further analyzed under high, moderate, and low slope gradient classes. Moreover, the 3D digitized models will be helpful for research. In contrast to manual measurements, digital models contain more information and can be tracked back in future studies. Overall, this work assesses the effect of soil erosion on measurements recorded by a Kinect v2 sensor related to actual on-field values and determines the limits and errors of this technology in on-field applications.

2. Materials and Methods

2.1. Site Location

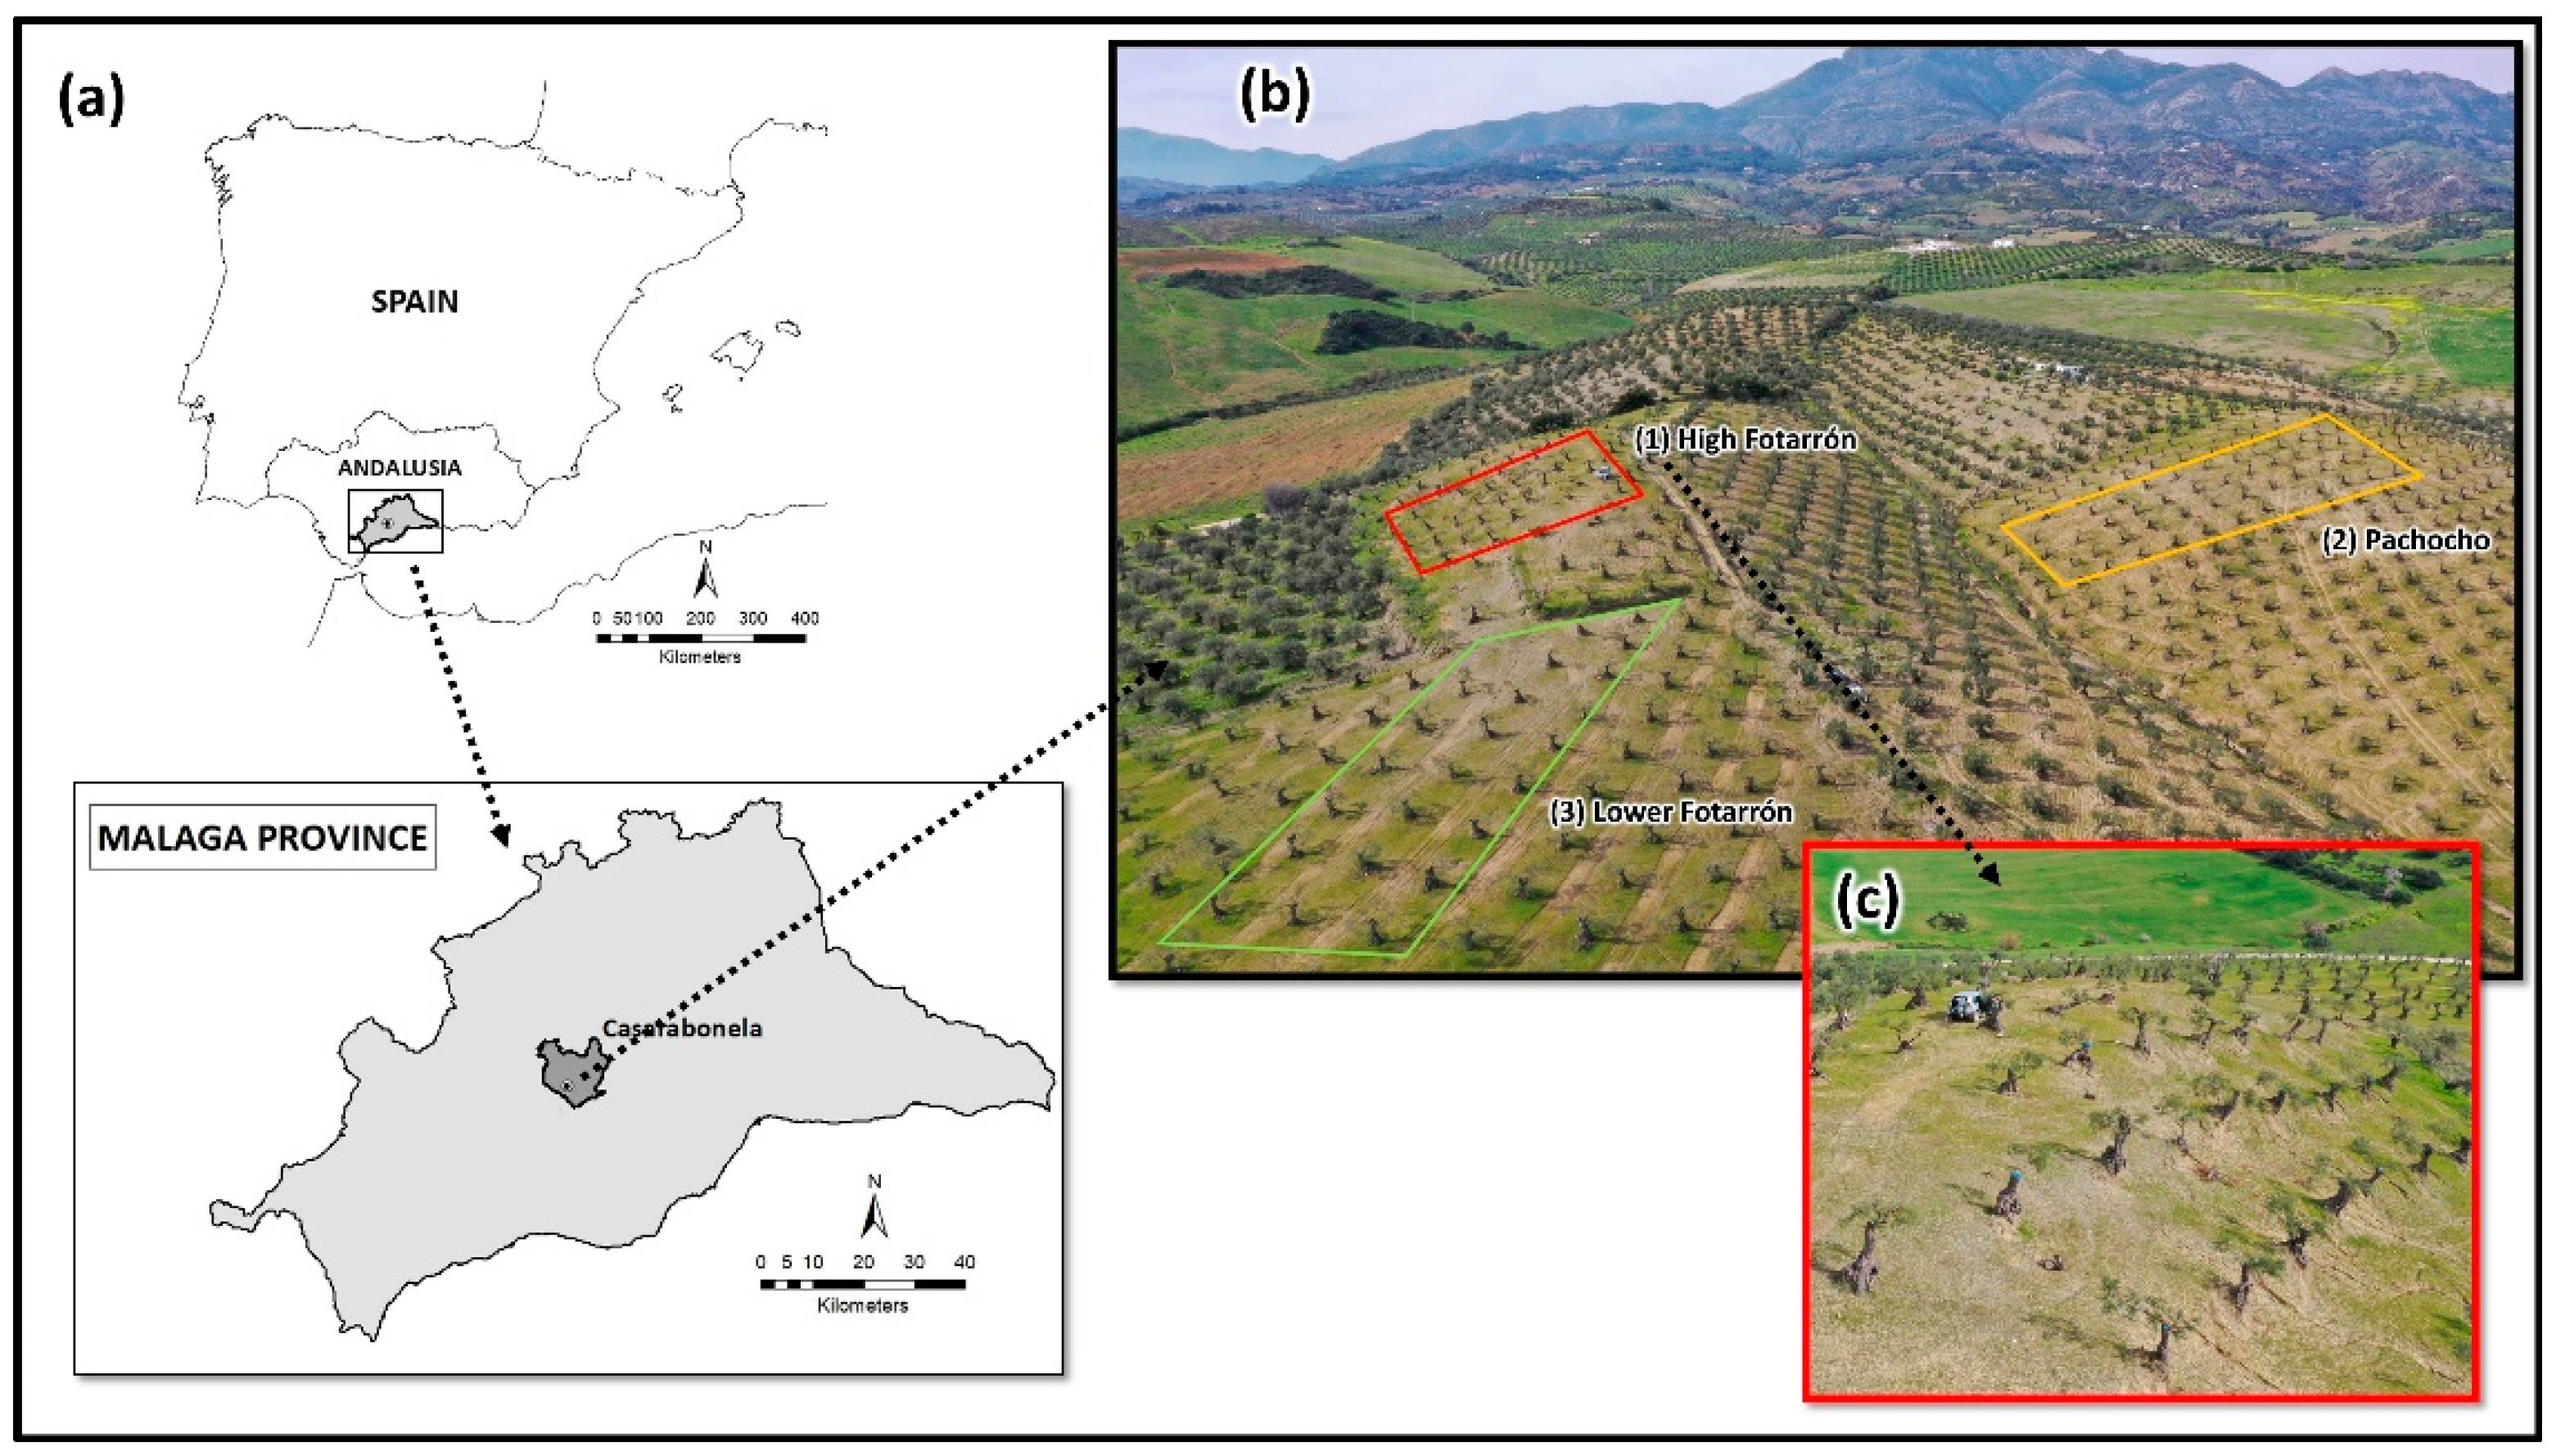
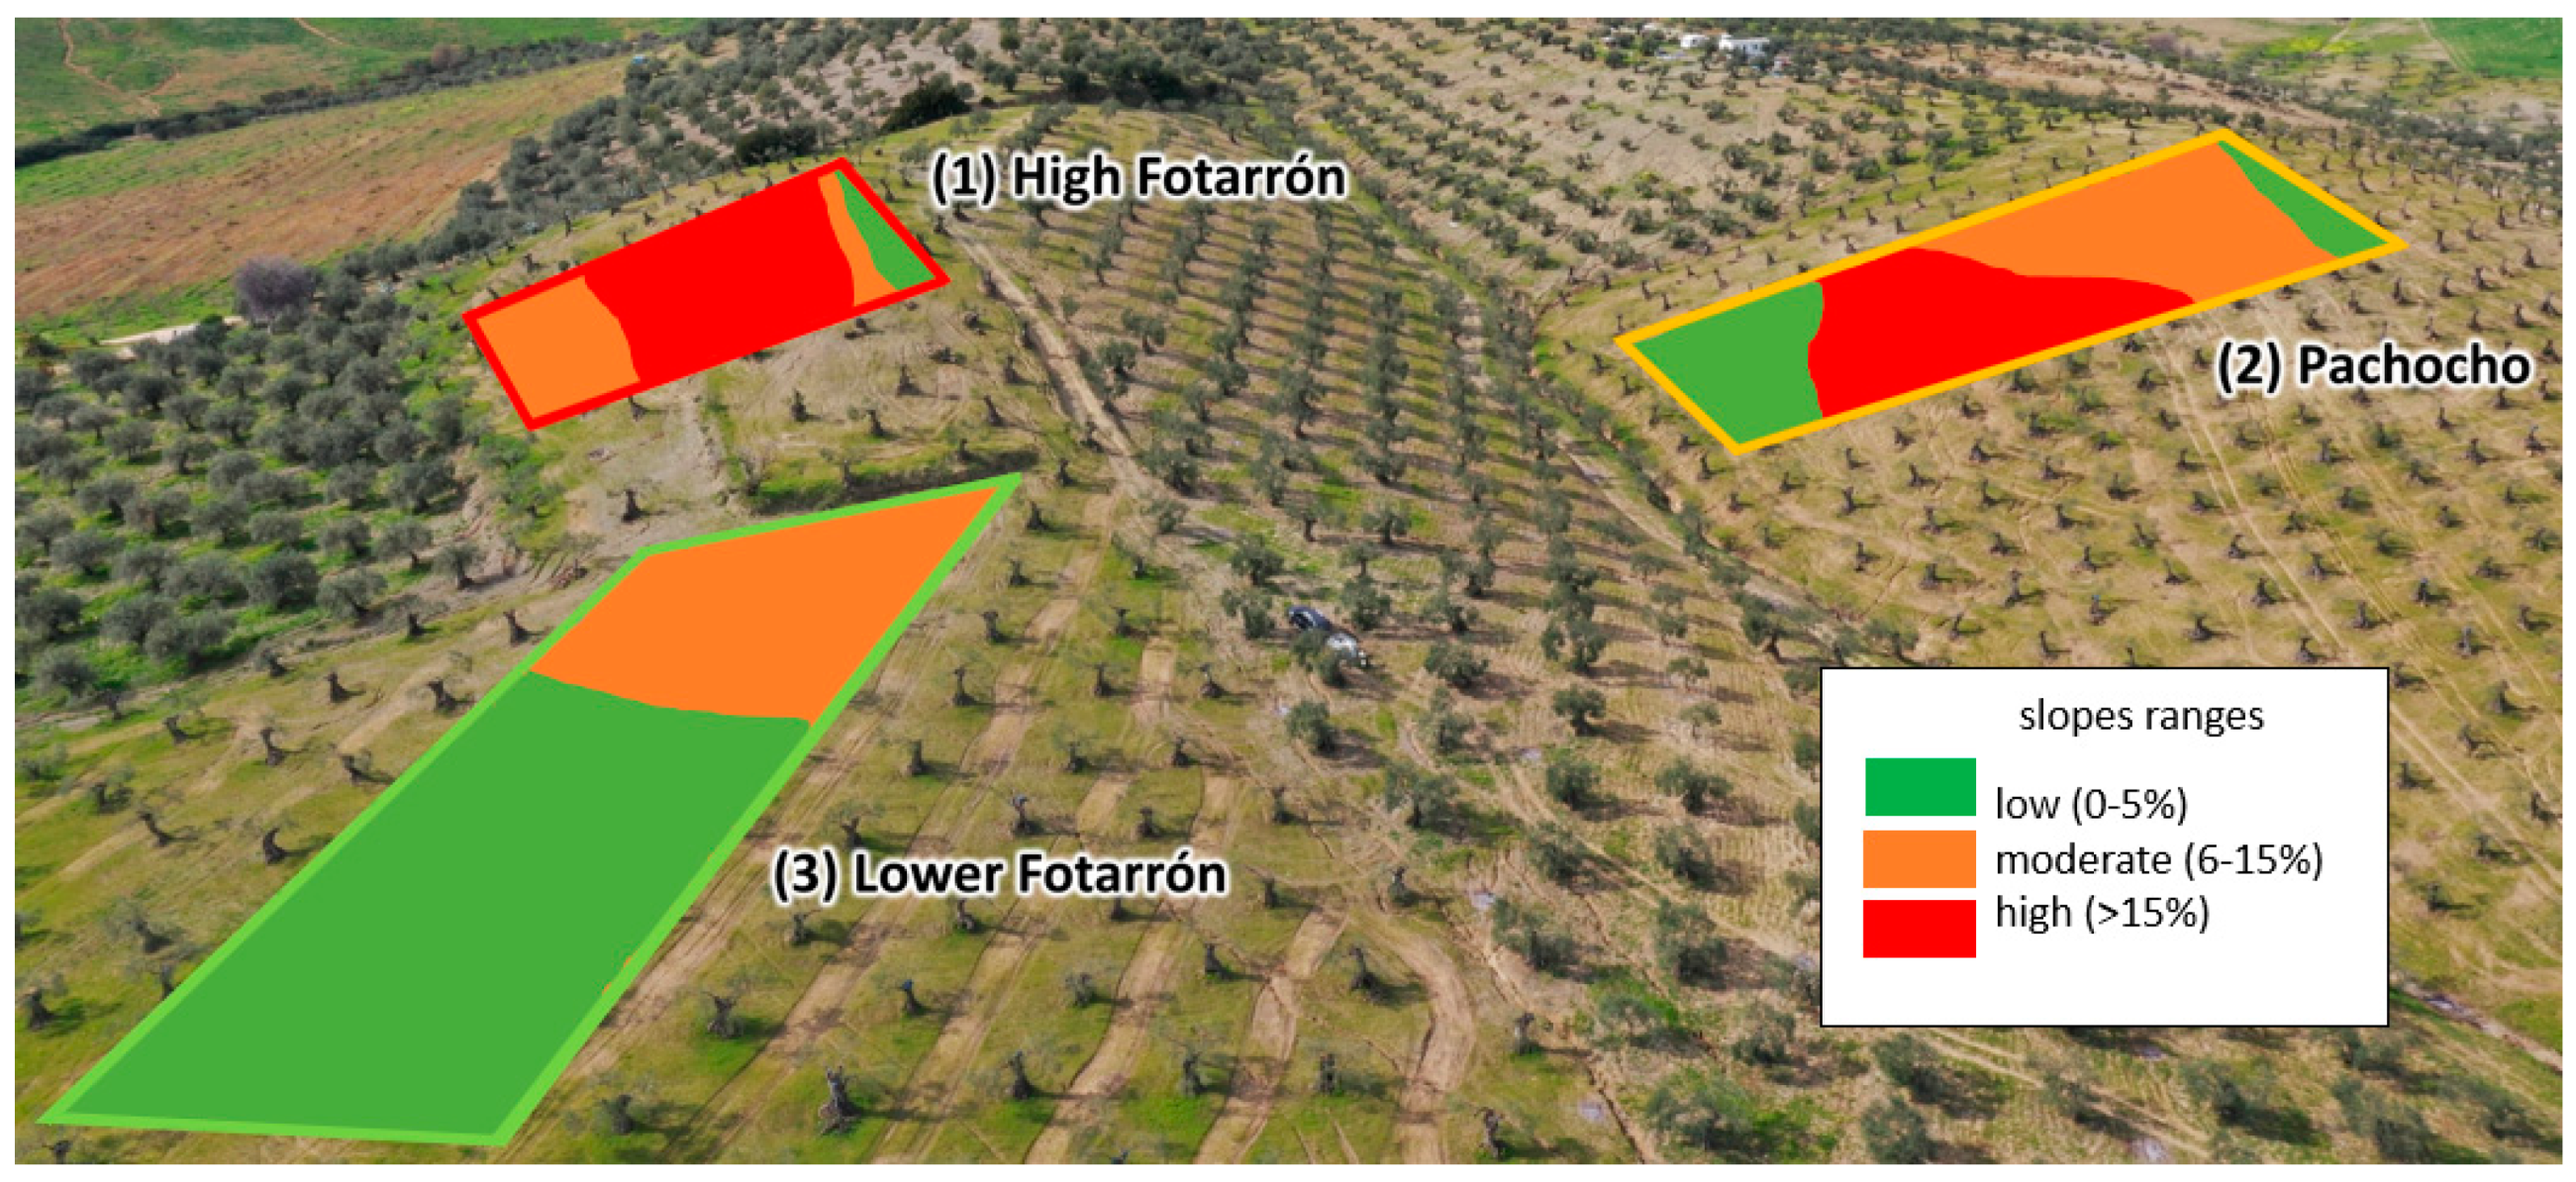
The experiments were carried out in commercial olive groves located in the municipality of Casarabonela, Malaga province (southern Spain). Central coordinates of the studied area; 4068138W, 337958N (UTM, ETRS89, zone 30 N) (Figure A1). Additionally, Figure A2 shows the slope ranges within each studied plot.
The experimental site was composed of three plots of traditional mountain olive groves of the “Manzanilla Aloreña” variety. Olive trees were about 110 years old (age determined by interviewed local farmers). The experimental area covers a total area of 2.6 hectares within the tree plots, classified according to their topography as high (15.90%), medium (12.90%), and low (8.37%) slopes.
The crop is non-irrigated, located in a traditional square planting pattern, and the trees are planted at a distance of 8–10 m from each other. Before the pre-industrial era, tillage was practiced in the study area as a method of weeding. Animal-drawn tillage implements were employed during the organic economy and mechanical at the end of the 1950s. From the 1960s onwards, cultivation became more intensive with: (i) Increased mechanization; (ii) An increase in the number of tillage passes; (iii) The removal of vegetation cover; iv) Intensification of the cropping framework by increasing the number of trees per hectare [47,48]. To date, farmers use a cultivation system based on mechanized tillage two or three times a year to remove the spontaneous plant cover, break up the topsoil and improve water infiltration. This cultivation system is intended to remove the spontaneous plant cover, as well as to break up the topsoil and improve water infiltration. The current plowing is more aggressive and deeper (>15 cm). Usually starts in January (once the fruit has been harvested) and is repeated occasionally until June. This operation is carried out with a tracked tractor, and a 2-row, 9-arm cultichisel-type tool (Figure 1a) equipped with duckfoot grids (Figure 1b), commonly used in olive orchards. In this manner, the soil is bare for most of the year, with no vegetation cover to protect it. Moreover, inadequate tillage direction (Figure 1c) also contributes to soil erosion [49].

2.2. Sampling System

A simple methodology to assess historical soil erosion proposed by Kraushaar et al. [50] in olive groves has been adapted. Moreover, the proposed method calculates average annual erosion rates for 110 years using microtopography in orchards, i.e., olive mounds. The employed technique uses depth-sensing technology to measure recent surfaces. These are compared to reconstructed historical ones using the germination point of trees (Figure 2). Kinect v2 device, as an inexpensive handheld scanning solution, was employed as a data collection system. Kinect v2 comprises an infrared RGB camera that records color data at a resolution of 1920 × 1080 pixels. However, real-time depth is captured via an IR camera with a resolution of 512 by 424 pixels. IR camera captures depth between 0.5 m and 4.5 m, decreasing the range while operating outside [51]. The acquisition process was based on Kinect SDK (Software Development Kit v2), as described by Rueda-Ayala et al. [41].
Every olive tree was recorded using Kinect Studio in video mode to obtain depth information. The sensor was held within 90° at the tree during data acquisition. This front-view approach followed the recommendation reported by Andújar et al. [46] since the sensor location is a key factor for 3D reconstruction. Then, the Kinect v2 sensor was handheld to obtain the full lateral projection of the olive trees with visible mounds and exposed roots. According to a concentric track, the top and the base of the trunk were scanned. In order to acquire ground truth data to be compared to 3D data obtained by the Kinect v2, manual measurements were undertaken in every tree. The mound shapes varied along the profile of the slope.
First, the mound heights of 83 trees (Figure 2) distributed over the entire section of the slope were measured. From the upper to the lower drainage line (which could be considered equivalent to a USLE-type plot). An RTK-GNSS device (Trimble GeoSpatial, Munich, Germany) was used for this purpose. These measurements were taken at the top of the mound (tree germination point), and represent the historical relief when the grove was planted. The slope angle of the historical relief was calculated considering the recent relief. It was verified in the plots that the roots of the olive tree in the soil have no bark. However, once exposed to the air, roots develop a bark about 1 cm thick to prevent transpiration, making pinpointing the exact measurement point difficult. Therefore, the measurement point was taken 1 cm below the determined germination point to account for the subsequent thickening of the bark. The angles of slopes were measured using a digital clinometer. Soil loss (truncation) measurements were then made at 166 points. Two were taken per mound at 50 cm from the tree trunk, one uphill and one downhill (Figure 2).
Since the slope is a key factor in triggering soil erosion, the 83 olive trees analyzed were grouped into three categories according to slope gradient. The slopes range from low (0–5%), moderate (6–15%), to high (>15%).

2.3. Extracting Height Parameters from 3D Olive Tree Models

The raw data, recorded on Kinect Studio in video mode, was then reconstructed using a modified version of the iterative closest point (ICP) algorithm [52]. The output data was processed in Meshlab® (University of Pisa, Italy) to calculate the Kinect v2 heights. The reconstruction process was fully automated by overlapping depth images using a 3D real-time reconstruction algorithm [53] in combination with a variant of the iterative closest point (ICP) algorithm [54]. The software incorporates filters to remove duplicated points and unreferenced vertices. Moreover, cleaning, smoothing, visualization, and processing the acquired information can be performed. Three steps were undertaken for processing the point clouds. First, an internal filter removed noise and outliers from the point cloud, which removed individual points at 0.5 cm outside the grid. Then, the trees were isolated after removing parts that did not belong to the area of interest. Finally, height parameters were extracted to be compared with ground truth data. Georeferencing the slope section aided in positioning the point cloud. The original base of the trunk of each tree was calculated using a self-developed algorithm. The algorithm applies a cylinder extending from the top of the trunk to the end. The sudden increment in the trunk diameter indicated the angle change point. Moreover, in order to avoid mismatches, since Kinect v2 provides an RGB channel, the identification of the germination points for the upper and bottom parts was easier. Providing Kinect v2 data as reliable height values, the soil loss rate for 110 years varies significantly for the bottom parts in the high slope areas, with a higher standard deviation. Reasonably, the values for high slopes are greater, and for all cases of bottom parts, the soil loss is highest. The annual soil loss rate for the upper parts is 0.6 cm/year (although lower than in the moderate slope) and 1.05 cm/year. Soil loss rates in low slopes are 0.5 cm/year and 0.57 cm/year for the upper and bottom parts, respectively; similar for the moderate slope (0.7 cm/year and 0.9 cm/year).

2.4. Statistical Analysis

Statistics were calculated from the final 3D models compared with the actual values on the ground measured manually on the trees. Soil loss by height difference, actual height on the trunk top base, and actual height on the trunk bottom base were calculated from the digital models and later correlated with the actual parameters. Linear regressions and Pearson’s correlation coefficients were considered the first validation of the method. They provided an evaluation of the results between the actual values, i.e., ground truth, and those extracted from the model. The trees were selected randomly within the plots to obtain a statistically representative sample, that is, within a 95% confidence interval. ANOVA was applied to examine the influence of the heights derived from the 3D models on ground truth values, i.e., actual heights measured manually. Three more indicators were calculated, providing model fitness: root mean square error (RMSE), mean absolute deviation (MAD), and mean absolute percentage error (MAPE). These statistics provide an overall measure of how well the model fits the data. The statistical analysis was conducted using SPSS v28 (IBM SPSS Statistics).

3. Results

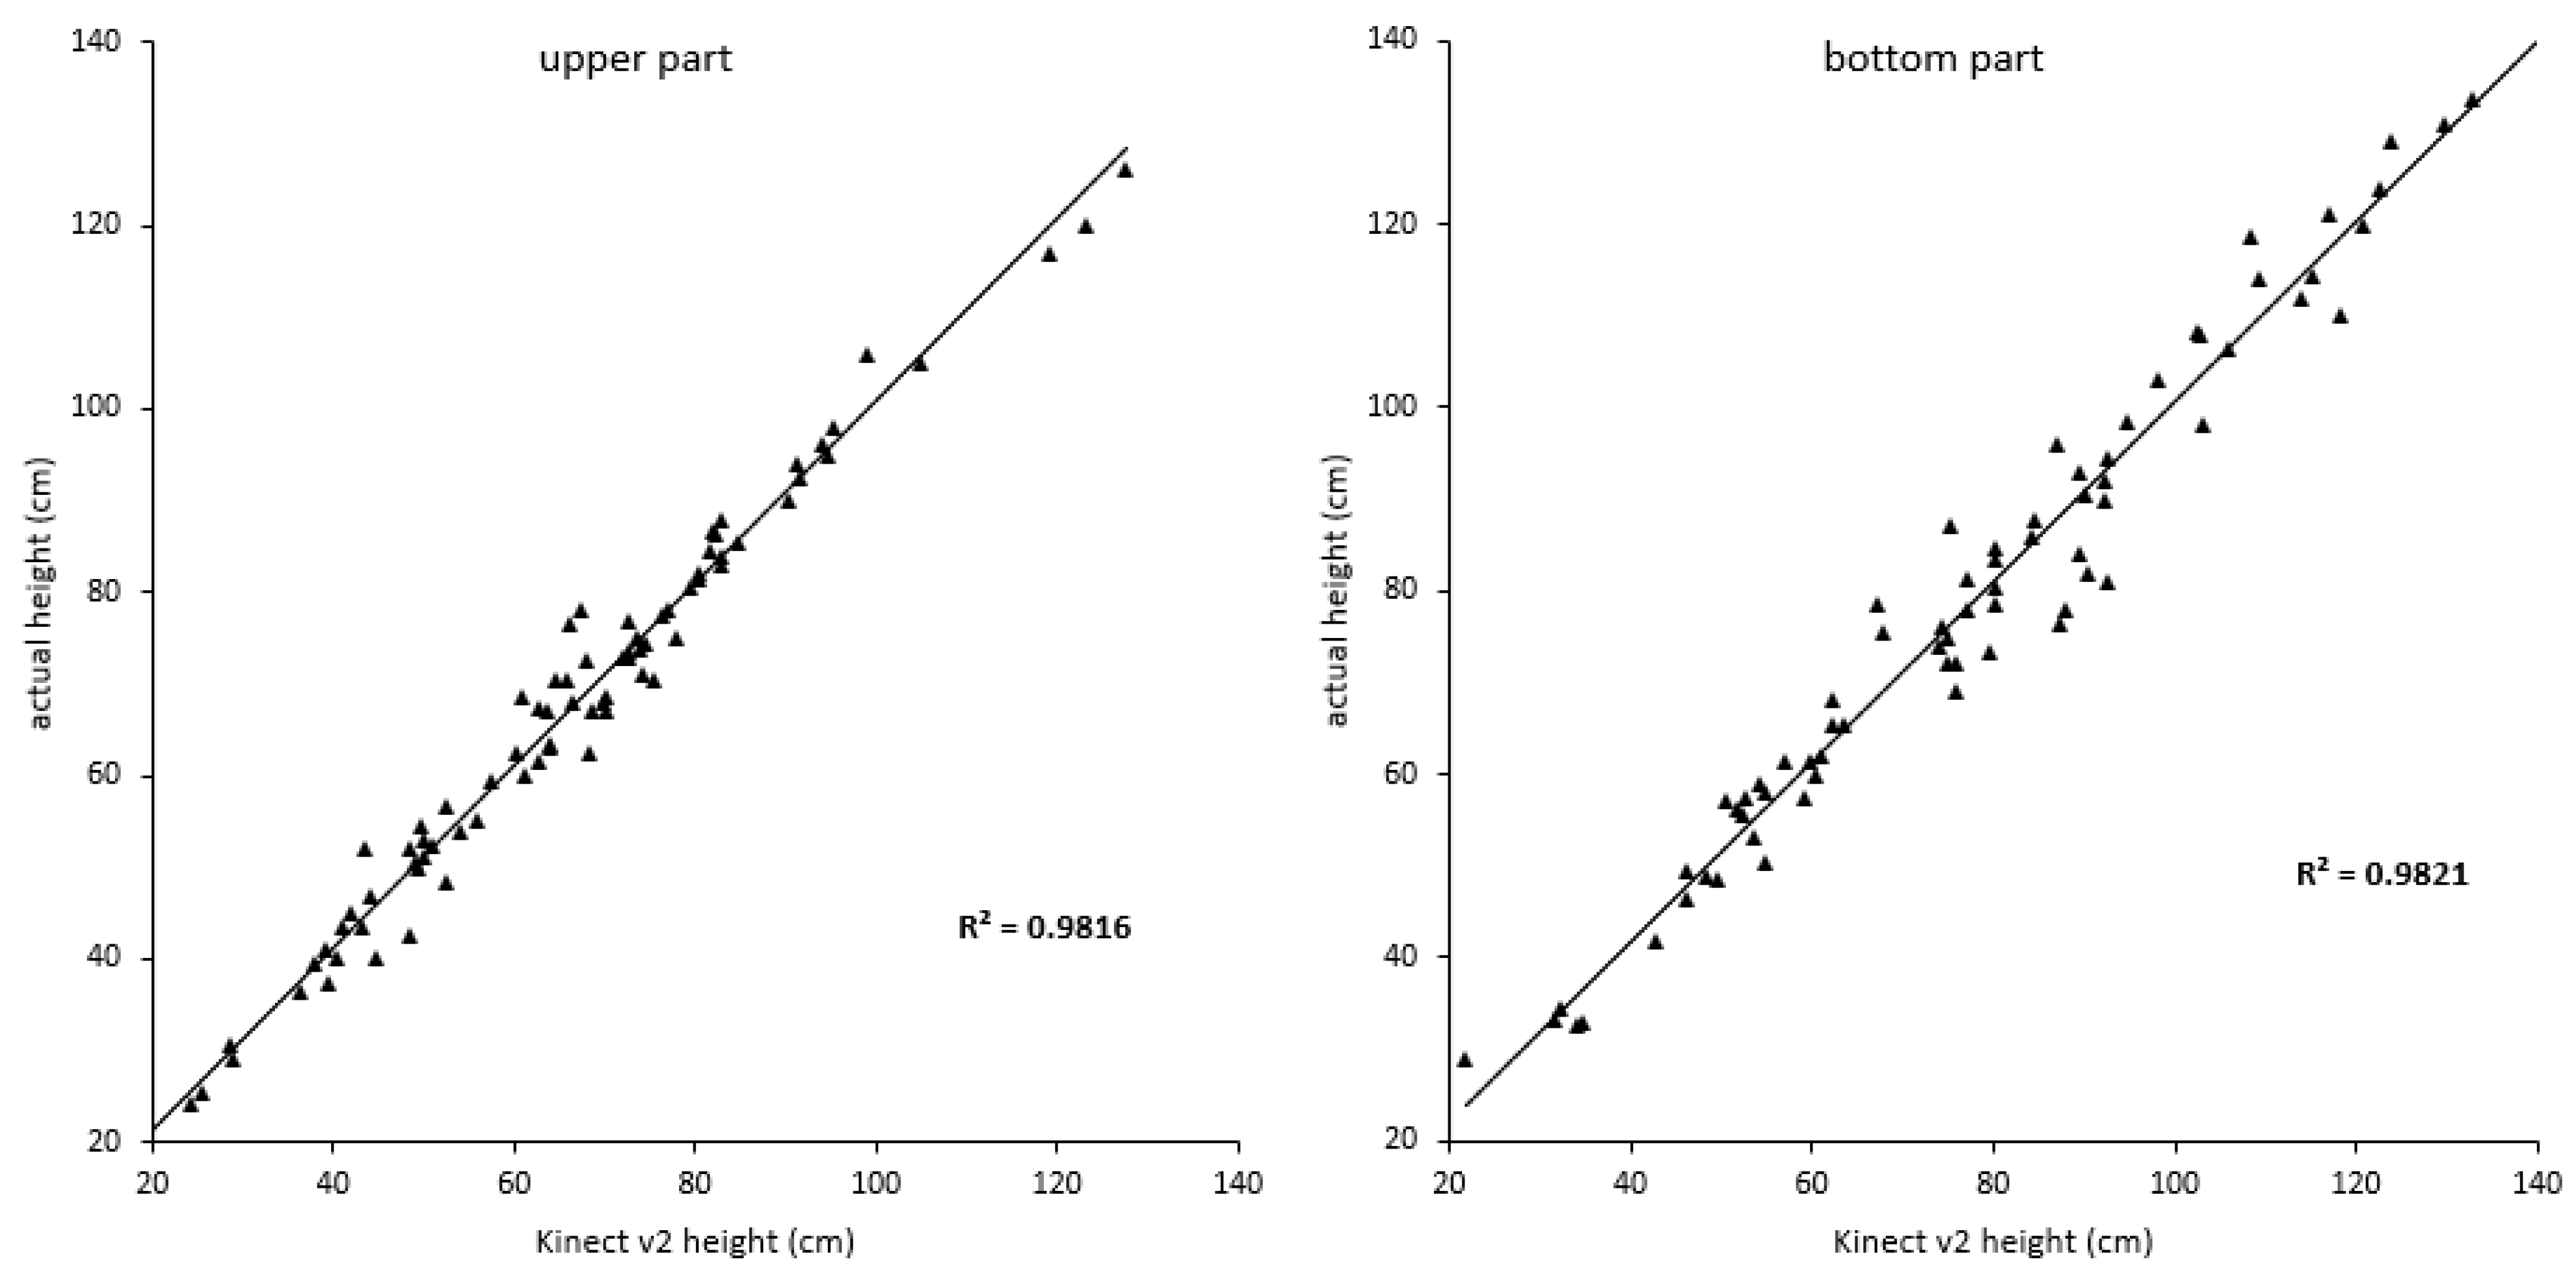
The 3D scenes obtained of the stump and root structure were evident. The parameters estimated from the 3D models showed a strong correlation with the real data, i.e., with the ground truth. The linear correlation equations between the parameters estimated from the 3D digital model and the actual values measured on the olive trees proved consistent. The linear regression model fitted well all the Kinect v2 height data compared to the real measurements, indicating that the increasing values of the time-of-flight measurements corresponded to the increasing real values with an R2 = 0.98 (p < 0.001) for both the top and the bottom of the tree (Figure 3).
The high accuracy of the prediction for the upper part was confirmed by an RMSE value of 3.4 cm and a MAD value of 2.48 cm. MAPE value showed a deviation of only 4.02% of the value estimated by the model concerning the actual height value. On the other hand, the bottom part indicated similar statistics, an RMSE value of 4.98 cm, a MAD value of 3.9, and a MAPE value of 4.91%. However, since RMSE puts a heavier penalty on large errors, hence, RMSE being more sensitive to outliers than MAPE, RMSE values for both cases, upper and bottom parts, indicate a good fit of the data. Regarding erosion processes, the slopes ranged from low (0–5%), moderate (6–15%) to high (>15%), showing differential results (Table 1). When analyzing data by slope gradient, the results showed that height values were always consistent and similar between the studied systems concerning the bottom part of the tree. However, the upper part did not behave as expected since a higher slope gradient does not imply a higher soil loss.
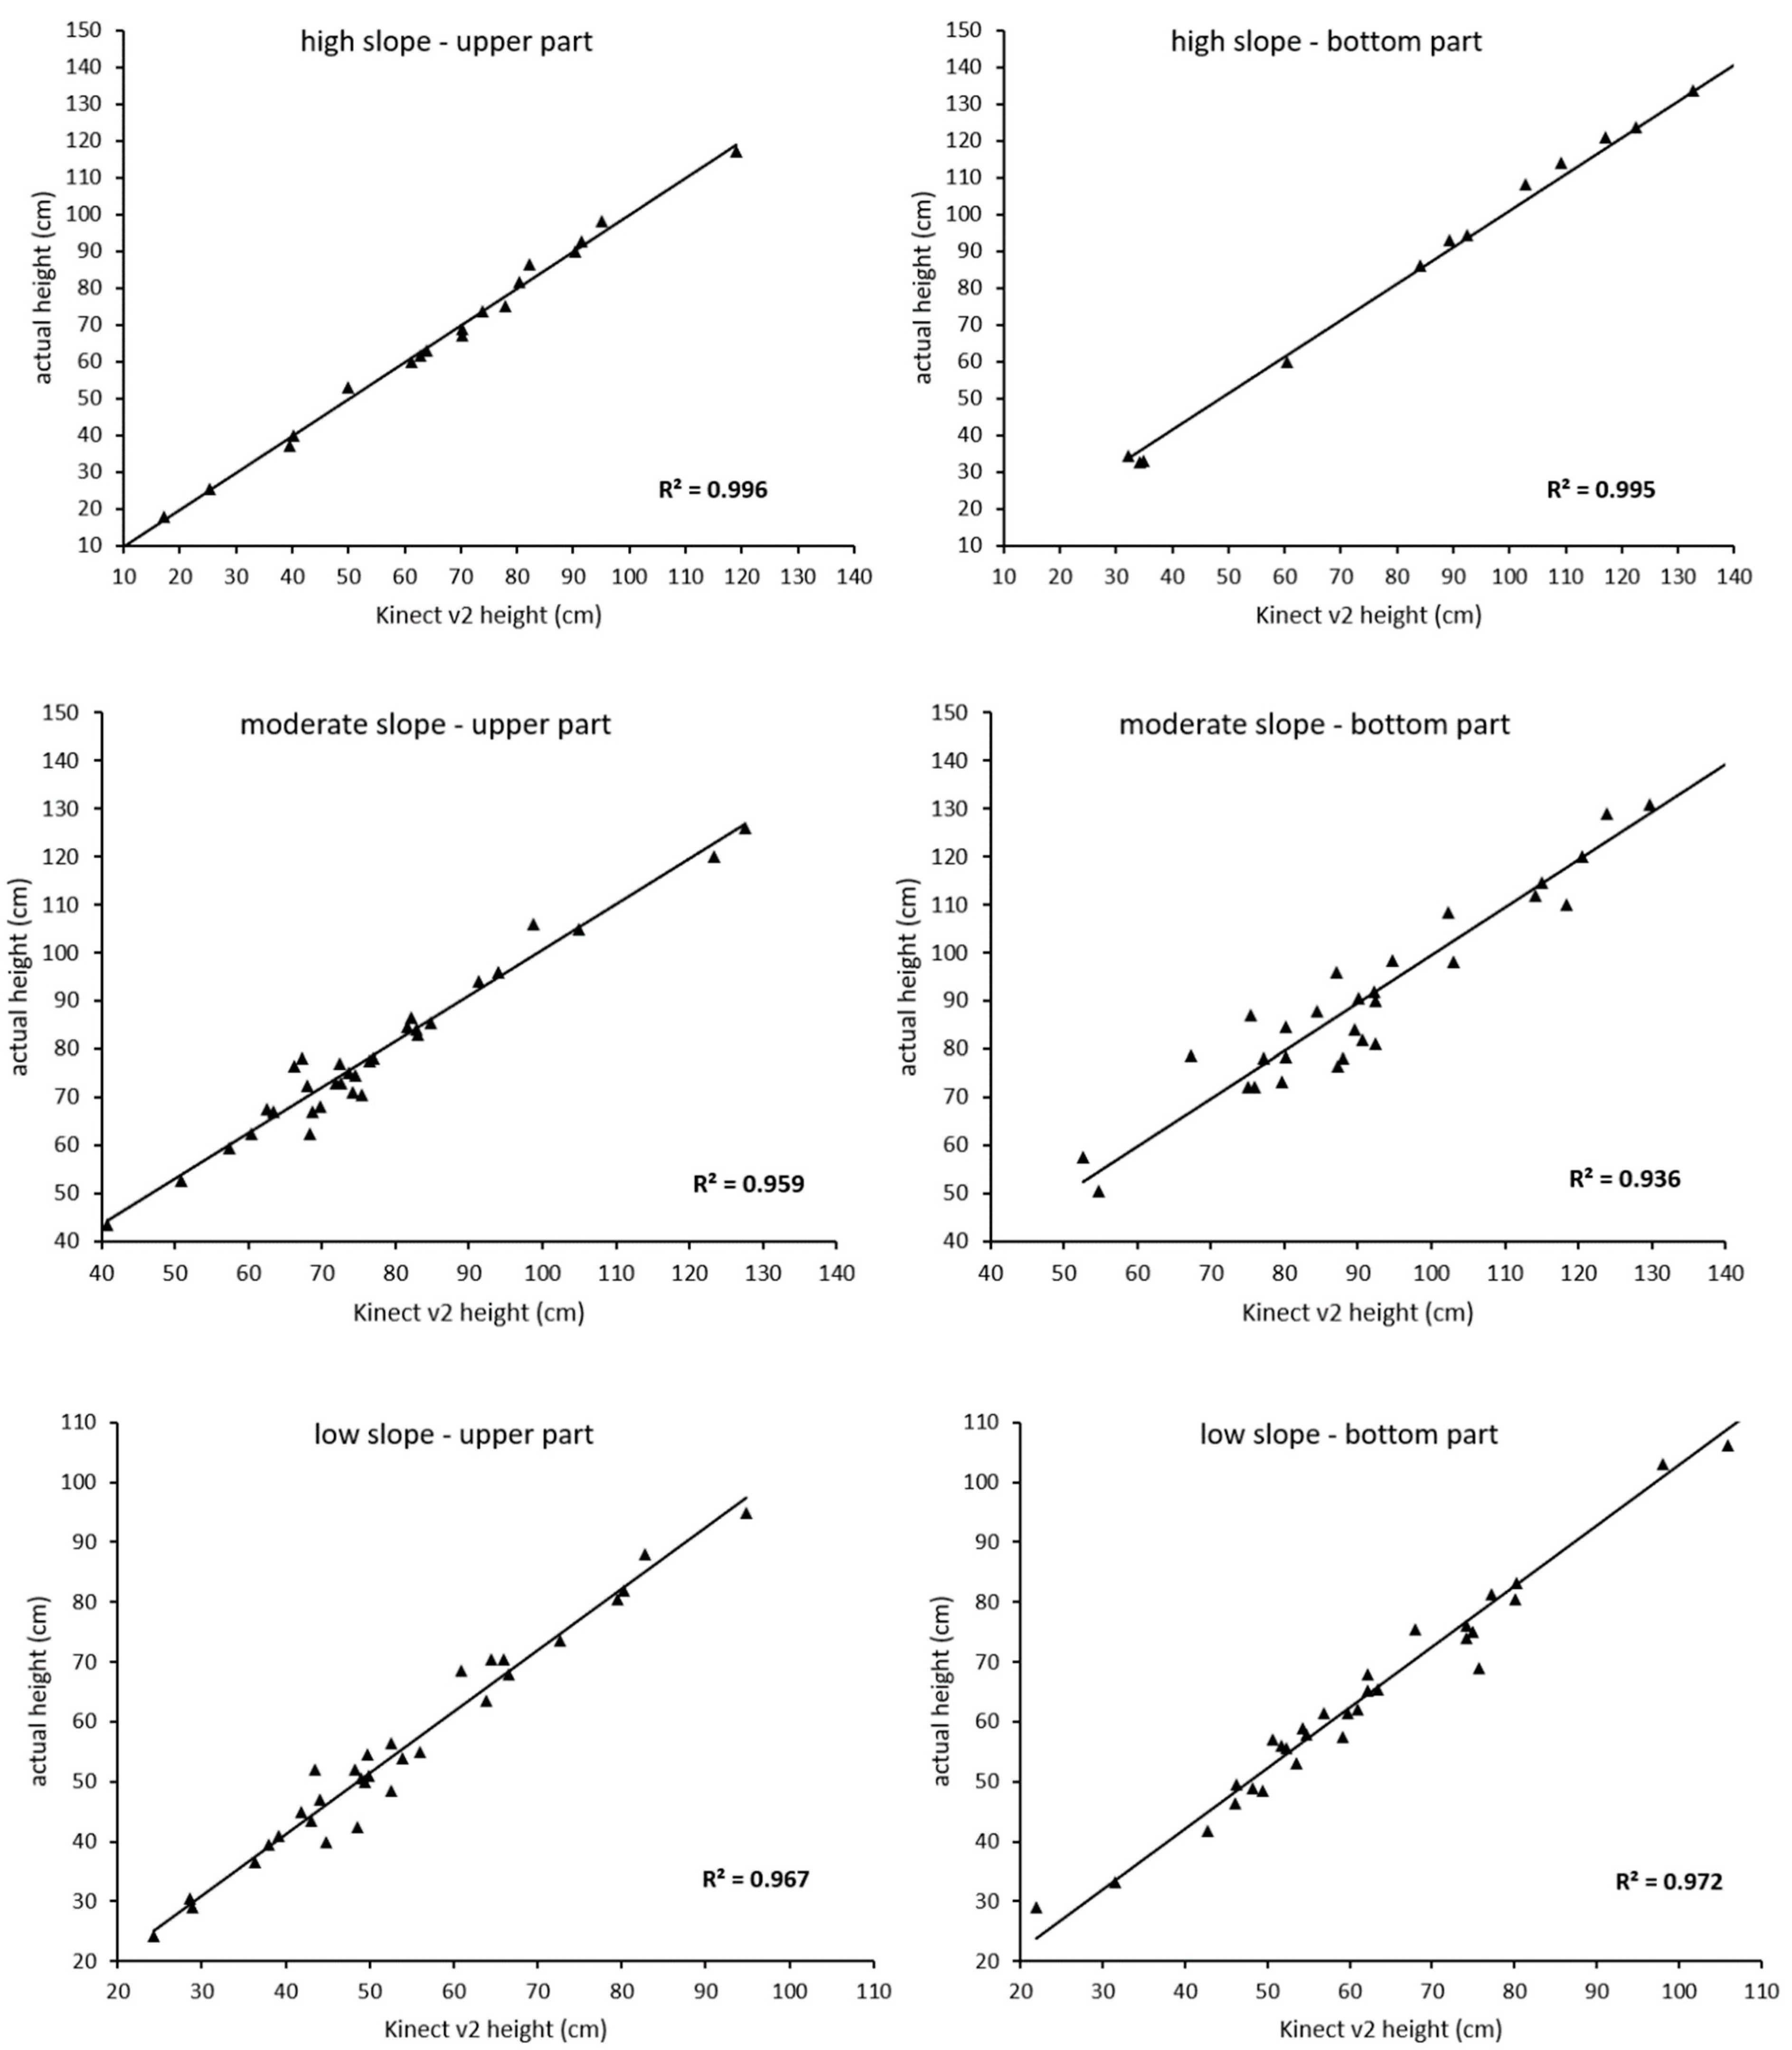
Regarding Kinect v2 accuracy, the linear models correctly estimate heights according to the degree of slope. All cases showed a robust correspondence between the Kinect v2 heights and the actual heights, i.e., ground truth. The correlation between both values was significant at p < 0.001, with an R2 ranging from 0.95 to 0.99 (Figure 4). Therefore, all relationships according to low, moderate, and high slopes indicate meaningful correlations corresponding to the expected assessing function. This robust correlation supports the hypothesis that as Kinect v2 heights increase, actual heights also increase for both the upper and bottom parts.
In addition, the corresponding statistics for MAD, RMSE, and MAPE were similar for low, moderate, and high slopes. However, each steepness of the slopes was related to ground truth parameters, i.e., actual measurements, in a different manner (Table 2). All cases demonstrated the accuracy of the Kinect v2 as a low-cost sensor for a rapid reconstruction for evaluating heights and their relation to conventional measurements.

4. Discussion

The olive trees were located on residual mounds due to water erosion and tillage. Soil mounds under trees are attributed to different formation processes that can be separated into cumulative or erosive processes [55,56]. Once developed, tree trunks and mounds act as diverting obstacles to surface runoff, also known as overland flow, occurring in sloping areas. Furthermore, regression analyses show a direct correlation between slope, erosion, and mound height. This fact agrees with the results obtained by Van Oost et al. [57], where the height of the mounds depended on the local slope. Mounds reach the maximum above the concave working edge, corresponding to the location where the highest transport energies are reached by runoff. Eventually, erosion rates are the highest.
On the other hand, the results also show an apparent erosion asymmetry between the upper part of the mound (with lower soil loss rates) and the bottom part, which shows much higher rates. The results demonstrate that the steeper the slope, the greater the difference in the bottom part. This phenomenon has an anthropogenic origin due to decades of soil management. The tillage has been the method of weeding applied in the study area for centuries, first by animal traction and then mechanically [58]. The tillage generates alternative soil movements that cause alteration of soil structure. Thus, it makes the soil more susceptible to degradation [59], increasing erosive effects with the slope [60], which is consistent with the results obtained.
In contrast, Vanwalleghem et al. [61] reported that sedimentation around tree trunks neither contributes to the formation of mounds in olive groves nor captures significant amounts of sediment. Erosion has been equally effective in both the upper and lower areas of the mounds. However, the results show that the terrain truncation has been lower in the upper part of the mounds. The trunk acts as a retaining barrier in these areas leading to an accumulation of sediment from the upper layers. This progressive accumulation has helped to counteract erosion losses, reducing the slope angle in this area. On the other hand, in the lower part of the mound, there is no such reception of sediments, as they are intercepted by the mound and diverted toward other areas. Thus, erosion processes predominate over deposition processes in the bottom part of the mound, and, as a result, truncation is more significant.
Continuous plowing for more than 60 years has also shaped the mounds. Additionally, plowing has substantially undermined the mounds. Contour tillage has modified the profile of the slope, thus leading to the creation of small terraces between the rows of trees. These terraces are swept away by surface runoff concentrated in the spaces between the olive trees [62,63] but maintained in the vicinity of the mounds. Therefore, tillage contributes significantly to the formation of mounds in olive groves. Tillage exposes the roots, which corroborates the results of [50], and also reaffirms the previous conclusions by Van Oost et al. [57] and García-Ruiz [64]. These studies highlight the critical role that agricultural mechanization plays in soil erosion processes. Moreover, according to the results, the amount of soil loss from the study area ranges from 1.05 to 0.5 cm/year, values higher than the 0.17 cm/year reported by Montgomery [65].
It should be noted that the proposed method has overcome significant limitations presented by previous methodologies [49] that were not suitable for calculating erosion rates in areas where slopes were less than 5%. These methods have good vertical accuracy (±2 mm km−1). However, they are impaired by the instrumentation used (solar heating of the tripod, distortion of the support, refraction due to heating of the soil under the instrument, manual data transfer, positioning of the measuring pole, and inhomogeneous micro-relief caused by tillage). In our work, these shortcomings have been overcome.
RGB-D sensors have been employed in many studies, from agricultural robotics [66] to crop plant detection [67], since they allow users to acquire RGB information and depth/infrared (IR) images. Thus, the proposed methodology using Kinect v2 as an RGB-D represents an advancement in estimating soil loss. Georeferenced 3D models derived from RGB-D sensors allow having a digital record of subsequent erosion processes. Thus, 3D models can be stored and compared in future studies to assess soil loss more accurately. Furthermore, colored 3D models of the tree mounds and their closest surroundings allow for extracting more features, such as germination points, bark disorders, or abnormalities of root development since they are exposed. Moreover, color information complements depth data in identifying inadequate tillage directions that damage the base of the tree trunks. Contrary to topographic total station surveys that discretize the terrain, derived 3D models from inexpensive depth sensors such as Kinect v2 provide a virtual continuum point cloud without gaps. Thus, depth sensors can measure multiple points simultaneously with virtually no limit on the number of measured points since they provide dense depth estimations at a high frame rate (30 fps) [68] and depth accuracy below 1 cm [69].
On the other hand, the extracted height values showed that the 3D models estimated heights related to erosion processes in a fast and reliable manner. Similar results (R2 = 0.982 for one-year-old and 0.944 for small poplars) were obtained in terms of measuring heights [46] as in the present study. Even though the nominal sensor depth ranges from 0.5 to 4.5 m [70], the maximum depth accuracy decreases when used outdoors [71]. Hence, the Kinect v2 was kept close to 1.5 m from the tree to avoid acquiring sparse point clouds. Thus, positioning the sensor at an adequate distance is highly relevant when screening outdoors under varying lighting conditions. Specifically, outdoor measurements suggest that the sensor can provide accurate depth readings of up to 1.9 m on sunny days and up to 2.8 m on overcast days [51]. On the other hand, compared to terrestrial 2D laser systems, these are not affected by ambient light. In contrast, the Kinect sensor has the benefit of producing a 3D scene for each frame, while 2D LiDAR must be relocated to generate a 3D model.
Furthermore, LiDAR sensors sometimes need high computer performance to prevent system overload, hence undersampling areas. Owing to massive datasets collected by LiDAR, lengthy processing delays may occur [72]. In this study, errors were found at the ends of root suckers or root borders, and some portions of the reconstruction lacked end details. However, this fact did not influence the determination of the germination point since the essential criterion was the shape of the stump. In terms of accuracy, three-dimensional LiDAR might be an option to sense small diameters; however, this device is relatively expensive [73]. However, some sources of error can be minimized to obtain more robust depth information. Furthermore, since the Kinect v2 sensor is a time-of-flight camera, each pixel of the gathered depth maps stores a measurement of the distance to the closest object. Moreover, it is not possible to manipulate the Kinect v2 modulation frequency or integration time compared to other RGB-D cameras. Thus, the standard deviation within the recorded distance range should increase [74]. Therefore, by decreasing the distance between the camera and the target olive tree and increasing the time span of the scene, it is possible to improve the degree of detail and eliminate errors. However, this increase in acquisition time, hence processing data, would be time-consuming. However, the minimum operational measurement distance in the digital sampling was between 0.60 m and 0.75 m, which is more than the stated standard of 0.5 m [73]. Therefore, the Kinect v2 was positioned within a range of 1–1.5 m from the tree to ensure that it did not acquire null depth values. This approach proved correct when processing depth data even though the scanning was performed outdoors.
Nonetheless, owing to the ongoing computing processing power and storage capacity, a different approach to improving Kinect v2 measurements could be lowering the scanning speed around the tree. Therefore, producing more robust data by averaging redundant data, i.e., incorporating more depth information for the same scene. Another way to optimize the Kinect v2 performance can be operating on the field of view. Even though depth data was recorded at the full field of view, the Kinect v2 enables the selection of the field of view up to a single pixel column. However, this improvement can lead to a detriment to the working efficiency [75]. On the other hand, these approaches could restrict the commercial usability of the study methodologies, hence impeding their broader transferability. Notably, selecting the depth camera requires careful consideration of the application. Particularly regarding the illumination and the distance at which the camera will be utilized.
The high concordance between the extracted heights from the 3D structural information of the olive trees with ground truth heights proved the accuracy of the method for estimating heights, thus, soil profile truncation. Therefore, the estimated height was calculated accurately enough since the tree trunk and bottom part geometry reconstructed was of high fidelity. Therefore, a high degree of agreement between actual and Kinect v2 heights was found. The results demonstrate that this time-of-flight camera for 3D digitizing is a reliable remote-sensing system due to its ability to scan trees in high geometric detail. High-accuracy microtopography is feasible using Kinect v2 as a depth sensor. Microtopography helps assess historical soil erosion. It also provides highly relevant information on the behavior of key soil loss factors (water erosion, slope, and tillage) in the vicinity of the mound in sloping olive groves. Moreover, microtopography accurately shows how the mound affects soil redistribution (erosion/sedimentation). This information is relevant for redistributing trees along the slope in new plantations to reduce erosion. The results indicate that this method based on microtopography has great potential, particularly for commercial groves that follow a regular planting pattern. So far, most generic mathematical erosion models lack reliable field observations that compromise the quality of their results [61].
In this work, we have shown a fast and accurate method that provides a better insight into erosion processes linked to mountain tree farms on slopes. Additionally, this study can improve the existing information on erosion factors, increasing reliability. Therefore, increasing the reliability of these models quickly. This work highlights the need for further study concerning agricultural cropping systems and mechanization, as the current agricultural approach exposes more soil to erosion. Therefore, future lines of research include the possibility of applying the proposed methodology to wider regions where mounds are not so evident and also analyzing other variables, such as different soil management, weeding tools, soil properties, slope shape, and length.

5. Conclusions

Historical soil erosion assessment is possible through Kinect v2 as a time-of-flight sensor. Indeed, the results of this work indicate that 3D modeling of olive trees at a high level of detail is possible with low-cost depth perception and contactless technology. Even outdoors, the Kinect v2 allowed the microtopography of old olive trees to assess the recent relief. Therefore, the 3D perception from Kinect v2 contributes to improving the estimation of erosion processes in Mediterranean olive groves in mountainous areas.
This simple proposed approach represents an advance in understanding soil loss due to erosion according to tree mounds. This agile and accurate technology increases the quantification of erosion impacts, while current erosion models based on generic measures struggle to provide accurate and consistent results. Furthermore, this methodology can be a starting point for assessing future soil loss since 3D models can be georeferenced and stored for subsequent measurements. Thus, this method contributes to a better understanding of the erosion processes affecting olive groves on sloping land. Nevertheless, further efforts should focus on reducing acquisition time in the field, making the acquisition process more agile. Moreover, the depth sensor and other sensors (e.g., hyperspectral or NDVI sensors) can be installed in agricultural machinery to capture depth data while performing other tasks, minimizing costs and reducing measuring times.
Furthermore, this study will provide governments and public agricultural agencies with innovative tools to monitor soil losses in mountain tree crops. This study will contribute to developing more effective and regionally adapted erosion control policies, as the Common Agricultural Policy requires.

Author Contributions

Conceptualization, F.L. and H.M.; methodology, D.A. and H.M.; software, F.L.; validation, D.A.; F.L. and H.M.; formal analysis, D.A., F.L. and H.M.; investigation, D.A.; F.L. and H.M. resources, D.A.; data curation, D.A.; F.L. and H.M.; writing—original draft preparation H.M.; writing—review and editing, D.A.; R.B.-S.; F.L. and H.M.; visualization, D.A. and H.M.; supervision, D.A.; R.B.-S.; F.L. and H.M.; project administration, D.A.; funding acquisition, D.A. All authors have read and agreed to the published version of the manuscript.

Funding

This research was funded by OAPN grant number 2924S/2022 and by AEI, grant number TED2021-130031B-I00, and PID2020-437 113229RBC43/AEI/10.13039/501100011033.

Acknowledgments

José Manuel Peña Barragán for facilitating GPS instrumentation for field measurements.

Conflicts of Interest

The authors declare no conflict of interest.

Appendix A

Figure A1. Location map of the study site in the province of Malaga, Spain (a), general view of the topography of the three study plots (high, medium, and low) (b,c).
Agronomy 13 00070 g0a1

Appendix B

Figure A2. Slope ranges from low (0–5%), moderate (6–15%) to high (>15%) for each analyzed.
Agronomy 13 00070 g0a2

References

  1. Fraga, H.; Moriondo, M.; Leolini, L.; Santos, J.A. Mediterranean Olive Orchards under Climate Change: A Review of Future Impacts and Adaptation Strategies. Agronomy 2021, 11, 56. [Google Scholar] [CrossRef]
  2. Vanwalleghem, T.; Amate, J.I.; de Molina, M.G.; Fernández, D.S.; Gómez, J.A. Quantifying the effect of historical soil management on soil erosion rates in Mediterranean olive orchards. Agric. Ecosyst. Environ. 2011, 142, 341–351. [Google Scholar] [CrossRef]
  3. Taguas, E.V. Vulnerability of olive orchards under the current CAP (Common Agricultural Policy) regulations on soil erosion: A study case in Southern Spain. Land Use Policy 2015, 42, 683–694. [Google Scholar] [CrossRef]
  4. García Brenes, M.D. El olivar en Andalucía y el sistema de protección de la Unión Europea. Prob. Ciudad. México 2006, 37, 153–176. (In Spanish) [Google Scholar] [CrossRef]
  5. Beniston, J.W.; Shipitalo, M.J.; Lal, R.; Dayton, E.A.; Hopkins, D.W.; Jones, F.; Joynes, A.; Dungait, J.A.J. Carbon and macronutrient losses during accelerated erosion under different tillage and residue management. Eur. J. Soil Sci. 2015, 66, 218–225. [Google Scholar] [CrossRef]
  6. Infante-Amate, J. The Ecology and History of the Mediterranean Olive Grove: The Spanish Great Expansion, 1750–2000. Rural. Hist. 2012, 23, 161–184. [Google Scholar] [CrossRef]
  7. Govers, G.; Gobin, A.; Cerdan, O.; Van Rompaey, A.; Kirkby, M.; Irvine, B.; Le Bissonnais, Y.; Daroussin, J.; King, D.; Jones, R. Pan-European Soil Rrosion Risk Assessment for Europe: The PESERA Map; JRC: Ispra, Italy, 2003. [Google Scholar]
  8. Quinton, J.N. Reducing predictive uncertainty in model simulations: A comparison of two methods using the European Soil Erosion Model. CATENA 1997, 30, 101–117. [Google Scholar] [CrossRef]
  9. Dunjó, G.; Pardini, G.; Gispert, M. The role of land use–land cover on runoff generation and sediment yield at a microplot scale, in a small Mediterranean catchment. J. Arid. Environ. 2004, 57, 239–256. [Google Scholar] [CrossRef]
  10. Beaufoy, G. The environmental impact of olive oil production in the European Union: Practical options for improving the environmental impact. European Forum for Nature Conservation and Pastoralism; Association for Agro-Rural Policy Analysis and Reform: Peterborough, UK, 2001. [Google Scholar]
  11. De la Rosa, D.; Diaz-Pereira, E.; Mayol, F.; Czyz, E.A.; Dexter, A.R.; Dumitru, E.; Enache, R.; Fleige, H.; Horn, R.; Rajkay, K.; et al. SIDASS project: Part 2. Soil erosion as a function of soil type and agricultural management in a Sevilla olive area, southern Spain. Soil Tillage Res. 2005, 82, 19–28. [Google Scholar] [CrossRef]
  12. Scheidel, A.; Krausmann, F. Diet, trade and land use: A socio-ecological analysis of the transformation of the olive oil system. Land Use Policy 2011, 28, 47–56. [Google Scholar] [CrossRef]
  13. Papiernik, S.K. Soil properties and productivity as affected by topsoil movement within an eroded landform. Soil Tillage Res. 2009, 102, 67–77. [Google Scholar] [CrossRef]
  14. Berger, G.; Kaechele, H.; Pfeffer, H. The greening of the European common agricultural policy by linking the European-wide obligation of set-aside with voluntary agri-environmental measures on a regional scale. Environ. Sci. Policy 2006, 9, 509–524. [Google Scholar] [CrossRef]
  15. Evrard, O.; Bielders, C.L.; Vandaele, K.; van Wesemael, B. Spatial and temporal variation of muddy floods in central Belgium, off-site impacts and potential control measures. CATENA 2007, 70, 443–454. [Google Scholar] [CrossRef]
  16. Gómez, J.A.; Sobrinho, T.A.; Giráldez, J.V.; Fereres, E. Soil management effects on runoff, erosion and soil properties in an olive grove of Southern Spain. Soil Tillage Res. 2009, 102, 5–13. [Google Scholar] [CrossRef]
  17. Schoorl, J.M.; Veldkamp, A. Linking land use and landscape process modelling: A case study for the Álora region (south Spain). Agric. Ecosyst. Environ. 2001, 85, 281–292. [Google Scholar] [CrossRef]
  18. Gómez, J.A.; Infante-Amate, J.; De Molina, M.G.; Vanwalleghem, T.; Taguas, E.V.; Lorite, I. Olive Cultivation, its Impact on Soil Erosion and its Progression into Yield Impacts in Southern Spain in the Past as a Key to a Future of Increasing Climate Uncertainty. Agriculture 2014, 4, 170–198. [Google Scholar] [CrossRef] [Green Version]
  19. Wischmeier, W.H. Predicting Rainfall Erosion Losses: A Guide to Conservation Planning; USDA: Washington, DC, USA, 1978; 58p. [Google Scholar]
  20. Gómez, J.A.; Battany, M.; Renschler, C.S.; Fereres, E. Evaluating the impact of soil management on soil loss in olive orchards. Soil Use Manag. 2003, 19, 127–134. [Google Scholar] [CrossRef]
  21. Álvarez, S.; Soriano, M.A.; Landa, B.B.; Gómez, J.A. Soil properties in organic olive groves compared with that in natural areas in a mountainous landscape in southern Spain. Soil Use Manag. 2007, 23, 404–416. [Google Scholar] [CrossRef]
  22. Kragh, M.F.; Christiansen, P.; Laursen, M.S.; Larsen, M.; Steen, K.A.; Green, O.; Karstoft, H.; Jørgensen, R.N. FieldSAFE: Dataset for Obstacle Detection in Agriculture. Sensors 2017, 17, 2579. [Google Scholar] [CrossRef] [Green Version]
  23. Bash, E.A.; Moorman, B.J.; Gunther, A. Detecting Short-Term Surface Melt on an Arctic Glacier Using UAV Surveys. Remote Sens. 2018, 10, 1547. [Google Scholar] [CrossRef]
  24. Vergari, F.; Della Seta, M.; Del Monte, M.; Fredi, P.; Lupia Palmieri, E. Long- and short-term evolution of several Mediterranean denudation hot spots: The role of rainfall variations and human impact. Geomorphology 2013, 183, 14–27. [Google Scholar] [CrossRef]
  25. Frankl, A.; Stal, C.; Abraha, A.; Nyssen, J.; Rieke-Zapp, D.; De Wulf, A.; Poesen, J. Detailed recording of gully morphology in 3D through image-based modelling. CATENA 2015, 127, 92–101. [Google Scholar] [CrossRef] [Green Version]
  26. Robichaud, P.R.; Molnau, M. Measuring Soil Roughness Changes with An Ultrasonic Prohler. Trans. ASAE 1990, 33, 1851–1858. [Google Scholar] [CrossRef]
  27. Luong, J.; Destain, M.-F.; Mercatoris, B. Characterisation of structural properties of soil using ultrasonic waves. In 2014 Montreal, Quebec Canada July 13–July 16, 2014; ASABE: St. Joseph, MI, USA, 2014; p. 1. [Google Scholar]
  28. Rueda-Ayala, V.; Peteinatos, G.; Gerhards, R.; Andújar, D. A non-chemical system for online weed control. Sensors 2015, 15, 7691–7707. [Google Scholar] [CrossRef] [Green Version]
  29. Kasper, M.; Buchan, G.D.; Mentler, A.; Blum, W.E.H. Influence of soil tillage systems on aggregate stability and the distribution of C and N in different aggregate fractions. Soil Tillage Res. 2009, 105, 192–199. [Google Scholar] [CrossRef]
  30. Colaço, A.F.; Molin, J.P.; Rosell-Polo, J.R. Application of light detection and ranging and ultrasonic sensors to high-throughput phenotyping and precision horticulture: Current status and challenges. Hortic. Res. 2018, 5, 35. [Google Scholar] [CrossRef] [Green Version]
  31. Méndez, V.; Catalán, H.; Rosell-Polo, J.R.; Arnó, J.; Sanz, R. LiDAR simulation in modelled orchards to optimise the use of terrestrial laser scanners and derived vegetative measures. Biosyst. Eng. 2013, 115, 7–19. [Google Scholar] [CrossRef] [Green Version]
  32. Andújar, D.; Rueda-Ayala, V.; Moreno, H.; Rosell-Polo, J.R.; Escolá, A.; Valero, C.; Gerhards, R.; Fernández-Quintanilla, C.; Dorado, J.; Griepentrog, H.-W. Discriminating Crop, Weeds and Soil Surface with a Terrestrial LIDAR Sensor. Sensors 2013, 13, 14662–14675. [Google Scholar] [CrossRef] [Green Version]
  33. Barneveld, R.J.; Seeger, M.; Maalen-Johansen, I. Assessment of terrestrial laser scanning technology for obtaining high-resolution DEMs of soils. Earth Surf. Process. Landf. 2013, 38, 90–94. [Google Scholar] [CrossRef]
  34. Milenković, M.; Pfeifer, N.; Glira, P. Applying Terrestrial Laser Scanning for Soil Surface Roughness Assessment. Remote Sens. 2015, 7, 2007–2045. [Google Scholar] [CrossRef]
  35. Di Biase, V.; Kuschnerus, M.; Lindenbergh, R.C. Permanent Laser Scanner and Synthetic Aperture Radar Data: Correlation Characterisation at a Sandy Beach. Sensors 2022, 22, 2311. [Google Scholar] [CrossRef] [PubMed]
  36. Li, Y.; McNelis, J.J.; Washington-Allen, R.A. Quantifying Short-Term Erosion and Deposition in an Active Gully Using Terrestrial Laser Scanning: A Case Study from West Tennessee, USA. Front. Earth Sci. 2020, 8. [Google Scholar] [CrossRef]
  37. Li, L.; Nearing, M.A.; Nichols, M.H.; Polyakov, V.O.; Cavanaugh, M.L. Using terrestrial LiDAR to measure water erosion on stony plots under simulated rainfall. Earth Surf. Process. Landf. 2020, 45, 484–495. [Google Scholar] [CrossRef]
  38. Xu, H.; Xu, J.; Xu, W. Survey of 3D modeling using depth cameras. Virtual Real. Intell. Hardw. 2019, 1, 483–499. [Google Scholar] [CrossRef]
  39. Halmetschlager-Funek, G.; Suchi, M.; Kampel, M.; Vincze, M. An Empirical Evaluation of Ten Depth Cameras: Bias, Precision, Lateral Noise, Different Lighting Conditions and Materials, and Multiple Sensor Setups in Indoor Environments. IEEE Robot. Autom. Mag. 2019, 26, 67–77. [Google Scholar] [CrossRef]
  40. Tölgyessy, M.; Dekan, M.; Chovanec, L.; Hubinský, P. Evaluation of the Azure Kinect and Its Comparison to Kinect V1 and Kinect V2. Sensors 2021, 21, 413. [Google Scholar] [CrossRef] [PubMed]
  41. Rueda-Ayala, V.P.; Peña, J.M.; Höglind, M.; Bengochea-Guevara, J.M.; Andújar, D. Comparing UAV-Based Technologies and RGB-D Reconstruction Methods for Plant Height and Biomass Monitoring on Grass Ley. Sensors 2019, 19, 535. [Google Scholar] [CrossRef] [Green Version]
  42. Martínez-Casasnovas, J.A.; Sandonís-Pozo, L.; Escolà, A.; Arnó, J.; Llorens, J. Delineation of Management Zones in Hedgerow Almond Orchards Based on Vegetation Indices from UAV Images Validated by LiDAR-Derived Canopy Parameters. Agronomy 2022, 12, 102. [Google Scholar] [CrossRef]
  43. Andújar, D.; Ribeiro, A.; Fernández-Quintanilla, C.; Dorado, J. Using depth cameras to extract structural parameters to assess the growth state and yield of cauliflower crops. Comput. Electron. Agric. 2016, 122, 67–73. [Google Scholar] [CrossRef]
  44. Vázquez-Arellano, M.; Paraforos, D.S.; Reiser, D.; Garrido-Izard, M.; Griepentrog, H.W. Determination of stem position and height of reconstructed maize plants using a time-of-flight camera. Comput. Electron. Agric. 2018, 154, 276–288. [Google Scholar] [CrossRef]
  45. Nock, C.; Taugourdeau, O.; Delagrange, S.; Messier, C. Assessing the Potential of Low-Cost 3D Cameras for the Rapid Measurement of Plant Woody Structure. Sensors 2013, 13, 16216–16233. [Google Scholar] [CrossRef] [PubMed] [Green Version]
  46. Andújar, D.; Fernández-Quintanilla, C.; Dorado, J. Matching the Best Viewing Angle in Depth Cameras for Biomass Estimation Based on Poplar Seedling Geometry. Sensors 2015, 15, 12999–13011. [Google Scholar] [CrossRef] [PubMed] [Green Version]
  47. Blanco Sepúlveda, R.; Lima Cueto, F.J.; Gómez Moreno, M.L. El olivar de montaña y la conservación del suelo en la transición de la economía orgánica a la industrial: El caso de Sierra de las Nieves (Málaga), 1940–1975. Ager. Rev. Estud. Sobre Despoblación Desarro. Rural. 2017, 23, 97–128. (In Spanish) [Google Scholar]
  48. Lima, F.; Gómez Moreno, M.L.; Blanco Sepúlveda, R. Evolución del ajuste entre patrón de localización del olivar y capacidad agrológica en la montaña mediterránea andaluza (1956–2007). El caso de Sierra de las Nieves: Respuestas locales a factores globales [Evolution of the adjustment between olive grove location pattern and agrological capacity in the Andalusian Mediterranean mountains (1956–2007). The case of Sierra de las Nieves: Local responses to global factors.]. Cuadernos Geográficos 2021, 60, 253–276. [Google Scholar] [CrossRef]
  49. Lima, F.; Blanco-Sepúlveda, R.; Gómez-Moreno, M.L. Soil erosion and environmental regulations in the European agrarian policy for olive groves (Olea europaea) of southern Spain. Agrociencia 2018, 52, 293–308. [Google Scholar]
  50. Kraushaar, S.; Herrmann, N.; Ollesch, G.; Vogel, H.J.; Siebert, C. Mound measurements—Quantifying medium-term soil erosion under olive trees in Northern Jordan. Geomorphology 2014, 213, 1–12. [Google Scholar] [CrossRef]
  51. Fankhauser, P.; Bloesch, M.; Rodriguez, D.; Kaestner, R.; Hutter, M.; Siegwart, R. Kinect v2 for Mobile Robot Navigation: Evaluation and Modeling; IEEE: Piscataway, NJ, USA, 2015. [Google Scholar]
  52. Chen, Y.; Medioni, G. Object modelling by registration of multiple range images. Image Vis. Comput. 1992, 10, 145–155. [Google Scholar] [CrossRef]
  53. Nießner, M.; Zollhöfer, M.; Izadi, S.; Stamminger, M. Real-time 3D Reconstruction at Scale using Voxel Hashing. ACM Trans. Graph. (TOG) 2013, 32, 169. [Google Scholar] [CrossRef] [Green Version]
  54. Chéné, Y.; Rousseau, D.; Lucidarme, P.; Bertheloot, J.; Caffier, V.; Morel, P.; Belin, É.; Chapeau-Blondeau, F. On the use of depth camera for 3D phenotyping of entire plants. Comput. Electron. Agric. 2012, 82, 122–127. [Google Scholar] [CrossRef]
  55. Bochet, E.; Poesen, J.; Rubio, J.L. Mound development as an interaction of individual plants with soil, water erosion and sedimentation processes on slopes. Earth Surf. Process. Landf. 2000, 25, 847–867. [Google Scholar] [CrossRef]
  56. Dougill, A.J.; Thomas, A.D. Nebkha dunes in the Molopo Basin, South Africa and Botswana: Formation controls and their validity as indicators of soil degradation. J. Arid. Environ. 2002, 50, 413–428. [Google Scholar] [CrossRef]
  57. Van Oost, K.; Van Muysen, W.; Govers, G.; Deckers, J.; Quine, T.A. From water to tillage erosion dominated landform evolution. Geomorphology 2005, 72, 193–203. [Google Scholar] [CrossRef]
  58. Lima Cueto, F. Mountain olive groves and soil preservation in the transition from an organic to an industrial economy: The case of Sierra de las Nieves (Málaga, Spain), 1940–1975 [El olivar de montaña y la conservación del suelo en la transición de la economía orgánica a la industrial: El caso de Sierra de las Nieves (Málaga), 1940–1975]. J. Depopulation Rural. Dev. Stud. 2017, 23, 97–128. [Google Scholar] [CrossRef]
  59. Zhang, J.H.; Wang, Y.; Jia, L.Z.; Zhang, Z.H. An interaction between vertical and lateral movements of soil constituents by tillage in a steep-slope landscape. CATENA 2017, 152, 292–298. [Google Scholar] [CrossRef]
  60. Zhang, J.; Yang, M.; Deng, X.; Liu, Z.; Zhang, F. The effects of tillage on sheet erosion on sloping fields in the wind-water erosion crisscross region of the Chinese Loess Plateau. Soil Tillage Res. 2019, 187, 235–245. [Google Scholar] [CrossRef]
  61. Vanwalleghem, T.; Laguna, A.; Giráldez, J.V.; Jiménez-Hornero, F.J. Applying a simple methodology to assess historical soil erosion in olive orchards. Geomorphology 2010, 114, 294–302. [Google Scholar] [CrossRef] [Green Version]
  62. Gómez, J.A.; Giráldez, J.V.; Fereres, E. Analysis of Infiltration and Runoff in an Olive Orchard under No-Till. Soil Sci. Soc. Am. J. 2001, 65, 291–299. [Google Scholar] [CrossRef]
  63. Gómez, J.A.; Giráldez, J.V.; Fereres, E. Rainfall interception by olive trees in relation to leaf area. Agric. Water Manag. 2001, 49, 65–76. [Google Scholar] [CrossRef]
  64. García-Ruiz, J.M. The effects of land uses on soil erosion in Spain: A review. CATENA 2010, 81, 1–11. [Google Scholar] [CrossRef]
  65. Montgomery, D.R. Soil erosion and agricultural sustainability. Proc. Natl. Acad. Sci. USA 2007, 104, 13268–13272. [Google Scholar] [CrossRef] [Green Version]
  66. Xiong, Y.; Peng, C.; Grimstad, L.; From, P.J.; Isler, V. Development and field evaluation of a strawberry harvesting robot with a cable-driven gripper. Comput. Electron. Agric. 2019, 157, 392–402. [Google Scholar] [CrossRef]
  67. Gai, J.; Tang, L.; Steward, B.L. Automated crop plant detection based on the fusion of color and depth images for robotic weed control. J. Field Robot. 2020, 37, 35–52. [Google Scholar] [CrossRef]
  68. Wasenmüller, O.; Stricker, D. Comparison of Kinect V1 and V2 Depth Images in Terms of Accuracy and Precision; Springer International Publishing: Cham, Switzerland, 2017; pp. 34–45. [Google Scholar]
  69. Kurillo, G.; Hemingway, E.; Cheng, M.-L.; Cheng, L. Evaluating the Accuracy of the Azure Kinect and Kinect v2. Sensors 2022, 22, 2469. [Google Scholar] [CrossRef]
  70. Pagliari, D.; Pinto, L. Calibration of Kinect for Xbox One and Comparison between the Two Generations of Microsoft Sensors. Sensors 2015, 15, 27569–27589. [Google Scholar] [CrossRef] [Green Version]
  71. Gené-Mola, J.; Llorens, J.; Rosell-Polo, J.R.; Gregorio, E.; Arnó, J.; Solanelles, F.; Martínez-Casasnovas, J.A.; Escolà, A. Assessing the Performance of RGB-D Sensors for 3D Fruit Crop Canopy Characterization under Different Operating and Lighting Conditions. Sensors 2020, 20, 7072. [Google Scholar] [CrossRef] [PubMed]
  72. Pérez-Ruiz, M.; Rallo, P.; Jiménez, M.R.; Garrido-Izard, M.; Suárez, M.P.; Casanova, L.; Valero, C.; Martínez-Guanter, J.; Morales-Sillero, A. Evaluation of Over-The-Row Harvester Damage in a Super-High-Density Olive Orchard Using On-Board Sensing Techniques. Sensors 2018, 18, 1242. [Google Scholar] [CrossRef] [Green Version]
  73. Jiao, J.; Yuan, L.; Tang, W.; Deng, Z.; Wu, Q. A Post-Rectification Approach of Depth Images of Kinect v2 for 3D Reconstruction of Indoor Scenes. ISPRS Int. J. Geo-Inf. 2017, 6, 349. [Google Scholar] [CrossRef] [Green Version]
  74. Moreno, H.; Bengochea-Guevara, J.; Ribeiro, A.; Andújar, D. 3D Assessment of Vine Training Systems Derived from Ground-Based RGB-D Imagery. Agriculture 2022, 12, 798. [Google Scholar] [CrossRef]
  75. Rosell-Polo, J.R.; Gregorio, E.; Gené, J.; Llorens, J.; Torrent, X.; Arnó, J.; Escolà, A. Kinect v2 Sensor-Based Mobile Terrestrial Laser Scanner for Agricultural Outdoor Applications. IEEE/ASME Trans. Mechatron. 2017, 22, 2420–2427. [Google Scholar] [CrossRef]
Figure 1. Mechanized tillage tools: crawler tractor equipped with a 2-row, 9-arm cultichisel implement (a) with duckfoot grids (b); overview of the study site “Pachocho” showing an inadequate tillage pattern (no contour) (c).
Agronomy 13 00070 g001
Figure 2. A mound formed by erosion around a tree in the “High Fontarron.” The historical relief of the soil is indicated by the yellow line reconstructed from the germination point (a). The red line indicates the position of the recent relief. The difference between the two surfaces corresponds to the truncation of the eroded soil profile (h), represented by a dashed black line. Hence, (b) and (c) indicate the upper and bottom part of the mounds, respectively. The measurement of (h) was taken at the top and the bottom of the mound. Slope gradients were determined using a digital clinometer (slope local angle is also depicted).
Agronomy 13 00070 g002
Figure 3. Regression analyses comparing actual data (measured height as ground truth) versus Kinect v2 heights for the upper part and bottom for all the 83 sampled olive trees. Dataset faithful at 0.05 significance level.
Agronomy 13 00070 g003
Figure 4. Kinect v2 height versus actual height (ground truth), including the effect of the slope gradient according to a high, moderate, and low degree.
Agronomy 13 00070 g004
Table 1. Descriptive statistics of the three main categories according to the slope gradient in percentages.
Height Measurements
ActualKinect v2
Range of Slopes (%)DescriptionTree PartUpperBottomUpperBottom
0–5lowSTDEV17.4419.8416.7119.37cm
MEAN54.9365.1553.3762.72
SE3.133.563.003.48
CV31.7430.4631.3130.88%
6–15moderateSTDEV17.6925.7418.1925.08cm
MEAN78.6695.6877.0796.25
SE3.134.553.224.43
CV22.4926.9123.6026.06%
>15highSTDEV30.7247.9230.6848.27cm
MEAN61.07115.7161.24115.00
SE6.8710.726.8610.79
CV50.3141.4250.0941.98%
Table 2. Basic statistics of the three main categories according to the slope gradient in percentages of the linear regression analysis with their corresponding mean absolute deviation (MAD), root mean square error (RMSE), and mean average percentage error (MAPE).
Range of Slopes (%)Description UpperBottom
0–5lowMAD2.613.14cm
RMSE3.514.06
MAPE4.875.14%
6–15moderateMAD2.985.37cm
RMSE3.976.46
MAPE3.986.02%
>15highMAD1.492.72cm
RMSE1.903.28
MAPE2.792.78%
Disclaimer/Publisher’s Note: The statements, opinions and data contained in all publications are solely those of the individual author(s) and contributor(s) and not of MDPI and/or the editor(s). MDPI and/or the editor(s) disclaim responsibility for any injury to people or property resulting from any ideas, methods, instructions or products referred to in the content.