Abstract
Soil aggregates play an important role in affecting the structural stability of the soil, and it is important to understand the relationship between soil aggregate stability and crop yield in herbage-fruit tree intercropping systems. In this study, we determined the optimal spacing configurations for improving aggregate stability while increasing crop yields in alfalfa-jujube intercropping systems. The treatments included three intercropping patterns, i.e., the distances between alfalfa and jujube at 0.5 m (IP0.5m), 1 m (IP1m), and 1.45 m (IP1.45m), along with monoculture alfalfa (CKAL) and jujube (CKJU). The results showed that IP0.5m, IP1m, IP1.45m, and CKJU effectively improved soil aggregate structure compared to CKAL. The IP1m spacing significantly increased the amounts of macro-aggregates (8.2%), and improved soil mechanical properties and aggregate stability among the other treatments, which was partly attributable to increased mean weight diameter (13.6%) and decreased soil aggregate destruction rate of water-stable aggregates (2.9%). The results of the principal component analysis showed that IP1m treatments had a positive effect on PC1. The one-meter spacing of jujube-to-alfalfa intercropping optimized the soil structure while improving the yield (8.3%); thus, it can be considered the most suitable intercropping spacing configuration for growing alfalfa in jujube plantations.
1. Introduction
Intercropping has been shown to have several advantages over sole or monoculture cropping [1,2,3]–increasing crop yields, land use efficiency, improving water and nutrient use efficiencies, and reducing carbon footprints. Intercropping herbage with fruit trees in orchard cultivation is a common soil management practice, which has been used for the development of sustainable cropping systems worldwide [3,4,5]. In China, the use of herbage in orchard cultivation has been promoted as a major measure for increasing green fruit production since the 1990s. Typically, the herbage is planted between fruit trees or throughout the whole orchard as mulch [6]. In some of the orchard–herbage complex systems, multiple crop species are planted at multiple levels and with multiple timings, allowing the fruit trees and the multiple species to engage in inter-species interactions via the sharing of and competing for light, heat, water, and nutrients [7,8]. The feedback effect of each component of the intercropping on the utilization of soil resources is important for the sustainable development of orchard–herbage systems [9].
Jujube (Ziziphus jujuba L.) is a traditional cash crop in Xinjiang province, China, where it has been planted for more than 3000 years. The unique climate in southern Xinjiang is favorable to grow jujube trees because the duration of sunshine is long and the temperature difference between day and night is large, which creates jujube fruits with great density and fine texture, high sugar content, and small stones. Alfalfa (Medicago sativa L.), a perennial legume forage, can be adapted to survive under harsh environments, where it can continuously produce a high yield per unit area for several years after establishment. Alfalfa plants have high nutrient content and intercropping alfalfa in a rotation system can improve soil nutrient content and enrich soil fertility. The deep rooting systems and the unique forage characteristics of alfalfa make it a favorable choice for improving soil structure [10]. In China, alfalfa has been used as the main forage crop in the development of sustainable agricultural systems. However, little information exists regarding how intercropping alfalfa with jujube trees would affect soil aggregates and herbage yields.
Crop plants require a desirable soil structure to ensure their root anchorage, growth, and development. A good rooting system enables plants to absorb soil water and nutrients, regulate soil water and air contents, and can penetrate deep soil layers for extra resources [11]. Soil aggregates occur in various forms and sizes due to the interactions between the host plants, the environment, crop management factors, and soil properties. Soil aggregates are essential components of the soil structure that affect many of the physical, chemical, and biochemical properties of the soil. Changes in the soil environment will be accompanied by changes in the quantity and quality of soil aggregates [12,13,14]. Soil aggregate formation is a consequence of the rearrangement of particles, flocculation, and cementation. The distribution of soil aggregate sizes (i.e., the amounts of large, medium, and small macro-aggregates, and micro-aggregates) influences the size and continuity of soil pores [15]. Macro-aggregates typically contain more organic matter and nutrients, are less susceptible to wind and water erosions, and form larger pores to allow greater water infiltration and aeration than micro-aggregates [16,17]. Micro-aggregates are generally formed by chemical factors (Tisdall and Oades, [18,19]), whereas macro-aggregates are formed by biological factors such as roots and fungal hyphae, and byproducts of microbial synthesis and decay [19,20,21]. Thus, soil management practices such as crop rotation, fertilizer application, and water management will affect the formation of macro-aggregates more than micro-aggregates [15,16]. The soil structure is one of the core soil quality indicators as it affects other processes that are important for soil productivity, carbon sequestration, and soil systems resiliency [22]. A good soil structure requires more soil aggregates and an appropriate particle size distribution, to increase soil productivity and reduce erosion [23]. Many agronomic practices, such as intercropping, and fertilization have important effects on soil structure [24,25]. For example, [26] found that no-tillage slowed down the turnover of soil macro-aggregates and helped to produce more micro-aggregates < 0.25 mm within the soil macro-aggregates, thereby enhancing soil C sequestration.
The stability of soil aggregates, an important indicator of the structural quality of the soil [26], serves as a key feature that provides information about the functional capacity of the soil. Aggregate stability is the consequence of complex interactions among multiple factors, including soil physiochemical and biological processes [27,28], abiotic (texture, clay minerals, sesquioxides, and exchangeable cations), biotic (organic matter content, plant root activities, soil fauna, and microorganisms), and environmental factors (soil temperature, wetting, drying, freezing, and thawing) [29,30]. Aggregate stability influences the productivity of the soil because it directly or indirectly affects soil bulk density, porosity, hydraulic conductivity, and compactibility. Thus, an accurate determination of aggregate distribution and stability is of importance for evaluating and improving soil structure and quality.
Many studies on orchard herbage cultivation have focused on the effects of herbage on the microclimate, soil, and fruit yield and quality, while other studies have evaluated the orchard–herbage cropping systems and their interaction with soil properties. However, few studies have investigated the mechanisms responsible for the plant-soil interaction effect on the productivity of an orchard–herbage cropping system. Information is lacking regarding the response of herbage to soil aggregate stability in orchard cultivation and the feedback effect of the soil aggregate stability on herbage yield. Understanding the feedback mechanism will allow researchers to establish a theoretical base for further investigating the complex interactions between fruit trees and herbage components in orchard–herbage systems. The objectives of the present study were: (1) to determine the differences in soil water-stable aggregates under different patterns of herbage-tree intercropping, and (2) to assess the relationships between soil aggregate parameters and herbage yield using principal component analysis and correlation analysis, and to evaluate the short-term effects of aggregate stability on soil structure.
2. Materials and Methods
2.1. Study Area
The study was conducted in a jujube orchard at the Horticultural Experiment Station of Tarim University (40°54′23″ N, 81°30′13″ E, 1015 m), Alar, Xinjiang, China. The site is in the upper reaches of the Tarim River at the northwestern edge of the Taklamakan Desert. The area is rich in solar and thermal resources, with average annual solar radiation of 559.4–612.1 KJ/cm2, a sunshine duration of 2996 h/year, and a daily rate of 66%. The annual accumulated temperature 10 °C is more than 4000 °C, the frost-free period is 180–224 days, and the annual mean temperature is 10.8 °C. Average annual precipitation is 40.1–82.5 mm, while annual evaporation is 1976.6–2558.9 mm. Agriculture in the area mostly relies on irrigation with underground water, which has a water table below 3 m. The surface evaporation is strong with dry air and northeastern-oriented winds. The site has a typical continental arid desert climate. The soil type at the experimental site is sandy loam.
2.2. Experimental Design
The experiment was conducted between 2013 and 2020, and the data related to soil aggregate and herbage yield were collected in 2020. The Jujube plantation was planted in the spring of 2013 with a row spacing of 1 m × 3 m, and trees were grafted in the spring of 2014. The alfalfa variety ‘Xinjiangdaye’—a large-leaf alfalfa species—was planted between jujube trees in 2014. The following five cropping patterns were used as the layout of the treatments in the experiment: (i)–(iii) the distance between alfalfa and jujube trees was 0.5 m (IP0.5m), 1.0 m (IP1m), and 1.45 m (IP1.45m), with seven, four, and two rows of alfalfa, respectively; (iv) alfalfa sole cropping (CKAL), and (v) jujube sole cropping (CKJU). The row spacing of alfalfa was 30 cm, and the seeding rate was 22.5 kg/ha (thousand-grain weight of 2.42 g). Each treatment was repeated three times (Figure 1), for a total of 15 plots. The area of each plot was 30 m2 (10 m long and 3 m wide). Jujube trees were planted using artificial drilling to a depth of 1–2 cm, whereas the intercropped alfalfa was grown for three years in all treatments. The management practices (irrigation, fertilization, etc.) of the crops were consistent during the study period for all the treatments. Starting from 1 March each year, weeds within 0.5 m of the base of the jujube trees were hand removed every 30 days and buried in the surface soil. Irrigation was provided nine times during the season with 30 mm each time, and the last irrigation (100 mm) was provided in early October before soil froze.
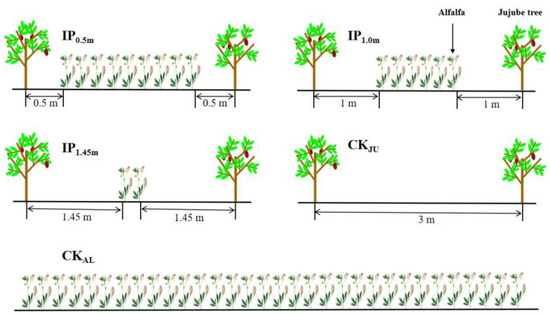
Figure 1.
Intercropping patterns with different distances.
2.3. Sample Collection
Soils were sampled using a 40-mm diameter soil auger from the different treatments on 15 May, 30 July, 15 August, and 30 October in 2020. In each plot, one soil sample was taken from under the center between the two adjacent alfalfa, one was taken from the center between the alfalfa and jujube at depths of 0–20 cm and 20–40 cm, and then combined to form a single soil sample for each depth in each plot. Then, the samples of around 1.0 kg each were transported in hard plastic boxes from the field to the laboratory to preserve the original physical structure of the soil. The samples were manually separated along the natural fracture cracks, and the visible stones, debris, and roots were removed with tweezers, and then passed through an 8 mm sieve to measure the aggregate stability. The sieved soil was divided into equal portions for the determination of mechanical aggregates and water-stable aggregates, and it was then air-dried and stored at room temperature.
2.4. Aggregates Analysis
The mechanically stable aggregates were measured using the dry sieving technique [31]. An amount of 100 g of air-dried soil aggregates were separated by placing them on a sequence of sieves with 2, 1, and 0.25 mm mesh openings (Figure 2). Each sieve was manually shaken at a rate of 30 times per minute (with a 5 cm amplitude) for 2 min. The various size fractions of soil aggregates were gently removed from the sieves, collected, and weighed. The soil water-stable aggregates were measured using the wet sieving technique [32]. Three sieves were used for the aggregate size distribution (2, 1, and 0.25 mm). An amount of 100 g of each soil sample was placed into a 2 mm sieve and submerged in distilled water for five minutes. After the slaking process, manual wet sieving was performed. The soil aggregates were oscillated in water at 50 cycles for 2 min and passed through progressively smaller sieves (i.e., 1 and 0.25 mm mesh sizes). After the oscillating process, the remaining soil aggregates on each mesh screen were washed from the sieves into aluminum pans, oven-dried at 50 °C for 24 h, and weighed. The aggregate stability was expressed as the mean weight diameter (MWD) (Equation (1)) comprising the sum of the mass fraction remaining in each sieve multiplied by the mean aperture of the adjacent mesh:
where wi is the proportion of the sample with a mean size of xi mm [33].
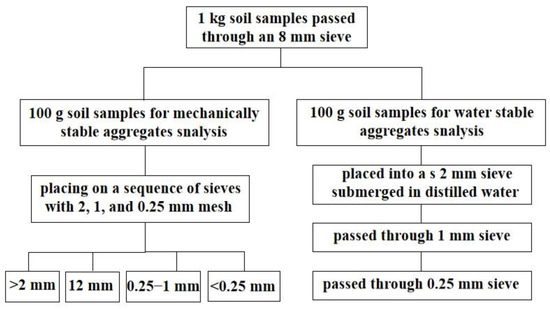
Figure 2.
Schematic to a flow chart of the processing of the samples.
The formula for calculating the soil aggregates destruction rate (SAD) was calculated as seen in Equation (2):
where SAD is the percentage of aggregates destruction (%), Md and Mw represent the aggregate mass fractions of dry sieve and wet sieve with >0.25 mm particle sizes, respectively.
2.5. Dry Matter Yield (DMY) of Alfalfa
The DMY of alfalfa was measured by taking a 1 m2 sample from each plot at the early flowering stage (10% blooming) and cutting two times a year. The specific harvesting dates were 30 July and 30 October. All 1 m2 samples of alfalfa in each plot were cut with scissors (5 cm stubble). Subsamples of 400 g fresh alfalfa were first oven-dried at 105 °C for 30 min and then at 70 °C to a constant mass and reweighed to calculate DMY (kg ha−1).
2.6. Statistical Analysis
All data were analyzed by one-way analysis of variance to detect differences in the soil aggregate sizes and the effects of intercropping patterns. Significant differences were accepted at p < 0.05. If a significant difference was detected, the least significant difference test was used to conduct multiple comparisons. All statistical analyses were performed using SPSS version 20.0 (SPSS Inc., Chicago, IL, USA). The relationships between the alfalfa yield and soil aggregate properties were determined using principal component analysis (PCA) and using redundancy analysis.
3. Results
3.1. Aggregate Size Distribution
3.1.1. Soil Mechanically Stable Aggregates
The concentrations of soil mechanically stable aggregates (SMSA) > 0.25 mm measured at the first full-bloom stage followed the order of IP1m > IP1.45m > IP0.5m > CKAL > CKJU. The best distribution of SMSA was obtained for IP1m. In addition, the SMSA was lower under IP0.5m, IP1m, IP1.45m, and CKAL than that under CKJU (Figure 3). The SMSA, averaged over different treatments, was low in the surface soil and then increased with the soil depth. The greatest improvement in SMSA in the surface soil occurred under CKAL. Aggregates < 0.25 mm in size dominated all soil layers under CKJU. The SMSA under IP0.5m was higher in the 20–40 cm soil layer than in the 0–20 cm soil layer, and the SMSA of the 1–2 mm aggregates was highest under IP1m at 12.61%.
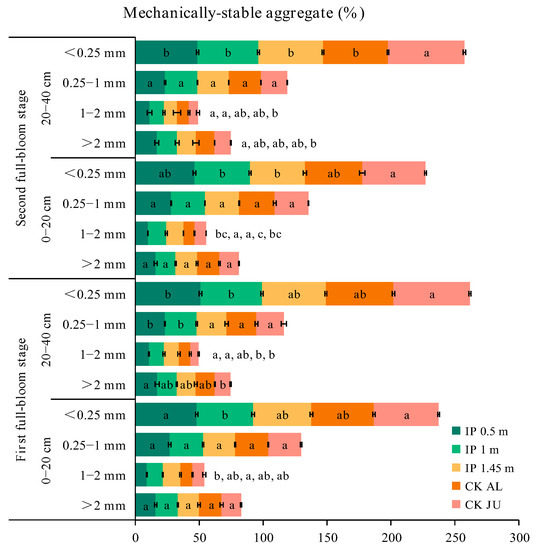
Figure 3.
Distributions of soil mechanically stable aggregates (SMSA) for soil samples taken at the two depths during the first and second full-bloom stages. The letters for each bar segment denote the significant differences between the treatments at a given size of the aggregate.
Compared with the first full-bloom stage, the SMSA increased in the second full-bloom stage, although the concentration slightly decreased under CKJU. Thus, compared with CKJU, CKAL had a lower SMSA value. Overall SMSA decreased from the first blooming stage for all treatments, but the concentrations of 1–2 mm and 0.25–1 mm aggregates increased to varying degrees under IP0.5m, IP1m, IP1.45m, and CKAL in the two soil layers. The average increases in 1–2 mm aggregates under IP0.5m, IP1m, IP1.45m, and CKAL were 6.5%, 6%, −2.2%, and 1.5%, respectively. The average increases in 0.25–1 mm aggregates under IP0.5m, IP1m, IP1.45m, and CKAL were 3.1%, 1.8%, 4.7%, and 6.6%, respectively. The average increase in 1–2 mm aggregates was highest under IP0.5m. The highest increase in 0.25–1 mm aggregates occurred under CKAL. The concentration of 1–2 mm aggregates decreased in IP1.45m, whereas the concentrations of 0.25–1 mm aggregates increased under the other treatments. Therefore, the conservation effect of alfalfa mulching on 0.25–1 mm SMSA was relatively stable and reliable.
3.1.2. Soil Water-Stable Aggregates
In the first full-bloom stage, the concentrations of soil water-stable aggregates > 0.25 mm (SWSA) followed the order of: IP0.5m > IP1m > CKAL > IP1.45m > CKJU. The best distribution of SWSA was obtained under IP0.5m. In particular, the SWSA > 2 mm, 1–2 mm, and 0.25–1 mm were higher under IP0.5m, IP1m, IP1.45m, and CKAL compared with CKJU (Figure 4). In addition, the SWSA > 0.25 mm was significantly higher than that under CKJU. Thus, the herbage treatments significantly improved the distribution of soil water-stable aggregates. The SWSA > 0.25 mm decreased as the soil depth increased, whereas the SWSA < 0.25 mm increased. In each soil layer, the SWSA > 2 mm, 1–2 mm, and 0.25–1 mm were significantly higher under the herbage treatments than CKJU.
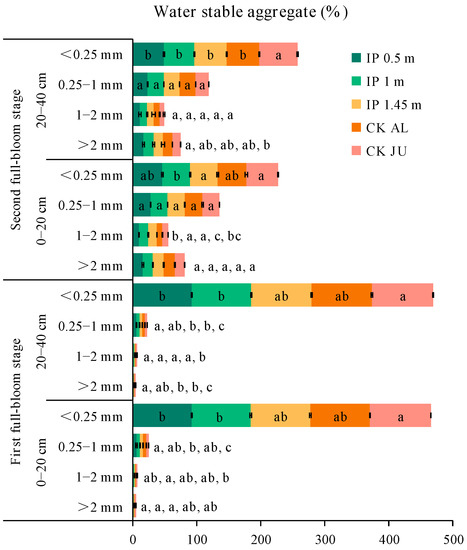
Figure 4.
Distributions of soil water-stable aggregates (SWSA) for soil samples taken at the two depths during the first and second full-bloom stages. The letters for each bar segment denote the significant differences between the treatments at a given size of the aggregate.
Compared with the first full-bloom stage, the SWSA > 0.25 mm increased in the second full-bloom stage, where the average increases under IP0.5m, IP1m, IP1.45m, and CKAL were 2.8%, 5.9%, 5.1%, and 5.6%, respectively, but the SWSA > 0.25 mm under CKJU decreased by 1%. The herbage treatments effectively maintained or even increased the SWSA in the first and second full-bloom stages, whereas they were more readily broken under CKJU. The ratios of the four water-stable aggregates relative to CKJU under the herbage treatments were about 1.41 for SWSA > 2 mm, 1.71 for 1–2 mm, 1.47 for 0.25–1 mm, and 0.98 for <0.25 mm. Thus, the herbage treatments most effectively increased the concentration of 1–2 mm soil water-stable aggregates, followed by 0.25–1 mm soil water-stable aggregates. The SWSA > 0.25 mm in the full-bloom stage followed the order of IP1m > IP0.5m > CKJU > IP1.45m > CKAL. The effects of IP0.5m and IP1m on increases in SWSA > 0.25 mm did not significantly differ. IP0.5m increased the SWSA > 2 mm (coarse aggregates) compared with IP1m. Therefore, IP0.5m was most effective in improving the SWSA, followed by IP1m.
3.2. MWD
3.2.1. MWD of Soil Mechanically Stable Aggregates
The MWD of the soil mechanically stable aggregates were higher under IP0.5m, IP1m, IP1.45m, and CKAL than CKJU (Figure 5). Compared with CKJU, the herbage treatments significantly increased the MWD values of the soil mechanically stable aggregates. The MWD under IP1.45m in the 0–20 cm and 40–60 cm soil layers were lower than those under CKAL, thereby indicating that the effect of CKAL on improving the MWD of the soil mechanically stable aggregates was slightly inferior to that of CKJU. The MWD of the soil mechanically stable aggregates followed the order of IP1m > IP0.5m > CKAL > IP1.45m > CKJU. Therefore, IP1m had the greatest effect on consolidating the soil’s mechanically stable aggregates.
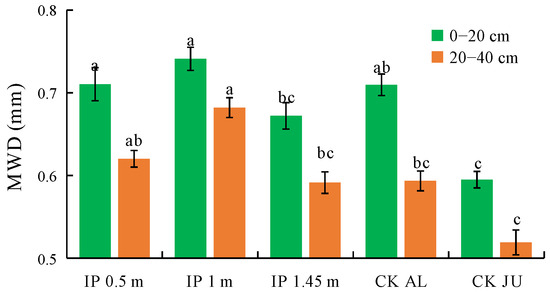
Figure 5.
Mean weight diameter (MWD) of soil mechanically stable aggregates. The letters on the bar denote the significant differences between the treatments across the two soil depths.
3.2.2. MWD of Soil Water-Stable Aggregates
The MWD of the soil water-stable aggregates were higher under IP0.5m, IP1m, IP1.45m, and CKAL than CKJU to varying degrees (Figure 6). The MWD was significantly higher under IP0.5m and IP1m than CKJU. Thus, the herbage treatment effectively improved the MWD values for the soil water-stable aggregates. The MWD values decreased under each treatment as the soil depth increased. The concentrations of water-stable macro-aggregates gradually decreased with soil depth, whereas the concentrations of micro-aggregates increased. The MWD values for water-stable aggregates followed the order of IP1m > IP0.5m > CKAL > IP1.45m > CKJU. Therefore, IP1m had the greatest effect on consolidating the soil water-stable aggregates.
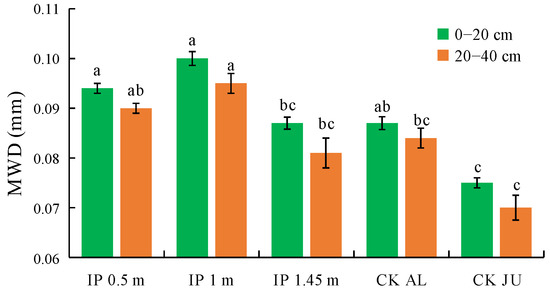
Figure 6.
Mean weight diameter (MWD) of soil water-stable aggregates. The letters on the bar denote the significant differences between the treatments across the two soil depths.
3.3. Proportions of Soil Aggregates
3.3.1. Proportion of Soil Macro-Aggregates > 0.25 mm
The concentrations of mechanically stable macro-aggregates > 0.25 mm accounted for about 50% of the total in all treatments (Figure 7). However, the concentrations of soil water-stable aggregates were very low and they only accounted for 4–8% of the total. In the first full-bloom stage, the highest concentration of mechanically stable macro-aggregates was obtained under IP1m, and it was significantly higher than those under CKAL and CKJU. The second highest was obtained under IP1.45m, but IP0.5m only slightly increased the concentration of mechanically stable macro-aggregates. The lowest concentration was obtained under CKJU. In the second full-bloom stage, the concentrations of mechanically stable macro-aggregates increased to varying degrees under the four herbage treatments, whereas there was no obvious change under CKJU.
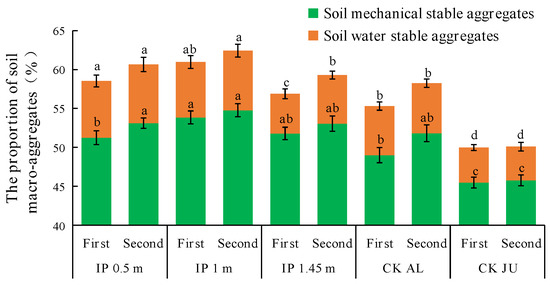
Figure 7.
Distribution of soil macro-aggregates > 0.25 mm. The first and second in the abscissa are the abbreviation of the first full-bloom stage and the second full-bloom stage, respectively.
The concentrations of water-stable macro-aggregates significantly differed among the treatments. In the first full-bloom stage, the concentration of water-stable macro-aggregates was highest under IP0.5m, followed by IP1m, and these concentrations were significantly higher than those under IP1.45m, CKAL, and CKJU. In the second full-bloom stage, the concentration of water-stable macro-aggregates was 22.6% higher under IP1.45m than that in the first full-bloom stage. Thus, the effects of IP0.5m and IP1m on increasing the concentrations of water-stable macro-aggregates did not significantly differ. The concentrations of mechanically stable macro-aggregates under different treatments followed the order of IP1m > IP1.45m > IP0.5m > CKAL > CKJU. The concentrations of water-stable macro-aggregates followed the order of: IP0.5m > IP1m > CKAL > IP1.45m > CKJU. Therefore, the concentrations of mechanically stable and water-stable macro-aggregates were highest under IP1m and IP0.5m, and lowest under CKJU. The concentrations were significantly higher under the four herbage treatments than CKJU. Thus, CKJU did not effectively increase the soil macro-aggregate concentrations. Among the herbage treatments, the soil macro-aggregate concentrations were low under IP1.45m and CKAL, and these treatments had a low capacity to improve the soil aggregate contents, whereas IP0.5m and IP1m were the most effective with more suitable intercropping spacing configurations.
3.3.2. Soil Aggregate Destruction Rate (SAD)
SAD is one of the key indexes used to evaluate the stability of soil aggregates and the overall soil structure. The soil structure is more stable when the SAD values are smaller. In the 0–20 cm soil layer, the SAD values significantly differed between the herbage treatments and CKJU, where they were significantly lower under IP0.5m, IP1m, IP1.45m, and CKAL than CKJU (Figure 8). The SAD value was lowest under IP0.5m and significantly lower than that under IP1.45m, followed by IP1m. The SAD value was highest under IP1.45m among the herbage treatments. The differences in the SAD values between the herbage treatments and CKJU gradually narrowed as the soil depth increased. The SAD values did not significantly differ in the 20–40 cm soil layer under IP1.45m, CKJU, and CKAL. The SAD value was lowest under IP0.5m, followed by IP1m. Thus, IP0.5m and IP1m effectively enhanced the stability of the soil structure.
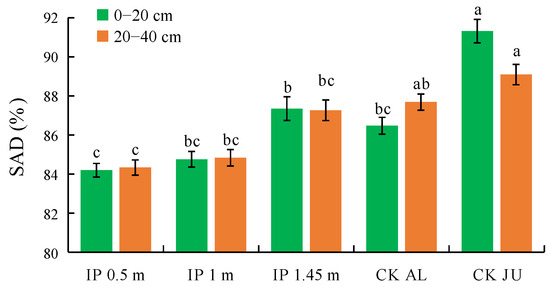
Figure 8.
Distribution of soil aggregate destruction rate (SAD).
3.4. Dry Matter Yield of Alfalfa
The dry matter yield of alfalfa was significantly higher under CKAL than the other treatments (Figure 9). The second highest yield was obtained under IP1m and it was significantly higher than those under IP0.5m and IP1.45m. The dry matter yields under each treatment were significantly higher than that under IP1.45m. Thus, the intercropping configuration was not effective under IP1.45m and the alfalfa yield increase was significantly lower than those under other treatments. The dry matter yields in the second full-bloom stage decreased to different degrees compared with those in the first full-bloom stage. The yield was significantly higher under IP0.5m than the other treatments and was still the lowest treatment under IP1.45m. IP0.5m was most effective at increasing the dry matter yield, followed by IP1m. The yield in the first full-bloom stage was much higher under IP0.5m than the other herbage treatments. In the second full-bloom stage, the highest decrease in the yield occurred under IP0.5m, and thus the increase in yield was most unstable under this treatment. In the first full-bloom stage, the lowest yield occurred at IP1m compared with the other herbage treatments. In the second full-bloom stage, the decrease in the yield was lowest under IP1m, and thus the increase was most stable. The total annual yields under all treatments followed the order of CKAL > IP1m > IP0.5m > IP1.45m. Thus, CKAL was most effective at increasing the alfalfa yield.
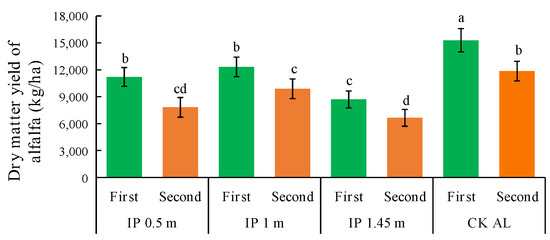
Figure 9.
Dry matter yields of alfalfa under different treatments. The first and second in the abscissa are the abbreviation of the first full-bloom stage and the second full-bloom stage, respectively.
3.5. Relationships between Soil Aggregate Parameters and Dry Matter Yield
The two main principal components (PC) 1 and 2 were selected with an explanation of 82.7% and 7.4%, respectively (Figure 10). SWSA > 0.25 mm has the largest load coefficient in PC1 and the highest contribution to PC1, followed by SMSA > 0.25 mm. The contribution of MWD-M to PC2 was the largest, and SAD was the smallest. PCA also reflected the relationship between the spacing treatment and each principal component. The distribution of IP1.45m treatment and CKAL treatments was almost the same, indicating that the difference between the two treatments is very small. IP0.5m and IP1m treatments were positively correlated with PC1, indicating that IP0.5m and IP1m treatments had a positive effect on PC1. CKJU treatment had a negative effect on PC1 and a positive contribution on PC2. It suggested that PC1 was greatly affected by IP0.5m and IP1m treatments, and PC2 was most affected by CKAL treatment. The correlation analysis revealed that alfalfa yield was strongly positively correlated with SWSA > 0.25 mm, SMSA > 0.25 mm, MWD-M, and MWD-W (Figure 11). This indicates that changes in alfalfa yield were mainly driven by soil aggregates. In the alfalfa-jujube tree intercropping system, spacing configurations have a significant effect on alfalfa yield by changing the soil aggregate distribution and proportion, especially changing soil macro-aggregates.
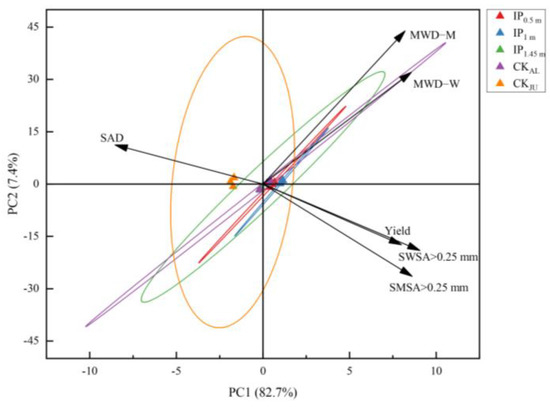
Figure 10.
Principal component analysis of soil aggregate parameters and alfalfa yield in alfalfa-jujube tree intercropping systems. Mean weight diameter of soil mechanically stable aggregates (MWD-M); mean weight diameter of soil water-stable aggregates (MWD-W); soil aggregate destruction rate (SAD); mechanically stable soil macro-aggregates (SWSA > 0.25 mm); water-stable soil macro-aggregates (SMSA > 0.25 mm).
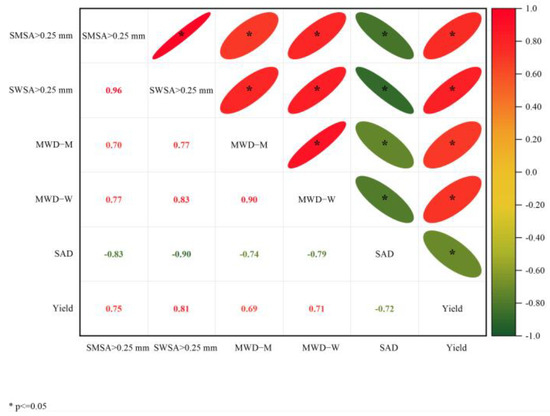
Figure 11.
Correlation analysis between soil aggregate parameters and alfalfa yield in alfalfa-jujube tree intercropping systems. MWD of soil mechanically stable aggregates (MWD-M); MWD of soil water-stable aggregates (MWD-W); soil aggregate destruction rate (SAD); mechanically stable soil macro-aggregates (SWSA > 0.25 mm); water-stable soil macro-aggregates (SMSA > 0.25 mm).
4. Discussion
The soil structure and distribution of soil aggregate sizes are important for soil erosion resistance, soil fertility, and crop yields [30,34]. In general, a higher proportion of soil aggregates >0.25 mm is more conducive to the formation of a desirable soil aggregate structure [35,36]. Therefore, the concentration of macro-aggregates is proportional to the stability of the soil structure [37]. In the present study, the distributions of soil mechanically stable and water-stable macro-aggregates were better under the four herbage-alfalfa intercroppings than under CKJU. The concentrations of soil mechanically stable aggregates > 0.25 mm initially generally decreased and then increased as the soil depth increased under all treatments. The deep soil is less disturbed by farming operations and human activities, and is thus conducive to the formation of soil mechanically stable macro-aggregates [38,39]. In the first full-bloom stage for alfalfa, the concentrations of soil mechanically stable macro-aggregates were higher under the herbage treatments than that under CKJU, but there were no significant differences between the different herbage intercropping spacings. However, the concentration of 1–2 mm soil mechanically stable macro-aggregates was significantly greater under IP1m than IP0.5m in the second full-bloom stage. These results indicate that alfalfa intercropping with jujube could significantly increase the soil mechanical stability of macro-aggregates under an appropriate spacing between fruit trees and alfalfa plants.
Compared with soil mechanically stable aggregates, soil water-stable aggregates are more closely associated with the mechanisms responsible for nutrient transformation in soil [40]. The stability of soil structure, cementation, and accumulation of soil nutrients are more dependent on water-stable aggregates. In this study, the concentration of soil water-stable aggregates > 0.25 mm decreased as the soil depth increased, whereas the concentration of soil water-stable aggregates < 0.25 mm increased; these observations were in agreement with previous findings that water-stable aggregates were mainly concentrated in the surface of the 0–40 cm soil layer [41,42]. In the two full-bloom stages, the concentration of soil water-stable macro-aggregates was highest under IP1m. The alfalfa roots were densest at the spacing distance under IP1m, and thus they facilitated the cementation of organic matter and minerals. In addition, the micro-aggregates were transformed into macro-aggregates due to microbial activities [43,44]. The MWD of soil aggregates can directly reflect the distribution of different aggregate sizes. We found that the MWD values increased as the concentration of macro-aggregates increased. A larger MWD indicates a higher soil aggregate size and greater aggregate stability [44,45]. The MWD values for water-stable aggregates were higher under IP1m than under IP0.5m. In addition, the concentration of 1–2 mm water-stable aggregates was lower under IP0.5m than under IP1m. The distance from jujube trees was larger under IP1m, and thus the intensity of the competition for nutrients between alfalfa and jujube trees was reduced compared with those under IP0.5m.
The soil structure is more stable when the rate of damage to soil aggregates is lower, which is more conducive to the growth and development of herbage and fruit trees [46,47]. In the present study, compared with jujube monoculture, herbage treatment effectively reduced SAD, and the improvement was more obvious in the 0–20 cm soil layer. Alfalfa mulch significantly reduced the rate of aggregate destruction in the surface soil. The variation in the soil aggregate destruction rate was similar to that in the water-stable large aggregate content. Water-stable aggregates strongly influence the destruction rate of aggregates [48,49]. The aggregate destruction rates in different soil layers were significantly lower under IP1m than under CKJU, and the average was lower than those under the other treatments, indicating that IP0.5m and IP1m were most effective in reducing the aggregate destruction rate in the orchard soil, followed by IP0.5m. The failure rate of soil aggregates was high at our test site due to the large differences in the mechanically stable >0.25 mm aggregate contents and the water-stable > 0.25 mm aggregate contents, possibly because of the sandy loam soil that was greatly affected by arid desert environments [50,51]. We found that the water-stable aggregates were mainly concentrated in <0.25 mm aggregates and the >0.25 mm aggregate content was low, which explained the poor structural stability of the local soil [52,53].
The dry matter yield of alfalfa yield was lower in the second full-bloom stage than in the first full-bloom stage, possibly because of the low soil water content in the latter stage and a decrease in the total phosphorus content of soil aggregates [54,55]. Among the different intercropping treatments, the dry herbage yield was highest under IP1m and it was significantly higher than those under the other treatments. The alfalfa yield was lowest under IP1.45m because the yield decreased as the row spacing increased. However, a smaller spacing between alfalfa plants was not better because the density was excessively high under IP0.5m, leading to strong competition for nutrients between alfalfa and jujube trees, with a reduced alfalfa yield as a consequence. Both IP0.5m and IP1m significantly enhanced the soil structure, mechanical properties, and water-stable aggregate contents, as well as increased the nutrient content in soil aggregates with different grain sizes. The dry matter alfalfa yield was highest under CKAL, but IP1m achieved a good balance between improving the soil fertility and increasing the alfalfa yield.
5. Conclusions
Herbage alfalfa intercropping with jujube trees effectively improved soil aggregate structure compared with alfalfa monoculture, and the magnitude of the effect was dependent on the spacing configuration or the distances between neighboring jujubes within a row. The spacing between alfalfa and jujube at one meter apart (i.e., IP1m) significantly increased the concentration of macro-aggregates > 0.25 mm, soil mechanical properties, and water stability, while decreasing the concentration of micro-aggregates < 0.25 mm, compared to the other spacing treatments evaluated. The improvement in the aggregates and the stability with the one-meter spacing configuration boosted dry matter alfalfa yield and achieved a balance between optimizing soil structure and maintaining crop yields. Therefore, the one-meter spacing of jujube-to-alfalfa within a row is considered the most suitable configuration for alfalfa–jujube intercropping systems.
Author Contributions
Conceptualization, G.C. and S.W.; methodology, Y.Z.; formal analysis, G.C., Z.F. and W.F.; investigation, G.C., S.W., Y.Z. and W.F.; data curation, G.C., W.Y. and W.F.; writing—original draft preparation, G.C., X.Z. and W.F.; writing—review and editing, G.C. and W.F.; visualization, W.Y.; project administration, S.W.; funding acquisition, S.W. All authors have read and agreed to the published version of the manuscript.
Funding
This research was funded by National Natural Science Foundation of China, grant number 32060449, National Key R&D Program of China, grant number 2016YFC0501400, and Regional Innovation Guidance Project of Xinjiang Production and Construction Corps, grant number 2021BB012.
Institutional Review Board Statement
Not applicable.
Informed Consent Statement
Not applicable.
Data Availability Statement
The entire set of raw data presented in this study is available upon request from the corresponding author.
Conflicts of Interest
The authors declare no conflict of interest.
Abbreviations
SMSA: soil mechanically stable aggregates; SWSA: soil water-stable aggregates; MWD: mean weight diameter; SAD: Soil aggregate destruction rate.
References
- Chai, Q.; Nemecek, T.; Liang, C.; Zhao, C.; Yu, A.; Coulter, J.A.; Wang, Y.; Hu, F.; Wang, L.; Siddique, K.H. Integrated farming with intercropping increases food production while reducing environmental footprint. Proc. Natl. Acad. Sci. USA 2021, 118, e2106382118. [Google Scholar] [CrossRef] [PubMed]
- Chen, G.; Kong, X.; Gan, Y.; Zhang, R.; Feng, F.; Yu, A.; Zhao, C.; Wan, S.; Chai, Q. Enhancing the systems productivity and water use efficiency through coordinated soil water sharing and compensation in strip-intercropping. Sci. Rep. 2018, 8, 10494. [Google Scholar] [CrossRef] [PubMed]
- Seeno, E.; Naumann, H.; Ates, S. Production and chemical composition of pasture forbs with high bioactive compounds in a low input production system in the Pacific Northwest. Anim. Feed. Sci. Technol. 2022, 289, 115324. [Google Scholar] [CrossRef]
- Kalanzi, F.; Isubikalu, P.; Kyazze, F.B.; Orikiriza, L.J.B.; Okia, C.; Kiyingi, I. Dissemination paradox: How contextual realities influence smallholder farmers’ modifications of agroforestry technologies in Uganda’s Mt. Elgon region. J. Mt. Sci. 2022, 19, 1404–1418. [Google Scholar] [CrossRef]
- Zhu, L.; He, J.; Tian, Y.; Li, X.; Li, Y.; Wang, F.; Qin, K.; Wang, J. Intercropping wolfberry with gramineae plants improves productivity and soil quality. Sci. Hortic. 2022, 292, 110632. [Google Scholar] [CrossRef]
- Shomar, B.; El-Madhoun, F.; Yahya, A. Wastewater reuse for alfalfa production in the Gaza Strip. Water Air Soil Pollut. 2010, 213, 105–119. [Google Scholar] [CrossRef]
- Willey R, W. Intercropping-its importance and research needs. Part II. Agronomy and research approaches. Field Crop Abstr. 1979, 32, 73–85. [Google Scholar]
- Huang, G.-B. Development of light utilization theory for wheat/corn intercropping in condition of intensive cultivation. Acta Agron. Sin. 1999, 25, 16–24. [Google Scholar]
- Xie, J.; Peng, B.; Wang, R.; Batbayar, J.; Hoogmoed, M.; Yang, Y.; Zhang, S.; Yang, X.; Sun, B. Responses of crop productivity and physical protection of organic carbon by macroaggregates to long-term fertilization of an Anthrosol. Eur. J. Soil Sci. 2018, 69, 555–567. [Google Scholar] [CrossRef]
- Barber, S.A. The influence of alfalfa, bromegrass, and corn on soil aggregation and crop yield. Soil Sci. Soc. Am. J. 1959, 23, 258–259. [Google Scholar] [CrossRef]
- Huang, X.; Jia, Z.; Guo, J.; Li, T.; Sun, D.; Meng, H.; Yu, G.; He, X.; Ran, W.; Zhang, S. Ten-year long-term organic fertilization enhances carbon sequestration and calcium-mediated stabilization of aggregate-associated organic carbon in a reclaimed Cambisol. Geoderma 2019, 355, 113880. [Google Scholar] [CrossRef]
- Raiesi, F. Soil properties and C dynamics in abandoned and cultivated farmlands in a semi-arid ecosystem. Plant Soil 2012, 351, 161–175. [Google Scholar] [CrossRef]
- Lobe, I.; Sandhage-Hofmann, A.; Brodowski, S.; Du Preez, C.C.; Amelung, W. Aggregate dynamics and associated soil organic matter contents as influenced by prolonged arable cropping in the South African Highveld. Geoderma 2011, 162, 251–259. [Google Scholar] [CrossRef]
- Jha, P.; De, A.; Lakaria, B.L.; Biswas, A.; Singh, M.; Reddy, K.; Rao, A. Soil carbon pools, mineralization and fluxes associated with land use change in Vertisols of Central India. Natl. Acad. Sci. Lett. 2012, 35, 475–483. [Google Scholar] [CrossRef]
- Six, J.; Bossuyt, H.; Degryze, S.; Denef, K. A history of research on the link between (micro) aggregates, soil biota, and soil organic matter dynamics. Soil Tillage Res. 2004, 79, 7–31. [Google Scholar] [CrossRef]
- Elliott, E. Aggregate structure and carbon, nitrogen, and phosphorus in native and cultivated soils. Soil Sci. Soc. Am. J. 1986, 50, 627–633. [Google Scholar] [CrossRef]
- Niewczas, J.; Witkowska-Walczak, B. Index of soil aggregates stability as linear function value of transition matrix elements. Soil Tillage Res. 2003, 70, 121–130. [Google Scholar] [CrossRef]
- Tisdall, J.M.; Oades, J.M. Organic matter and water-stable aggregates in soils. J. Soil Sci. 1982, 33, 141–163. [Google Scholar] [CrossRef]
- Nichols, K.; Toro, M. A whole soil stability index (WSSI) for evaluating soil aggregation. Soil Tillage Res. 2011, 111, 99–104. [Google Scholar] [CrossRef]
- Lado, M.; Paz, A.; Ben-Hur, M. Organic matter and aggregate size interactions in infiltration, seal formation, and soil loss. Soil Sci. Soc. Am. J. 2004, 68, 935–942. [Google Scholar] [CrossRef]
- Shi, Z.-H.; Yan, F.-L.; Li, L.; Li, Z.-X.; Cai, C.-F. Interrill erosion from disturbed and undisturbed samples in relation to topsoil aggregate stability in red soils from subtropical China. Catena 2010, 81, 240–248. [Google Scholar] [CrossRef]
- Bronick, C.J.; Lal, R. Soil structure and management: A review. Geoderma 2005, 124, 3–22. [Google Scholar] [CrossRef]
- Liang, A.; McLaughlin, N.B.; Zhang, X.; Shen, Y.; Shi, X.; Fan, R. Short-term effects of tillage practices on soil aggregate fractions in a Chinese Mollisol. Acta Agric. Scand. Sect. B-Soil Plant Sci. 2011, 61, 535–542. [Google Scholar] [CrossRef]
- Kemper, W.; Rosenau, R. Aggregate stability and size distribution. Methods Soil Anal. Part 1 Phys. Mineral. Methods 1986, 5, 425–442. [Google Scholar]
- Bayhan, A.K.; Ali Isildar, A.; Akgül, M. Tillage impacts on aggregate stability and crop productivity in a loam soil of a dryland in Turkey. Acta Agric. Scand. Sect. B-Soil Plant 2005, 55, 214–220. [Google Scholar] [CrossRef]
- Six, J.; Elliott, E.; Paustian, K. Soil structure and soil organic matter II. A normalized stability index and the effect of mineralogy. Soil Sci. Soc. Am. J. 2000, 64, 1042–1049. [Google Scholar] [CrossRef]
- Dıaz-Zorita, M.; Villegas, E.I.G.; Grove, A.J.; Perfect, E. Aggregation, fragmentation, and structural stability measurement. Encycl. Soil Sci. 2002, 1, 37–40. [Google Scholar]
- Márquez, C.; Garcia, V.; Cambardella, C.A.; Schultz, R.C.; Isenhart, T.M. Aggregate-size stability distribution and soil stability. Soil Sci. Soc. Am. J. 2004, 68, 725–735. [Google Scholar] [CrossRef]
- Chen, Ζ.; Pawluk, S.; Juma, N. Impact of variations in granular structures on carbon sequestration in two Alberta Mollisols. In Soil Processes and the Carbon Cycle; CRC Press: Boca Raton, FL, USA, 2018; pp. 225–243. [Google Scholar]
- Barthes, B.; Roose, E. Aggregate stability as an indicator of soil susceptibility to runoff and erosion; validation at several levels. Catena 2002, 47, 133–149. [Google Scholar] [CrossRef]
- Le Bissonnais, Y.L. Aggregate stability and assessment of soil crustability and erodibility: I. Theory and methodology. Eur. J. Soil Sci. 1996, 47, 425–437. [Google Scholar] [CrossRef]
- Yang, X.-M.; Wander, M.M. Temporal changes in dry aggregate size and stability: Tillage and crop effects on a silty loam Mollisol in Illinois. Soil Tillage Res. 1998, 49, 173–183. [Google Scholar] [CrossRef]
- Van Bavel, C. Mean weight-diameter of soil aggregates as a statistical index of aggregation. Proc. Soil Sci. Soc. Am. 1949 1950, 14, 20–23. [Google Scholar] [CrossRef]
- De Baets, S.; Poesen, J.; Meersmans, J.; Serlet, L. Cover crops and their erosion-reducing effects during concentrated flow erosion. Catena 2011, 85, 237–244. [Google Scholar] [CrossRef]
- Karami, A.; Homaee, M.; Afzalinia, S.; Ruhipour, H.; Basirat, S. Organic resource management: Impacts on soil aggregate stability and other soil physico-chemical properties. Agric. Ecosyst. Environ. 2012, 148, 22–28. [Google Scholar] [CrossRef]
- Zhang, Y.; Li, X.; Gregorich, E.G.; McLaughlin, N.B.; Zhang, X.; Guo, Y.; Liang, A.; Fan, R.; Sun, B. No-tillage with continuous maize cropping enhances soil aggregation and organic carbon storage in Northeast China. Geoderma 2018, 330, 204–211. [Google Scholar] [CrossRef]
- Martens, D.A. Management and crop residue influence soil aggregate stability. J. Environ. Qual. 2000, 29, 723–727. [Google Scholar] [CrossRef]
- Cerdà, A. Soil aggregate stability under different Mediterranean vegetation types. Catena 1998, 32, 73–86. [Google Scholar] [CrossRef]
- Abiven, S.; Menasseri, S.; Chenu, C. The effects of organic inputs over time on soil aggregate stability–A literature analysis. Soil Biol. Biochem. 2009, 41, 1–12. [Google Scholar] [CrossRef]
- Puget, P.; Chenu, C.; Balesdent, J. Dynamics of soil organic matter associated with particle-size fractions of water-stable aggregates. Eur. J. Soil Sci. 2000, 51, 595–605. [Google Scholar] [CrossRef]
- Beare, M.; Hendrix, P.; Coleman, D. Water-stable aggregates and organic matter fractions in conventional-and no-tillage soils. Soil Sci. Soc. Am. J. 1994, 58, 777–786. [Google Scholar] [CrossRef]
- Franzluebbers, A.; Arshad, M. Soil microbial biomass and mineralizable carbon of water-stable aggregates. Soil Sci. Soc. Am. J. 1997, 61, 1090–1097. [Google Scholar] [CrossRef]
- Šimanský, V.; Tobiašová, E.; Chlpík, J. Soil tillage and fertilization of Orthic Luvisol and their influence on chemical properties, soil structure stability and carbon distribution in water-stable macro-aggregates. Soil Tillage Res. 2008, 100, 125–132. [Google Scholar] [CrossRef]
- Kravchenko, A.N.; Negassa, W.C.; Guber, A.K.; Rivers, M.L. Protection of soil carbon within macro-aggregates depends on intra-aggregate pore characteristics. Sci. Rep. 2015, 5, 16261. [Google Scholar] [CrossRef] [PubMed]
- Long, P.; Gao, W.; Sui, P.; Yan, L.; Chen, Y. Effects of agricultural organic wastes incorporation on soil water-stable aggregates and C, N contents. J. China Agric. Univ. 2014, 19, 107–118. [Google Scholar]
- An, S.; Mentler, A.; Mayer, H.; Blum, W.E. Soil aggregation, aggregate stability, organic carbon and nitrogen in different soil aggregate fractions under forest and shrub vegetation on the Loess Plateau, China. Catena 2010, 81, 226–233. [Google Scholar] [CrossRef]
- Annabi, M.; Le Bissonnais, Y.; Le Villio-Poitrenaud, M.; Houot, S. Improvement of soil aggregate stability by repeated applications of organic amendments to a cultivated silty loam soil. Agric. Ecosyst. Environ. 2011, 144, 382–389. [Google Scholar] [CrossRef]
- Ramos, M.E.; Benítez, E.; García, P.A.; Robles, A.B. Cover crops under different managements vs. frequent tillage in almond orchards in semiarid conditions: Effects on soil quality. Appl. Soil Ecol. 2010, 44, 6–14. [Google Scholar] [CrossRef]
- Annabi, M.; Raclot, D.; Bahri, H.; Bailly, J.S.; Gomez, C.; Le Bissonnais, Y. Spatial variability of soil aggregate stability at the scale of an agricultural region in Tunisia. Catena 2017, 153, 157–167. [Google Scholar] [CrossRef]
- Pirmoradian, N.; Sepaskhah, A.; Hajabbasi, M. Application of fractal theory to quantify soil aggregate stability as influenced by tillage treatments. Biosyst. Eng. 2005, 90, 227–234. [Google Scholar] [CrossRef]
- Le Bissonnais, Y.; Prieto, I.; Roumet, C.; Nespoulous, J.; Metayer, J.; Huon, S.; Villatoro, M.; Stokes, A. Soil aggregate stability in Mediterranean and tropical agro-ecosystems: Effect of plant roots and soil characteristics. Plant Soil 2018, 424, 303–317. [Google Scholar] [CrossRef]
- Pohl, M.; Graf, F.; Buttler, A.; Rixen, C. The relationship between plant species richness and soil aggregate stability can depend on disturbance. Plant Soil 2012, 355, 87–102. [Google Scholar] [CrossRef]
- Guido, A.; Gerovasileiou, V.; Russo, F.; Rosso, A.; Sanfilippo, R.; Voultsiadou, E.; Mastandrea, A. Composition and biostratinomy of sponge-rich biogenic crusts in submarine caves (Aegean Sea, Eastern Mediterranean). Palaeogeogr. Palaeoclimatol. Palaeoecol. 2019, 534, 109338. [Google Scholar] [CrossRef]
- Albiach, R.; Canet, R.; Pomares, F.; Ingelmo, F. Organic matter components and aggregate stability after the application of different amendments to a horticultural soil. Bioresour. Technol. 2001, 76, 125–129. [Google Scholar] [CrossRef] [PubMed]
- Ma, N.; Zhang, L.; Zhang, Y.; Yang, L.; Yu, C.; Yin, G.; Doane, T.A.; Wu, Z.; Zhu, P.; Ma, X. Biochar improves soil aggregate stability and water availability in a mollisol after three years of field application. PLoS ONE 2016, 11, e0154091. [Google Scholar] [CrossRef] [PubMed]


Disclaimer/Publisher’s Note: The statements, opinions and data contained in all publications are solely those of the individual author(s) and contributor(s) and not of MDPI and/or the editor(s). MDPI and/or the editor(s) disclaim responsibility for any injury to people or property resulting from any ideas, methods, instructions or products referred to in the content. |
© 2023 by the authors. Licensee MDPI, Basel, Switzerland. This article is an open access article distributed under the terms and conditions of the Creative Commons Attribution (CC BY) license (https://creativecommons.org/licenses/by/4.0/).