Abstract
Applying nitrogen (N) fertilizer at irrational rates and basal topdressing ratios typically leads to high resource wastage and serious environmental pollution and is a global problem. A pot experiment was conducted between 2020 and 2021 to investigate the effects of different N application rates and basal topdressing ratios on the growth, yield, quality, and water- and N- use efficiencies of forage maize. Four N treatments were used, with the following levels: 0 kg/ha (N0), 70 kg/ha (N70), 140 kg/ha (N140), and 210 kg/ha (N210); and two basal topdressing ratios of N fertilizer were tested, namely: 2:8 and 4:6. An increased N application rate, from 0 to 200 kg/ha, increased whole fresh and dry yields. N fertilization increased the crude protein (CP) content of different plant parts (stems, leaves, and ears), as well as at the whole plant level, but decreased neutral and acid detergent fiber content. The dry matter water use efficiency (WUEDM) increased, while the partial-factor productivity of applied N decreased with an increasing N application rate. Compared with N0, the 2-year average dry matter yield under N70, N140, and N210 increased by 21.8%, 27.6%, and 38.2%, respectively, while WUEDM increased by 19.1%, 28.7%, and 45.0%, respectively. At the 2:8 basal topdressing ratio, the dry matter yield, CP content, and N recovery efficiency under all N application rates were higher at harvest compared to the 4:6 ratio during normal rainfall years, while dry matter yield and WUEDM were both lower compared to the 4:6 ratio during dry years. In conclusion, during a normal rainfall year, a N application rate of 210 kg/ha, with a basal topdressing ratio of 2:8 between the sowing and jointing stages, is considered the optimal N fertilizer application strategy to improve forage maize production in the semi-arid areas of the Chinese Loess Plateau.
1. Introduction
Forage maize (Zea mays L.) has a high energy content, is rich in protein, and has good ensiling characteristics, and is therefore commonly used as animal feed throughout the world [1]. Forage maize is commonly harvested before physiological maturity and therefore requires less water compared to other grains [2]. It also requires less labor and machinery input than other forage crops at harvest [3]. Therefore, forage maize cultivation has significantly increased in many parts of the world over the past few decades and has become a major component in dairy cow feed under most dietary regimes [1]. In the context of the ‘grain for forage’ program proposed in China, the vigorous production of forage maize has become important for guaranteeing a safe forage supply, as well as the high-quality development of the herbivorous livestock industry. Exploring effective measures to ensure the productivity and sustainability of cropping systems is thus urgent.
Nitrogen (N) is an important component of protein, nucleic acids, hormones, chlorophyll, and other important plant substances [4], which are all essential for plant life and profoundly affect the various physiological and biochemical processes of plant growth and development. N is therefore essential for crop growth and yield development [5], and its use is often considered essential for meeting food demands and for increasing grain yield [6]. However, farmers often misinterpret the relationship between crop yield and N fertilization and thus overestimate yield benefits. This results in excessive N fertilizer application in agricultural production [7]. About 10% of the world’s total amount of arable land is in China, but it consumes about 40% of the total amount of global N fertilizer, resulting in relatively low crop yield increases and the largest N loss [8]. In the semi-arid Loess Plateau region, organic matter and N sources are scarce due to excessive land reclamation and depletion of natural fertility, and supplementing N fertilizer is therefore important for improving crop yield. However, excessive N fertilizer application, as well as once-off applications, both lead to high levels of residual inorganic N in the soil and increased N loss during land reclamation, resulting in low N fertilizer utilization and a large wastage of resources.
N deficiency can cause slow crop growth and development, and early leaf senescence, which subsequently decreases crop productivity and quality [9]. Reasonable N application significantly promotes growth and photosynthetic product formation [4] by increasing crop chlorophyll content and photosynthetic rates and improves crop yield and quality, while simultaneously enhancing water use efficiency via an increased sensitivity to water stress [10]. Qiang et al. (2019) indicated that maize can achieve high crop yield and WUE with an N application rate of 172 kg/ha, indicating no significant difference with an N application rate of 258 kg/ha [11]. However, excessive N fertilizer application can exceed crop N requirements and inhibits crop root growth [12]. Thus, N can be reduced and N use efficiency (NUE) increased without compromising yield [13]. Additionally, research suggests that applying N as basal fertilizer, or only as topdressing, once off for high-yielding maize production causes an uncoordinated N supply due to the large N demand required by later growth stages (after silking) [14]. Guo et al. (2010) reported that the N application rate of 300 kg/ha with a low ratio (40%) of basal fertilization performs best in achieving high yield and high N efficiency [14]. A topdressing N application can ensure an adequate N supply in later growth stages and prolong the functional period of green leaves, thus increasing the accumulation of photosynthetic products and improving yield and N-use efficiency [15,16]. An appropriate increase in the topdressing N ratio can improve N transport efficiency in post-flowering nutrient organs and increase their protein content [17]. Meanwhile, increasing the topdressing ratio of N fertilizer promotes favorable crop water use efficiency; however, topdressing N beyond the optimal ratio leads to decreases [18].
Northwest China is an important area for crop and livestock animal husbandry production in China. However, the characteristics of infertile soils and water shortages in the region greatly limit forage resource production. Forage maize is widely planted in the region with its excellent quality and high yield. Many studies have pointed out the appropriate N fertilizer rates to maximize crop yield and nutritional quality for forage maize in specific areas. However, determining a reasonable amount of N fertilizer, as well as synchronizing crop N demand and soil N supply, is key to promoting efficient N resource use and forage maize production. Currently, few studies have addressed optimal N application rates and basal topdressing ratios for forage maize production in this area. Therefore, this study investigated the effects of different N rates and split N application ratios on agronomic parameters (plant height, stem diameter, fresh and dry matter yield, and forage quality), water consumption, and water- and N-use efficiency (dry matter water-use efficiency, N recovery efficiency, and partial-factor productivity of applied N) of forage maize. The aim was to provide theoretical support for optimal N application and management for forage maize production in the specific study region.
2. Materials and Methods
2.1. Experimental Site
A two-year experiment was conducted between 2020 and 2021 at the National Field Scientific Observation and Research Station of Grassland Agroecosystems in Qingyang, Gansu Province, China (35°39′ N, 107°51′ E; altitude: 1297 m above sea level). This site is a typical semi-arid agricultural area with a continental monsoon climate. The multi-year average precipitation and temperature in the area were 544.9 mm and 9.8 °C, respectively, between 1972 and 2021, while the humidity was 61.6% and wind speed was 2.2 m/s. Compared with the long-term averages, the precipitation in 2020 was more concentrated in August and the precipitation in 2021 was more concentrated in September and October, respectively. In 2020 and 2021, the monthly precipitation distribution during the forage maize growing period was 398.2 and 192.8 mm (Figure 1), respectively.
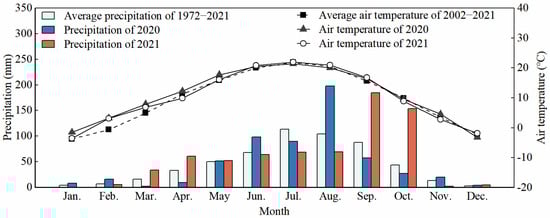
Figure 1.
Monthly average temperature and precipitation in 2020, 2021, and multi-year (1972–2021).
2.2. Experimental Design and Management
The experiment was conducted using cylindrical PPS pots with a diameter of 0.4 m and a height of 0.8 m (Figure 2). Soil moisture and temperature sensors (Acclima ACC-TDR-315H, Meridian, ID, USA) were installed at 10 cm, 30 cm, 50 cm, and 70 cm soil depths in the cylinders, and the sensors were connected to a data acquisition device to achieve dynamic soil temperature and moisture monitoring under the different treatments. The tested soil was collected from the cultivated layer (0–20 cm) of local agricultural fields. The local soil is Heilu, an entisol according to the classification of the Food and Agriculture Organization of the United Nations. The soil is a silty loam containing 70% silt, 23% clay, and 7% sand, and represents the typical cropping soil texture of this area well (see Table 1 for basic features of the tested soil). The soil was air-dried and passed through a 5 mm sieve, and then filled into the pots (leaving 10 cm free from the soil surface to the top of each pot) to achieve a bulk density of 1.25 g/cm3 and a final dry soil mass of about 109.9 kg per pot.
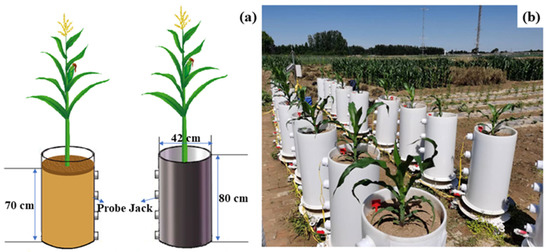
Figure 2.
Sketch (a) and photos (b) of the forage maize pot experiment.

Table 1.
Basic features of the soil used in the experiment.
The experiment was conducted between 2020 and 2021 in a randomized complete block design with two factors: N application rate and basal topdressing ratio. The N rates were: 0 kg/ha (N0), 70 kg/ha (N70), 140 kg/ha (N140), and 210 kg/ha (N210). The basal topdressing ratios were 2:8 (R1), and 4:6 (R2), indicating that 20%(R1)/40%(R2) of the N dose was applied on the sowing day as basal fertilizer and the remaining 80%(R1)/60%(R2) was topdressed at the jointing stage. A total of seven treatments were used since the basal topdressing ratio cannot be set for a zero N application rate (N0). Due to the limited number of PPS cylinder pots (22), four replicates were performed for N0 and three replicates for the remaining six treatments. In 2020, the maize seeds were sown at 3–4 cm on 10 May and harvested on 10 September. The pot experiment was conducted outdoors, and the maize can access natural rainfalls and other meteorological resources. In 2021, the maize seeds were sown on 29 April and harvested on 27 August. Due to a low level of precipitation in July and August 2021, each treatment was irrigated with a total of 95.5 mm during the reproductive period to ensure normal plant growth, and the irrigation time and amounts were strictly consistent for each treatment. Urea (N, 46%) was applied in two separate stages (i.e., as basal fertilizer on sowing day and topdressing fertilizer during the jointing stage). A total of 120 kg/ha P2O5 and 150 kg/ha K2O were applied on the sowing day as basal fertilizer using superphosphate (P2O5, 16%) and potassium sulfate (K2O, 51%), respectively. All fertilizers were applied into the soil at a depth of 5 cm and then covered by soil.
2.3. Sampling, Measurements, and Calculations
2.3.1. Collection and Crop Sample Measurements
Plant heights and stem diameters were measured using a straightedge and vernier caliper. The forage maize was harvested at the late milky stage, and each sampled plant was subdivided into stems, leaves, and ears immediately after harvesting. The different plant parts were dried at 105 °C for 30 min, and then at 75 °C until reaching a constant dry weight [19]. Dried samples were crushed, whereafter N concentration, neutral detergent fiber (NDF), and acid detergent fiber (ADF) were determined using the Kjeldahl [20] and Van Soest’s [21] (sequential detergent analysis) methods, respectively. Crude protein (CP) was calculated by multiplying the N concentration by 6.25 [22]. Additionally, the nutrient contents of the above-ground plant were obtained by measuring the nutrient contents of the different plant parts and their respective dry weight ratios.
Quality indices for animal feed, including dry matter intake (DMI), dry matter digestibility (DMD), and relative feed value (RFV), were calculated using the following formulas [23]:
DMI (%) = 120/NDF,
DMD (%) = 88.9 − 0.779 × ADF,
RFV (%) = DMD × DMI/1.29,
2.3.2. Soil Moisture and Crop Water Consumption
Soil volumetric water content (SWC) was automatically monitored by soil moisture sensors (resolution of 0.1%, measurement period of 30 min). The equation for the total soil water storage (SWS) in the 0–80 cm soil layer was calculated as follows:
where i refers to the soil layer; Di refers to the thickness (cm) of the ith soil layer; SWCi refers to the volumetric soil water content (cm3/cm3) of the ith soil layer; and 10 is a conversion factor.
Water consumption during the entire growth period (ET) was estimated by the water balance method:
where P refers to precipitation (mm); I refers to irrigation (mm); CR refers to upward groundwater recharge (mm); SWSi refers to soil water storage in the 0–80 cm soil layer before sowing (mm); SWSi+1 refers to soil water storage in the 0–80 cm soil layer after harvest (mm); R refers to surface runoff (mm); and D refers to deep seepage (mm). Since a controlled pot experiment was conducted, CR, R, and D were all 0. Therefore, the above equation for ET can be simplified as follows:
ET = P + I + CR − (SWSi − SWSi+1) − R − D,
ET = P + I − SWSi + SWSi+1,
2.3.3. Water- and N-use Efficiencies
Based on dry matter yield and ET determination, the dry matter water-use efficiency (WUEDM) was calculated as follows:
where Y refers to dry matter yield at the harvesting period (g), and ET refers to water consumption during the monitoring period (kg).
WUEDM = Y/ET,
In this study, N recovery efficiency (RE) and partial-factor productivity of applied N (PFP) were used to evaluate NUE; these indicators were calculated as follows [24]:
where UN is forage maize N uptake (kg/ha) with N fertilizer, U0 is N uptake (kg/ha) without N fertilizer, N is N fertilizer input (kg/ha), and Y is dry matter yield (kg/ha) with N fertilizer.
2.4. Statistical Analysis
All data were compiled and analyzed in Excel 2010. The significance of differences in plant height, stem diameter, fresh and dry matter yield, CP, NDF, ADF, WUE, PFPN, and REN among the different N rates were tested by ANOVA (SPSS Inc., Chicago, IL, USA), and the means of N rates were compared by Duncan’s tests at p < 0.05. The means of the two basal topdressing ratios were compared by T test at p < 0.05. Under each basal topdressing ratio, the regression analysis was performed to explore the relations between the above-mentioned indicators and the N rate. Origin Pro 2021 was used to generate graphs.
3. Results
3.1. Plant Height and Stem Diameter at Harvest
In 2020, the N fertilizer basal topdressing ratio significantly affected plant height at harvest. Specifically, the plant height at harvest under the basal topdressing ratio of 2:8 was significantly higher by 4.1% compared to the 4:6 ratio. In 2021, both the N application rate and basal topdressing ratio did not significantly affect height (Table 2).
Table 2.
Effects of different fertilization rates and basal topdressing ratios on plant height and stem diameter in 2020 and 2021.
In 2020, both the N application rate and basal topdressing ratio significantly affected stem diameter at harvest. The stem diameter at harvest significantly increased by 15.4% at N140 compared to N0. When the basal topdressing ratio was 4:6, stem diameter significantly increased by 5.6% compared to the 2:8 ratio. The stem diameter increased quadratically with an increasing N rate in 2020 (Figure 3). In 2021, neither the N application rate nor basal topdressing ratio significantly affected stem diameter (Table 2).
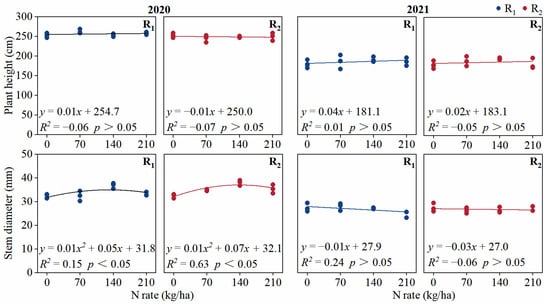
Figure 3.
Plant height and stem diameter under different treatments in 2020 and 2021.
3.2. Fresh and Dry Matter Yield at Harvest
In 2020, the N application rate significantly affected the fresh weight of leaves, stems, ears, and whole aboveground plant matter at harvest, while the basal topdressing ratio only significantly affected the fresh weight of ears and aboveground whole plant matter (Table 3). The fresh weights of leaves, ears, and aboveground whole plant matter were highest at N210, while the fresh weight of stems was highest at N140. Additionally, the fresh weight of ears and aboveground whole plant matter under the 2:8 basal topdressing ratio was higher than the 4:6 ratio. The fresh weight of aboveground whole plant matter under the 2:8 basal topdressing ratio increased quadratically with increasing N rate. However, the aboveground whole plant matter under the 4:6 basal topdressing ratio increased linearly with the N rate (Figure 4). The N application rate significantly affected the dry weight of ears and aboveground whole plant matter, and its interaction with the basal topdressing ratio significantly affected the dry weight of stems and ears (Table 3). The dry weight of aboveground whole plant matter under 2:8 and 4:6 basal topdressing ratios increased linearly with the N rate (Figure 5).
Table 3.
Effects of different fertilization rates and basal topdressing ratios on fresh and dry weights in 2020 and 2021.
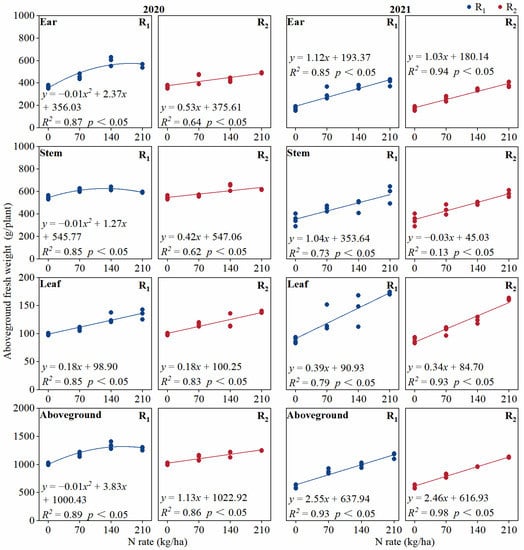
Figure 4.
Fresh weights of forage maize plants at harvest under different treatments in 2020 and 2021.
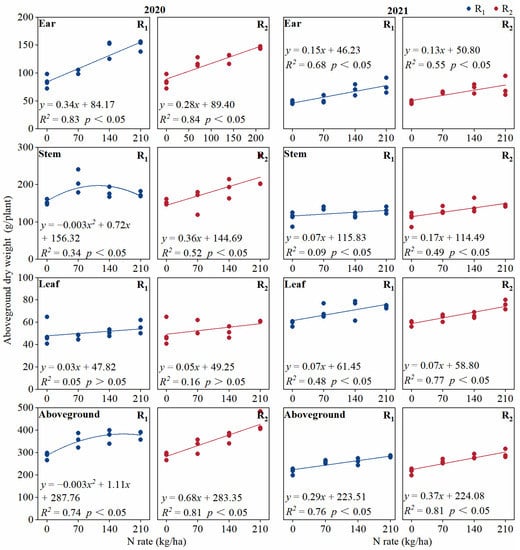
Figure 5.
Dry weights of forage maize plants at harvest under different treatments in 2020 and 2021.
In 2021, the N application rate significantly affected the fresh weight of leaves, stems, ears, and aboveground whole plant matter at harvest, while the basal topdressing ratio significantly affected the fresh weight of leaves, ears, and aboveground whole plant matter (Table 3). The fresh weight of leaves, stems, ears, and whole plant matter increased linearly or quadratically with increasing N application. The fresh weight of aboveground whole plant matter at the 2:8 ratio was higher compared to the 4:6 ratio. The N application rate significantly affected the dry weight of leaves, stems ears, and aboveground whole plant matter, while the basal topdressing ratio only significantly affected the whole aboveground plant dry weight (Table 3). The aboveground whole plant fresh and dry weight increased linearly with increasing N application (Figure 4 and Figure 5). Aboveground whole plant dry weight at the 4:6 ratio was higher compared to the 2:8 ratio.
3.3. CP
In 2020, the N application rate significantly affected the CP content of leaves, ears, and aboveground whole plant, and basal topdressing ratio significantly affected the CP content of ears, stems, and aboveground whole plant matter at harvest, while the interactions of the two factors significantly affected the CP content of aboveground whole plant (Table 4). When the basal topdressing ratio was 2:8, the CP content of stems, ears, and the aboveground whole plant matter was significantly higher than the 4:6 ratio. The CP content of the aboveground whole plant under 2:8 and 4:6 basal topdressing ratios increased linearly with increasing N application (Figure 6).
Table 4.
Effects of different fertilization rates and basal topdressing ratios on CP content in 2020 and 2021.
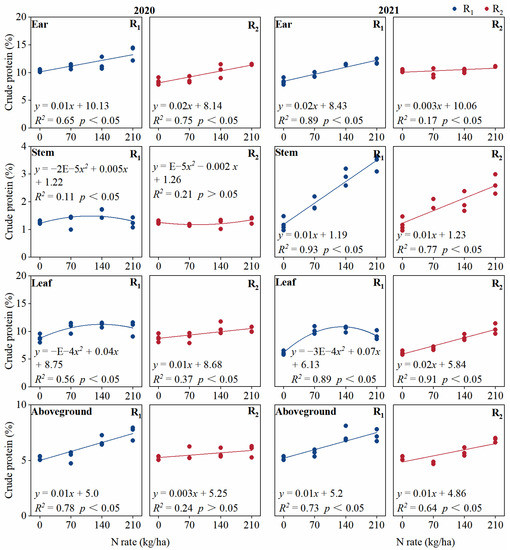
Figure 6.
CP content of forage maize at harvest under different treatments in 2020 and 2021.
In 2021, the N application rate and basal topdressing ratio significantly affected the CP contents of leaves, stems, ears, and aboveground whole plant matter at harvest, and their interactions significantly affected the CP content of leaves and stems. The CP content of leaves, stems, ears, and aboveground whole plant matter generally increased in linear or quadratic equations with increasing N rate under both basal topdressing ratios. When the basal topdressing ratio was 2:8, the CP content of leaves, stems, ears, and the aboveground whole plant matter was significantly higher than 4:6.
3.4. NDF
In 2020, the N application rate significantly affected the NDF of leaves, stems, and aboveground whole plant at harvest, while the basal topdressing ratio only significantly affected the NDF of leaves (Table 5). The NDF of different parts, as well as aboveground whole plant matter, at harvest decreased linearly with increasing N application under both basal topdressing ratios (2:8 and 4:6) (Figure 7).
Table 5.
Effects of different fertilization rates and basal topdressing ratios on NDF and ADF in 2020 and 2021.
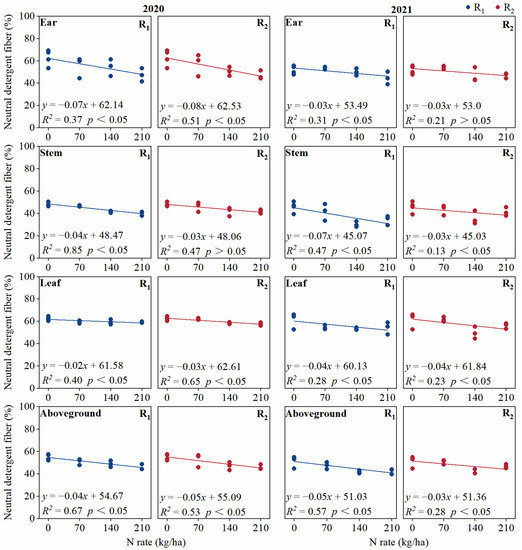
Figure 7.
NDF of forage maize at harvest under different treatments in 2020 and 2021.
In 2021, the N application rate significantly affected the NDF of leaves, stems, ears, and aboveground whole plant at harvest, and the basal topdressing ratio significantly affected the NDF content of aboveground whole plant. The NDF of leaves, stems, ears, and aboveground whole plant matter generally decreased in linear equations with increasing N rate. Moreover, aboveground whole plant NDF was higher in 4:6 compared to 2:8.
3.5. ADF
In 2020, the N application rate significantly affected the ADF of stems, ears, and aboveground whole plant at harvest, while the basal topdressing ratio significantly affected the ADF of stems and aboveground whole plant matter (Table 5). The ADF of aboveground whole plant matter decreased linearly with increasing N application rate at both ratios (2:8 and 4:6) (Figure 8). The ADF of stems and aboveground whole plant matter was higher under the 4:6 ratio compared to the 2:8 ratio.
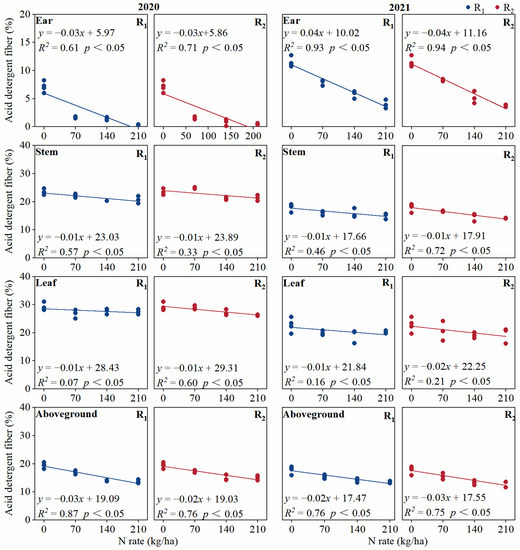
Figure 8.
ADF of forage maize at harvest under different treatments in 2020 and 2021.
In 2021, the N application rate significantly affected the ADF of stems, ears, and aboveground whole plant matter at harvest. The ADF of stems, ears, and aboveground whole plant matter decreased linearly with increasing N application rate under both basal topdressing ratios (2:8 and 4:6).
3.6. RFV
In 2020, the N application rate significantly affected the dry matter intake (DMI), digestible dry matter (DDM), and relative forage value (RFV) of aboveground whole plant matter at harvest, while the basal topdressing ratio only significantly affected DDM. DMI, DDM, and RFV increased with increasing N application rate and peaked at N210. DDM was lower in the 4:6 ratio compared to the 2:8 ratio.
In 2021, the N application rate significantly affected DMI, DDM, and RFV of aboveground whole plant matter at harvest. Moreover, DMI and RFV peaked at N140, while DDM peaked at N210, respectively (Table 6).
Table 6.
Dry matter intake (DMI), digestible dry matter (DDM), and relative feeding value (RFV) of forage maize under different treatments.
3.7. Dynamics of Soil Water Storage
Soil water storage in the 0–80 cm soil layer of forage maize changed over time under all treatments in 2020 and 2021 (Figure 9). Soil water storage was higher under the 4:6 ratio compared to the 2:8 ratio during the entire reproductive period. By comparing the peaks on the soil water storage curves with rainfall events, it is clear that a peak occurred soon after each rainfall event, or that it was continuous on cloudy days, followed by a gradual decrease in soil water content in each soil layer, as well as soil water storage, until the next rainfall event. This exact situation repeated itself. Additionally, the decreased rate of soil water storage in the 0–80 cm soil layer gradually increased as the reproductive period progressed, indicating that the rate of water consumption by forage maize gradually increased.
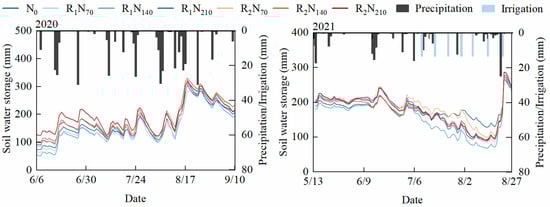
Figure 9.
Dynamics of soil water storage in the 0–80 cm soil layer under different treatments in 2020 and 2021.
3.8. Water- and N-use Efficiency
In 2020, the N application rate and its interaction with the basal topdressing ratio significantly affected WUEDM (Table 7). WUEDM increased with increasing N application and peaked at N210. In 2021, the N application rate, basal topdressing ratio, and their interaction significantly affected WUEDM. The WUEDM in the N70, N140, and N210 treatments were significantly higher compared to N0. When the basal topdressing ratio was 4:6, the WUEDM was higher than the 2:8 ratio.
Table 7.
Effects of different fertilization rates and basal topdressing ratios on WUE, RE, and PFP in 2020 and 2021.
In 2020 and 2021, the N application rate significantly affected PFPN, while the basal topdressing ratio significantly affected REN. When the basal topdressing ratio was 2:8, REN was higher compared to 4:6. PFPN decreased with increasing N application.
4. Discussion
4.1. Effect on Maize Growth and Dry Matter Accumulation
N application is one of the key measures that promote forage maize growth and yield. Carpici et al. (2010) reported that plant height increased with increasing N application, and it peaked at an N rate of 400 kg/ha. Stem diameter increased up to an N rate of 300 kg/ha, whereafter it stabilized [25]. In our study, the stem diameter of forage maize increased quadratically with increasing N application, and the predicted optimum N rate was 131.2 kg/ha for the 2:8 basal topdressing ratio and 138.5 kg/ha for the 4:6 ratio. Qiu et al. (2014) found that increasing N application beyond the optimal rate will only lead to a small increase, or even a decrease, in forage maize aboveground biomass, and optimal rate differences observed between years and experimental sites were primarily caused by variability in rainfall and soil characteristics [26]. In our study, the aboveground whole plant fresh and dry weight under the 2:8 basal topdressing ratio increased quadratically with the N rate. The predicted optimum N rate was 165.8 kg/ha for maximizing the fresh weight and 171.0 kg/ha for maximizing the dry weight in 2020. The fresh and dry weights of aboveground parts in 2021 increased with increasing N application under both basal topdressing ratios and reached a maximum of 210 kg/ha. This shows that the application of N fertilizer within a reasonable interval is beneficial to forage maize growth and dry matter accumulation.
Excessive basal N fertilizer causes increased N leaching and leads to an insufficient supply of N in the late growth stages of maize, resulting in early leaf senescence. Topdressing N fertilization that occurs at the jointing and trumpet stages can ensure a sufficient N supply in the late growth stage, thus promoting a high yield [27,28]. In our study, forage maize yield increased significantly under the basal topdressing ratio of 2:8 compared to 4:6. In 2020, forage maize fresh and dry matter yields were significantly higher under the 2:8 basal topdressing ratio than the 4:6 ratio. However, the opposite was observed in 2021. This is possibly because precipitation during the late growth stage was significantly lower in 2021 compared to 2020. An increased N topdressing ratio at the jointing stage (i.e., 2:8 vs. 4:6 of the basal topdressing ratio) under drought conditions (the case in 2020) decreases soil water potential and inhibits root growth, resulting in hindered water and nutrient absorption [12]. Additionally, this study found that dry matter yield during 2021 was 23.1% lower compared to 2020. The sum of precipitation and irrigation during the growth period of 2021 was 43.8% lower than the precipitation in 2020, thus leading to reduced yield. Relevant research has shown that effective precipitation during the forage maize reproductive period enhances yield formation [26,29,30].
4.2. Effect on Forage Quality
Crude protein (CP) is the sum of nitrogenous substances in forage and directly determines forage nutritional value [31]. ADF and NDF content affects livestock forage intake and consumption rates. Higher ADF values lead to lower feeding rates, and the higher the NDF value, the lower the digestibility [32]. Our study showed that the CP content of forage maize increased linearly or quadratically with increasing N application. Similar effects of N fertilization were reported by Sheaffer et al. (2006) [33] and Patricio Soto et al. (2004) [34] in forage maize. Our study found that the CP content of stems and ears was higher compared to leaves. Singh et al. (2006) found that the N content and uptake of grain and straw were the highest [35] in all maize parts. In our study, an increased N rate decreased NDF and ADF concentration (as evidenced by the observed significant negative linear regression relations between NDF and ADF and the N rate in Figure 6 and Figure 7), thus effectively improving forage maize nutritional value and feeding quality; these results agree well with previous studies [36,37,38]. Additionally, forage quality is closely related to material translocation and metabolism, and increasing the topdressing ratio of N fertilizer at later growth stages can improve N translocation and use efficiency, resulting in higher physiological activity in the late reproductive stage, which is conducive to improved dry matter yield formation and forage quality [15,16]. In our study, at the 2:8 basal topdressing ratio, the CP content of ears, as well as aboveground whole plant matter, was higher in all N applications compared to the 4:6 ratio. At a certain total N application, an appropriate increase in the topdressing ratio of N fertilizer can significantly improve the efficiency of N transport in post-flowering nutrient organs, thus increasing their CP content [17,39]. However, the basal topdressing ratio of N fertilizer did not significantly affect NDF and ADF content, and the related mechanism needs further exploration.
4.3. Effect on Water- and N-use Efficiency
Proper N application can significantly promote root growth and expand the space for soil water and nutrient uptake by roots while increasing leaf area to improve transpiration efficiency and reduce inefficient soil water evaporation. This can result in the efficient use of limited soil water resources in semi-arid areas. Meanwhile, increasing the topdressing ratio of N fertilizer promotes favorable crop water use efficiency, but exceeding the optimal ratio leads to decreases [18]. In our study, forage maize WUEDM increased with increasing N application in both years and reached a maximum of N210. In 2021, the basal topdressing ratio significantly affected WUEDM. Moreover, WUEDM was higher at N140 and N210 rates under the basal topdressing ratio of 4:6 compared to 2:8. This was because the dry matter yield of the forage maize was higher at the 4:6 basal topdressing ratio compared to the 2:8 ratio in 2021, but the difference in water consumption between both ratios was not significant. Meanwhile, crop water consumption was slow in the early stage, but then gradually increased, and then decreased again in the late stage. This is similar to Ge et al. (2012), who reported that the transpiration rate of maize was higher at the seventeenth leaf stages compared to the reproductive stages [40]. The variation in soil water storage in this study can provide a basis for optimal water management for forage maize at each growth stage.
Studies have shown ammonia volatilization is significantly increased with the N application rate, and a high basal N application ratio significantly increases N loss [41]. A greater amount of N is required in the later growth stage (after silking) for high-yielding maize production, and the highest crop N uptake occurs in the period from flowering to harvest. Changing the allocation of N from basal to topdressing can reduce the apparent N surplus [14,42]. A proper N rate, together with a split application, can promote N uptake during the entire reproductive period, and thus improve N fertilizer utilization. Our study showed that PFPN was lower with increased N application. The REN of forage maize at the 2:8 basal topdressing ratio was higher compared to the 4:6 ratio under all N rates, while the basal topdressing ratio had no significant effect on PFPN. Optimizing the basal topdressing ratio of N fertilizer can significantly improve N utilization efficiency. This shows that decreasing the total N application rate while increasing the ratio of topdressing, can be a feasible and effective strategy for N fertilizer management to improve N-use efficiency in maize cultivation.
5. Conclusions
An optimized N application rate and basal topdressing ratio promote a high forage maize yield and quality with efficient water and N resource use. With increasing N application rate, the dry matter yield, forage quality, and dry matter water-use efficiency of forage maize significantly increased, while N-use efficiency (indicated by N recovery efficiency and the partial-factor productivity of applied N) clearly decreased. In normal rainfall years, the dry matter yield, crude protein content, and partial-factor productivity of applied N at harvest were all significantly higher under an N rate of 210 kg/ha and an optimal basal topdressing ratio of 2:8. In dry years; however, the effects of the N application rate and basal topdressing ratio on forage maize production were significantly different. The N application rate and basal topdressing ratio should be optimized further for different rainfall regimes with the help of crop growth models to achieve productive and high-quality cultivation of forage maize with efficient water and N resource use.
Author Contributions
Material preparation and data collection, R.M., N.S., W.G. and C.J.; data curation, R.M. and N.S.; data analysis, R.M.; writing—original draft preparation, R.M.; writing—review, X.Y. All authors have read and agreed to the published version of the manuscript.
Funding
This research was funded by the National Key Research and Development Plan (2021YFD1100501), the Natural Science Foundation of Gansu Province (21JR7RA488), the National Forage Industry Technology System (CARS-34), and the Fundamental Research Funds for the Central Universities of Lanzhou University (lzujbky-2021-14).
Data Availability Statement
Not applicable.
Conflicts of Interest
The authors declare no conflict of interest.
References
- Khan, N.A.; Yu, P.; Ali, M.; Cone, J.W.; Hendriks, W.H. Nutritive value of maize silage in relation to dairy cow performance and milk quality. J. Sci. Food Agric. 2015, 95, 238–252. [Google Scholar] [CrossRef] [PubMed]
- Nilahyane, A.; Islam, M.A.; Mesbah, A.O.; Garcia y Garcia, A. Evaluation of silage corn yield gap: An approach for sustainable production in the semi-arid region of USA. Sustainability 2018, 10, 2523. [Google Scholar] [CrossRef]
- Roth, G.; Undersander, D.; Allen, M.; Ford, S.; Harrison, J.; Hunt, C. Corn Silage Production, Management, and Feeding; American Society of Agronomy: Madison, WI, USA, 1995. [Google Scholar]
- Song, Y.; Li, J.; Liu, M.; Meng, Z.; Liu, K.; Sui, N. Nitrogen increases drought tolerance in maize seedlings. Funct. Plant Biol. 2019, 46, 350–359. [Google Scholar] [CrossRef] [PubMed]
- Oluoch, K.O.A.; De Groote, H.; Gitonga, Z.M.; Jin, Z.; Davis, K.F. A suite of agronomic factors can offset the effects of climate variability on rainfed maize production in Kenya. Sci. Rep. 2022, 12, 16043. [Google Scholar] [CrossRef]
- Wang, Z.-H.; Li, S.-X.; Malhi, S. Effects of fertilization and other agronomic measures on nutritional quality of crops. J. Sci. Food Agric. 2008, 88, 7–23. [Google Scholar] [CrossRef]
- Ma, G.; Liu, W.; Li, S.; Zhang, P.; Wang, C.; Lu, H.; Wang, L.; Xie, Y.; Ma, D.; Kang, G. Determining the optimal N input to improve grain yield and quality in winter wheat with reduced apparent N loss in the North China Plain. Front. Plant Sci. 2019, 10, 181. [Google Scholar] [CrossRef]
- Peng, S.; Buresh, R.J.; Huang, J.; Yang, J.; Zou, Y.; Zhong, X.; Wang, G.; Zhang, F. Strategies for overcoming low agronomic nitrogen use efficiency in irrigated rice systems in China. Field Crops Res. 2006, 96, 37–47. [Google Scholar] [CrossRef]
- Mao, S. Cotton Farming in China Shanghai; Shanghai Scientific and Technical Press: Shanghai, China, 2013. [Google Scholar]
- Gheysari, M.; Loescher, H.W.; Sadeghi, S.H.; Mirlatifi, S.M.; Zareian, M.J.; Hoogenboom, G. Water-yield relations and water use efficiency of maize under nitrogen fertigation for semiarid environments: Experiment and synthesis. Adv. Agron. 2015, 130, 175–229. [Google Scholar]
- Qiang, S.; Zhang, Y.; Fan, J.; Zhang, F.; Xiang, Y.; Yan, S.; Wu, Y. Maize yield, rainwater and nitrogen use efficiency as affected by maize genotypes and nitrogen rates on the Loess Plateau of China. Agric. Water Manag. 2019, 213, 996–1003. [Google Scholar] [CrossRef]
- Leghari, S.J.; Wahocho, N.A.; Laghari, G.M.; HafeezLaghari, A.; MustafaBhabhan, G.; HussainTalpur, K.; Bhutto, T.A.; Wahocho, S.A.; Lashari, A.A. Role of nitrogen for plant growth and development: A review. Adv. Environ. Biol. 2016, 10, 209–219. [Google Scholar]
- Clawson, E.L.; Cothren, J.T.; Blouin, D.C.; Satterwhite, J.L. Timing of Maturity in Ultra-Narrow and Conventional Row Cotton as Affected by Nitrogen Fertilizer Rate. Agron. J. 2008, 100, 421–431. [Google Scholar] [CrossRef]
- Guo, R.; Miao, W.; Fan, C.; Li, X.; Shi, X.; Li, F.; Qin, W. Exploring optimal nitrogen management for high yielding maize in arid areas via 15N-labeled technique. Geoderma 2021, 382, 114711. [Google Scholar] [CrossRef]
- Meena, B.P.; Jha, P.; Ramesh, K.; Biswas, A.K.; Elanchezhian, R.; Das, H.; Sathyaseelan, N.; Shirale, A.O.; Patra, A.K. Agronomic management based on multi-split topdressing increases grain yield and nitrogen use efficiency in rainfed maize in Vertisols of India. J. Plant Nutr. 2022, 45, 828–844. [Google Scholar]
- Fu, W.; Wang, Y.; Ye, Y.; Zhen, S.; Zhou, B.; Wang, Y.; Hu, Y.; Zhao, Y.; Huang, Y. Grain yields and nitrogen use efficiencies in different types of stay-green maize in response to nitrogen fertilizer. Plants 2020, 9, 474. [Google Scholar] [CrossRef] [PubMed]
- Kubar, M.S.; Feng, M.; Sayed, S.; Shar, A.H.; Rind, N.A.; Ullah, H.; Kalhoro, S.A.; Xie, Y.; Yang, C.; Yang, W. Agronomical traits associated with yield and yield components of winter wheat as affected by nitrogen managements. Saudi J. Biol. Sci. 2021, 28, 4852–4858. [Google Scholar] [CrossRef] [PubMed]
- Luo, H.; Li, F. Tomato yield, quality and water use efficiency under different drip fertigation strategies. Sci. Hortic. 2018, 235, 181–188. [Google Scholar] [CrossRef]
- Li, J.; Wen, X.; Yang, J.; Yang, W.; Xin, Y.; Zhang, L.; Liu, H.; He, Y.; Yan, Y. Effects of Maize Varieties on Biomass Yield and Silage Quality of Maize-Soybean Intercropping in the Qinghai-Tibet Plateau. Fermentation 2022, 8, 542. [Google Scholar] [CrossRef]
- Yang, S. Feedstuff Analysis and Identification and Determination of Feedstuff Quality; Beijing Agricultural University Press: Beijing, China, 1993. [Google Scholar]
- Van Soest, P.V.; Robertson, J.B.; Lewis, B.A. Methods for dietary fiber, neutral detergent fiber, and nonstarch polysaccharides in relation to animal nutrition. J. Dairy Sci. 1991, 74, 3583–3597. [Google Scholar] [CrossRef]
- Horwitz, W. AOAC (Association of Official Analytical Chemists) Official Methods of Analysis; AOAC International: Rockville, MD, USA, 2000. [Google Scholar]
- Lithourgidis, A.; Vasilakoglou, I.; Dhima, K.; Dordas, C.; Yiakoulaki, M. Forage yield and quality of common vetch mixtures with oat and triticale in two seeding ratios. Field Crops Res. 2006, 99, 106–113. [Google Scholar] [CrossRef]
- Yang, X.; Lu, Y.; Ding, Y.; Yin, X.; Raza, S. Optimising nitrogen fertilisation: A key to improving nitrogen-use efficiency and minimising nitrate leaching losses in an intensive wheat/maize rotation (2008–2014). Field Crops Res. 2017, 206, 1–10. [Google Scholar] [CrossRef]
- Carpici, E.B.; Celik, N.; Bayram, G. Yield and quality of forage maize as influenced by plant density and nitrogen rate. Turk. J. Field Crops 2010, 15, 128–132. [Google Scholar]
- Qiu, S.; He, P.; Zhao, S.; Li, W.; Xie, J.; Hou, Y.; Grant, C.; Zhou, W.; Jin, J. Impact of nitrogen rate on maize yield and nitrogen use efficiencies in northeast China. Agron. J. 2015, 107, 305–313. [Google Scholar] [CrossRef]
- Gu, X.; Ding, M.; Lu, W.; Lu, D. Nitrogen topdressing at the jointing stage affects the nutrient accumulation and translocation in rainfed waxy maize. J. Plant Nutr. 2019, 42, 657–672. [Google Scholar] [CrossRef]
- Gang, X.; Huabing, L.; Yufu, P.; Tiezhao, Y.; Xi, Y.; Shixiao, X. Plastic film mulching combined with nutrient management to improve water use efficiency, production of rain-fed maize and economic returns in semi-arid regions. Field Crops Res. 2019, 231, 30–39. [Google Scholar] [CrossRef]
- Kiziloglu, F.M.; Sahin, U.; Kuslu, Y.; Tunc, T. Determining water–yield relationship, water use efficiency, crop and pan coefficients for silage maize in a semiarid region. Irrig. Sci. 2009, 27, 129–137. [Google Scholar] [CrossRef]
- Lemaire, G.; Charrier, X. Nitrogen uptake capacities of maize and sorghum crops in different nitrogen and water supply conditions. Agronomie 1996, 16, 231–246. [Google Scholar] [CrossRef]
- Boyd, C.E. Fresh-water plants: A potential source of protein. Econ. Bot. 1968, 22, 359–368. [Google Scholar] [CrossRef]
- Krause, M.; Beauchemin, K.; Rode, L.; Farr, B.; Nørgaard, P. Fibrolytic enzyme treatment of barley grain and source of forage in high-grain diets fed to growing cattle. J. Anim. Sci. 1998, 76, 2912–2920. [Google Scholar] [CrossRef]
- Sheaffer, C.C.; Halgerson, J.; Jung, H. Hybrid and N fertilization affect corn silage yield and quality. J. Agron. Crop Sci. 2006, 192, 278–283. [Google Scholar] [CrossRef]
- Soto, P.O.; Jahn, E.B.; Arredondo, S.S. Improvement of protein percentage in corn silage with an increase in and partitioning of nitrogen fertilization. Agric. Técnica 2004, 64, 156–162. [Google Scholar]
- Singh, D.; Rana, N.; Singh, R. Growth and yield of winter maize (Zea mays) as influenced by intercrops and nitrogen application. Indian J. Agron. 2000, 45, 515–519. [Google Scholar]
- Safdarian, M.; Razmjoo, J.; Dehnavi, M.M. Effect of nitrogen sources and rates on yield and quality of silage corn. J. Plant Nutr. 2014, 37, 611–617. [Google Scholar] [CrossRef]
- Keskin, B.; Akdeniz, H.; Yilmaz, I.H.; Turan, N. Yield and quality of forage corn (Zea mays L.) as influenced by cultivar and nitrogen rate. J. Agron. 2005, 4, 138–141. [Google Scholar] [CrossRef][Green Version]
- Cox, W.J.; Cherney, D.J. Row spacing, plant density, and nitrogen effects on corn silage. Agron. J. 2001, 93, 597–602. [Google Scholar] [CrossRef]
- Zhang, Z.; Yu, Z.; Zhang, Y.; Shi, Y. Optimized nitrogen fertilizer application strategies under supplementary irrigation improved winter wheat (Triticum aestivum L.) yield and grain protein yield. PeerJ 2021, 9, e11467. [Google Scholar] [CrossRef] [PubMed]
- Ge, T.; Sui, F.; Bai, L.; Tong, C.; Sun, N. Effects of water stress on growth, biomass partitioning, and water-use efficiency in summer maize (Zea mays L.) throughout the growth cycle. Acta Physiol. Plant 2012, 34, 1043–1053. [Google Scholar] [CrossRef]
- Pengcheng, L.; Helin, D.; Aizhong, L.; Jingran, L.; Miao, S.; Yabing, L.; Shaodong, L.; Xinhua, Z.; Shuchun, M. Effects of nitrogen rate and split application ratio on nitrogen use and soil nitrogen balance in cotton fields. Pedosphere 2017, 27, 769–777. [Google Scholar]
- Mueller, S.M.; Vyn, T.J. Maize plant resilience to N stress and post-silking N capacity changes over time: A review. Front. Plant Sci. 2016, 7, 53. [Google Scholar] [CrossRef]


Disclaimer/Publisher’s Note: The statements, opinions and data contained in all publications are solely those of the individual author(s) and contributor(s) and not of MDPI and/or the editor(s). MDPI and/or the editor(s) disclaim responsibility for any injury to people or property resulting from any ideas, methods, instructions or products referred to in the content. |
© 2023 by the authors. Licensee MDPI, Basel, Switzerland. This article is an open access article distributed under the terms and conditions of the Creative Commons Attribution (CC BY) license (https://creativecommons.org/licenses/by/4.0/).