Abstract
Mixing cereal with legume crops is an efficient approach for improving forage production and ensuring the sustainable development of agriculture and livestock. However, the knowledge of the relationship between forage production and interspecific competition in the forage oat (Avena sativa L.) and common vetch (Vicia sativa L.) mixed cropping system remains unclear. A 2-year field experiment was conducted in 2020 and 2021 to investigate the effects of different mixed cropping systems (peer mixing (PM), alternate-row mixing (AM), cross mixing (CM), bar mixing (BM), sole forage oat (SO), and sole common vetch (SV)) on the dry matter production, forage quality, land equivalent ratio (LER), and competition parameters. The results showed that the system forage yield increased by 13.4–202.8% when forage oat was mixed with common vetch (p < 0.05). However, no significant difference was obtained between the AM and PM mixed cropping systems. Additionally, the forage oat–common vetch mixed cropping improved crude protein yield by 52.5–150.1% compared with monocultures (p < 0.05). The LER values were greater than the one when forage oat was mixed with common vetch, especially for the AM system (averaged 1.38). In addition, forage oat was the dominant crop and had higher aggressiveness and competitive ratios compared to common vetch, but without a significant difference in the aggressiveness and competitive ratio in mixed cropping systems. It indicated that mixing of cereal with legume crops was helpful in enhancing resource use efficiency without obvious interspecific competition. Consequently, the AM mixed cropping system is recommended for supporting the sustainable development of agriculture and livestock production in the arid region of China when considering both forage production and nutritional quality.
1. Introduction
Livestock is a vital source of income for the rural population in developed and developing countries, contributing to livelihoods through the production of meat, milk, leather, and wool. The demand for livestock products doubled globally between 1993 and 2020, with demand for meat and milk products in developing countries growing at annual rates of 2.7% and 3.2%, respectively []. The arid region of Ningxia is also important for livestock production in China []; however, forage shortages and their low quality have been the main factors limiting local livestock production. To meet this increased demand and to maintain steady growth of animal numbers while ensuring sustainable development of animal production, forages well adapted to the local environments with high yield and rich nutrition are needed. Therefore, it is crucial to explore suitable cropping systems to improve crop and forage production.
Mixed cropping is the practice of growing two or more crop species in the same field during the same growing season, which is a widely used practice in sustainable agricultural production []. Previous studies have shown that mixed cropping could provide greater total yield and yield stability while also increasing the use efficiency of resources compared to the monoculture system [,]. However, it is often found that forage cannot achieve the goal of high quality and high yield in the mixed cropping system, which results from unsuitable cropping patterns due to the limitation of environmental resources and interspecific competition []. Therefore, selecting an appropriate mixed cropping system is crucial for increasing the forage yield with high quality. Legume–cereal mixed cropping can increase land use efficiency to improve forage yield [,], and Lithourgidis et al. [] concluded that legume–cereal mixed cropping can increase feed value through a literature review, while improving soil fertility and reducing insect pests and crop diseases [,]. Carr et al. [] demonstrated that intercropping 46 viable seeds m−2 of pea (Pisum sativum L.) with 296 viable seeds m−2 of oat could increase the total system crude protein yield compared to the forage monoculture cropping system. Italian Ryegrass (Lolium perenne L.) and forage pea mixed cropping contributed to higher crude protein and dry matter yield, with improved cultivation stability []. Yang et al. [] reported that the total yields of pea/maize (Zea mays L.) alternate-row mixing were higher than the yield of maize monoculture, and that pea/maize alternate-row mixing improved land use efficiency significantly compared to sole crops. Therefore, choosing proper crops is crucial to building an advanced cropping system for sustainable agricultural development. With the characteristics of rapid growth and flexible usage during the growing season, annual forage crops with high quality that are considered to be ideal candidates to optimize the mixed cropping system include forage oat and common vetch. Forage oat is the most widely grown annual cool-season forage cereal in China [,]. Common vetch is also an annual legume that is rich in protein, which is used as an intercrop plant to improve land use efficiency []. Studies have shown that oat–common vetch mixed cropping can be used for forage production and improving radiation use efficiency []. For example, Wang et al. [] showed that sowing ratio of oat at 50% mixed cropping with common vetch improved forage yield by 28.7–66.4% compared with monocultures. Additionally, Baxevanos et al. [] also showed that a 35:65 oat:vetch ratio in mixed cropping was 21% more economically viable in comparison to the monocultures. Although oat–common vetch mixed cropping could effectively promote forage production, it has a potential risk to sustainability if the availability of soil water and precipitation cannot meet the crop demand in the arid region of Ningxia. In addition, optimized row configuration of oat–common vetch mixed cropping is widely used on the Qinghai–Tibetan plateau and in the Loess Plateau to obtain greater forage yield [,]; most studies on mixed cropping of oat with common vetch mainly reported the effects of sowing rate and nitrogen fertilization on yield, forage quality, nitrogen fixation, and water use efficiency [,,]. The forage productivity and the interspecific competition of forage oat and common vetch under different cropping systems in the arid area of Ningxia is still unclear.
Therefore, it is worthwhile to design forage production systems to achieve the multiple goals of agricultural and livestock sustainability. The objectives of this study were to (i) evaluate the effects of mixed cropping systems on forage yield and nutrition quality of forage oat and common vetch, (ii) explore the interspecific competition of forage oat and common vetch among the different mixed cropping systems, and (iii) identify the optimal sustainable mixed cropping systems to support local agriculture and livestock production.
2. Materials and Methods
2.1. Site Description
The field experiment was carried out at the Sidunzi experimental station of Ningxia University (37°46′26″ N, 107°26′16″ E, with an elevation of 1460 m) during the summer–autumn season (early May to early August) from 2020 to 2021 in Yanchi county, Ningxia, China. The long-term (2000–2020) mean annual air temperature and annual rainfalls were 7.7 °C and 229.5 mm, respectively. The distribution of annual precipitation is erratic, and mainly occurs between June and September. The mean total sunshine hours and growing days are 2422 and 248 per annum, respectively. The soil type at the experimental site (Entisol of US classification) was a typical gray desert soil with pH 8.5, organic matter 5.45 g·kg−1, total nitrogen 0.76 g·kg−1, available phosphorus 12.45 mg·kg−1, and available potassium 137.33 mg·kg−1 measured at the beginning of the experiment at 0–30 cm depth. Figure 1 presents the mean monthly air temperature and monthly precipitation during the experimental period.
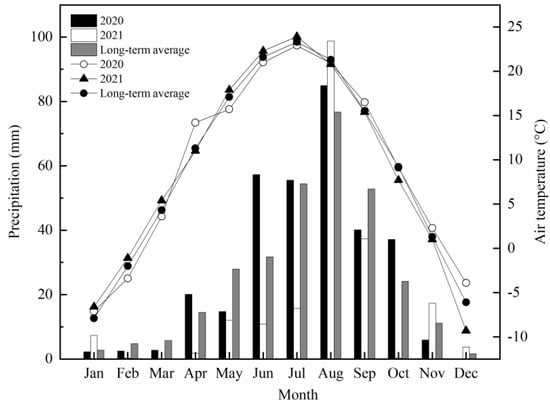
Figure 1.
Monthly precipitation and mean temperature during the experimental period in 2020 and 2021 and long-term average (2000–2020) at the Yanchi county, Ningxia, China. Note: Temperature = bar chart, precipitation = dot chart.
2.2. Experimental Design and Field Management
The field experiment was designed by a randomized complete block method with six treatments and four replications. These treatments were accomplished by sowing forage oat and common vetch with peer mixing (sowing forage oat and common vetch in the same row), alternate-row mixing (common vetch sowing between two lines of forage oat), cross mixing (forage oat and common vetch sowing direction vertical, such as forage oat for east–west sowing, common vetch for north–south sowing), bar mixing (forage oat strip sowing and common vetch spread sowing), solely forage oat, and solely common vetch, respectively. The schematics for different cropping systems during the experimental period are presented in Figure 2. All plots were ploughed to a depth of 35 cm with a rotary cultivator and then slightly suppressed before sowing. Local field management practices were maintained throughout the experiment. Crops were sown on 2 May 2020 and 4 May 2021, respectively. The forage oat and common vetch were planted on the same day. The experimental plots were 30.0 m2 (6.0 m × 5.0 m) with a 0.3 m inter-row distance. The seeding rate of forage oat and common vetch sole crops were 180 kg ha−1 and 95 kg ha−1. For the mixed cropping, the seeding rate were 120 kg ha−1 and 57 kg ha−1 for forage oat and common vetch, respectively. Details of forage oat and common vetch are shown in Table 1. Seeds of forage oat and common vetch were sown by hand at a depth of 3–4 cm. According to local fertilization recommendations, available nitrogen and phosphorous were applied as diammonium phosphate before sowing at rates equivalent to 46 kg N ha–1 and 195 kg P ha–1, respectively. Drip irrigation was accomplished to ensure crops completed growing seasons during the experimental period. All plots were kept free of weeds by hand hoeing.
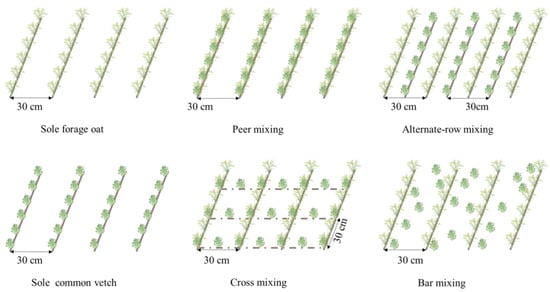
Figure 2.
Schematics for different planting patterns during the experimental period.

Table 1.
The information about the forage oat and common vetch.
2.3. Data Collection and Calculations
2.3.1. Plant Height
Plant height (cm) of forage oat and common vetch were measured at the flowering stage as the distance from the soil to the top of the uppermost plant organ of each species on 20 randomly selected plants per plot.
2.3.2. Aboveground Biomass
Forage crops were harvested at the flowering stage to determine dry matter yield (DM) from three randomly sampled areas of 0.36 m2 (0.6 m × 0.6 m) within each plot by manually cutting from the ground level and fresh weight was measured. For all crops, a distance of at least 50 cm was left between sampling areas. A sub-sample of one kg per plot per species from each treatment was dried at 65 °C for 72 h to a constant weight. Dry weights per square meter were converted to dry matter yield and expressed in t ha−1.
2.3.3. Forage Quality
A total of 2 kg of mixed samples were dried in a forced air oven for 72 h at 65 °C and crushed through 1 mm sieve and analyzed for selected quality components. Neutral detergent fiber and acid detergent fiber of the forage biomass were analyzed by agitating samples in boiling neutral/acid detergent solution for 1 h and determining the dry matter loss [].
The relative feeding value was calculated by using the equation below []:
where NDF represents the neutral detergent fiber (%), and ADF is acid detergent fiber (%).
Nitrogen contents of the forage crops were measured using the Kjeldahl method []. Crude protein concentration was calculated by multiplying the N concentration by 6.25. The crude protein yield was calculated as follows:
where CPY represents the crude protein yield (t ha–1), DM is dry matter, and CP is crude protein concentration of the forage crops (g g−1).
2.3.4. Competition
The partial and total land equivalent ratio was used to compare the productivity of mixed cropping systems compared to sole cropping. The total LER was calculated by standardizing against the yield of the corresponding forage oat or common vetch sole crop []. The partial and total LER was calculated as follows:
where Yo and Yv were the yields of forage oat and common vetch, respectively, as sole crops, and Ymo and Ymv were the yields of oat and common vetch, respectively, as in the mixed cropping system. When the LER is greater than 1.0, there is a land use advantage of the mixed cropping system.
Aggressiveness represents an increase or decrease in the yield of one plant relative to another in a mixed cropping system [], which was calculated as follows:
where Zmo was the proportion of forage oat in a mixed cropping system and Zmv was the proportion of vetch in a mixed cropping system. If Aoat = 0, forage oat and common vetch were equally competitive, if Aoat was positive then the forage oat was more competitive than common vetch, if Aoat was negative then the forage oat was less competitive than common vetch.
Competition ratio can represent the competitive strength of crops in a mixed cropping system []. The competition ratio was calculated as:
where Zmo was the proportion of forage oat in a mixed cropping system and Zmv was the proportion of common vetch in a mixed cropping system. The LERoat and LERvetch represent land use efficiency of forage oat and common vetch, respectively.
2.4. Statistical Analysis
All the experimental data were managed by Microsoft Excel 2016, and the figures were constructed with Origin 2021b. All data analysis was performed with SPSS statistical software 25 (IBM, Corporation, Armonk, NY, USA). Two-way ANOVA was used to assess the effect of the mixed cropping systems × years interaction at the 0.05 probability level. One-way analysis of variance (ANOVA) was used to detect differences among the different mixed cropping systems or the different years at the 0.05 probability level. Multiple comparisons of means among treatments were conducted by Duncan’s multiple range test at the 0.05 probability level.
3. Results
3.1. The Plant Height, Dry Matter Yield, and Crude Protein Yield
There was a significant difference in plant height of forage oat and common vetch among cropping systems during the growing seasons (Table 2). In 2020, the plant height of forage oat in the SO system obtained the highest value, which was 113.0 cm, and increase of 8.0%, 5.6%, 13.0%, and 10.8% compared with the PM, AM, CM, and BM systems, respectively (p < 0.05). The plant height of common vetch in the SV system significantly increased by 22.0%, 18.8%, 43.9%, and 36.1% respectively, compared with the PM, AM, CM, and BM systems. In 2021, the plant height of forage oat in the SO system was higher than that in the PM, AM, CM, and BM systems by 3.9%, 3.3%, 6.6%, and 5.5%, respectively (p < 0.05, Table 3). The plant height of common vetch in the SV system was higher than that in the PM, AM, CM, and BM systems by 29.1%, 31.0%, 31.5%, and 43.1%, respectively (p < 0.05).
Table 2.
ANOVA for the effects of treatments (T), years (Y), and their interactions (T × Y) on plant height, dry matter yield, competitive ratio, and aggressiveness.
Table 3.
Plant height (cm) of forage oat and common vetch among different cropping systems over two years in Yanchi county, Ningxia, China.
The effects of treatment (T) and year (Y) on dry matter yield were significant; however, there were no interaction effects between T and Y on dry matter yield of forage oat (Table 2 and Table 4). In 2020, the system dry matter yield values of the AM were the highest, which were increased by 14.4%, 14.8%, and 167.4%, respectively, compared with the BM, SO, and SV systems (p < 0.05). There was no difference in the dry matter yield between the PM, BM, and AM systems. In 2021, the system dry matter yield in the AM system was higher than that of the CM, BM, SO, and SV systems by 8.8%, 9.9%, 11.9%, and 238.2%, respectively (p < 0.05, Table 5). There was no difference in the dry matter yield between the PM, CM, BM, and SO systems.
Table 4.
ANOVA for the effects of treatments (T), years (Y), and their interactions (T × Y) on total dry matter yield (DMY), crude protein yield (CPY), land equivalent ratio (LER), crude protein (CP), neutral detergent fiber (NDF), acid detergent fiber (ADF), and relative feed value (RFV).
Table 5.
Dry matter yield (t ha−1) of forage oat and common vetch among different cropping systems over two years in Yanchi county, Ningxia, China.
Different mixed cropping treatments significantly affected the CPY during the experimental years (Table 4). In 2020, the CPY in the AM system obtained the highest value, which was 1.39 t ha−1, and increased by 11.5%, 13.0%, 24.1%, 58.0%, and 127.9% compared with the PM, CM, BM, SO, and SV systems, respectively (p < 0.05). In 2021, the CPY in the AM system was higher than that in the PM, CM, BM, SO, and SV systems by 14.1%, 14.8%, 13.3%, 47.1%, and 172.3%, respectively (p < 0.05, Figure 3). During the two seasons, there was no difference in the CPY between the PM, CM, and BM systems.
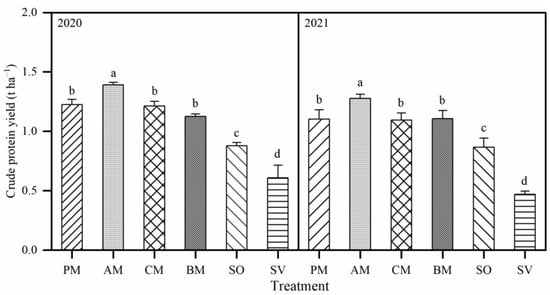
Figure 3.
Crude protein yield of forage oat and common vetch among different cropping systems in two years in Yanchi County, Ningxia, China. Note: PM: peer mixing; AM: alternate-row mixing; CM: cross mixing; BM: bar mixing; SO: sole forage oat; SV: sole common vetch. Different lowercase letters indicate significant difference at p < 0.05.
3.2. Forage Quality
The effects of different mixed cropping treatments were significant on the CP, NDF, and RFV, but not had no significant difference on the ADF concentration. In 2020, the CP concentration in the SV system produced the highest value, followed by PM, AM, CM, and BM systems, which were increased by 61.2%, 26.1%, 37.9%, 27.8%, and 27.6%, respectively, compared with the SO system. In 2021, the CP concentration in the SV, PM, AM, CM, and BM systems were significantly increased by 63.8%, 20.6%, 31.6%, 22.7%, and 25.4%, respectively, compared with that of the SO system. There was no difference in the CP concentration between the PM, AM, CM, and BM systems (Figure 4). In 2020, the NDF concentration in the SV system obtained the lowest value, 17.9%, 15.8%, 24.3%, 15.8%, and 24.6% lower than that in the PM, AM, CM, BM, and SO systems, respectively (p < 0.05). There was no difference in the NDF concentration between the PM, CM, and SO systems. In 2021, the NDF concentration in the SV system was lower than that in the PM, AM, CM, BM, and SO systems by 19.3%, 17.5%, 18.8%, 19.8%, and 30.9%, respectively (p < 0.05, Figure 4). In 2020, there was no significant difference in ADF concentration among all treatments. In 2021, the average ADF concentration in the SO and SV systems was lower than that in the PM, AM, CM, and BM systems by 9.8%, 9.1%, 9.5%, and 8.4%, respectively (p < 0.05, Figure 4). In 2020, the RFV in the SO system obtained the highest value, 24.2%, 22.3%, 30.0%, 21.8%, and 37.3% higher than that in the PM, AM, CM, BM, and SO systems, respectively (p < 0.05). In 2021, the RFV in the SO system was higher than that in the PM, AM, CM, BM, and SO systems by 23.2%, 21.1%, 29.3%, 30.2%, and 32.4%, respectively (p < 0.05). The differences between PM, AM, CM, BM, and SO systems were not significant (Figure 4).
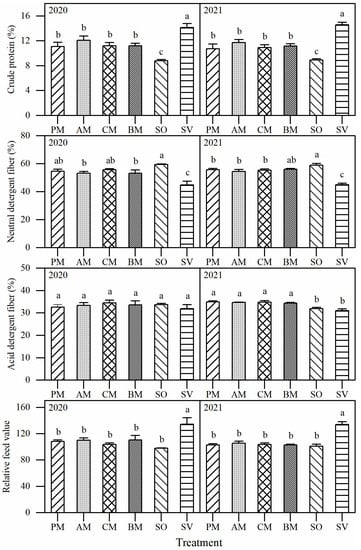
Figure 4.
Crude protein content (CP), neutral detergent fiber content (NDF), acid detergent fiber content (ADF), and relative feed value (RFV) of mixed cropping systems among different cropping systems over two years in Yanchi county, Ningxia, China. Note: PM: peer mixing; AM: alternate-row mixing; CM: cross mixing; BM: bar mixing; SO: sole forage oat; SV: sole common vetch. Different lowercase letters indicate significant difference at p < 0.05.
3.3. The Interspecific Competition
The LERoat, LERvetch, and LER were significantly affected by mixed cropping treatments (except LERvetch in 2020 and LERoat in 2021). The LER values of the four mixed cropping treatments were greater than one (Table 6). In 2020, the LER in the AM system obtained the highest value, 14.3% higher than that of the BM system (p < 0.05). In 2021, the LER in the AM system was higher than that of the CM and BM systems by 12.1% and 14.9%, respectively (p < 0.05). The partial LER values for forage oat as a function of the partial LER of common vetch mixing species show a pattern of competitive outcomes in this study and provide useful information on the performance of the two partners in mixture sowing. The forage oat contributed significantly more than the common vetch towards a total LER of 1.38 (0.94 and 0.34 for forage oat and common vetch, respectively). Where the bottom right quadrant corresponds to situations in which forage oat suppressed common vetch, the biplot clearly shows a competitive advantage of forage oat compared to common vetch in resource use (Figure 5). While the reverse is true in the left upper quadrant.
Table 6.
Land equivalent ratio of mixed cropping system among different cropping systems over two years in Yanchi county, Ningxia, China.
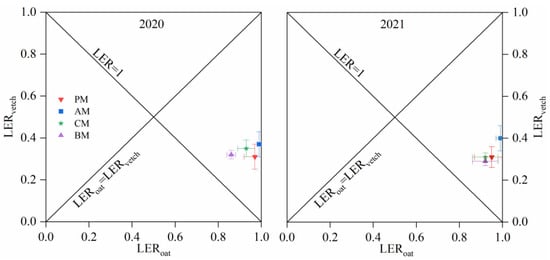
Figure 5.
Partial LER values among different cropping systems over two years in Yanchi county, Ningxia, China. Areas corresponding to values above 0.5 for common vetch and for forage oat represent situations where species yield is higher when mixture cropping. The bottom right quadrant area corresponds to situations in which forage oat suppress common vetch; the reverse is true in the left upper quadrant area.
The Aoat and Avetch were significantly affected by the year, but there was no significant effect of the treatment and treatment × year interaction (Table 2, Figure 6). In 2020, the Aoat values ranged from 0.06 to 0.08, and the Avetch values ranged from −0.06 to −0.08. In 2021, the Aoat values ranged from 0.16 to 0.17, and the Avetch values ranged from −0.16 to −0.17. There was no difference in the Aoat and Avetch values among the PM, AM, CM, and BM systems (Figure 6).
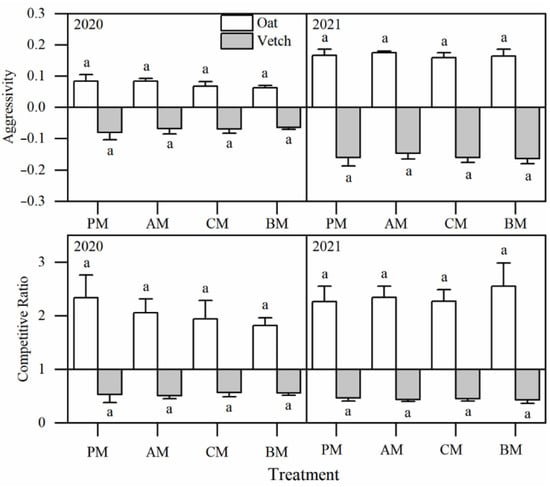
Figure 6.
The aggressiveness (A) and competitive ratio (CR) among different cropping systems over two years in Yanchi county, Ningxia, China. Note: PM: peer mixing; AM: alternate-row mixing; CM: cross mixing; BM: bar mixing. Different lowercase letters indicate a significant difference at p < 0.05.
The CRoat and CRvetch were not significantly influenced by different mixed cropping treatments across the two years of this study. In 2020, the CRoat values ranged from 1.82 to 2.38, and the CRvetch values ranged from 0.50 to 0.57. In 2021, the CRoat values ranged from 1.85 to 2.23, and the CRvetch values ranged from 0.48 to 0.61. There was no difference in the CRoat and CRvetch values among the PM, AM, CM, and BM systems. However, the average CRoat values were 279.6% higher than the CRvetch values over the experimental years (Figure 6, p < 0.05).
4. Discussion
4.1. Dry Matter and Crude Protein Production
Legume and cereal mixed cropping is an efficient way to improve forage yield []. Wang et al. [] found that the total forage productivity of mixed cropping is on average 28.7% higher than monocultures. Similar results were found in this study that the total forage yields of PM, AM, CM, and BM systems increased by 56.6%, 64.2%, 52.8%, and 46.4% compared with the average values of mono-cropped forage oat and common vetch (Table 5). These results may be attributed to the greater efficiency in the utilization of plant growth resources such as water, fertilization, and radiation energy in the mixed cropping systems []. However, Baxevanos et al. [] found that mixed cropping produced an average of 6.7% less forage yield than an oat monocropping system. This was primarily due to intra-specific competition in oats which is greater than interspecific competition. Additionally, our study showed that the mixed cropping of the forage oat/common vetch resulted in an average LER of 1.28, but there was no significant difference in aggressiveness and competition ratio (Figure 6), which indicated a more efficient production over monocultures in terms of the use of land resources. In this study, the dry matter yield values of the AM system was the highest among the mixed cropping treatments, which was greater than that of PM and CM systems (Table 5). This was likely because the competition of plant leaves for light resources interception was relatively strong in the PM and CM systems, especially at the later growing stage of forage oat. Li et al. [] showed that alternate-row mixing could increase forage productivity per unit area by optimizing the canopy structure to improve the light interception efficiency. Wang et al. [] have proven that the precipitation amount and distribution could have important impacts on the crop production. In this study, both forage oat and common vetch mixed croppings planted in 2020 had far more system dry matter yield than those mixed croppings planted in 2021, which might be due to the higher precipitation in 2020 than in 2021.
Previous studies have indicated that cereal and legume mixed cropping is an efficient way to improve crude protein yield [,]. Baxevanos et al. [] found that the mixed cropping system could increase crude protein yield on average by 27% compared to the oat monocropping. In the present study, the crude protein yield of the mixed cropping was 52.5–150.1% greater compared to monocropped forage oat and common vetch. These results can be attributed to the fact that the system dry matter yield and crude protein concentration increased when forage oat was mixed with common vetch. Additionally, this study showed that the AM system had the highest crude protein yield (1.33 t ha−1). This also mainly depended on the good performance in forage yield and crude protein concentration. Similarly, Sadeghpour et al. [] reported that when the contribution of annual medic (Medicago scutellata L.) in a mixed cropping was higher, then there was a significant increase in crude protein yield, which increased by 5.8% and 51.6% compared with the sole barley and sole annual medic.
4.2. The Performance of Forage Quality
Crude protein concentration (CP) is a crucial index for evaluating forage quality []. Compared to cereal crops, legume crops had a relatively higher crude protein concentration; thus, they are widely used to enhance the forage quality in mixed cropping systems []. Our study also showed that the CP content of common vetch was higher (27.5%) than that of forage oat. In this study, the forage oat and common vetch mixed cropping system produced significantly higher (26.5%) CP content as compared to forage oat monocropping (Figure 4). Sheri et al. [] also found that forage crude protein concentration in terms of dry matter increased by 132 g·kg−1 when the single cropping system was replaced by cereal–legumes mixed cropping. Additionally, previous studies also proved that neutral detergent fiber (NDF), acid detergent fiber (ADF), and relative feed value (RFV) are important indexes to evaluate forage quality [,]. Our study found that the NDF concentration of common vetch was lower than that of forage oat, which is consistent with Sheri et al. []. The system NDF concentration decreased when forage oat and common vetch were mixed, especially for the AM system (Figure 4). Iqbal et al. [] also found legumes mixed with cereal to improve forage quality by decreasing fiber content. In terms of ADF concentration, there were no significant differences among treatments in this study, which was also obtained by Sadeghpour et al. []. Compared to the SV system, the RFV decreased (21.1%) significantly when forage oat was mixed with common vetch; however, there was no significant difference between the mixed cropping system and SO system (Figure 4). Previous research reported that the RFV was primarily related to NDF and ADF concentrations [,]. In this study, the system NDF concentration decreased, but without significant difference in ADF concentration when forage oat and common vetch were mixed.
4.3. The Performance of the Interspecific Competition
The land equivalent ratio (LER) was used to assess the yield advantage in the intensified cropping system []. Yu et al. [] reported an average LER of cereal–legume mixtures as 1.17, indicating land and resource use advantages resulting from the combination of cereals with legumes. Our study also found that all mixed cropping treatments had a 2 y average LER greater than 1.00, which indicated that 20–37% more farmland would be required by sole forage oat and sole common vetch to equate the yields of forage oat and common vetch in mixed cropping. In this study, the LER in the AM system was higher by 7.9%, 8.7%, and 14.2% than in the PM, CM, and BM systems, respectively (Table 6, Figure 5). Similar results were found by Li et al. []. The competition ratio and aggressiveness indexes were determined to evaluate the competition between cereals and legumes in a mixed cropping system []. Gong et al. [] reported that broomcorn millet (Panicum miliaceum L.) was regarded as the dominant crop in broomcorn millet/mung bean (Vigna radiata L.) mixed cropping systems. Similar results were found in the present study, as shown by the CRoat and Aoat competitive indicators, which clearly indicated that forage oat was the dominant species. In addition, our results revealed that the CRoat, CRvetch, Aoat, and Avetch were not significantly influenced by different mixed cropping treatments (Figure 6). However, a previous study showed that the CR values of maize and soybean (Glycine max L.) have a significant difference in mixed cropping systems []. This result can be attributed to the distinct morphological differences between maize and soybean and maize/soybean mixed cropping exhibited strong interspecific competition during the crop growth period.
5. Conclusions
This study has found that mixed cropping is an effective approach to improve system forage yield and forage quality of the forage oats and common vetch in the arid region of China. The system forage production and crude protein yield increased by 13.4–202.8% and 52.5–150.1%% when forage oat was mixed with common vetch. Specifically, compared to the PM, CM, BM, SO, and SV systems, the system forage dry matter and crude protein production of the AM system had a better performance. The LER was greater in all mixed cropping treatments, which indicated mixed cropping advantages in land use efficiency. Forage oat was the dominant crop and had higher aggressiveness and competitive ratios compared to common vetch, but without a significant difference in the aggressiveness and competitive ratio in mixed cropping systems. Therefore, the AM mixed cropping system is suggested for use to alleviate forage shortage and improve forage quality in the arid region of China.
Author Contributions
Conceptualization, B.W., J.D. and J.L.; Methodology, B.W., J.D. and J.L.; Validation, B.W., J.D. and J.L.; Formal analysis, B.W., T.W., W.N. and Q.F.; Investigation, B.W., T.W., W.N., Q.F. and J.L.; Resources, J.L.; Data curation, B.W. and J.L.; Writing—original draft, B.W.; Writing—review & editing, J.D. and J.L.; Visualization, B.W.; Supervision, J.L.; Project administration, J.L.; Funding acquisition, J.L. All authors have read and agreed to the published version of the manuscript.
Funding
This research was funded by the Key Research and Development Program of Ningxia Province (2020BBF02001).
Institutional Review Board Statement
Not applicable.
Informed Consent Statement
Not applicable.
Data Availability Statement
Not applicable.
Conflicts of Interest
The authors declare no conflict of interest.
References
- Delgado, C.; Rosegrant, M.; Steinfeld, H.; Ehui, S.; Courbois, C. Livestock to 2020: The Next Food Revolution. Outlook Agric. 2001, 30, 27–29. [Google Scholar] [CrossRef]
- Ningxia Provincial Bureau of Statistics NBS Survey Office in Ningxia. Ning Xia Statistical Year Book; China Statistics Press: Beijing, China, 2018. [Google Scholar]
- Guan, Z.X.; Naer, K.Z.; Zhu, Y.Q.; Zheng, W.; Liu, Y.H.; Aili, F.R. Effect of different sowing patterns on production performance and soil nutrients in Avena sativa + Vicia sativa mixtures. Pratacultural Sci. 2019, 36, 772–784. [Google Scholar]
- Wang, Q.S.; Sun, D.B.; Hao, H.; Zhao, X.J.; Hao, W.P.; Liu, Q. Photosynthetically active radiation determining yields for an intercrop of maize with cabbage. Eur. J. Agron. 2015, 69, 32–40. [Google Scholar] [CrossRef]
- Li, R.; Zhang, Z.X.; Tang, W.; Huang, Y.F.; Coulter, A.; Nan, Z.B. Common vetch cultivars improve yield of oat row intercropping on the Qinghai-Tibetan plateau by optimizing photosynthetic performance. Eur. J. Agron. 2020, 117, 126088. [Google Scholar] [CrossRef]
- Wang, F.Q.; Xiang, J.; Guo, B.G.; Yu, C.Q.; Shen, Z.X.; Shao, X.M. Establishment of Vicia sativa-Secale cereale mixed and intercropping methods for the Lhasa valley area. Acta Prataculturae Sin. 2018, 27, 39–49. [Google Scholar]
- Yang, F.; Huang, S.; Gao, R.; Liu, W.G.; Yong, T.W.; Wang, X.C.; Wu, X.L.; Yang, W.Y. Growth of soybean seedlings in relay strip intercropping systems in relation to light quantity and red:far-red ratio. Field Crops Res. 2014, 155, 245–253. [Google Scholar] [CrossRef]
- Mao, L.L.; Zhang, L.Z.; Li, W.Q.; Wopke, V.D.W.; Sun, J.H.; Huub, S.; Li, L. Yield advantage and water saving in maize/pea intercrop. Field Crops Res. 2012, 138, 11–20. [Google Scholar] [CrossRef]
- Lithourgidis, A.S.; Dordas, C.A.; Damalas, C.A.; Vlachostergios, D.N. Annual intercrops: An alternative pathway for sustainable agriculture. Aust. J. Crop Sci. 2011, 5, 396–410. [Google Scholar]
- Dhima, K.V.; Lithourgidis, A.S.; Vasilakoglou, I.B.; Dordas, C.A. Competition indices of common vetch and cereal intercrops in two seeding ratio. Field Crops Res. 2006, 100, 249–256. [Google Scholar] [CrossRef]
- Bedoussac, L.; Journet, E.-P.; Hauggaard-Nielsen, H.; Naudin, C.; Corre-Hellou, G.; Jensen, E.S.; Prieur, L.; Justes, E. Ecological principles underlying the increase of productivity achieved by cereal-grain legume intercrops in organic farming. A review. Agron. Sustain. Dev. 2015, 35, 911–935. [Google Scholar] [CrossRef]
- Carr, P.M.; Horsley, R.D.; Poland, W.W. Barley, oat, and cereal-pea mixtures as dryland forages in the Northern Great Plains. Agron. J. 2004, 96, 677–684. [Google Scholar] [CrossRef]
- Kim, W.H.; Kim, K.Y.; Jung, M.W.; Ji, H.C.; Lim, Y.C.; Seo, S.; Kim, J.D.; Yoon, B.K.; LeeWon, H.W. Dry matter yield and forage quality at mixture of annual legumes and Italian ryegrass on Paddy Field. J. Korean Soc. Grassl. Sci. 2011, 31, 33–38. [Google Scholar] [CrossRef][Green Version]
- Yang, C.H.; Fan, Z.L.; Chai, Q. Agronomic and economic benefits of pea/maize intercropping systems in relation to N fertilizer and maize density. Agronomy 2018, 8, 52. [Google Scholar] [CrossRef]
- Qian, X.; Zang, H.D.; Xu, H.S.; Hu, Y.G.; Ren, C.Z.; Guo, L.C.; Wang, C.L.; Zeng, Z.H. Relay strip intercropping of oat with maize, sunflower and mung bean in semi-arid regions of Northeast China: Yield advantages and economic benefits. Field Crops Res. 2018, 223, 33–40. [Google Scholar] [CrossRef]
- Wang, S.; Chen, G.; Yang, Y.D.; Zeng, Z.H.; Hu, Y.G.; Zang, H.D. Sowing ratio determines forage yields and economic benefits of oat and common vetch intercropping. Agron. J. 2021, 113, 2607–2617. [Google Scholar] [CrossRef]
- Li, R.; Zhang, Z.X.; Tang, W.; Huang, Y.F.; Nan, Z.B. Effect of row configuration on yield and radiation use of common vetch-oat strip intercropping on the Qinghai-Tibetan plateau. Eur. J. Agron. 2021, 128, 126290. [Google Scholar] [CrossRef]
- Baxevanos, D.; Tsialtas, I.T.; Voulgari, O.; Pankou, C.I.; Vlachostergios, D.; Lithourgidis, A.S. Oat genotypic requirement for intercropping with vetch under Mediterranean conditions. J. Agric. Sci. Camb. 2020, 158, 695–706. [Google Scholar] [CrossRef]
- Wang, Z.K.; Jiang, H.L.; Shen, Y.Y. Forage production and soil water balance in oat and common vetch sole crops and intercrops cultivated in the summer-autumn fallow season on the Chinese Loess Plateau. Eur. J. Agron. 2020, 115, 126042. [Google Scholar] [CrossRef]
- Zhang, Z.H.; Duan, J.C.; Wang, S.P.; Luo, C.Y.; Zhu, X.X.; Xu, B.; Chang, X.F.; Cui, S.J. Effects of seeding ratios and nitrogen fertilizer on ecosystem respiration of common vetch and oat on the Tibetan plateau. Plant Soil 2013, 362, 287–299. [Google Scholar] [CrossRef]
- Luo, C.Y.; Wang, S.P.; Zhao, L.; Xu, S.X. Seeding ratios and phosphate fertilizer on ecosystem carbon exchange of common vetch and oat. Nutr. Cycl. Agroecosystems 2017, 109, 149–160. [Google Scholar] [CrossRef]
- Tsialtas, I.T.; Baxevanos, D.; Vlachostergios, D.N.; Dordas, C.; Lithourgidis, A. Cultivar complementarity for symbiotic nitrogen fixation and water use efficiency in pea-oat intercrops and its effect on forage yield and quality. Field Crops Res. 2018, 226, 28–37. [Google Scholar] [CrossRef]
- Van Soest, P.J.; Robertson, J.B.; Lewis, B.A. Methods for Dietary Fiber, Neutral Detergent Fiber, and Nonstarch Polysaccharides in Relation to Animal Nutrition. J. Dairy Sci. 1991, 74, 3583–3597. [Google Scholar] [CrossRef] [PubMed]
- Brabson, J.A. The kjeldahl method for organic nitrogen. J. Aoac. Int. 1966, 49, 481. [Google Scholar] [CrossRef]
- Mead, R.; Willey, R.W. The concept of a ‘Land Equivalent Ratio’ and advantages in yields from intercropping. Exp. Agric. 1980, 16, 217–228. [Google Scholar] [CrossRef]
- Zhu, Y.H.; Song, X.L.; Wang, X.F.; Chen, W.F.; Niu, X.C. The yield increase and land improvement effects of different sorghum/wild soybean intercropping patterns on reclaimed coastal salt pans. J. Soil Sediment. 2021, 45, 731–744. [Google Scholar] [CrossRef]
- Chai, Q.; Qin, A.Z.; Gan, Y.T.; Yu, A.Z. Higher yield and lower carbon emission by intercropping maize with rape, pea, and wheat in arid irrigation areas. Agron. Sustain. Dev. 2014, 34, 535–543. [Google Scholar] [CrossRef]
- Gong, X.W.; Dang, K.; Lv, S.M.; Zhao, G.; Tian, L.X.; Luo, Y.; Feng, B.L. Interspecific root interactions and water-use efficiency of intercropped proso millet and mung bean. Eur. J. Agron. 2019, 115, 126034. [Google Scholar] [CrossRef]
- Baxevanos, D.; Tsialtas, I.T.; Vlachostergios, D.Ν.; Hadjigeorgiou, I.; Dordas, C.; Lithourgidis, A. Cultivar competitiveness in pea-oat intercrops under Mediterranean conditions. Field Crops Res. 2017, 214, 94–103. [Google Scholar] [CrossRef]
- Hauggaard-Nielsen, H.; Ambus, P.; Jensen, E.S. The comparison of nitrogen use and leaching in sole cropped versus intercropped pea and barley. Nutr. Cycl. Agroecosystems 2003, 65, 289–300. [Google Scholar] [CrossRef]
- Dordas, C.A.; Vlachostergios, D.N.; Lithourgidis, A.S. Growth dynamics and agronomic economic benefits of pea-oat and pea-barley intercrops. Crop Pasture Sci. 2012, 63, 45–52. [Google Scholar] [CrossRef]
- Sadeghpour, A.; Jahanzad, E.; Esmaeili, A.; Hosseini, M.B.; Hashemi, M. Forage yield, quality and economic benefit of intercropped barley and annual medic in semi-arid conditions: Additive series. Field Crops Res. 2013, 148, 43–48. [Google Scholar] [CrossRef]
- Lithourgidis, A.S.; Vasilakoglou, I.B.; Dhima, K.V.; Dordas, C.A.; Yiakoulaki, M.D. Forage yield and quality of common vetch mixtures with oat and triticale in two seeding ratios. Field Crops Res. 2006, 99, 106–113. [Google Scholar] [CrossRef]
- Strydhorst, S.M.; King, J.R.; Lopetinsky, K.J.; Neil-Harker, K. Forage potential of intercropping barley with faba bean, lupin, or field pea. Agron. J. 2008, 100, 182–190. [Google Scholar] [CrossRef]
- Iqbal, M.A.; Hamid, A.; Ahmad, T.; Siddiqui, M.H.; Hussain, I.; Ali, S.; Ali, A.; Ahmad, Z. Forage sorghum-legumes intercropping: Effect on growth, yields, nutritional quality and economic returns. Bragantia 2019, 78, 82–95. [Google Scholar] [CrossRef]
- Yu, Y.; Stomph, T.J.; Makowski, D.; Zhang, L.Z.; Werf, W.V.D. A meta-analysis of relative crop yields in cereal/legume mixtures suggests options for management. Field Crops Res. 2016, 198, 269–279. [Google Scholar] [CrossRef]
- Gong, X.W.; Dang, K.; Lv, S.M.; Zhao, G.; Wang, H.L.; Feng, B.L. Interspecific competition and nitrogen application alter soil ecoenzymatic stoichiometry, microbial nutrient status, and improve grain yield in broomcorn millet/mung bean intercropping systems. Field Crops Res. 2021, 270, 108227. [Google Scholar] [CrossRef]
- Raza, M.A.; Feng, L.Y.; Werf, W.; Iqbal, N.; Khan, I.; Khan, A.; Din, A.M.U.; Naeem, M.; Meraj, T.A.; Hassan, M.J.; et al. Optimum strip width increases dry matter, nutrient accumulation, and seed yield of intercrops under the relay intercropping system. Food Energy Secur. 2020, 9, e199. [Google Scholar] [CrossRef]
Publisher’s Note: MDPI stays neutral with regard to jurisdictional claims in published maps and institutional affiliations. |
© 2022 by the authors. Licensee MDPI, Basel, Switzerland. This article is an open access article distributed under the terms and conditions of the Creative Commons Attribution (CC BY) license (https://creativecommons.org/licenses/by/4.0/).