Article

Hydrological Drought-Indexed Insurance for Irrigated Agriculture in a Highly Regulated System

by
Miguel Angel Valenzuela-Mahecha
1,2,*,
Manuel Pulido-Velazquez
1 and
Hector Macian-Sorribes
1
1
Research Institute of Water and Environmental Engineering (IIAMA), Universitat Politècnica de València (UPV), 46022 Valencia, Spain
2
Civil and Agricultural Engineering Department, Universidad Nacional de Colombia (UNAL), Bogotá D.C. 111321, Colombia
*
Author to whom correspondence should be addressed.
Agronomy 2022, 12(9), 2170; https://doi.org/10.3390/agronomy12092170
Submission received: 19 July 2022 / Revised: 1 September 2022 / Accepted: 1 September 2022 / Published: 13 September 2022

Abstract

:
Water scarcity is an increasingly recurring problem for irrigated agriculture in Mediterranean regions. It is, therefore, necessary to establish technical and financial measures to enable irrigators to deal with this problem. This study presents a new index-based drought insurance scheme in an irrigation district in the Jucar river basin in Spain, a highly regulated water system. Three insurance scheme options were evaluated and, the values of the fair risk premiums, the maximum compensation, and the deductible franchise were established. These insurance schemes were designed in agreement with the preexisting drought system operating rules to reduce moral hazard and adverse selection. Risk-reducing and effective evaluation methods were used to determine the insurance coverage’s viability for irrigators: standard deviation gross margin, minimum gross margin, and RMSL. The proposed insurances were also evaluated using synthetic hydrological time series generated with a stochastic ARMA model through a basin-wide water resource simulation model developed in the DSS Shell AQUATOOL. Financial indicators, such as the basis risk and claim ratio were applied to analyze the economic feasibility for insurance companies. The results show that a suitable and efficient option is an early-bird contract combined with a trigger of emergency or alert state in a multi-year contract. This type of specialized insurance helps to fill the existing gap in traditional insurance schemes for irrigated crops and offered additional coverage to farmers under drought and water scarcity conditions.

1. Introduction

Irrigated agriculture plays a key role in food production, and therefore, in the food and nutrition security of the world’s population [1,2]. With the impact of climate change, the already low profitability of most rainfed crops, as well as their vulnerability to climatic events (drought, heatwaves), will continue to increase the pressure to irrigate more land [3]. Extreme weather events, major biodiversity loss and ecosystem collapse, food crises, water crises, and, the failure of climate change mitigation and adaptation are currently the main global threats [4]. These risks affect the agricultural sector directly since it is not only the productive sector with the highest use and demand for water resources [5] but is also the most exposed to droughts and water scarcity. This makes it necessary to implement production schemes that allow farmers to produce more food while using the minimum amount of water possible. It is also crucial to create risk mitigation strategies that contemplate the technical and economic implications that their implementation would entail.
The agricultural production sector is affected by a variety of drought types: a meteorological drought takes place when there is a continuous shortage of rainfall; agricultural drought is associated with the deficit of moisture in the root zone of a crop in a certain place and time and a hydrological drought entails the decrease in the availability of surface and groundwater in a management system during a given period (compared to the average values) [6,7,8]. Irrigated agriculture mostly faces the risk of hydrological drought, since its water supply depends directly on the water available in regulatory reservoirs [9].
The sustainable management of water resource systems requires both environmental and financial sustainability. Therefore, economic factors must be considered in the rational decision-making about the use of water [10]. For instance, the European Union’s Water Framework Directive (WFD) already contemplates these factors in its proposal to achieve sustainability and manage water scarcity [11,12,13]. At the watershed level, economic instruments, such as subsidies, water prices, water banks, and water markets have been studied [11,14,15,16,17]. Agricultural insurance has been successfully implemented as a financial instrument of agro-climatic risk management. It aims to be a system of protection for agricultural production by transferring different risks, such as drought events, hailstorms, winds, rains, and frost, to the insurance company [18,19].
In recent years, indexed or parametric insurance plans have been increasingly applied worldwide. The compensation scheme of these plans is based on the behavior of a certain index or variable linked to the risk to be covered by the insurance company, that is, payment will be made when values above or below certain pre-established thresholds of said index or variable considered are reported [18,20,21]. However, this insurance model has only been standardized for rainfed crops, and its application to irrigated crops is still being discussed. The relatively high overall costs of actuarial data capture, risk classification, moral hazard monitoring, and claim validation have hindered the development of conventional agricultural insurance markets, which is why indexed insurance is proposed as a low-cost alternative to conventional insurance products [22,23,24,25,26]. The difficulty of applying indexed insurance schemes lies in designing indexes or triggers that correlate as close as possible with the occurrence of claims. The chosen index must have a high correlation with potential losses and meet quality standards, such as being transparent, verifiable, easily measurable, and timely, and officially reported [24,27,28,29,30,31,32].
There are studies related to indexed insurance in irrigation districts using various index types, such as the river flow accumulations index [33], the Standardized Precipitation Index (SPI) [34], and drought indexes established in the river basin management plan [35,36], the volume of water stored in reservoirs [31,37], or a combination of rainfall and the water storage available for irrigation [38].
The Jucar river basin, the main watershed in the Valencian region, is a highly regulated Mediterranean basin with a large share of water use for irrigation (around 80%) and recurrent long and severe droughts. The economic losses caused by meteorological disasters in the Valencian region have increased by 95 million Euros in the last ten years, reaching values of almost 380 million in 2018. During this period the crops of the region were affected mostly by heavy rains and hail (50%). The losses caused by drought events were around 15%. This has led farmers to adopt conventional insurance. The total insured production has oscillated from 2.5 to 3.0 million tons every year during the last 15 years [39]. There is already a tradition in the development of institutions and multi-actor partnerships for drought management [40] in the basin, with a well-established and innovative set of drought indicators [41,42] that trigger a set of water management measures according to the river basin drought plan.
This paper proposes an alternative insurance scheme that allows farmers to face the economic impacts due to water scarcity events in irrigation districts, especially in those located in highly regulated basins, such as that of the Jucar river. This proposal is based on the implementation of indexed insurance. For the insurance design, the Jucar river basin Scarcity State index was used in three insurance scheme options: (1) variable premium and/or variable franchise based on the forecast of water availability for the insured irrigation campaign, (2) multiannual insurance contract, and (3) advance contract with a constant premium. The viability of the insurance scheme, both for the insurance companies and the beneficiaries, is assessed using financial indicators.

2. Materials and Methods

The implementation framework for the hydrological index insurance is shown in Figure 1. It consists of two main processes: the insurance design and its subsequent evaluation. It begins with general information about the basin, system state variables (such as reservoir storage and inflows), and Precipitation, which are combined and weighted to estimate the drought state index. At the same time, the irrigation district is characterized by the historical data on the crops (sown area, production, yields, production costs, and revenue), and the historical water delivered allows for an economic assessment of the drought impact.
For the insurance sustainability evaluation, a basin-level operation system simulation is performed. It begins with the development of an autoregressive stochastic time series model to forecast the inflows of the system and their interaction with changes in the storage in the main reservoirs. This simulation also includes demand units (agricultural, urban, industrial and ecological flows) as well as all the normativity and regulations that exist within the management of the water resource in the basin. A technical and financial sustainability assessment of the proposed insurance is made using economic indicators. If this design option meets the defined economic indicators, it is possible to validate the proposed design scheme.
The estimation of a pure (actuarially fair) hydrological drought insurance premium is usually done in two steps: (i) quantifying the risk associated with the irrigation water allocated to farmers, and (ii) quantifying the impact of water allocation on the farmers’ income or revenue [36]. Afterward, premium rates, deductible franchises, and insurance contract periods of different insurance schemes are compared to design the best-fitting alternative.
To implement the insurance scheme proposed in this paper, the following principles must be taken into account: (1) the Drought Index must be included in the River Basin Management Plan; (2) the operational regulations and supply reduction rates defined in the drought plans should not change during the term of the insurance contract; (3) the administrators of the irrigation districts should be the ones that hold the insurance policy instead of each farmer; [9,31]; (4) only irrigation districts with a single source of water (surface) are fit for this insurance scheme; (5) although other factors—such as crop variety, phenological phase, the chemical and physical soil qualities, nutrition, and high temperatures—determine crop yields in some measure, water shortage should be considered the primary cause of diminishing crop yields.

2.1. Economic Assessment of Drought Impacts

This analysis is based on the study carried out by [31], where they tackle some of the main problems that arise from the design of indexed insurance, such as base risk, moral hazard, and adverse selection [43,44,45,46,47].
Initially, is necessary to determine the relationship between the selected hydrological drought index DSI and the historical water deliveries in the irrigation district (wd) during the period to be analyzed. Afterward, the water shortage (wst) in the irrigation district in m3/ha is measured by subtracting the water delivered (wd) in a given year (t) from the guaranteed water delivered (GWA). GWA is the average water delivered to the irrigation district in the period of analysis, which depends on water rights, water availability and the system operation. By comparing the volume of delivered water with the volume of stored water and the consolidated demand, the years in which there is a water shortage can be identified. Once the periods of water scarcity have been identified, the economic impact generated by droughts in the irrigation districts can be established.
To estimate the compensation that a farmer would receive from this insurance scheme, the Net Value of Agricultural Production (NVAPi) had to be calculated. To do this, the area sown (sic), yield (yc), and prices (pc) for each crop (c)were considered [48]. There exist C crops, indexed by c = 1, …, C. Afterward, the irrigation costs in each crop scenario (VCI) were subtracted from this value:
V A P i = c = 1 C s i c y c p c
V C I i = c = 1 C s i c V C I i c
N V A P i = V A P i V C I i
The NVAPi was calculated for two hypothetical scenarios based on the drought State Index DSI in the River Basin Agency: (a) a normal state, where DSI > 0.5, and (b) an emergency state, where DSI < 0.15. To this end, the value of the water (wvi) in years in which a state of emergency was declared was compared with these values in a normal scenario I where the total water needed for irrigation can be allocated:
w v i = w v i ( w d i ) = N V A P I N V A P i   Wst i
w v t = w v t ( w d t )
where wdi and NVAPi are water delivered and the net value of agricultural production in scenario i, respectively, and NVAPI is the net value of agricultural production in a normal scenario with fully guaranteed water allocation.

2.2. Design of the Insurance Scheme

The compensation that a farmer would receive (€/ha) in a given year (t) results from multiplying wst by a unit compensation equal to the value of water (wv) in €/m3, where the deductible franchise (γ) is the minimum amount of loss that can be incurred before insurance coverage applies [31,49].
i n d t = { 0 ,     i f   w d t ( 1 γ ) G W A w s t w v t     i f   w d t < ( 1 γ ) G W A
That is, compensation is triggered by the DSI:
( 1 γ ) G W A = f ( D S I = T r i g g e r )
The liability or maximum compensable value of the insurance scheme in €/ha is determined from the expression:
L i a b i l i t y = G W A   w v t
Finally, the insurance premium is calculated based on the expected compensation, where t represents the year in which compensation would need to be paid and T is the total number of years of the insurance analysis.
P r e m i u m = E ( I n d t ) = 1 T t = 1 t = T I n d t
This methodology is implemented in the three hydrological drought insurance options described in Table 1.

2.3. Selection of the Most Appropriate Insurance Plan

In agriculture index-based insurance, the high risk-reducing effectiveness of the contract was most frequently assessed from a minimized variance or downside risk in the income, with and without insurance [32]. Financial indicators are used to determine the insurance scheme’s viability, both for the insurance companies and the beneficiaries. Risk-reducing and effective evaluation methods were used to determine the insurance coverage’s viability for irrigators: standard deviation gross margin, minimum gross margin, and mean root square loss RMSL (Table 2).
In the analysis, it is important to consider additional loadings on the fair premiums of 10% and 37% which may represent acquisition effort, administrative expense, risk-bearing (i.e., reinsurance costs), and profit allocation [37].

Simulation of the Insurance Design through a Water Resource System Model

The feasibility of the designed insurance schemes, as well as the potential benefits for both farmers and insurers, is determined through a retrospective analysis that calculates the value of the claims in a hypothetical scenario where coverage had been in operation during previous years [55]. For this, financial indicators, such as the basis risk and claim ratio let insurance companies analyze their feasibility (Table 2).
To evaluate these insurance schemes, synthetic inflow time series are generated with a stochastic model and included in a simulation model that includes drought and water management procedures of the water resource system. This DSS is used to analyze the impacts of droughts, including management rules based on drought indicators [56,57,58].
If the claim ratio were less than 1, it would indicate that the premium collected would be higher than the compensation paid, and therefore, the insurer would make a profit. Were it to be 1, this would imply a balance between the compensation paid and the premium. Were it to be higher than 1, the insurer would incur some losses in as much as the compensation paid would be greater than the premium collected during the evaluated period.

2.4. Case Study

2.4.1. Description

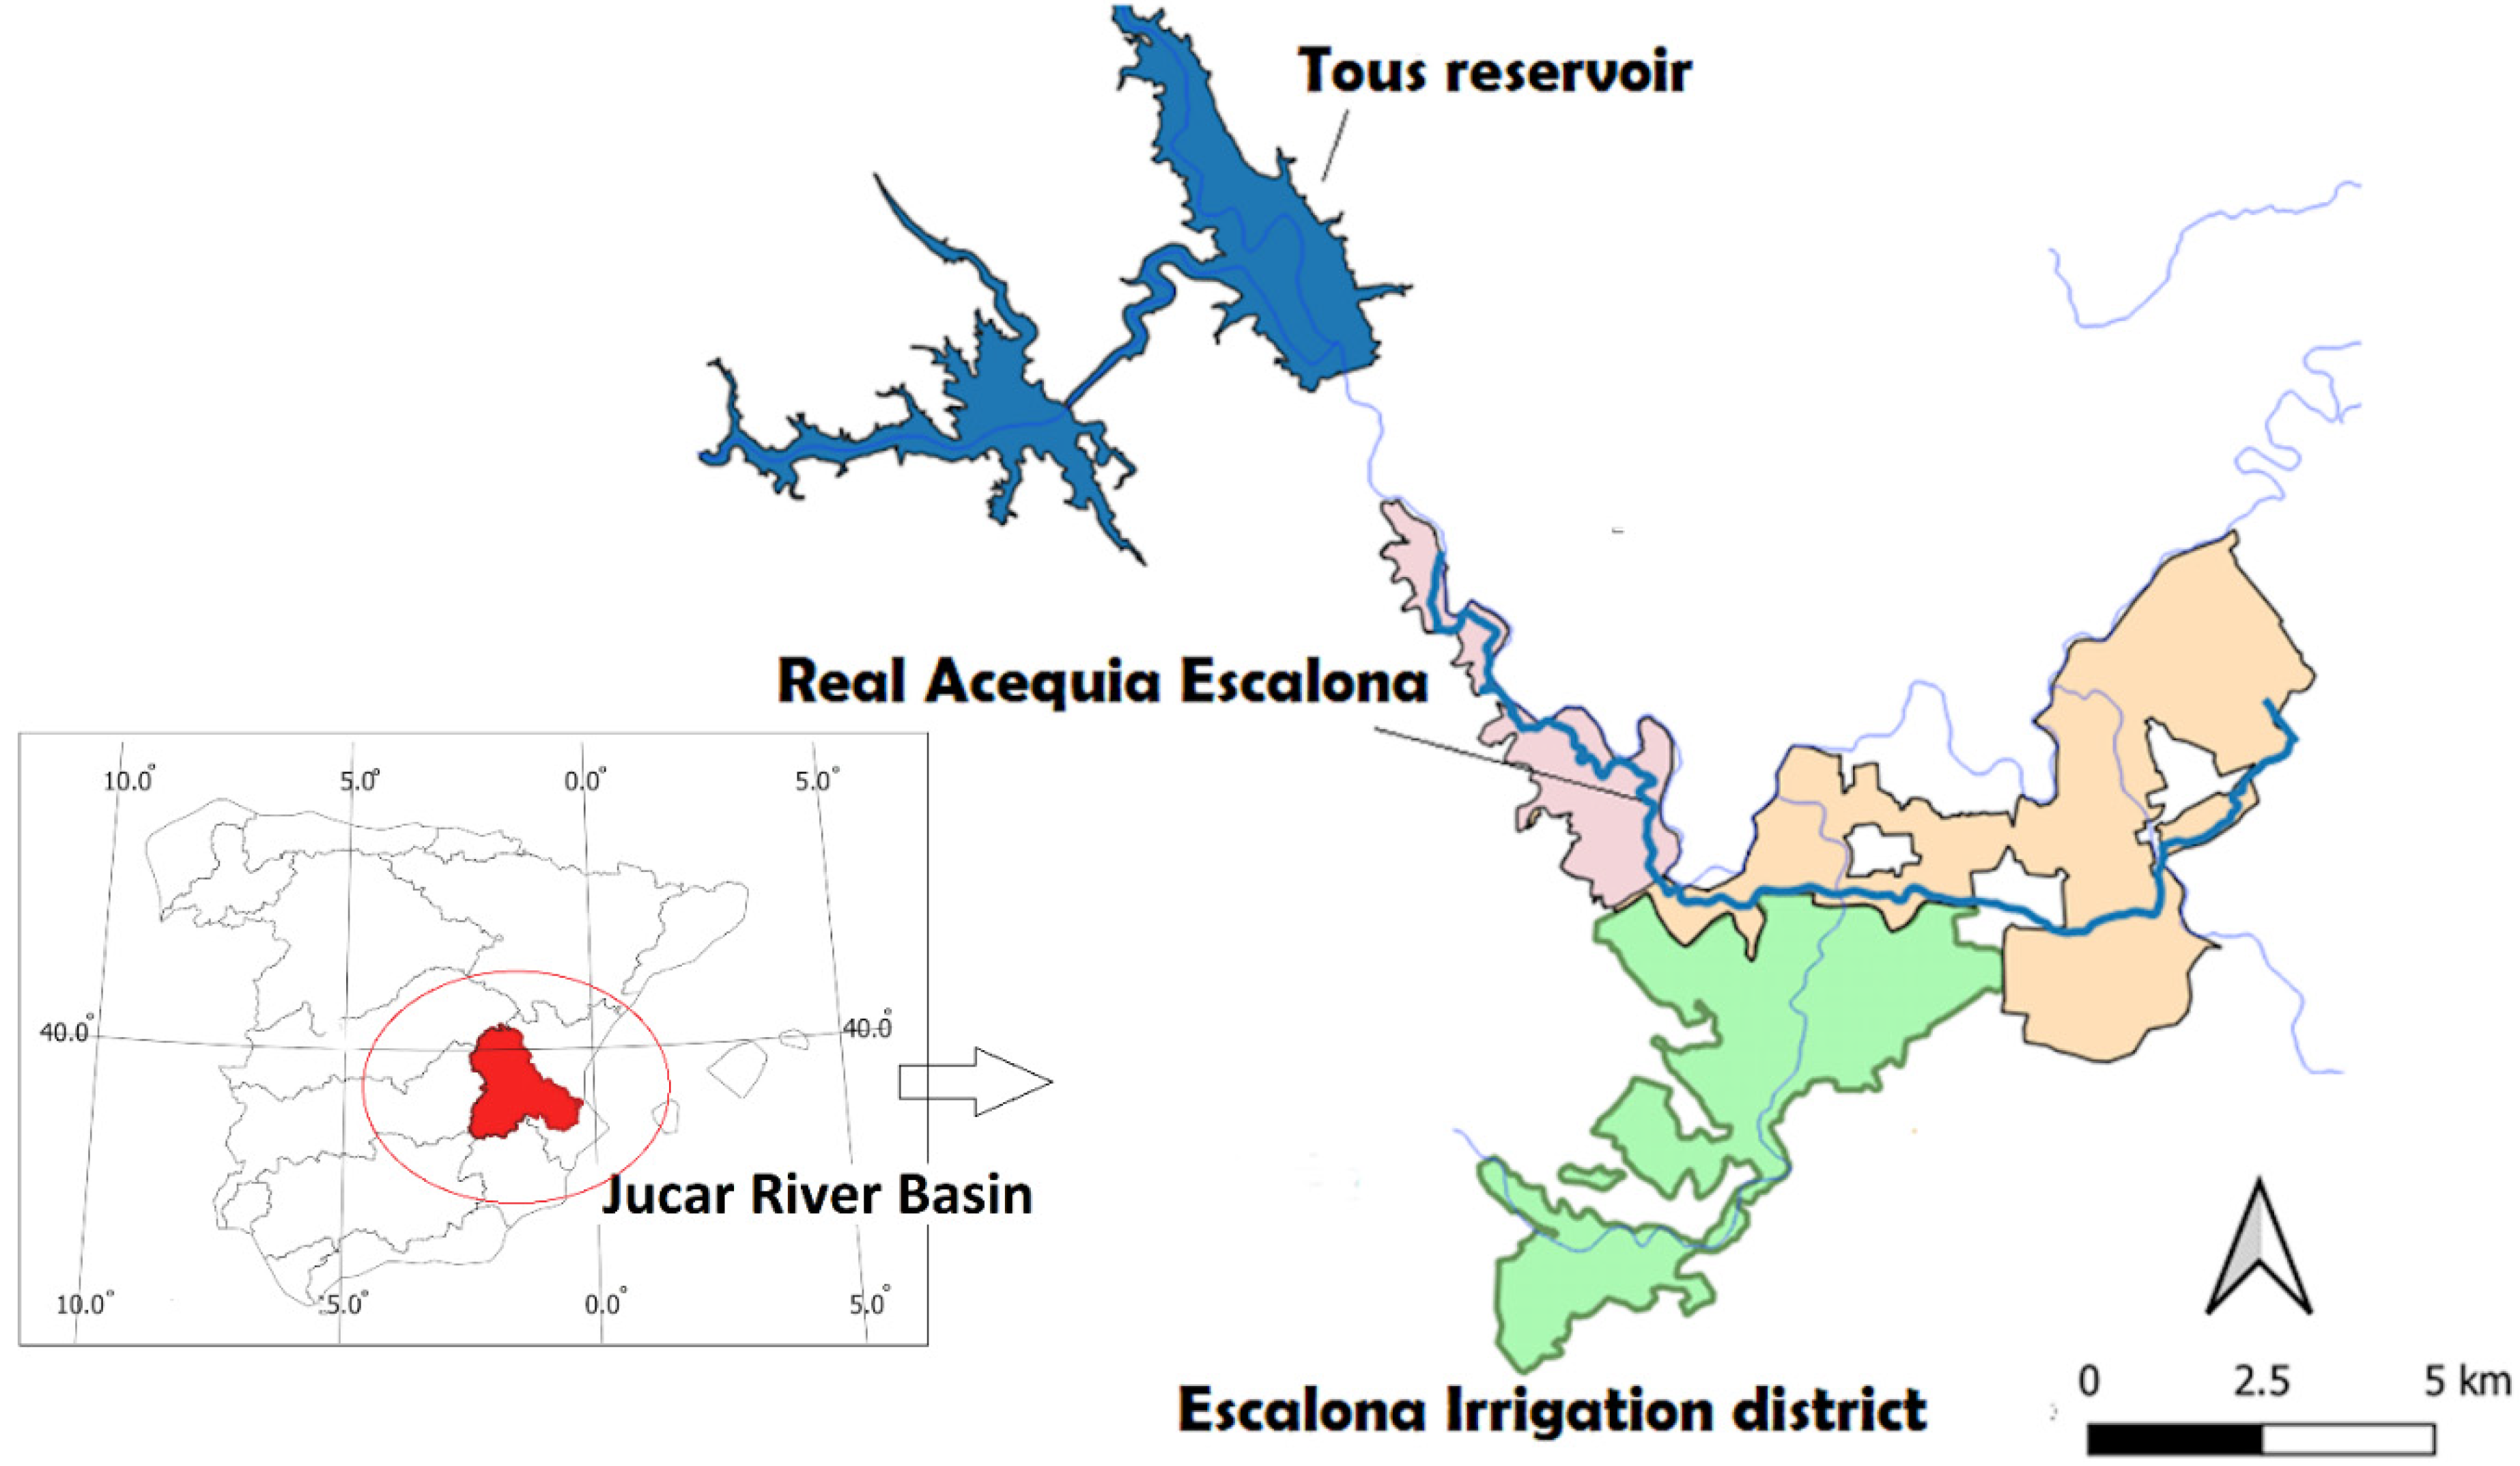
The Real Acequia de Escalona (RAE), an irrigation canal of 23 km located in the lower Jucar river basin Figure 2, brings water from a dam located downstream of the Tous reservoir and ends in the municipality of Villanueva de Castellón (Source: https://sequiaescalona.org/quienes-somos) (accessed on 15 September 2021). Four irrigation districts (Comunidad de Regantes, CR), about 2700 ha in total, benefit from the water provided by the RAE: CR Real Acequia de Escalona (66.07%), CR Sumacárcer (12.69%), CR del Valle de Cárcer y Sellent (12.58%) and CR La Defensa de los Derechos de Riego de las Tierras del Valle de Cárcer (8.66%). We chose two citrus crops (orange and tangerine) to analyze in this study since they are the most representative in the area (approximately 90% of the total crops). The irrigation districts in the RAE have particular qualities whose analysis may be very useful for insurance design. For instance, these communities have the right to administer and distribute the water allocated to them, as well as a legal status that grants them the economic management of the water in that area.

2.4.2. Drought State Index

The current drought indicator system in Spain is determined by an operational index, the Drought State Index (DSI). This index reflects the amount of available water for the end-users in each month, concerning the amount of available water for that month historically. The index consists of a combination of some selected control variables distributed throughout the river basin, including storage in surface reservoirs; piezometric levels; river discharges; reservoir inflows, and precipitations in those areas where they are significant in relation to water resources availability [59,60]. This is done by relating ten measurements of representative variables of the river basin (precipitation (one variable), piezometric levels (three variables), flows (four variables), and storage (two variables). Previously, to give a dimensionless numerical value that allows them to be compared on a single scale, all variables should be stationarized in order to filter out the seasonal component and avoid the influence of the annual meteorological cycle in the calculation of the indicator in a given month. The DSI is then calculated as [59]:
i f   V i V m e d ,     D S I = 1 2 [ 1 + V i V m e d V p 95 V m e d ]
i f   V i < V m e d ,     D S I =   V i V p 5 2 ( V m e d V p 5 )
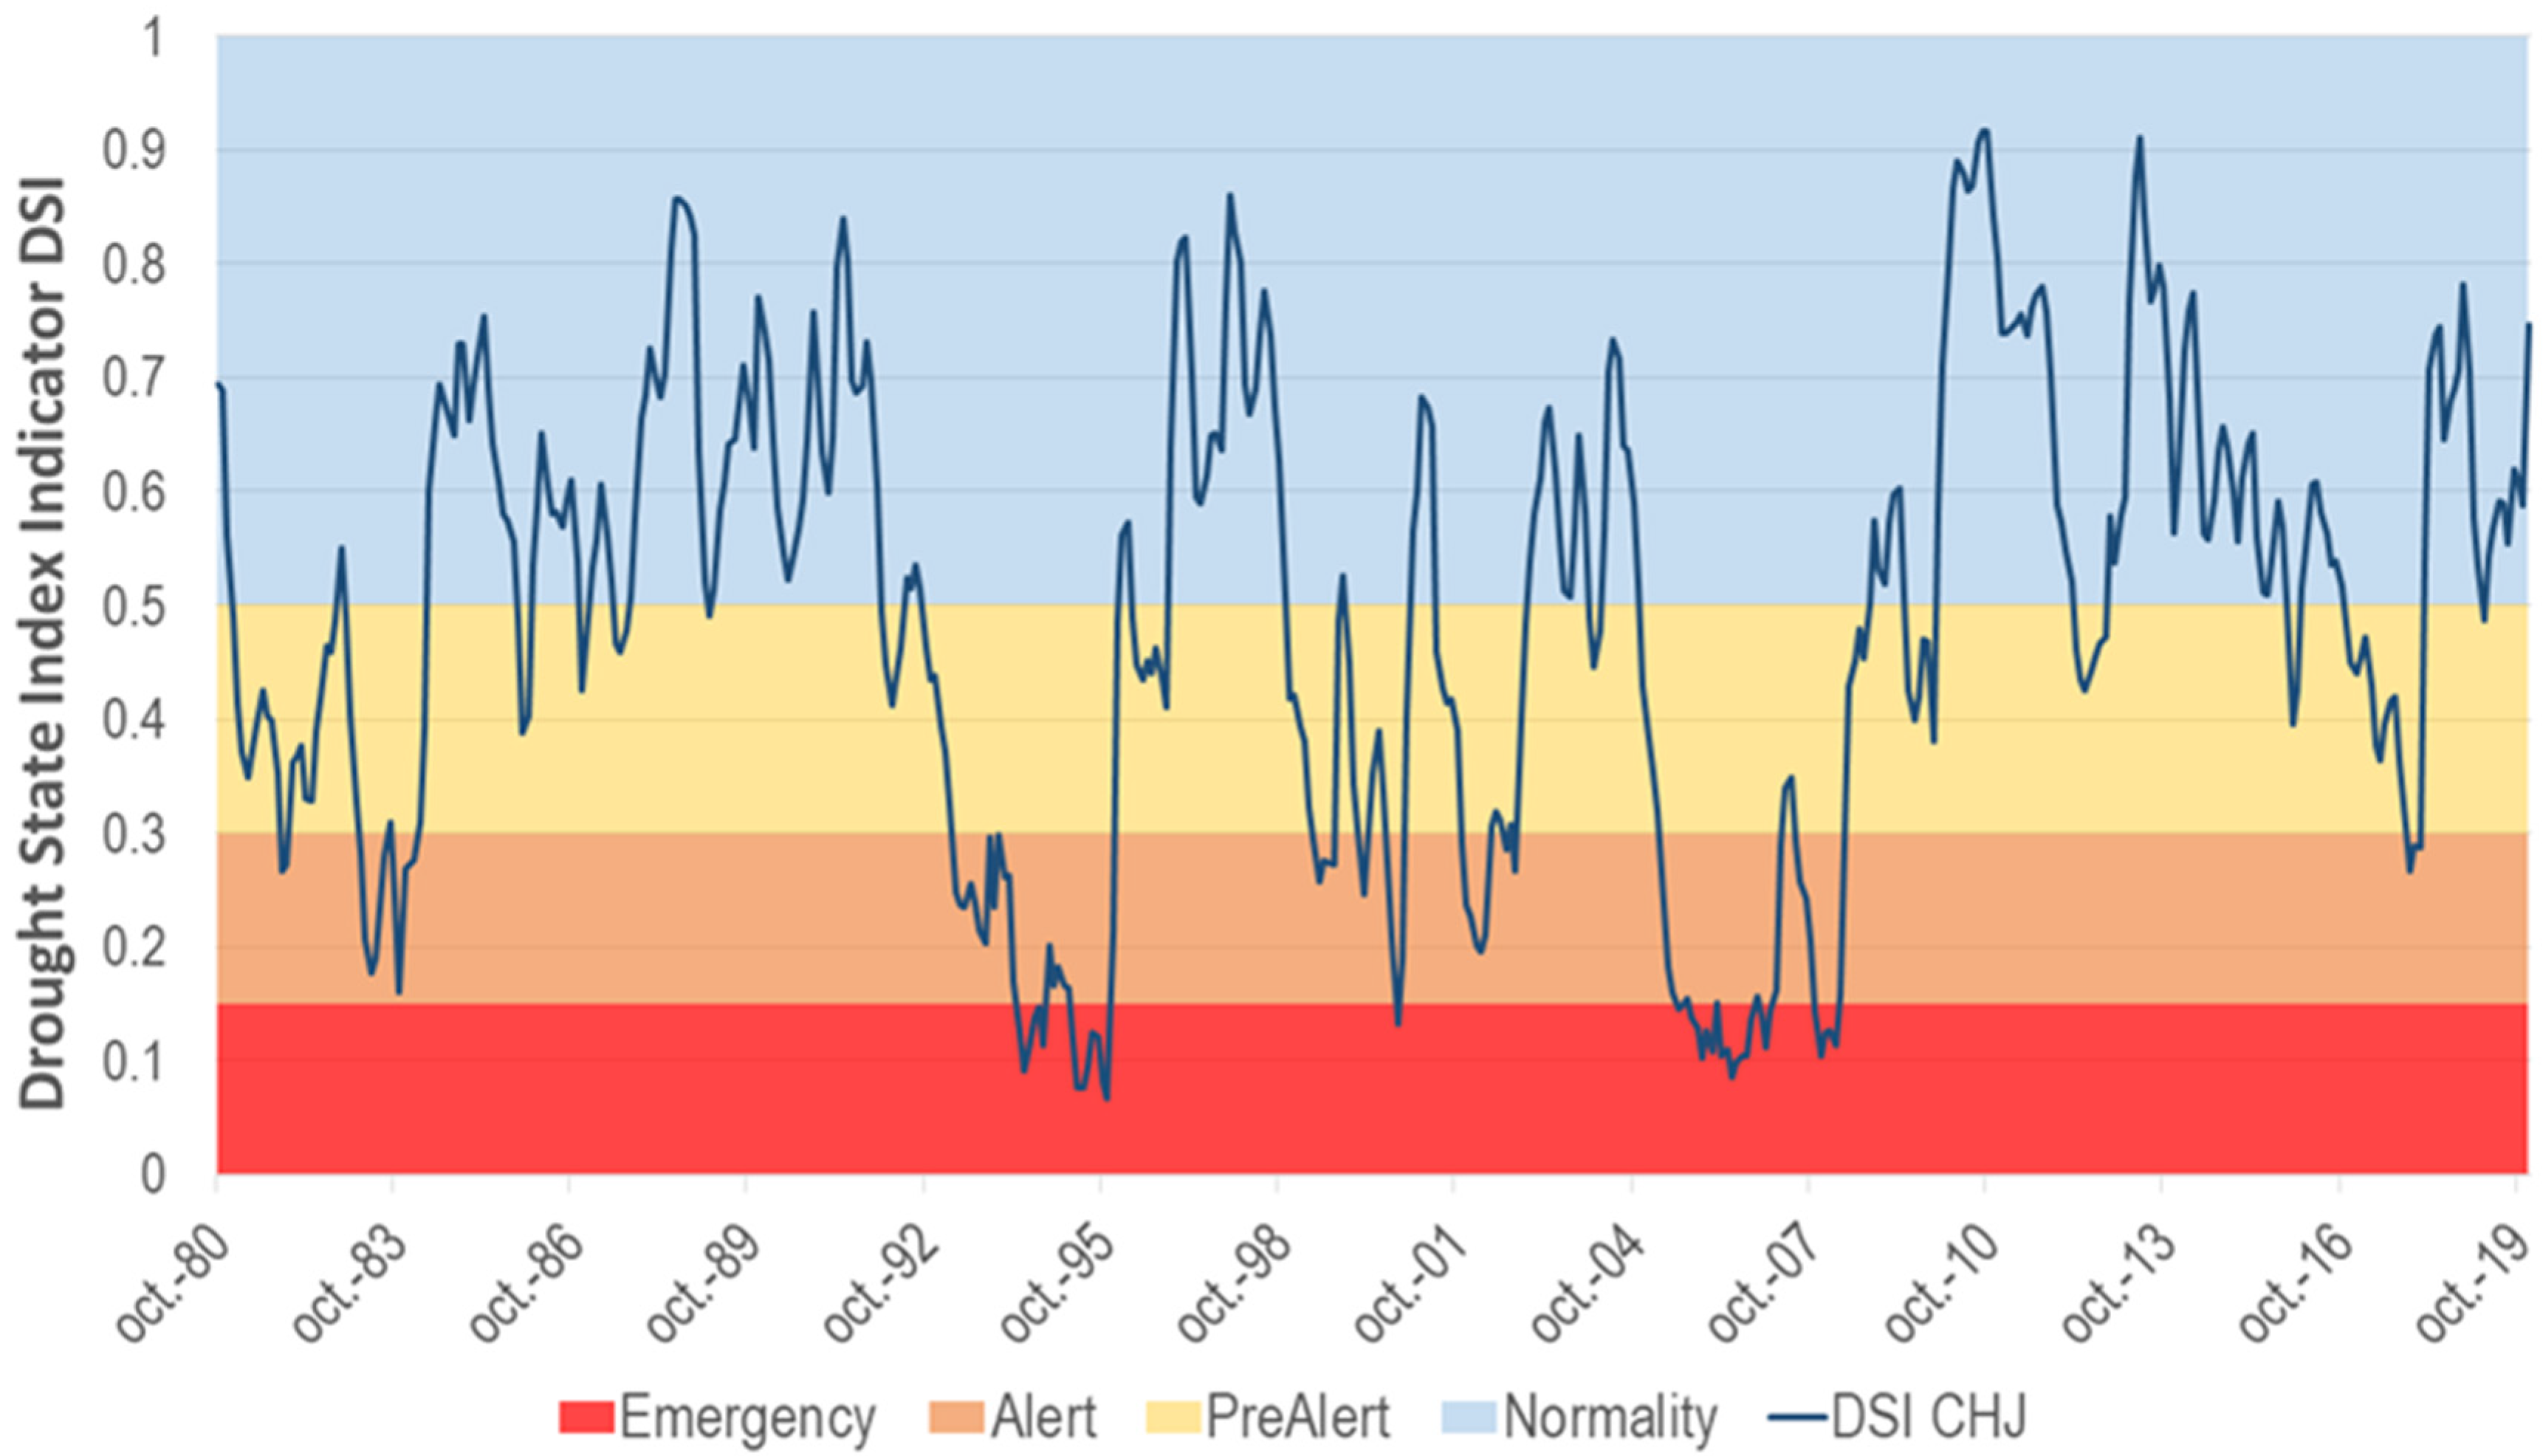
In this equation, V represents the value of the seasonal variable in each month being considered (i); Vmed represents the mean value of the whole series, which in this case goes from 1980 to 2012; and Vp5 and Vp95 represent the 5th and 95th percentile of that series. The DSI may range from 0 to 1, which allows the scarcity situation to be classified into four levels: Normal (DSI > 0.5), Prealert (0.5 > DSI > 0.3), Alert (0.3 > DSI > 0.15) and Emergency (DSI < 0.15). When the DSI falls into the Prealert or Alert status, this means that there is a moderate to severe water shortage, while an Emergency status means that there is a serious shortage.
Afterward, the impact of each one of the ten variables is weighted to combine them properly into the same equation. The river basin agency determines the weight of each variable from the relative volume of demand to be supplied by the water resources represented by each indicator, which was then adjusted and validated by comparison to previous drought situations [59]. This is done to ensure that, based on the historical data logged or supplied by simulation models, the alert and emergency scenarios detected by the system represent the historical scarcity circumstances gathered in the basin as closely as feasible. This index allows us to determine when and how often water scarcity occurs in the river basin, as well as the impact it has on a community of irrigators since operating rules or restrictions on the use of water are introduced based on it.
Figure 3 presents the DSI used in this study for insurance analysis (1980–2019). According to this index, the following periods were identified in the Jucar river basin: there was a drought from 1982/1983 to 1985/1986, followed by a wet period between 1987/1988 and 1990/1991. Then came the drought of 1991/1992–1994/1995, followed by some rainy years (they were, however, not so rainy as the previous wet period). This, in turn, prevented the years 1997/1998–2000/2001 from being particularly dry. Afterward came the drought from 2004/2005 to 2007/2008, which, despite not taking place during the years with the least rainfall recorded in the Júcar region during the analyzed period, was the most severe [59]. Finally, another drought period began in early 2018.

2.4.3. Water Scarcity in the RAE

According to the Júcar River Basin Management Plan, the RAE has a gross demand of 25.36 Hm3 of water per year. However, an analysis of the historical records (2006–2019), shows that a lower volume of water has been delivered in the irrigation district in 9 of those 14 years. This may be due to periods of water scarcity, deliberate decisions from the planners of the Jucar River Basin Agency (CHJ Confederacion Hidrografica del Jucar), or the advancement in irrigation techniques, which nowadays require a lower volume of water to irrigate wider areas.
Given the above, to identify actual periods of water scarcity, we determined the storage in the three main reservoirs that regulate the water supply in the Jucar river basin on 1 April and compared it to the actual volume of water delivered to the RAE (Figure 4). The drawn red line represents the minimum amount of water that ought to be delivered during a drought period (16.5 Hm3). There is a direct relationship between the amount of water stored and the amount of water that was delivered for irrigation. According to this analysis, between 2005 and 2019, there were three years in which less water than the minimum volume was delivered, which means that a hydrological drought took place during those years (2005–2008). Moreover, even though there was a relatively high initial storage in the reservoirs during 2008/2009, 2009/2010, and 2018/2019, the actual amount of water delivered during those years was very close to the minimum, which generated economic impacts in the irrigation districts.

3. Results

3.1. Correlation between Drought Index DSI and Water Deliveries

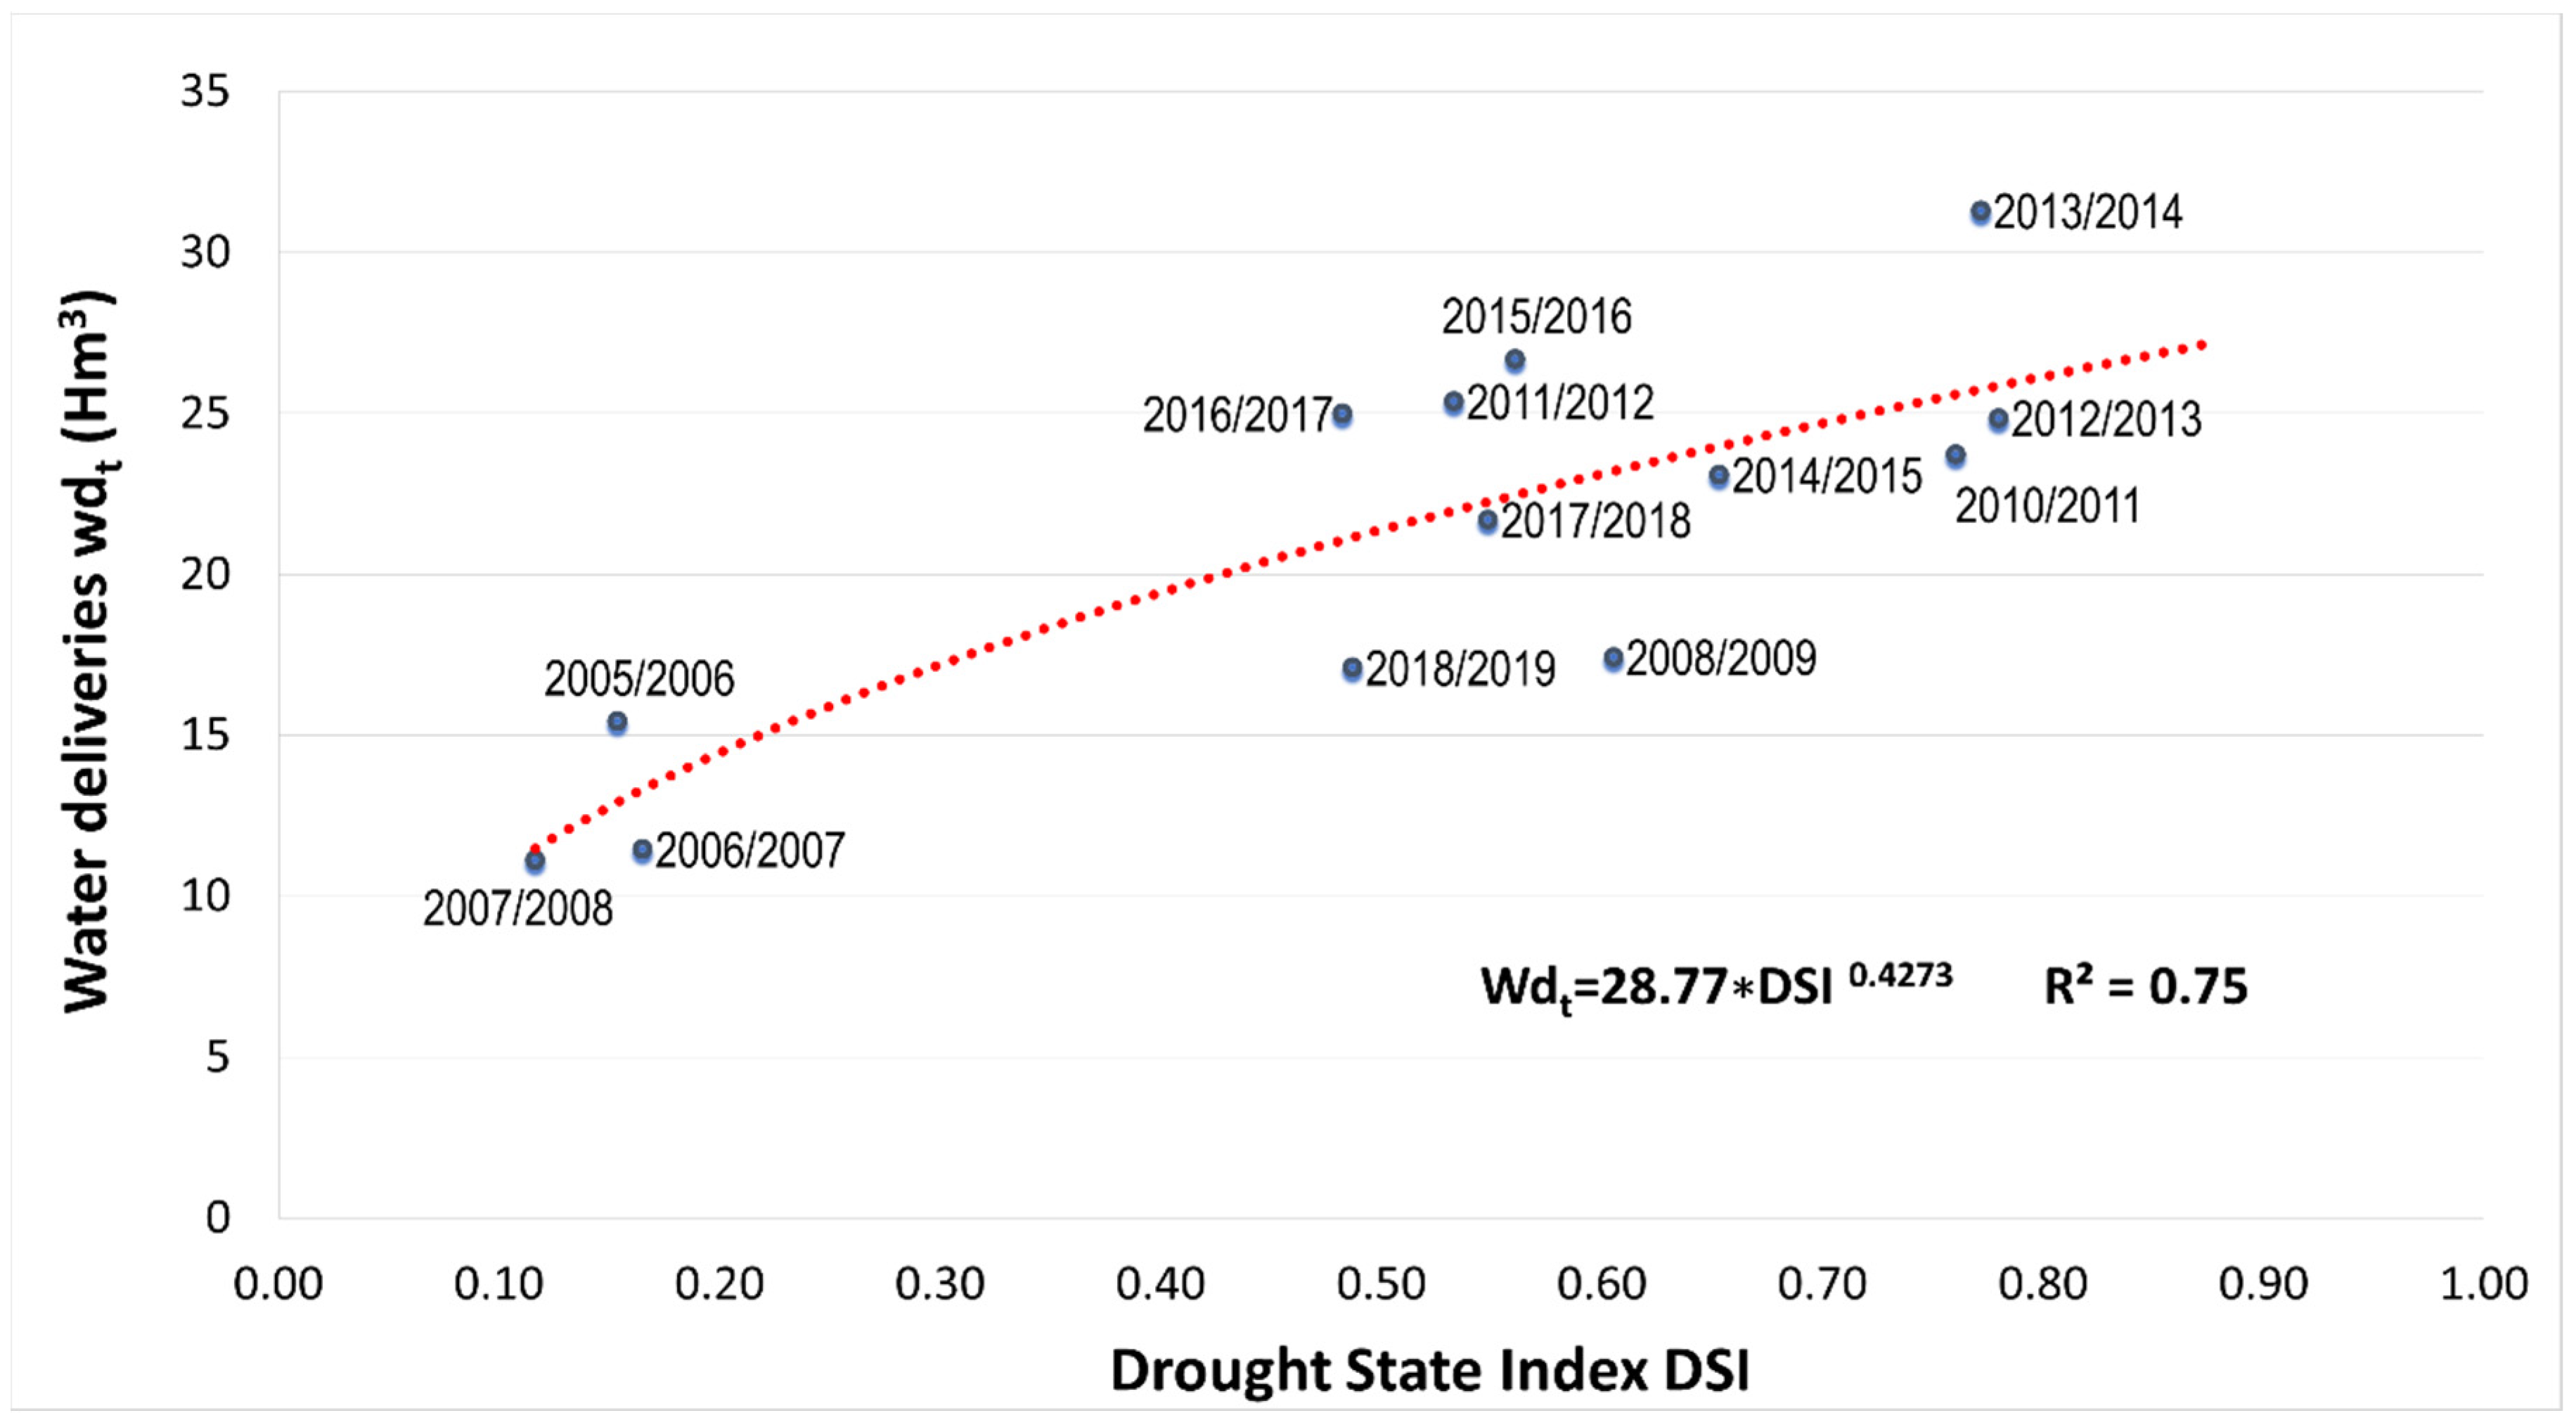
The model used to estimate the irrigation water deliveries in comparison with the DSI measured on 1 April, i.e., before the irrigation season, in the RAE (Equation (12)) is obtained by considering the historical water deliveries to the irrigation districts ( w d t ). Figure 5 shows the high correlation between these variables obtained in the model.
W d t = 28.77 D S I C H J 0.4273   R ² = 0.75

3.2. Measuring the Economic Impact of Hydrological Droughts

To determine the impact of a drought, the management measures established in the river basin drought management plan must be taken into account, since they dictate that the volume of water delivered may be reduced up to 35% when a drought brings about a state of emergency [59].
The second step is to analyze the impact of the reduced water availability on crop yields, for which we consider the work carried out by [15], who simulated the change in citrus-fruit yield according to different changes in water availability in the Jucar Basin. These changes were the consequence of deficit irrigation and allow for the determination of the relationship between yield and net irrigation (In) (m3/ha).
Y i e l d ( K g h a ) = 0.00000003 I n 3 + 0.0003 I n 2 0.0868 I n + 21495
To assess the cost of scarcity in €/m3 of water, historical records of production, sown area, yields, sales prices, and production costs from 2006 to 2019 in the Valencian Community were considered. Since there are several sources of information, after a selection process, the reports of the Valencian agricultural sector were chosen as the most fitting (These reports can be accessed at: http://www.agroambient.gva.es/es/informes-sector-agrario-anos-anteriores) (accessed on 15 October 2020).
A regular net demand of 4107.33 m³/ha-year has been established in the Júcar Hydrological Plan for the RAE. However, during a state of emergency, the allocated water is reduced by 35%. By applying the López citrus water productivity model (2017), insurers may find that crop yields would be reduced by approximately 1290 kg/ha during these periods, i.e., 5.35% of the production. With this in mind, a compensation value can be established. In this case, it was set to 0.09 €/m3, which, considering that 7789 m3/ha of water had been historically guaranteed in the region, results in a maximum compensable value of 701 €/ha.

3.3. Hydrological Index Insurance Design

  • Option 1: Variable premium and/or variable franchise based on the forecast of water availability for the insurance irrigation season.
In this proposal, the value of the premium is calculated based on the correlation of the expected yield, the historical values of the DSI, and the expected amount of water delivered (Equation (12)) in the event of an alert or emergency scenario (triggered by a 0.3 and a 0.15 DSI, respectively) additionally, an intermediate scenario (DSI = 0.2) was used. The above allows for the establishment of three different deductible franchise values (according to the DSI), which are presented in Table 3. There is a significant difference in the premium values.
  • Option 2: Pre-season index contract. Multi-year insurance contract
Three states of scarcity were selected: Normal, Alert, and Emergency. As depicted in Table 4, the value of the premiums differs significantly depending on the pre-season shortage scenario and the selected index. Considering the emergency state as an example, the premium value for a 1-year contract ranges between 292 and 947 €/ha/year, which corresponds to 41.65% and 135.09% of the maximum compensable value. Similarly, Table 4 shows that another possibility to reduce the premium rate in the years when a state of emergency is reached is to contract a multiannual policy, depending on the scenario or state of scarcity taking place at the time of purchase of the policy. With a 3-year contract, premiums could range between 268 and 871 €/ha (38.23% and 124.25% of the maximum compensable value). The latter being such a high value, it is not viable for implementation.
  • Option 3: Early Contract
The correlation between past and future water volumes is no longer significant (that is, the system loses its memory) when data from 32 months before the start of the irrigation season are considered. In those cases, the degree of significance of the correlation would be lower than 90%. For a significance of 99%, the water-allocation data considered for predicting storage in the present cannot be more than 16 months. Therefore, to guarantee a reasonable degree of significance in the correlation, these types of multiannual contracts should be renewed every 2 years.

3.4. Assessment of Insurance Schemes Proposed in the RAE Irrigation District

To establish the effectiveness of the proposed insurance scheme, Table 5 presents a comparison of different options, for a period of analysis between 2006 and 2018, across the following parameters: standard deviation gross margin, the RMSL, and the minimum gross margin with and without the insurance contract.
  • Basis Risk
Ideally, the base loss and base gain should be similar, so the insurance system does not favor either the farmer or the insurance company [31]. The basis risk of the insurance scheme is calculated by breaking it down into basis loss and basis gain. This is done, in turn, by comparing insurance system indemnities, based on drought indexes, with the potential compensation (calculated from the records of delivered water between 2006 and 2019). In the current insurance proposal, the basis gain is, in most cases, higher than the basis loss. This entails that the insured farmer would receive more than the expected compensation, which does not favor the insurance company. However, there is one case where the insurance company would benefit greatly. When a DSI of 0.15 is reached and the γ is 0%, the value of basis loss will be negative 9.13%. This means that despite suffering economic losses under these circumstances the farmer that took the insurance would not receive any compensation from the insurance company (Table 5).
  • Standard Deviation Gross Margin (€/ha), Minimum Gross Margin (€/ha), RMSL (€/ha)
The lower the RMSL value for comparing two structures, the greater the structural similarity of the structures. The Mean Root Square Loss (RMSL) is appropriate because minimizing semivariance instead of complete variance is relevant as farmers are primarily interested in managing their losses downwards [49,50]. Therefore, if the RMSL reduces with insurance, the contract is efficient [50]. Considering the three criteria expressed above, the insurance condition with a value of the DSI index = 0.2 and no deductible franchise γ = 0% would be selected. Although it does not meet all the conditions, another option that approaches is the value of the index DSI = 0.3 and no deductible franchise γ = 0%.
Table 5. Risk-reducing effectiveness evaluation indicators applied in RAE.
Insurance SchemeAdditional LoadingsStandard Deviation (€/ha)Minimum Gross Margin (€/ha)RMSL (€/ha)Basis Risk (Loss) (%)Basis Risk (Gain) (%)
No insurance 567.91193.184.1
γ = 37%
DSI = 0.15
0%551.51156.696.13.8512.55
10%551.51140.8103.2
37%551.51098.1122.7
γ = 19%
DSI = 0.3
0%550.81144.6101.53.8512.84
10%550.81127.6109.2
37%550.81081.7130.3
γ = 0%
DSI = 0.5
0%597.31021.6158.32.7125.96
10%597.3992.3172.4
37%597.3913.2211.9
γ = 0%
DSI = 0.3
0%550.81187.182.63.8512.84
10%550.81174.388.2
37%550.81139.9103.6
γ = 0%
DSI = 0.15
0%626.61163.199.29.133.85
10%626.61160.1100.7
37%626.61152.0104.9
γ = 0%
DSI = 0.2
0%550.81254.654.93.8512.84
10%550.81248.657.2
37%550.81232.463.5
γ = 31%
DSI = 0.2
0%550.81143.6102.03.8512.84
10%550.81126.5109.7
37%550.81080.3130.9

3.5. Simulation of Insurance Design Based on the Implementation of a Management Model

The MASHWIN and SIMGES modules of the AQUATOOL software were implemented. The demands included in the model were both agricultural and urban. Figure 6 presents the scheme of the simulation. MASHWIN included a monthly stochastic analysis model intended for the study of the water inflows to a hydraulic system of different sources during a certain period. MASHWIN combines a multivariate ARMA auto-regressive and moving-mean model with the monthly spatial disaggregation analysis provided by the condensed Lane model [60].
Then, by generating 100 synthetic series of water inflows, with SIMGES the volumes of different reservoirs, as well as their water inputs, outputs, and evaporation rates were obtained. Finally, these data were used as input to calculate the DSI and simulate an insurance scenario.
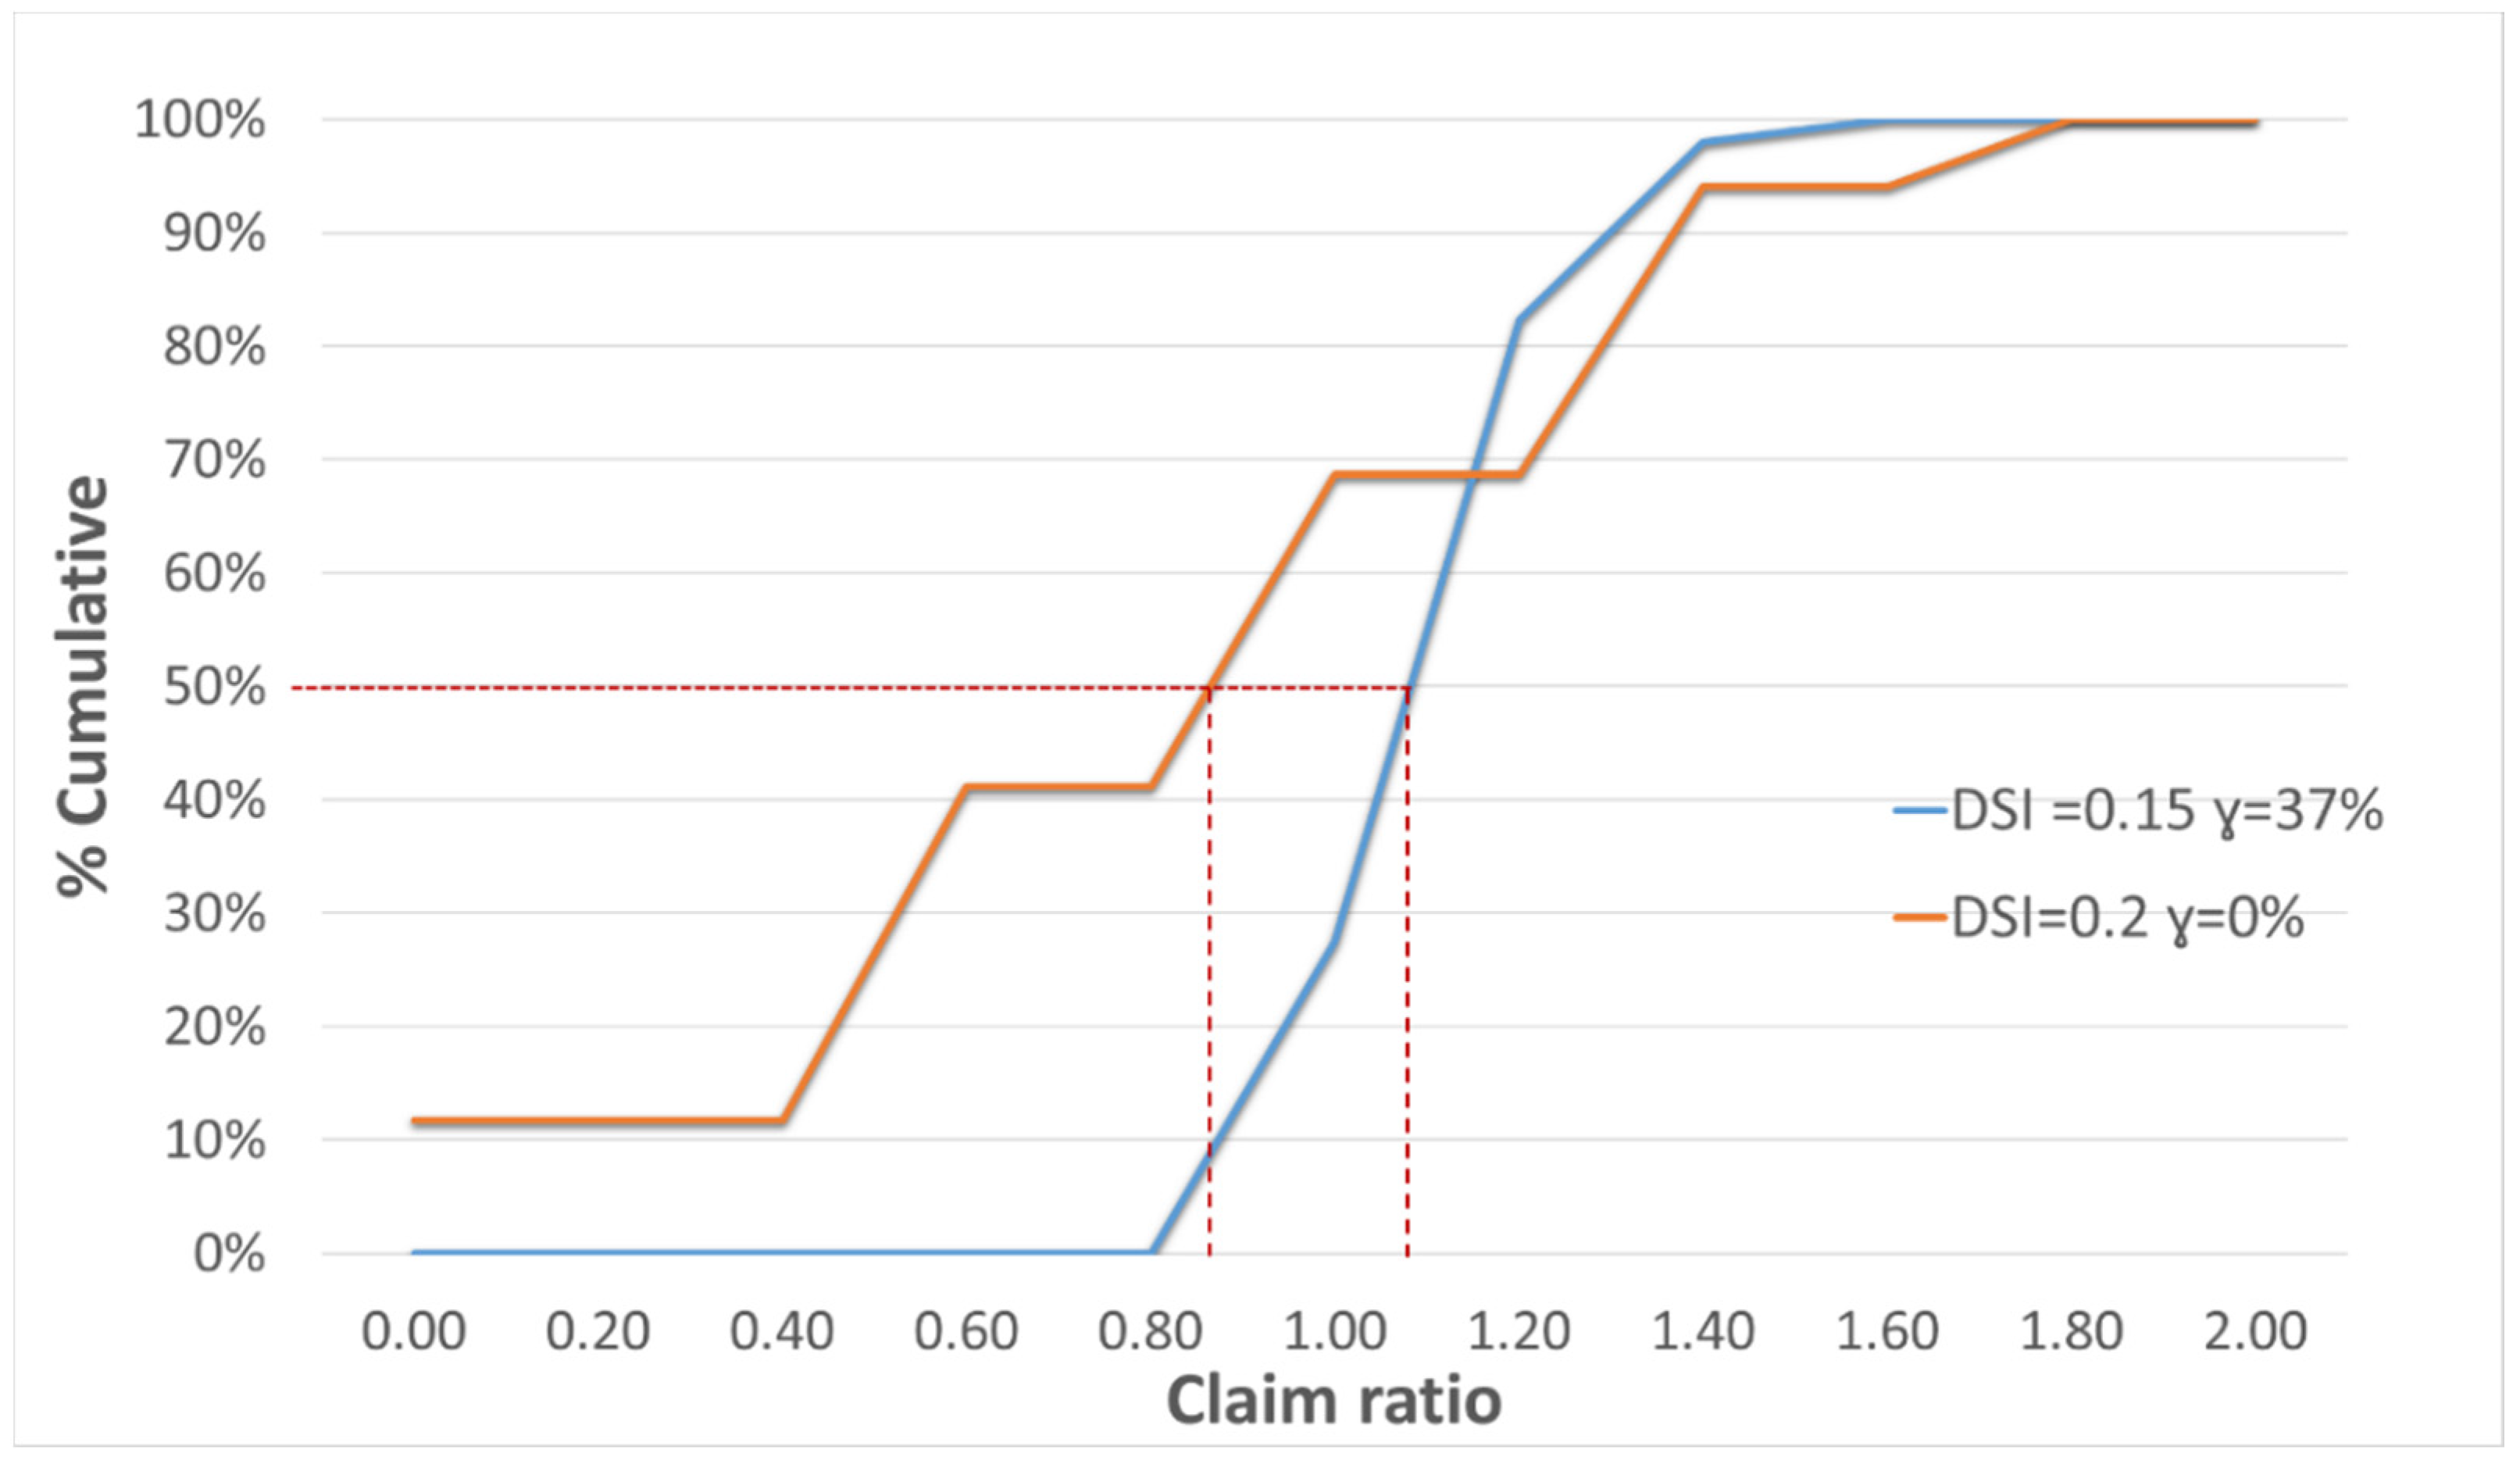
When the simulation was run with a DSI trigger of 0.2, the average value of the claim ratio was 0.74 and the claim rate ranged between 0.6 and 1.4 in 82% of the cases (Figure 7). On the other hand, when the simulation was run with a SI of 0.15 and a γ = 37%, the average value of the claim ratio was 1.1. The claim rate peaked at 1.6 under these conditions, and no claims were made in 52% of the cases.

4. Discussion

Traditional agricultural insurances are contracts between the farmer and the insurer, indemnifying either the cost of production, planting, or installations or a combination of them. However, drought or water scarcity impacts on irrigated crops are not included. In this study, drought insurance covers the value of the economic impact generated by reducing water deliveries to the irrigation district as the insurable capital. This type of specialized insurance attempted to offer additional coverage to farmers under drought and water scarcity conditions [50], filling the existing gap in traditional insurance schemes for irrigated crops.
A key novelty of the approach is the use of a water resource management model, which allows the assessment of the insurance considering the systemwide features and the variation of resources and demands. This improvement is important for evaluating indexed hydrological drought-insurance schemes since the exposure to drought events of each particular agricultural demand will depend on the water resource system operating rules and the variability in resources and demands over time and space. Unlike the case of rainfed agriculture, water deliveries to the irrigated demands will be driven by water availability in the system. Even in a situation of meteorological drought, there might be enough water storage to cope with it without restrictions, and on the contrary, water storage could be heavily depleted even in the absence of a meteorological drought. This is a challenge for the development of hydrological insurance.
The evaluation of the proposed insurance scheme was carried out using stochastic modeling, which allows for the generation of a wide range of inflow scenarios and drought status index values. The suitability of the suggested methodology requires a strong correlation between the drought status index and water deliveries to irrigation. A weak correlation between the mentioned variables would negatively affect the basis risk, premium values, and claim indemnity results and, as a consequence, the insurance applicability.
By including an official drought state index established by the River Basin Agency, together with proper design schemes, trigger values, and deductible franchises, the incidence of moral hazard problems and adverse selection in irrigated-drought insurance is reduced. With this approach, both individual and combined options for indexed drought insurance were considered. A suitable option is an early-bird contract combined with a trigger of emergency or alert state in a multi-year contract. On the other hand, in the analysis of the insurance scheme based on a “pre-index” (an index based on the values at the beginning of the hydrological year), the premiums get high for the farmers. For instance, if an alert or emergency scenario were declared in October before the irrigation season (April–September), the whole irrigation season would most likely be affected by water scarcity. Insurance companies would not see it profitable to offer insurance in such cases, which is why the present study suggests offering multi-year contracts with at least three years of validity.

5. Conclusions

The proposed framework assesses hydrological drought insurance schemes for irrigated agriculture considering water scarcity at the basin level through an economic assessment of drought impacts. This approach includes financial indicators to evaluate the viability of the insurance scheme for the insurance companies and the beneficiaries, using multiple stochastic realizations of inflow time series and the simulation of the water system’s operation.
The comparison between purchasing or not purchasing insurance was assessed by integrating financial indicators from the perspective of the farmer and insurance companies. The selection of the design alternative is based on minimizing the semi-variance (RMSL) and gross margins standard deviation and maximizing the minimum gross margin. In the basis risk analysis in the current insurance proposal, the basis risk gain is in most cases higher than the loss. This entails that the insured farmer would receive more than the expected compensation, which does not favor the insurance company. The basis risk and claim ratio analysis should have a balance between the benefits for the insurance companies and for the farmers.
Given the frequent and severe drought events that affect water availability in the Jucar river basin, the implementation of this type of insurance is not meant to replace the agricultural insurance currently provided, but rather to serve as a complementary insurance alternative for irrigated agriculture. Its premium values are reasonable for farmers compared to the benefits it can provide, and also with multi-year contract options it can become a viable business alternative for insurance companies.
The estimation of the economic impacts of water scarcity on agriculture is challenging due to the variability of driving factors, such as prices, quality, and demand for products. As future research, this study can be complemented with an estimation of the impact of drought analysis on revenue and production costs. For instance, water scarcity may decrease product quality, lowering its price. The level of adoption of the proposed insurance must also be studied from a social-economic perspective, considering its viability and aspects, such as willingness to pay and the inclusion of possible subsidies from the basin agencies or government. Additionally, future studies can also define drought-related indexes with a higher correlation with water deliveries for irrigation and the corresponding economic losses.

Author Contributions

Conceptualization, M.A.V.-M. and M.P.-V.; methodology, M.A.V.-M., M.P.-V. and H.M.-S.; validation, M.A.V.-M., M.P.-V. and H.M.-S.; formal analysis, M.A.V.-M., M.P.-V. and H.M.-S.; investigation, M.A.V.-M., M.P.-V. and H.M.-S.; writing—original draft preparation, M.A.V.-M.; writing—review and editing, M.A.V.-M., M.P.-V. and H.M.-S.; supervision, M.P.-V. and H.M.-S.; funding acquisition, M.A.V.-M. All authors have read and agreed to the published version of the manuscript.

Funding

This research and the APC were funded by Universidad Nacional de Colombia and the doctoral student training program of Ministry of Science, Technology, and Innovation of Colombia (MinCiencias). It has also received funding from the European Union’s Horizon 2020 research and innovation programme under the GoNEXUS project (grant agreement No 101003722) and the ADAPTAMED project (RTI2018-101483-B-I00) funded by the Ministerio de Economia y Competitividad (MINECO) of Spain including EU FEDER funds.

Data Availability Statement

The data presented in this study are available on request from the corresponding author.

Conflicts of Interest

The authors declare no conflict of interest.

References

  1. FAO. Agua. Available online: https://www.fao.org/water/es/ (accessed on 1 February 2022).
  2. The World Bank. Water in Agriculture. Available online: https://www.bancomundial.org/es/topic/water-in-agriculture#1 (accessed on 1 February 2022).
  3. Berbel, J.; Espinosa Tasón, J. La gestión del regadío ante la escasez del agua: El caso de España. In Inundaciones y Sequías. Análisis Multidisciplinar Para Mitigar el Impacto de los Fenómenos Climáticos Extremos; Universitat d’Alacant: Joaquín Melgarejo, Ma Inmaculada López-Ortiz, Patricia Fernández-Aracil, 2021; pp. 411–416. Available online: http://hdl.handle.net/10317/10392 (accessed on 1 February 2022).
  4. Future Earth. Our Future on Earth. 2020. Available online: www.futureearth.org/publications/our-future-on-earth (accessed on 1 September 2022).
  5. Alamanos, A.; Mylopoulos, N.; Loukas, A.; Gaitanaros, D. An Integrated Multicriteria Analysis Tool for Evaluating Water Resource Management Strategies. Water 2018, 10, 1795. [Google Scholar] [CrossRef]
  6. MITECO. Tipos de Sequía. In Observatorio Nacional de la Sequía. Ministerio Para la Transición Ecológica y el Reto Demográfico; Madrid, Spain. 2018. Available online: https://www.miteco.gob.es/es/agua/temas/observatorio-nacional-de-la-sequia/ (accessed on 15 December 2021).
  7. Van Loon, A.F. Hydrological drought explained. WIREs Water 2015, 2, 359–392. [Google Scholar] [CrossRef]
  8. Tallaksen, L.M.; Van Lanen, H.A. Hydrological drought. Processes and estimation methods for streamflow and groundwater; Tallaksen, L., Van Lanen, H.A.J., Eds.; Elsevier: Amsterdam, The Netherlands, 2004. [Google Scholar]
  9. Gómez-Limón, J.A.; Guerrero-Baena, M.D. Diseño de un seguro indexado para la cobertura del riesgo de sequía hidrológica en la agricultura de regadío. Agua Territ. 2019, 3, 79–92. [Google Scholar] [CrossRef]
  10. Pulido-Velazquez, M.; Cabrera Marcet, E.; Garrido Colmenero, A. Economía del agua y gestión de recursos hídricos. Ing. Agua 2014, 18, 95. [Google Scholar] [CrossRef]
  11. Expósito, A.; Beier, F.; Berbel, J. Hydro-Economic Modelling for Water-Policy Assessment Under Climate Change at a River Basin Scale: A Review. Water 2020, 12, 1559. [Google Scholar] [CrossRef]
  12. Comisión Europea. Informe Sobre la Revisión de la Política Europea de Lucha Contra la Escasez de Agua y la Sequía; Comisión Europea: Bruselas, Belgium, 2012; Available online: https://eur-lex.europa.eu/legal-content/ES/TXT/PDF/?uri=CELEX:52012DC0672&from=ES (accessed on 15 January 2020).
  13. Smith, R. Directive 2008/94/EC of the European Parliament and of the Council of 22 October 2008. In Core EU Legislation; Macmillan Education UK: London, UK, 2015; pp. 423–426. [Google Scholar] [CrossRef]
  14. Harou, J.J.; Pulido-Velazquez, M.; Rosenberg, D.E.; Medellín-Azuara, J.; Lund, J.R.; Howitt, R.E. Hydro-economic models: Concepts, design, applications, and future prospects. J. Hydrol. 2009, 375, 627–643. [Google Scholar] [CrossRef]
  15. López Nicolás, A.F.L. Métodos y Herramientas Para Diseño y Evaluación de Instrumentos Económicos para la Gestión a Escala de Cuenca. Ph.D. Thesis, Universitat Politècnica de València, Valencia, Spain, 2017. Available online: https://riunet.upv.es/handle/10251/91143 (accessed on 10 October 2019).
  16. Mechler, R.; Pulido-Velazquez, M.; Koehler, M.; Jenkins, K.; Surminski, S.; Williges, K.; Botzen, W.; Cremades, R.; Dransfeld, B.; Hudson, P.; et al. Economic instruments. In Novel Multi-Sector Partnerships in Disaster Risk Management; Aerts, J., Mysiak, J., Eds.; Enhance: Brussel, Belgium, 2017; pp. 70–97. [Google Scholar] [CrossRef]
  17. Rey, D.; Pérez-Blanco, C.D.; Escriva-Bou, A.; Girard, C.; Veldkamp, T.I.E. Role of economic instruments in water allocation reform: Lessons from Europe. Int. J. Water Resour. Dev. 2019, 35, 206–239. [Google Scholar] [CrossRef]
  18. FAO. Seguros Agricolas Para la Agricultura Familiar en America Latina y el Caribe-Lineamientos Para su Desarrollo e Implementación; Santiago, Chile. 2018. Available online: http://www.fao.org/publication/es (accessed on 15 June 2019).
  19. Nnadi, F.N.; Chikaire, J.; Echetama, J.A.; Ihenacho, R.A.; Umunnakwe, P.C. Agricultural insurance: A strategic tool for climate change adaptation in the agricultural sector. Net J. Agric. Sci. 2013, 1, 1–9. [Google Scholar]
  20. Cole, S.A.; Xiong, W. Agricultural Insurance and Economic Development. Annu. Rev. Econ. 2017, 9, 235–262. [Google Scholar] [CrossRef]
  21. Hess, U.; Hazell, P.; Kuhn, S. Innovations and Emerging Trends in Agricultural Insurance: How can we transfer natural risks out of rural livelihoods to empower and protect people? Conference paper. Draft for Discussion Purposes. GPFI SME Finance SubGroup. In Proceedings of the G-20 Round Table on Innovations in Agricultural Finance, Antalya, Turkey, 9 September 2015. [Google Scholar]
  22. Barnett, B.J.; Barrett, C.B.; Skees, J.R. Poverty Traps and Index-Based Risk Transfer Products. World Dev. 2008, 36, 1766–1785. [Google Scholar] [CrossRef]
  23. Alderman, H.; Haque, T. Insurance Against Covariate Shocks: The Role of Index-Based Insurance in Social Protection in Low-Income Countries of Africa. In World Bank Working Papers; The World Bank: Columbia, DC, USA, 2007. [Google Scholar] [CrossRef]
  24. Hazell, P.; Skees, J. Insuring against Bad Weather Recent Thinking. January 2005. Available online: https://biotech.law.lsu.edu/blog/INSURING_AGAINST_BAD_WEATHER_RECENT_THINKING.pdf (accessed on 10 October 2021).
  25. Mahul, O.; Stutley, C.J. Government Support to Agricultural Insurance: Challenges and Options for Developing Countries; The World Bank: Washington, DC, USA, 2010. [Google Scholar] [CrossRef]
  26. Jensen, N.; Barrett, C. Agricultural Index Insurance for Development. Appl. Econ. Perspect. Policy 2017, 39, 199–219. [Google Scholar] [CrossRef]
  27. World Bank. 2005. Available online: https://openknowledge.worldbank.org/handle/10986/8797 (accessed on 1 September 2022).
  28. Roth, J.; McCord, M. Agricultural Microinsurance. Global Practices and Prospects, 1st ed.; Berold, R., Ed.; The MicroInsurance Centre, LLC: Appleton, WI, USA, 2008; Available online: https://www.findevgateway.org/sites/default/files/publications/files/mfg-en-paper-agricultural-microinsurance-global-practices-and-prospects-2008.pdf (accessed on 1 September 2022).
  29. Luna, A.; El Seguro Agrícola en Colombia. Reflexiones Comparadas Sobre su Desarrollo a Partir de Experiencias Internacionales. Fasecolda. 2013, 26. Available online: https://fdocuments.co/document/el-seguro-agrcola-en-colombia.html?page=1 (accessed on 25 July 2022).
  30. Boucher, S.; Moya, A. Recomendaciones para el Diseño e Implementación de un Seguro Indexado para Pequeños Productores Cafeteros. In Misión Estudios Competitividad Caficultura en Colombia; Universidad del Rosario: Bogota, Colombia, 2014; Available online: https://www.urosario.edu.co/Mision-Cafetera/Archivos/Gestion-de-Riesgo-Steve-Boucher-Andres-Moya.pdf (accessed on 12 January 2020).
  31. Maestro, T.; Bielza, M.; Garrido, A. Hydrological drought index insurance for irrigation districts in Spain. Span J. Agric. Res. 2016, 14, e0105. [Google Scholar] [CrossRef]
  32. Abdi, M.J.; Raffar, N.; Zulkafli, Z.; Nurulhuda, K.; Rehan, B.M.; Muharam, F.M.; Khosim, N.A.; Tangang, F. Index-based insurance and hydroclimatic risk management in agriculture: A systematic review of index selection and yield-index modelling methods. Int. J. Disaster Risk Reduct. 2022, 67, 102653. [Google Scholar] [CrossRef]
  33. Leiva, A.J.; Skees, J.R. Using Irrigation Insurance to Improve Water Usage of the Rio Mayo Irrigation System in Northwestern Mexico. World Dev. 2008, 36, 2663–2678. [Google Scholar] [CrossRef]
  34. Quiroga, S.; Garrote, L.; Fernandez-Haddad, Z.; Iglesias, A. Valuing drought information for irrigation farmers: Potential development of a hydrological risk insurance in Spain. Span J. Agric. Res. 2011, 9, 1059. [Google Scholar] [CrossRef]
  35. Pérez Blanco, C.D.; Gómez, C.M. Insuring water: A practical risk management option in water-scarce and drought-prone regions? Water Policy 2014, 16, 244–263. [Google Scholar] [CrossRef]
  36. Ruiz, J.; Bielza, M.; Garrido, A.; Iglesias, A. Dealing with drought in irrigated agriculture through insurance schemes: An application to an irrigation district in Southern Spain. Span J. Agric. Res. 2015, 13, e0106. [Google Scholar] [CrossRef] [Green Version]
  37. Gómez-Limón, J.A. Hydrological drought insurance for irrigated agriculture in southern Spain. Agric. Water Manag. 2020, 240, 106271. [Google Scholar] [CrossRef]
  38. Arandara, R.; Gunasekera, S.; Mookerjee, A. Index Insurance: A Viable Solution for Irrigated Farming? World Bank: Washington, DC, USA, 2019. [Google Scholar]
  39. Generalitat Valenciana. Informe del Sector Agrario Valenciano 2020; Informes del Sector Agrario Valenciano; Generalitat Valenciana. Conselleria de Agricultura, Desarrollo Rural, Emergencia Climática y Transición Ecológica: Valencia, Spain, 2021; Available online: https://agroambient.gva.es/es/informes-del-sector-agrario-valenciano (accessed on 2 February 2022).
  40. Carmona, M.; Máñez Costa, M.; Andreu, J.; Pulido-Velazquez, M.; Haro-Monteagudo, D.; Lopez-Nicolas, A.; Cremades, R. Assessing the effectiveness of Multi-Sector Partnerships to manage droughts: The case of the Jucar river basin: Assessing Governance Performance. Earth’s Future 2017, 5, 750–770. [Google Scholar] [CrossRef]
  41. Ortega-Gómez, T.; Pérez-Martín, M.A.; Estrela, T. Improvement of the drought indicators system in the Júcar River Basin, Spain. Sci. Total Environ. 2018, 610–611, 276–290. [Google Scholar] [CrossRef]
  42. Zaniolo, M.; Giuliani, M.; Castelletti, A.F.; Pulido-Velazquez, M. Automatic design of basin-specific drought indexes for highly regulated water systems. Hydrol. Earth Syst. Sci. 2018, 22, 2409–2424. [Google Scholar] [CrossRef]
  43. Barnett, B. Agricultural Index Insurance Products: Strengths and Limitations; No 32971, Agricultural Outlook Forum 2004; United States Department of Agriculture: 2004. Available online: https://EconPapers.repec.org/RePEc:ags:usaofo:32971 (accessed on 12 January 2020).
  44. Zhang, J.; Tan, K.S.; Weng, C. Index Insurance Design. ASTIN Bull. 2019, 49, 491–523. [Google Scholar] [CrossRef]
  45. Carpenter, R. Index Insurance. Status and Regulatory Challenges; International Association of Insurance Supervisors (IAIS): Basel, Germany, 2018; Available online: https://a2ii.org/en/home (accessed on 16 February 2022).
  46. Suchato, P.; Mieno, T.; Schoengold, K.; Foster, T. The potential for moral hazard behavior in irrigation decisions under crop insurance. Agric. Econ. 2022, 53, 257–273. [Google Scholar] [CrossRef]
  47. Carter, M.; Elabed, G.; Serfilippi, E. Behavioral economic insights on index insurance design. Agric. Financ. Rev. 2015, 75, 8–18. [Google Scholar] [CrossRef]
  48. Lopez-Nicolas, A.; Pulido-Velazquez, M.; Macian-Sorribes, H. Economic risk assessment of drought impacts on irrigated agriculture. J. Hydrol. 2017, 550, 580–589. [Google Scholar] [CrossRef]
  49. International Risk Management Institute, Inc. (IRMI). Glossary of Insurance & Risk Management Terms. Available online: http://www.irmi.com/online/insurance-glossary/default.aspx (accessed on 20 January 2019).
  50. Maestro Villarroya, T. Hydrological Drought Index Insurance for Irrigated Agriculture. Ph.D. Thesis, Universidad Politécnica de Madrid, Madrid, Spain, 2016. [Google Scholar] [CrossRef]
  51. Maestro, T.; Barnett, B.J.; Coble, K.H.; Garrido, A.; Bielza, M. Drought Index Insurance for the Central Valley Project in California. Appl. Econ. Perspect. Policy 2016, 38, 521–545. [Google Scholar] [CrossRef]
  52. Vedenov, D.; Barnett, B.J. Efficiency of Weather Derivatives as Primary Crop Insurance Instruments. J. Agric. Resour. Econ. 2004, 29, 387–403. [Google Scholar]
  53. Adeyinka, A.A.; Krishnamurt, C.; Maraseni, T.; Chantarat, S. Viability of Weather Index Insurance in Managing Drought Risk in Australia. In Proceedings of the Actuaries Summit 2013, Sydney, Australia, 20–21 May 2013; Available online: http://eprints.usq.edu.au/id/eprint/23781 (accessed on 16 February 2022).
  54. Kellner, U.; Musshoff, O. Precipitation or water capacity indices? An analysis of the benefits of alternative underlyings for index insurance. Agric. Syst. 2011, 104, 645–653. [Google Scholar] [CrossRef]
  55. World Bank Group. Seguro Agropecuario Catastrófico en Colombia. Anexo “As If”; World Bank Group: Bogotá, DC, USA, 2018; p. 12. [Google Scholar]
  56. Andreu, J.; Ferrer-Polo, J.; Pérez, M.A.; Solera, A.; Paredes-Arquiola, J. Drought Planning and Management in the Júcar River Basin, Spain. In Drought in Arid and Semi-Arid Regions; Schwabe, K., Albiac, J., Connor, J.D., Hassan, R.M., Meza González, L., Eds.; Springer: Dordrecht, The Netherlands, 2013; pp. 237–249. [Google Scholar] [CrossRef]
  57. Rubio-Martin, A.; Pulido-Velazquez, M.; Macian-Sorribes, H.; Garcia-Prats, A. System Dynamics Modeling for Supporting Drought-Oriented Management of the Jucar River System, Spain. Water 2020, 12, 1407. [Google Scholar] [CrossRef]
  58. Sechi, G.M.; Sulis, A. Drought mitigation using operative indicators in complex water systems. Phys. Chem. Earth Parts A/B/C 2010, 35, 195–203. [Google Scholar] [CrossRef] [Green Version]
  59. CHJ. Plan Especial De Sequía. Demarcación Hidrográfica Del Júcar. Confederación Hidrográfica del Júcar; Valencia, Spain. 2018. Available online: https://www.chj.es/es-es/medioambiente/gestionsequia/Paginas/PlanEspecialdeAlertayEventualSequia.aspx (accessed on 10 December 2018).
  60. Alvarez, J.A.; Solera, A.S.; Romá, J.C.; Polo, J.F. SIMGES Simulation Model of Water Resource Management including Conjunctive Use. Version 3.02 User Manual; Valencia Polytechnic University: Valencia, Spain, 2007; p. 106. [Google Scholar]
  61. Confederación Hidrográfica del Júcar. Plan Hidrográfico de la Demarcación Hidrográfica del JÚCAR. Ciclo de Planificación Hidrológica 2015–2021. Anejo VI. Sistemas de Explotación y Balances; Confederación Hidrográfica del Júcar: Valencia, Spain, 2015; p. 582. Available online: https://www.chj.es/Descargas/ProyectosOPH/Consulta%20publica/PHC-2015-2021/PHJ1521_Anejo06_SE-Balances_151126.pdf (accessed on 15 December 2019).
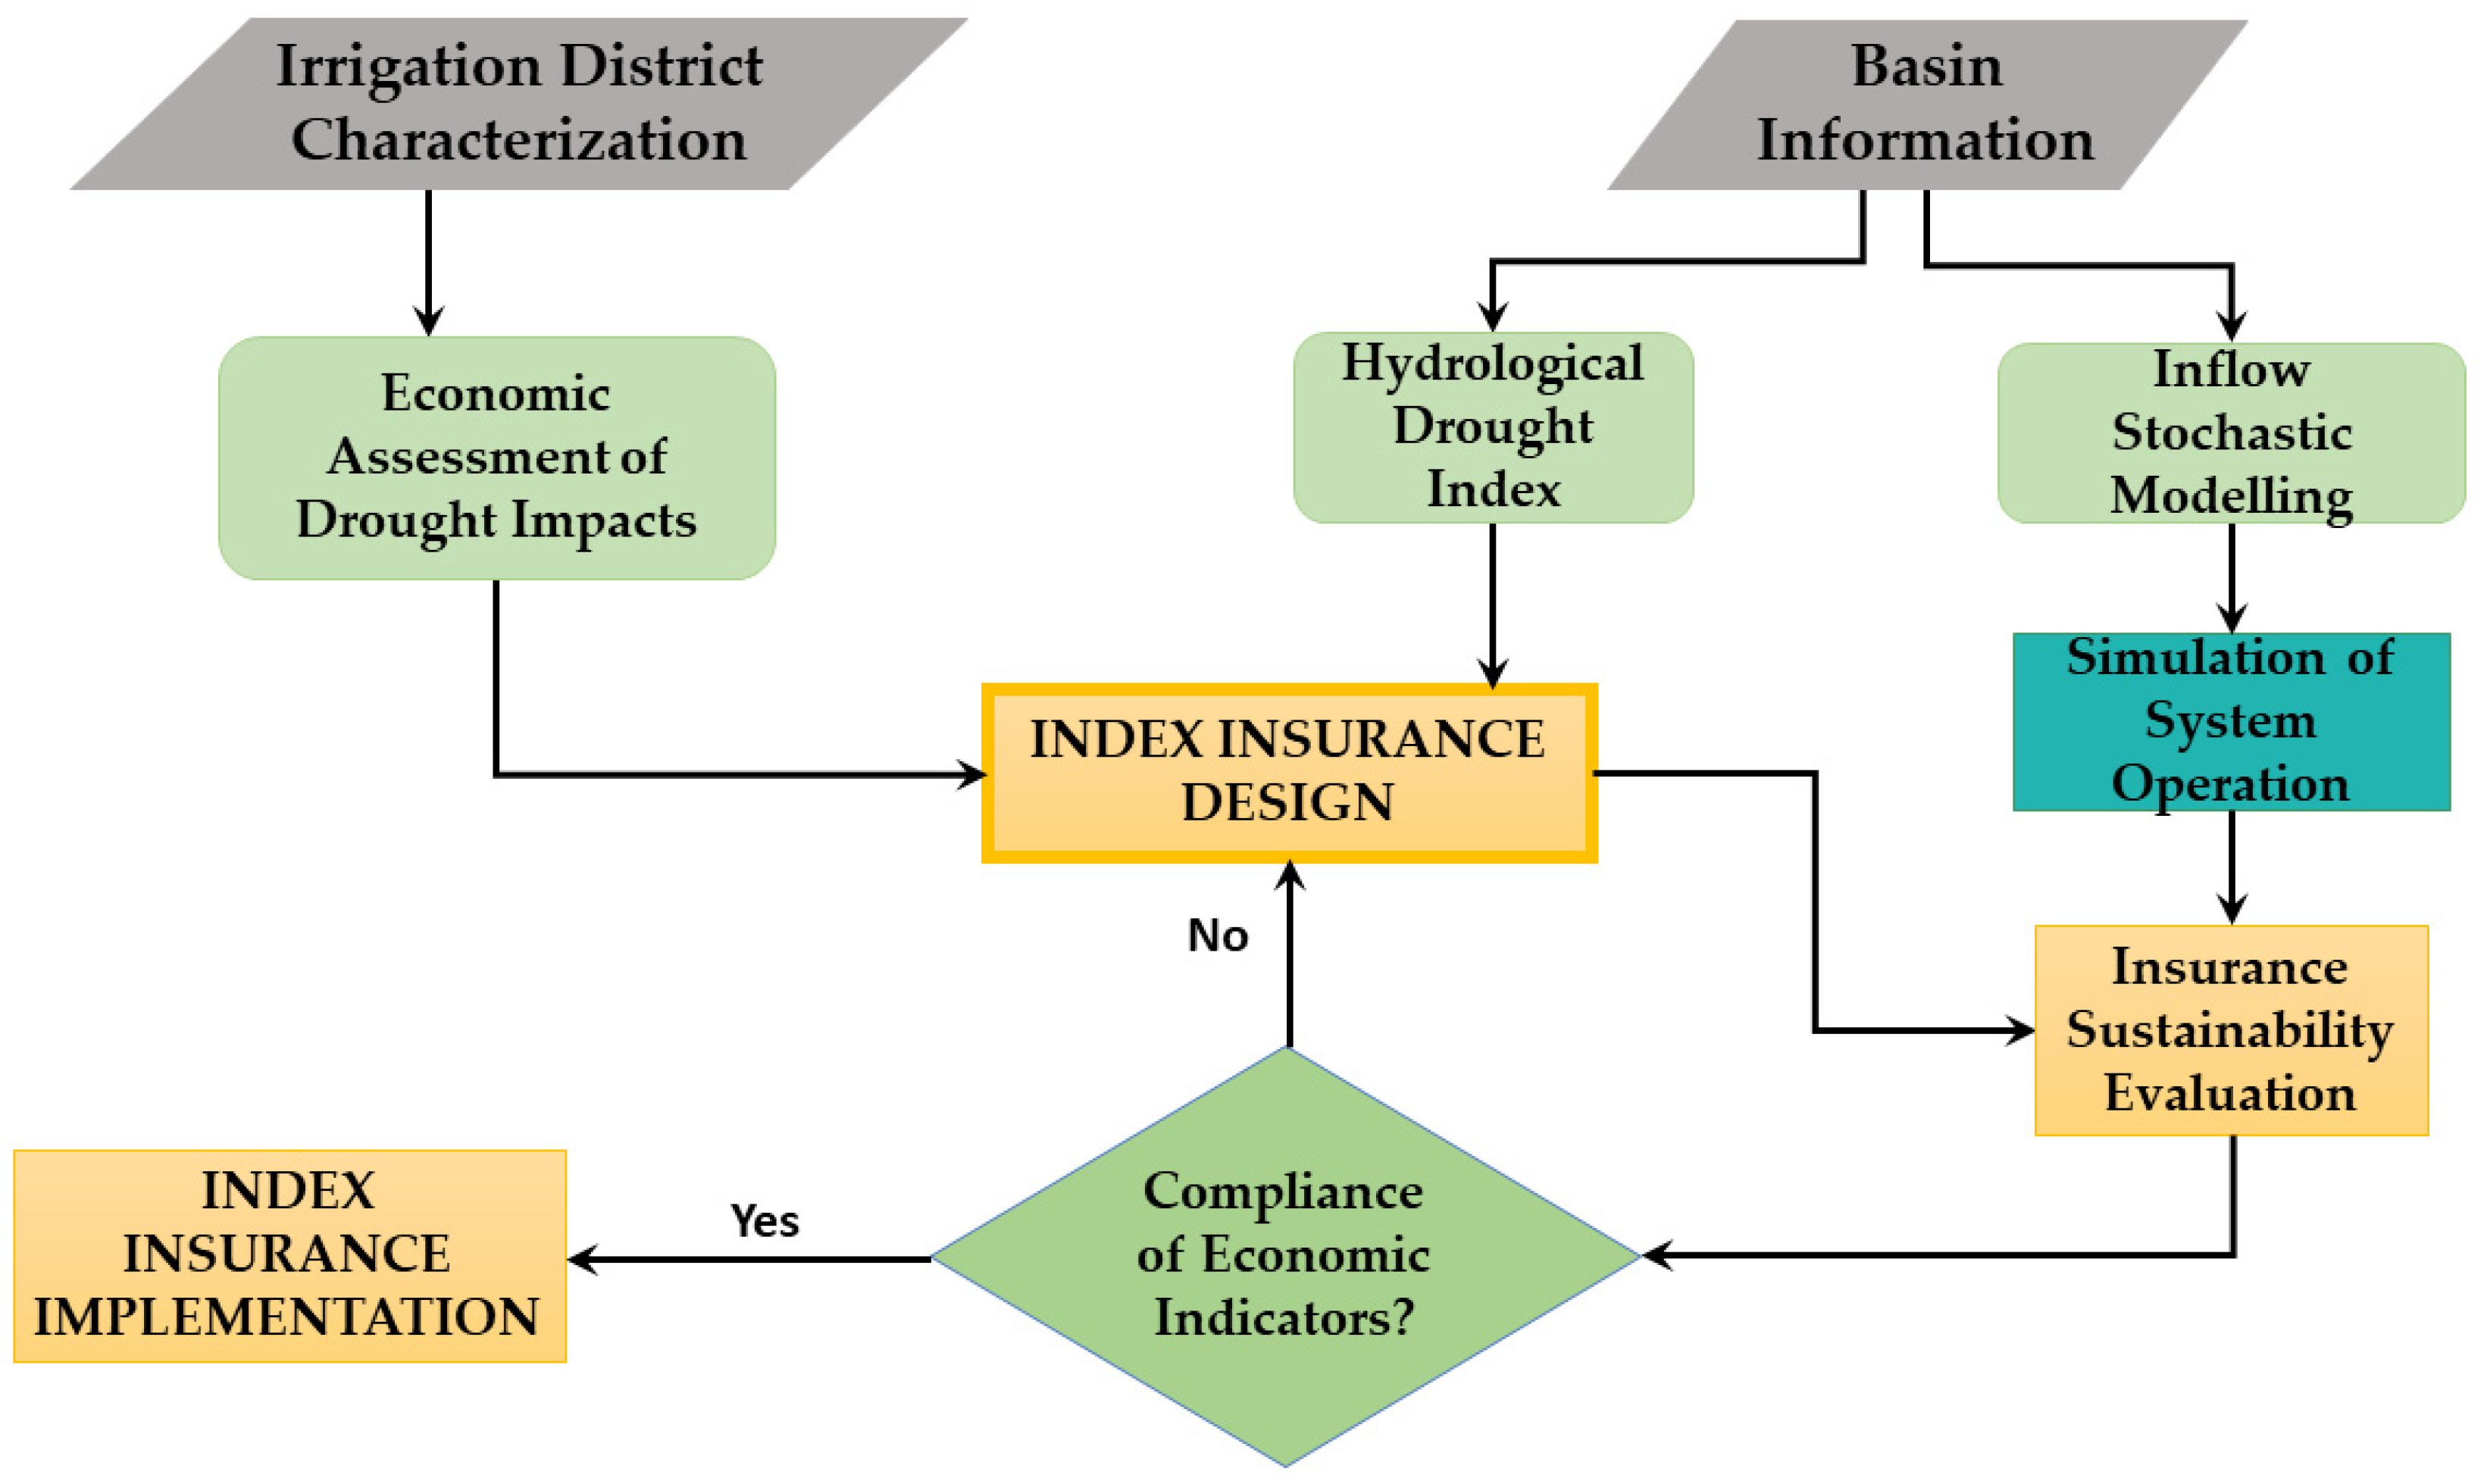
Figure 1. Framework for the design of the insurance.
Agronomy 12 02170 g001
Figure 2. Area of influence Real Acequia de Escalona RAE.
Agronomy 12 02170 g002
Figure 3. Drought State Index in the Jucar river basin DSICHJ (1980–2019). Source: modified from [58].
Agronomy 12 02170 g003
Figure 4. Water stored on 1 April vs water delivered to the RAE.
Agronomy 12 02170 g004
Figure 5. Water deliveries vs. Drought State Index.
Agronomy 12 02170 g005
Figure 6. Simplified schematic of the Júcar river system. Source: [56,61].
Agronomy 12 02170 g006
Figure 7. % Claim Ratio accumulated for two values of Drought State Index and two percentages of deductible Franchise.
Agronomy 12 02170 g007
Table 1. Insurance scheme options for designing.
OptionCharacteristics
Option 1: Variable premium and/or variable franchise based on the forecast of water availability for the secured irrigation season.Farmers may purchase insurance based on the conditions of scarcity presented before the start of the irrigation season (1 April). The value of the premium would depend on two franchises (state of alert and emergency scarcity) [31].
Option 2: Pre-season index contract. Multi-year insurance contractFarmers may purchase insurance that uses certain indexes to adapt the value of its premium to the real risk at the time of the purchase. This can either be a one-year or a multi-year policy. The period of the policy would be set in October, i.e., the beginning of the harvest season. That is, the value of the premium is estimated with the DSI measured in October t and the compensation is calculated with the DSI in 1 April t + 1 [50].
Option 3: Early Contract with a Constant Premium (Early Bird)Farmers may purchase insurance at a constant premium. However, they would have to buy it early, before the drought can be predicted [51].
Table 2. Performance Indicators for assessing the insurance schemes.
IndicatorDescription
% Basis RiskExpected difference between the compensation received by the farmer with the insurance (indt) and the current losses calculated based on the historical water deliveries. The base risk can be broken down into base loss (probable farmer losses due to index insurance) and base gain (probable farmer gains due to index insurance) [31].
RMSL (Gross margin)It is a simple function of the semivariance (i.e., losses) with respect to the trend of the gross margin without Insurance [31,52,53].
Minimum Gross Margin Minimum gross margin in productive systems, with and without insurance (revenue—direct costs), in historical time series [31,54].
Claim ratioThe most commonly used indicator for assessing the performance of an insurance or reinsurance undertaking is the claim rate [18]. This index makes it possible to determine whether the price fixed for a given insurance scheme is correct; that is, whether it actually allows for the settlement of claims arising in a given period.
Claim Ratio = claim incurred/premium collected
Table 3. Premium rates for a Hydrological Drought Insurance Option 1.
DSICHJ Trigger
Deductible Franchise
0.5
γ = 0%
0.3
γ = 19%
0.2
γ = 31%
0.15
γ = 37%
0.3
γ = 0%
0.2
γ = 0%
0.15
γ = 0%
Premium rate (€/ha)293.00170.00171.00158.00127.0060.0030.00
% liability41.8024.2524.3922.5418.198.564.28
Table 4. Premium rates for a Hydrological Drought Insurance Option 2, using a deductible franchise of 37% for 1, 2, and 3 years of the policy contract.
Pre-Season Index Contracts DSICHJPremium 1
Year-Contract
Premium 2
Year-Contract
Premium 3
Year-Contract
€/ha/year% Liability€/ha/year% Liability€/ha/year% Liability
Normality292.0041.65243.0034.66268.0038.23
Pre alert—Alert542.0077.32451.0077.32498.0071.04
Emergency947.00135.09788.00112.41871.00124.25
Publisher’s Note: MDPI stays neutral with regard to jurisdictional claims in published maps and institutional affiliations.