Article

Did Wheat Breeding Simultaneously Improve Grain Yield and Quality of Wheat Cultivars Releasing over the Past 20 Years in China?

1
College of Agronomy and Biotechnology, China Agricultural University, Beijing 100193, China
2
Engineering Technology Research Center for Agriculture in Low Plain Areas, Cangzhou 061000, China
3
CSIRO Agriculture & Food, GPO Box 1700, Canberra, ACT 2601, Australia
*
Authors to whom correspondence should be addressed.
Agronomy 2022, 12(9), 2109; https://doi.org/10.3390/agronomy12092109
Submission received: 2 May 2022 / Revised: 27 June 2022 / Accepted: 1 July 2022 / Published: 5 September 2022

Abstract

:
Grain yield and quality of wheat are both important components for food security. Great effort has been made in the genetic improvement of wheat grain yield in China. However, wheat grain quality (i.e., protein concentration and protein quality) has received much less attention and is often overlooked in efforts to improve grain yield. A timely summary of the recent process of wheat breeding for increasing yield and quality (which can be used to guide future breeding strategies) is essential but still lacking. This study evaluated the breeding efforts on grain yield and grain quality of 1908 wheat varieties in China over the past two decades, from 2001 to 2020. We found wheat yields show a 0.64–1.03% annual growth in the three-dominant wheat-growing regions in China. At the same time, there was no significant decrease in wheat protein concentration. Genetic yield potential was increased, and the genetic yield gap was closed. High grain yields and better quality can likely be achieved simultaneously by genomic selection in future wheat breeding.

1. Introduction

Wheat is an important cereal crop in the world, and grain yield and quality are two major targets of wheat breeding programs. Crossbreeding has been carried out in China for more than 100 years since 1914 [1]. National wheat grain yield increased from 5.4 × 10⁷ t in 1978 to 13.4 × 10⁷ t in 2019 while the arable area decreased from 2.9 × 10⁷ ha to 2.4 × 10⁷ ha (Figure 1). The increase in national wheat yield was due to the genetic improvement of new wheat varieties [1,2,3,4,5] and the increase in fertilizer inputs [2,4,6,7]. Many scholars have reported the achievements of wheat breeding in increasing grain yields in China. The evaluation of genetic improvement of grain yield in different provinces of the northern winter wheat region showed that the average annual genetic gain of wheat yield was 0.48–1.29% from the 1940s to the 2010s [1,8,9,10,11,12]. In the southern winter wheat region and the spring wheat region, the average annual genetic gain of wheat yield was 1.5% and 0.52% from the 1950s to the 2010s [1]. However, the increase in fertilizer inputs has brought a series of environmental problems [13], and low fertilizer inputs are advocated in the present time [14,15]. In the context of limited arable area and the promotion of low fertilizer inputs, new varieties with high yield capacity need to be bred to meet the huge food demands caused by the growing population.
However, wheat grain quality (i.e., protein concentration and protein quality) for human nutrition, a critical aspect of food security, has received much less attention and is often overlooked in efforts to improve crop production [16,17]. Compared to the long history (>100 years) of genetic improvement of wheat yield in China, the improvement of wheat quality in China began in the 1980s, and has only lasted for nearly 40 years [18]. Grain protein concentration is an important characteristic affecting the nutritional quality but also the end-use value and baking properties of wheat flour [19,20]. A different trend has been found in breeding progress in protein concentration based on the limited number of studies. The evaluation of 43 wheat varieties of protein concentration in the northern winter wheat region showed that the average protein concentration from 1991 to 1999 (13.23%) was lower than that from 1949 to 1956 [21]. Yang et al. [22] analyzed 330 Chinese wheat varieties and showed there was no significant difference in protein concentration among varieties released in different periods from 1949 to 2000. Aside from the protein concentration, protein quality is an important parameter affecting the quality of wheat processing [23]. Protein quality can be evaluated by sedimentation value, wet gluten content, and dough rheological properties [23,24,25,26]. To our best knowledge, so far there has not been a systematic study on the breeding progress for grain quality improvement of wheat varieties (nationally) in China.
A timely summary of the historical process of wheat breeding is essential to understand the limiting factors of increasing yield or quality and to guide future breeding strategies. China is a vast region with a complicated climate. According to the climate characteristics, tillage and cultivation system, wheat variety type, and sowing date, the wheat-growing regions in China are divided into three areas: the northern winter wheat region, the southern winter wheat region, and the spring wheat region [1,27]. In 2020, the arable area of wheat in three wheat-growing regions was 13.4 × 10⁶ ha, 7.4 × 10⁶ ha, and 2.5 × 10⁶ ha, respectively. The wheat yield was 8.5 × 10⁷ t, 3.8 × 10⁷ t, and 1.1 × 10⁷ t [28]. In this study, we collected grain yield and quality data of 1908 wheat varieties released in the past two decades in the three-dominant wheat-growing regions in China to comprehensively analyze the historical process of wheat yield and quality, clarify the effect of wheat breeding on genetic yield potential and genetic yield gap, and explore the limiting factors of improving wheat yield and quality simultaneously to promote the sustainable development of agriculture.

2. Materials and Methods

Newly bred breeding lines must be evaluated before they can be registered on the National List as new varieties and released for production. The processes of evaluation were as below: (1) the breeder applies for evaluation for the newly bred breeding lines; (2) a one-year comparative testing is carried out for all the breeding lines applying for evaluation; (3) a two-year regional testing is conducted on all breeding lines that met the evaluation criteria of comparative testing; (4) the production testing for 1–2 years is carried out for all breeding lines which met the evaluation criteria of regional testing; (5) the breeding lines that meet the evaluation criteria of production testing can be registered on the National List as new varieties and released for production. The comparative testing, regional testing, and production testing are carried out at a fixed variety of testing sites, consisting of several sites. Each of the wheat-growing regions has its own fixed variety testing sites, which are designated by the Testing Network for National Variety Testing. There are >20 fixed testing sites that represent the typical growing environment in each wheat-growing region. In the comparative testing, regional testing, and production testing of each wheat-growing region, the control varieties, fertilizer levels, and other agronomic management were the same. According to the rules of registration for wheat variety (i.e., NY/T 967-2006), the evaluation indicator of comparative testing, regional testing, and production testing includes the yield ability, quality, variety characteristics, adaptability, stress resistance, use, etc.
Field data of wheat grain yield, yield components, and protein quality data of 1908 released wheat varieties in China in the past two decades (from 2001 to 2020) were collected from registration reports (data from the Department of Agriculture Seed Management Station). The wheat yield and yield components data (including thousand kernel weight (TKW), spike number, and kernel number per spike) in the registration report were based on regional testing and production testing in China. The wheat quality data (including protein concentration, wet gluten, sedimentation value, water absorption, and stability time) in the registration report was determined by the Cereal Quality Supervision and Testing Center, Ministry of Agriculture. The quality testing included at least 2 years of test results. The data on wheat grain yield and quality in the registration reports are presented as duplicates or data ranges. The average value was collected for data from the duplicate and a median value was collected for data from the data range. The 1908 wheat varieties were divided into three groups: the north winter wheat, the south winter wheat, and the spring wheat according to agroecological production zones in China [1].
To calculate the rates of change for grain yield and quality parameters with the year of release in each wheat-growing region (detailed data see Figure S1), regression analysis with a standard linear model was applied to cultivar average (i.e., representing regional overall performance), 95% quantile (i.e., representing regional upper limit), and 5% quantile (i.e., representing regional lower limit). The significance of linear regression slopes was tested using a linear regression t-test. The annual rate of increase in yield is expressed as a percent of current grain yield estimated from the trendline in the last year (i.e., 2020) for which there are statistics, i.e., the slope of the linear regression divided by yield (in 2020) that calculated by the regression equation then multiply 100% [29]. This is because using the estimated grain yield for the latest year as the denominator to calculate the relative rate of progress reduces the influence of weather-induced fluctuations in grain yield, and a slope expressed relative to recent yield will prove far more relevant to the future [29].
The genetic yield gap was defined as the gap between genetic yield potential and actual yield [30]. Genetic yield potential is represented by the average value of the highest 10% (90th quantile) yield of released wheat varieties [30]. Actual yield was obtained from the National Bureau of Statistics of China (http://www.stats.gov.cn/english/, accessed on 30 June 2022). Genetic yield component potential (GYCP) is represented by the average value of yield components for the top 10% yield of released wheat varieties. The genetic yield gap percentage was defined as the genetic yield gap relative to the genetic yield potential, expressed as a percentage. Path analysis was performed by SPSS 26 software (IBM Corp., Armonk, NY, USA) to examine the relationships between grain yield and yield components. The path coefficients of yield with respect to yield components were determined by the standardized coefficients in the linear regression models of yield and yield components.
For wheat quality analysis, wheat varieties in the three wheat-growing regions were divided into four quality types: strong gluten wheat, medium-strong gluten wheat, medium gluten wheat, and weak gluten wheat, according to the classification criteria of wheat quality in China (i.e., GB/T 17320-2013 in Table S1). The correlation coefficients between grain yield, yield components, and wheat quality were determined by Pearson’s correlation analysis. All graphs were drawn using Origin software (version 2018) and R (version 3.6.1).
Strong gluten wheat can be used to make bread; medium-strong gluten wheat can be used to make steamed bread, noodles, and dumplings; medium gluten wheat can be used to make steamed bread; weak gluten wheat can be used to make cakes and biscuits.

3. Results

3.1. Statistics of Grain Yield and Quality Parameter

The statistics of wheat yield and quality parameters for the three wheat-growing regions are shown in Table 1. The north winter wheat had the highest yield, and the spring wheat had the highest protein concentration, wet gluten, sedimentation value, water absorption, and stability time from 2001 to 2020. The coefficient of variation for TKW, protein concentration, and water absorption was relatively low in the three wheat-growing regions. Grain yield, spike number, kernel number, protein yield, wet gluten, and sedimentation value had a medium coefficient of variation. Stability time had a high coefficient of variation in three wheat-growing regions (Table 1). The frequency distribution of yield and quality parameters for wheat varieties in each group is shown in Figure S2.

3.2. Grain Yield and Yield Components

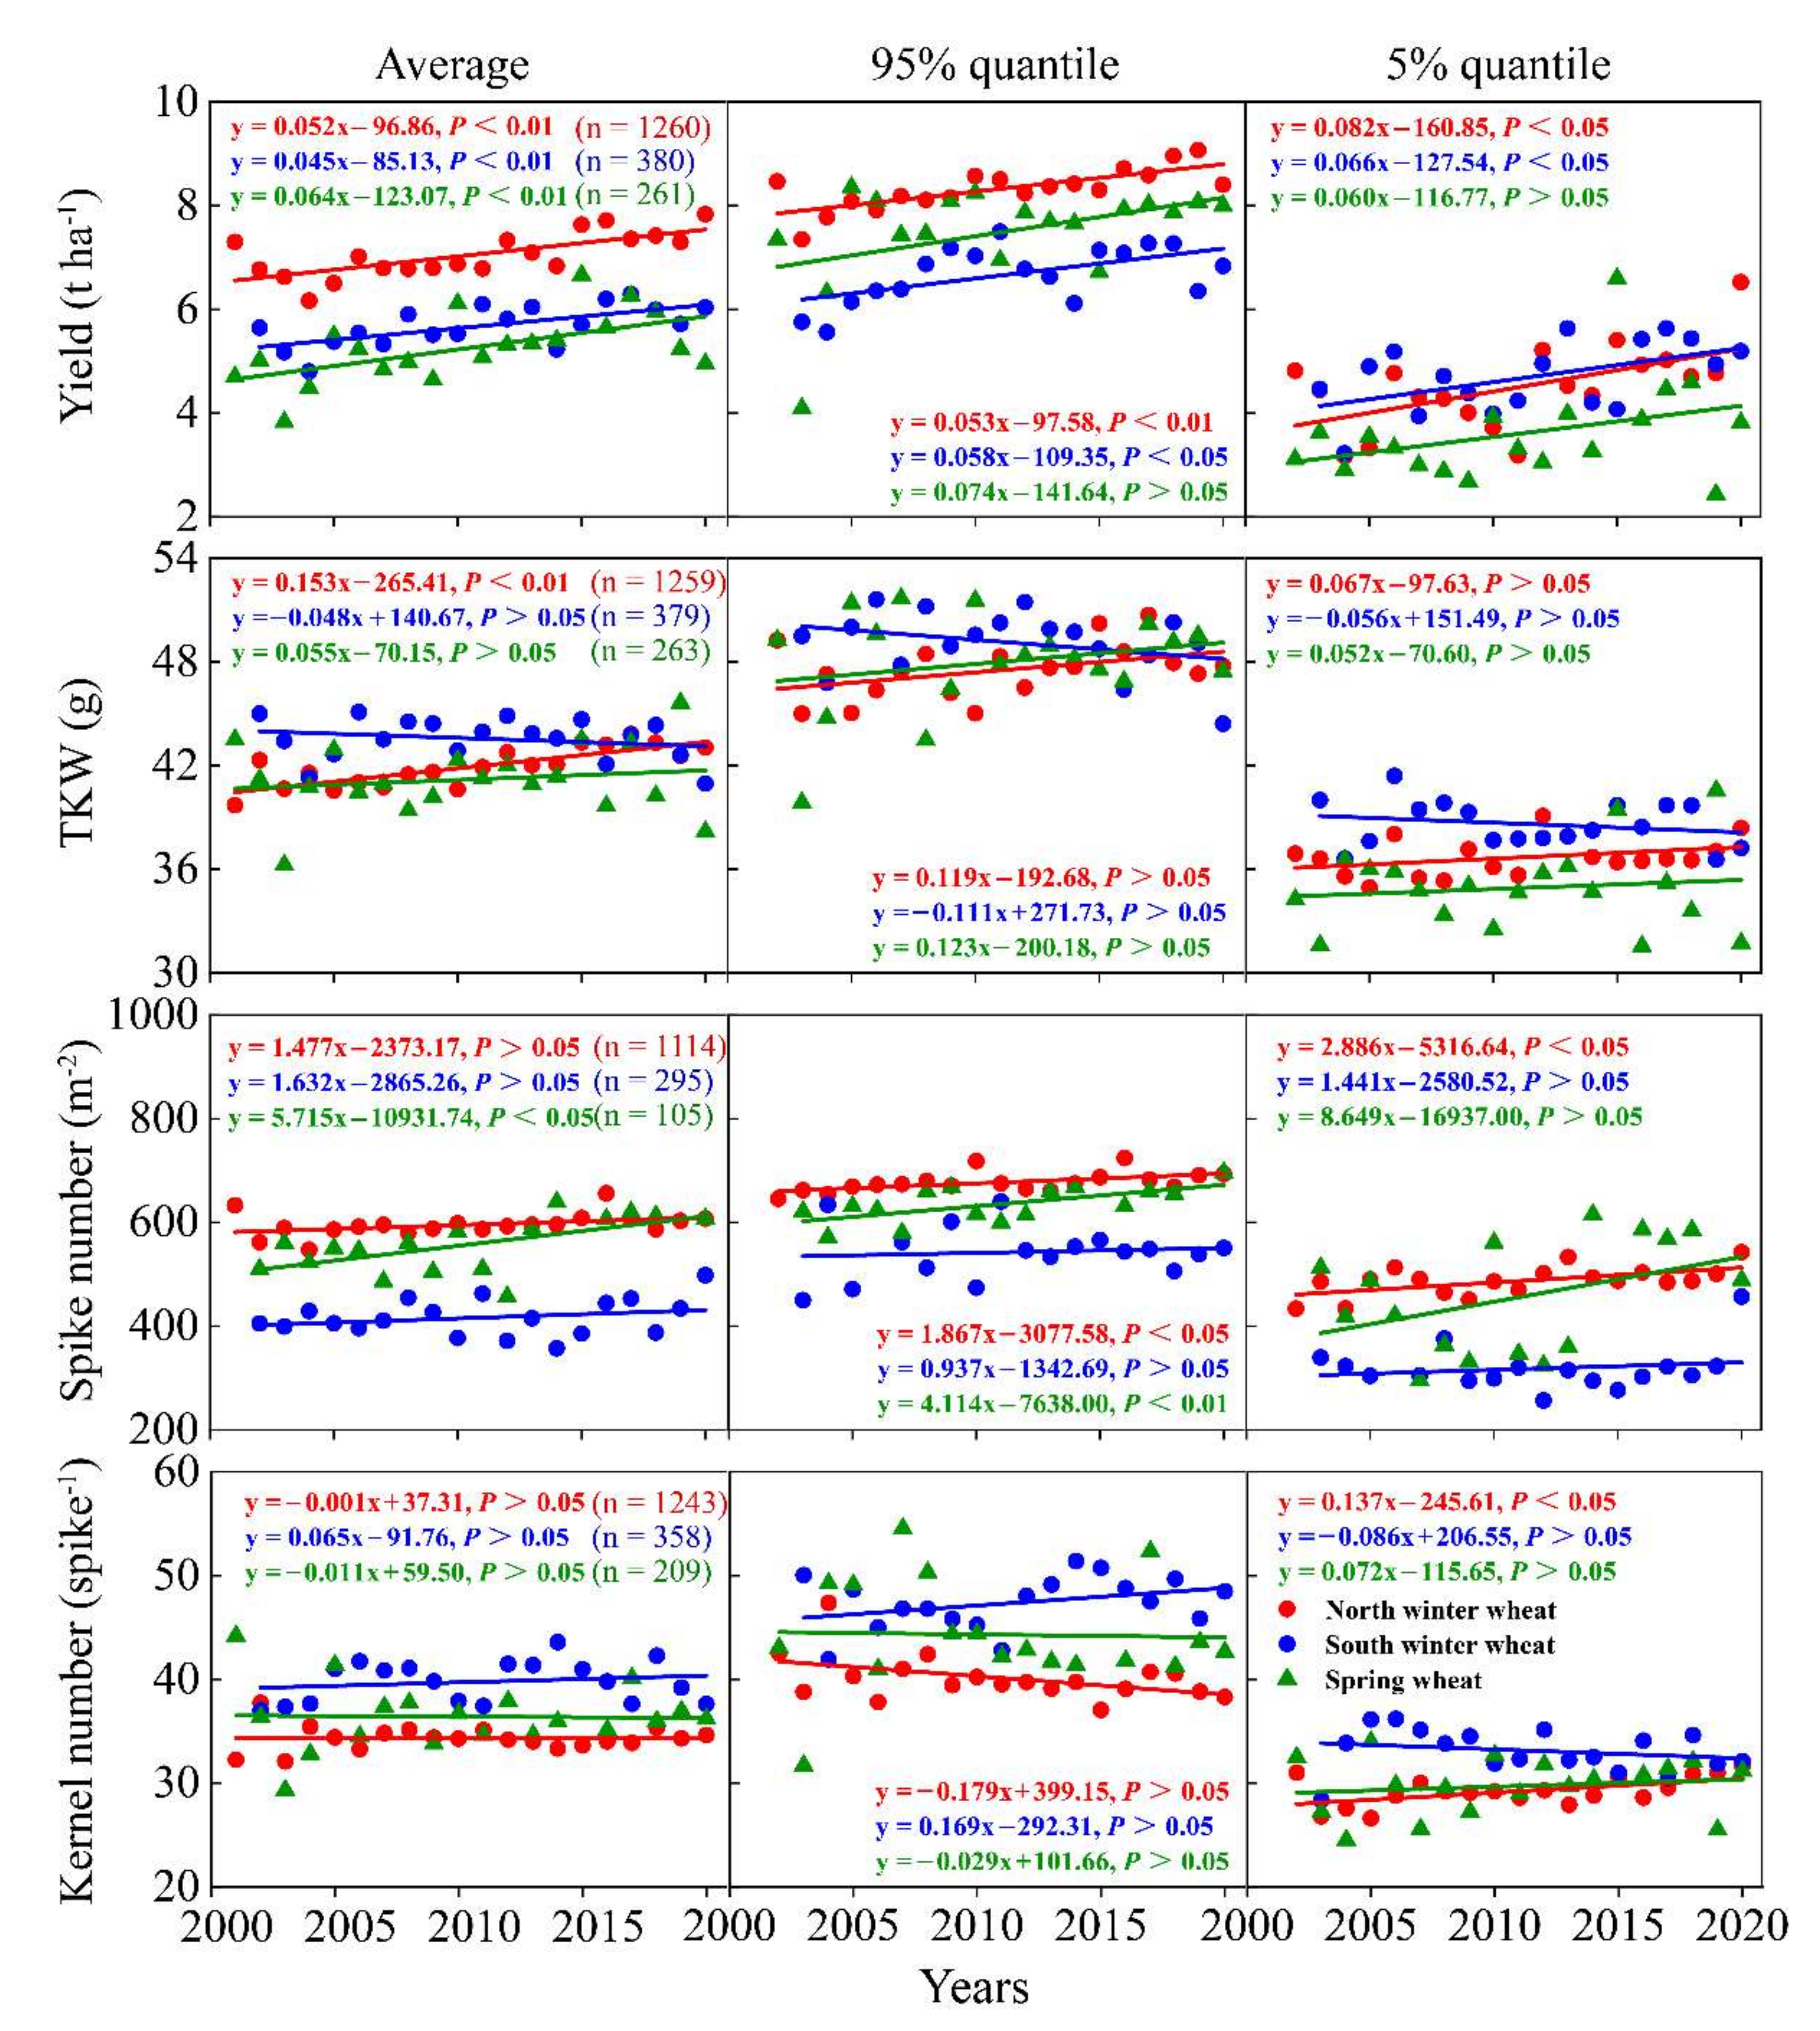
Grain yield in all three wheat-growing regions significantly increased with breeding progress in the past two decades from 2001 to 2020 (Figure 2). The annual rates of increase in grain yield (i.e., the average) for the north winter wheat, the south winter wheat, and the spring wheat were 0.64% (52 kg ha−1 yr−1), 0.78% (45 kg ha−1 yr−1), and 1.03% (64 kg ha−1 yr−1), respectively. The annual rates of yield progress for the high-yielding varieties (i.e., 0.56–0.94% for the 95% quantile) were much slower than those of the non-high-yielding varieties (i.e., 1.14–1.71% for the 5% quantile).
There was no change for TKW except for the average of the north winter wheat, which increased (0.153 g yr−1) significantly over time (Figure 2). The average spike number per m2 of the spring wheat significantly increased (5.715 yr−1) over time (Figure 2). There was a slight increase in spike number for the 95% quantile of the north winter wheat and the spring wheat, as well as for the 5% quantile of the north winter wheat (Figure 2). The average kernel number per spike did not significantly change in any of the three regions (Figure 2). Kernel number per spike for the 5% quantile of the north winter wheat significantly increased (0.137 yr−1) over time (Figure 2).

3.3. Protein Concentration, Protein Yield, and Protein Quality

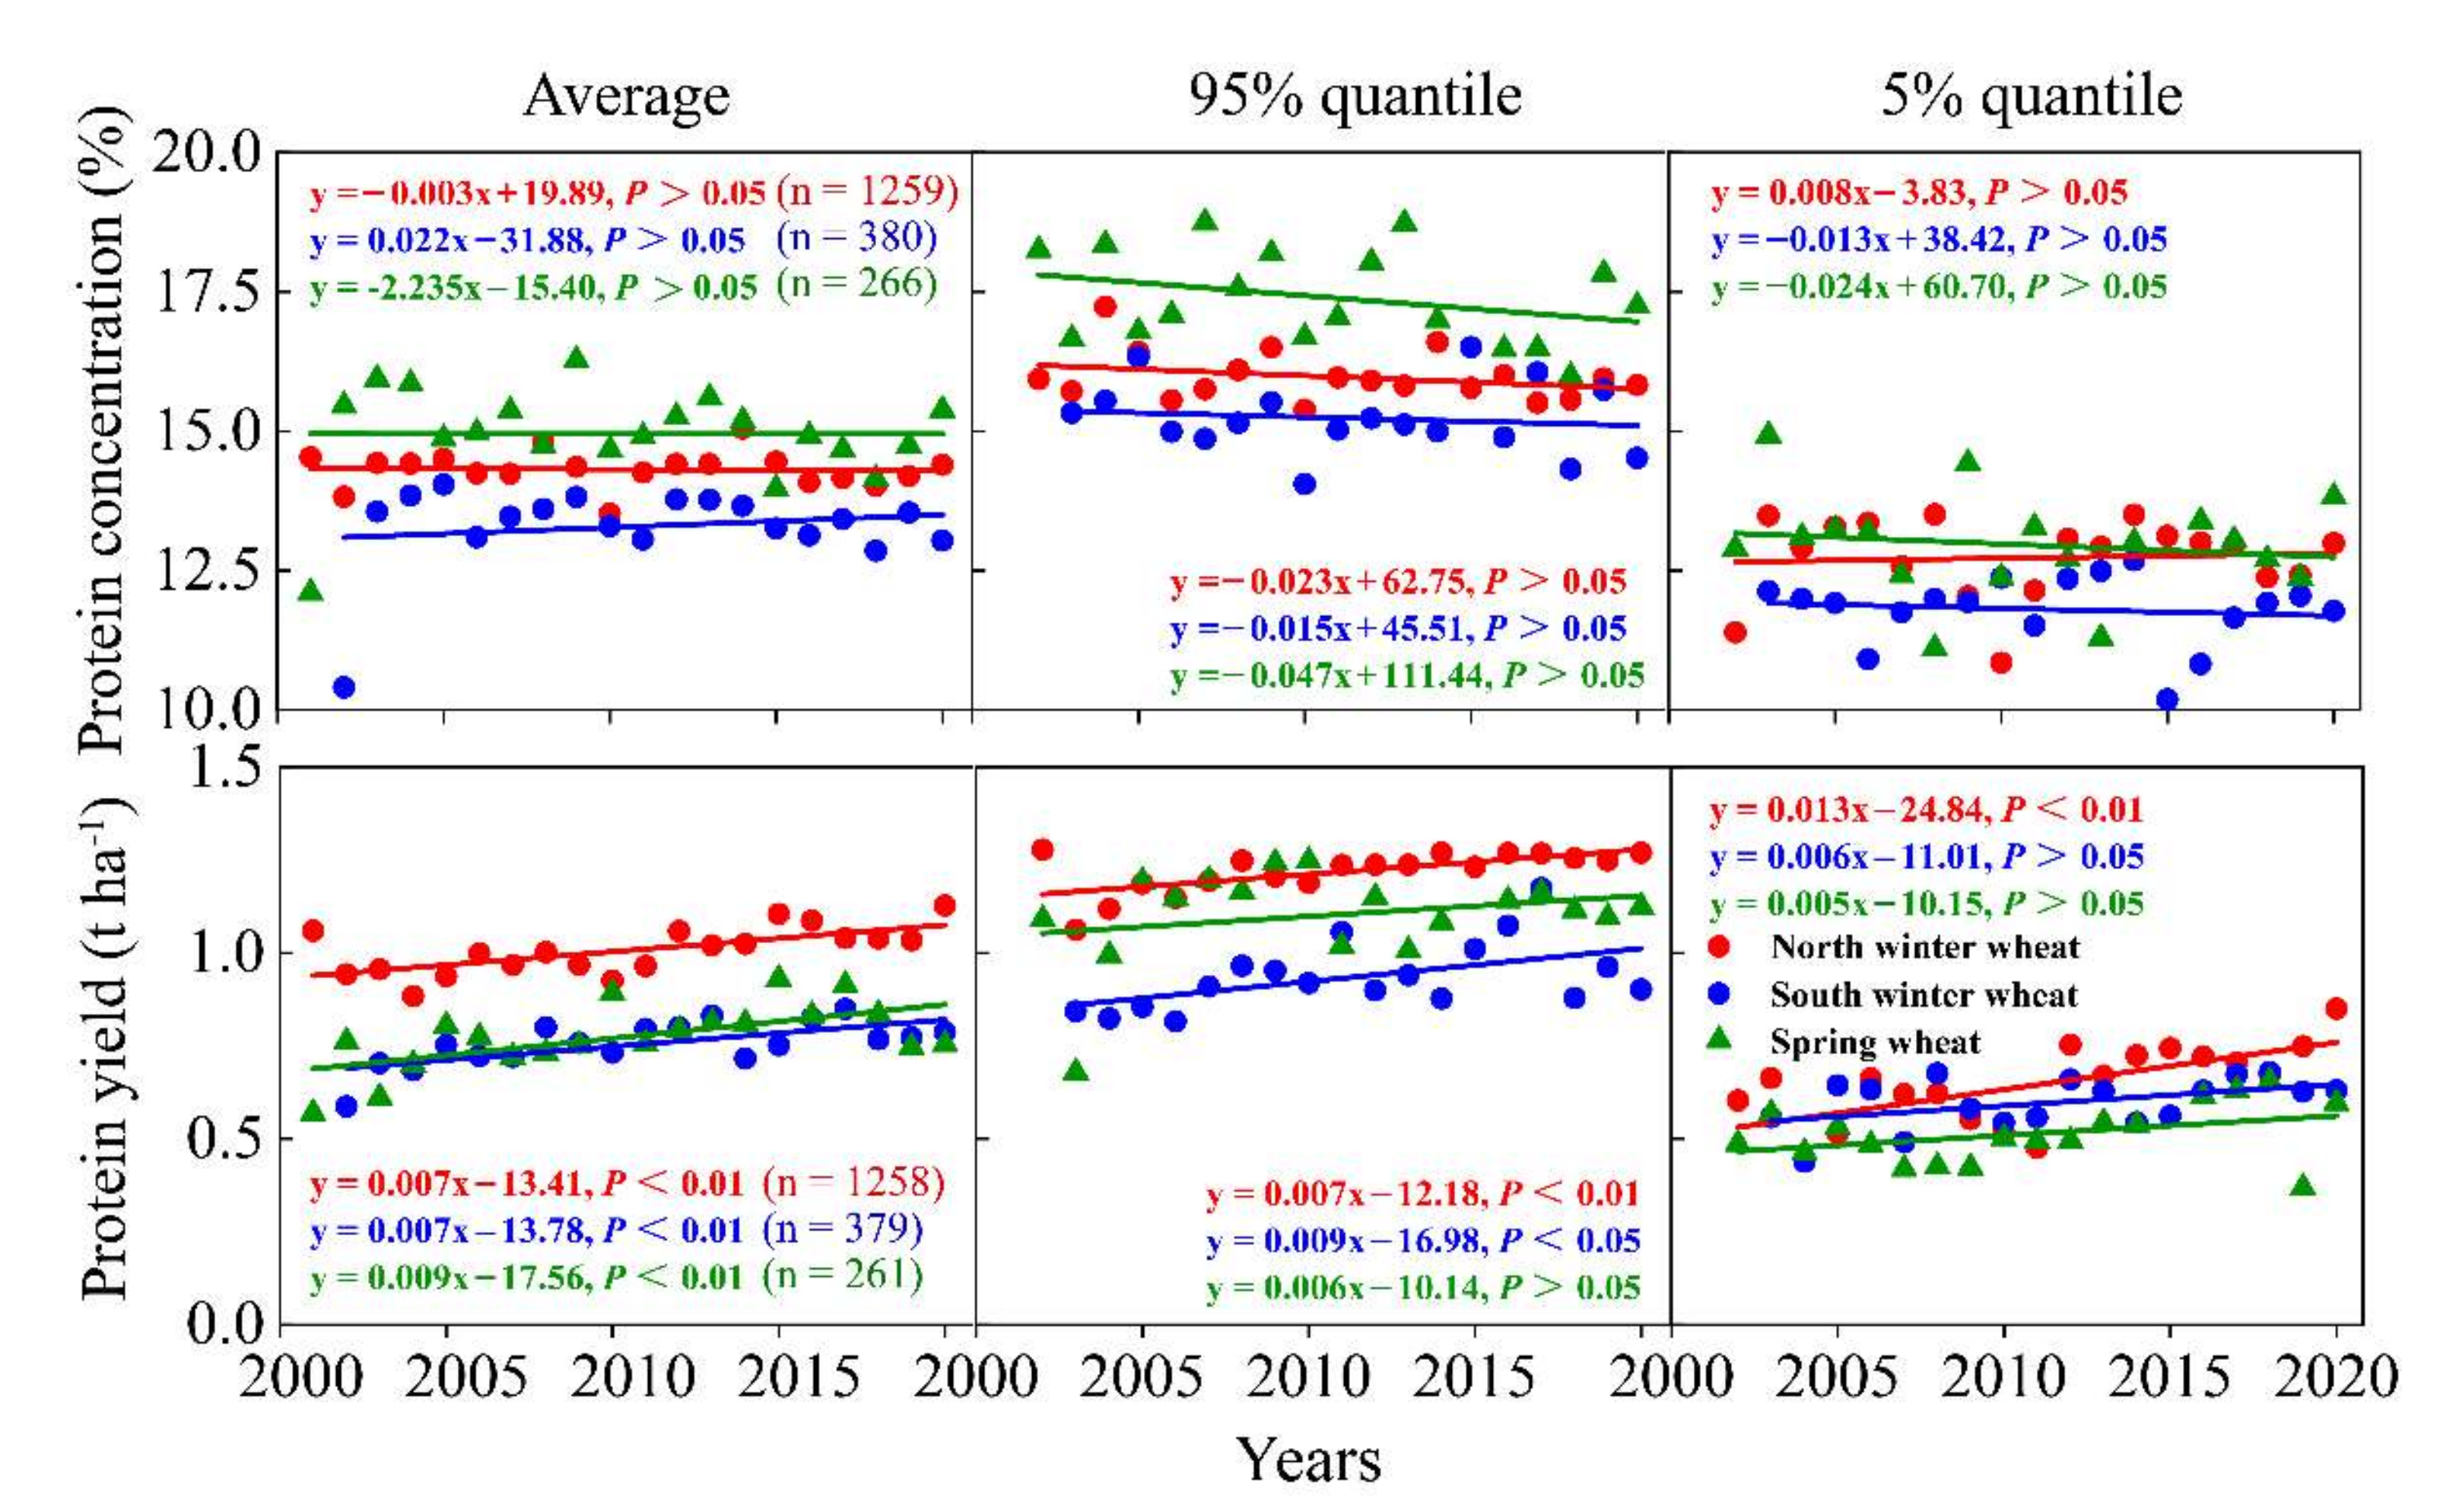
More importantly, there was no change in protein concentration in all three wheat-growing regions over time (Figure 3). The average protein yield in all three wheat-growing regions significantly increased with breeding progress. Protein yield for the 95% quantile of the winter wheat and the 5% quantile of the north winter wheat significantly increased (Figure 3).
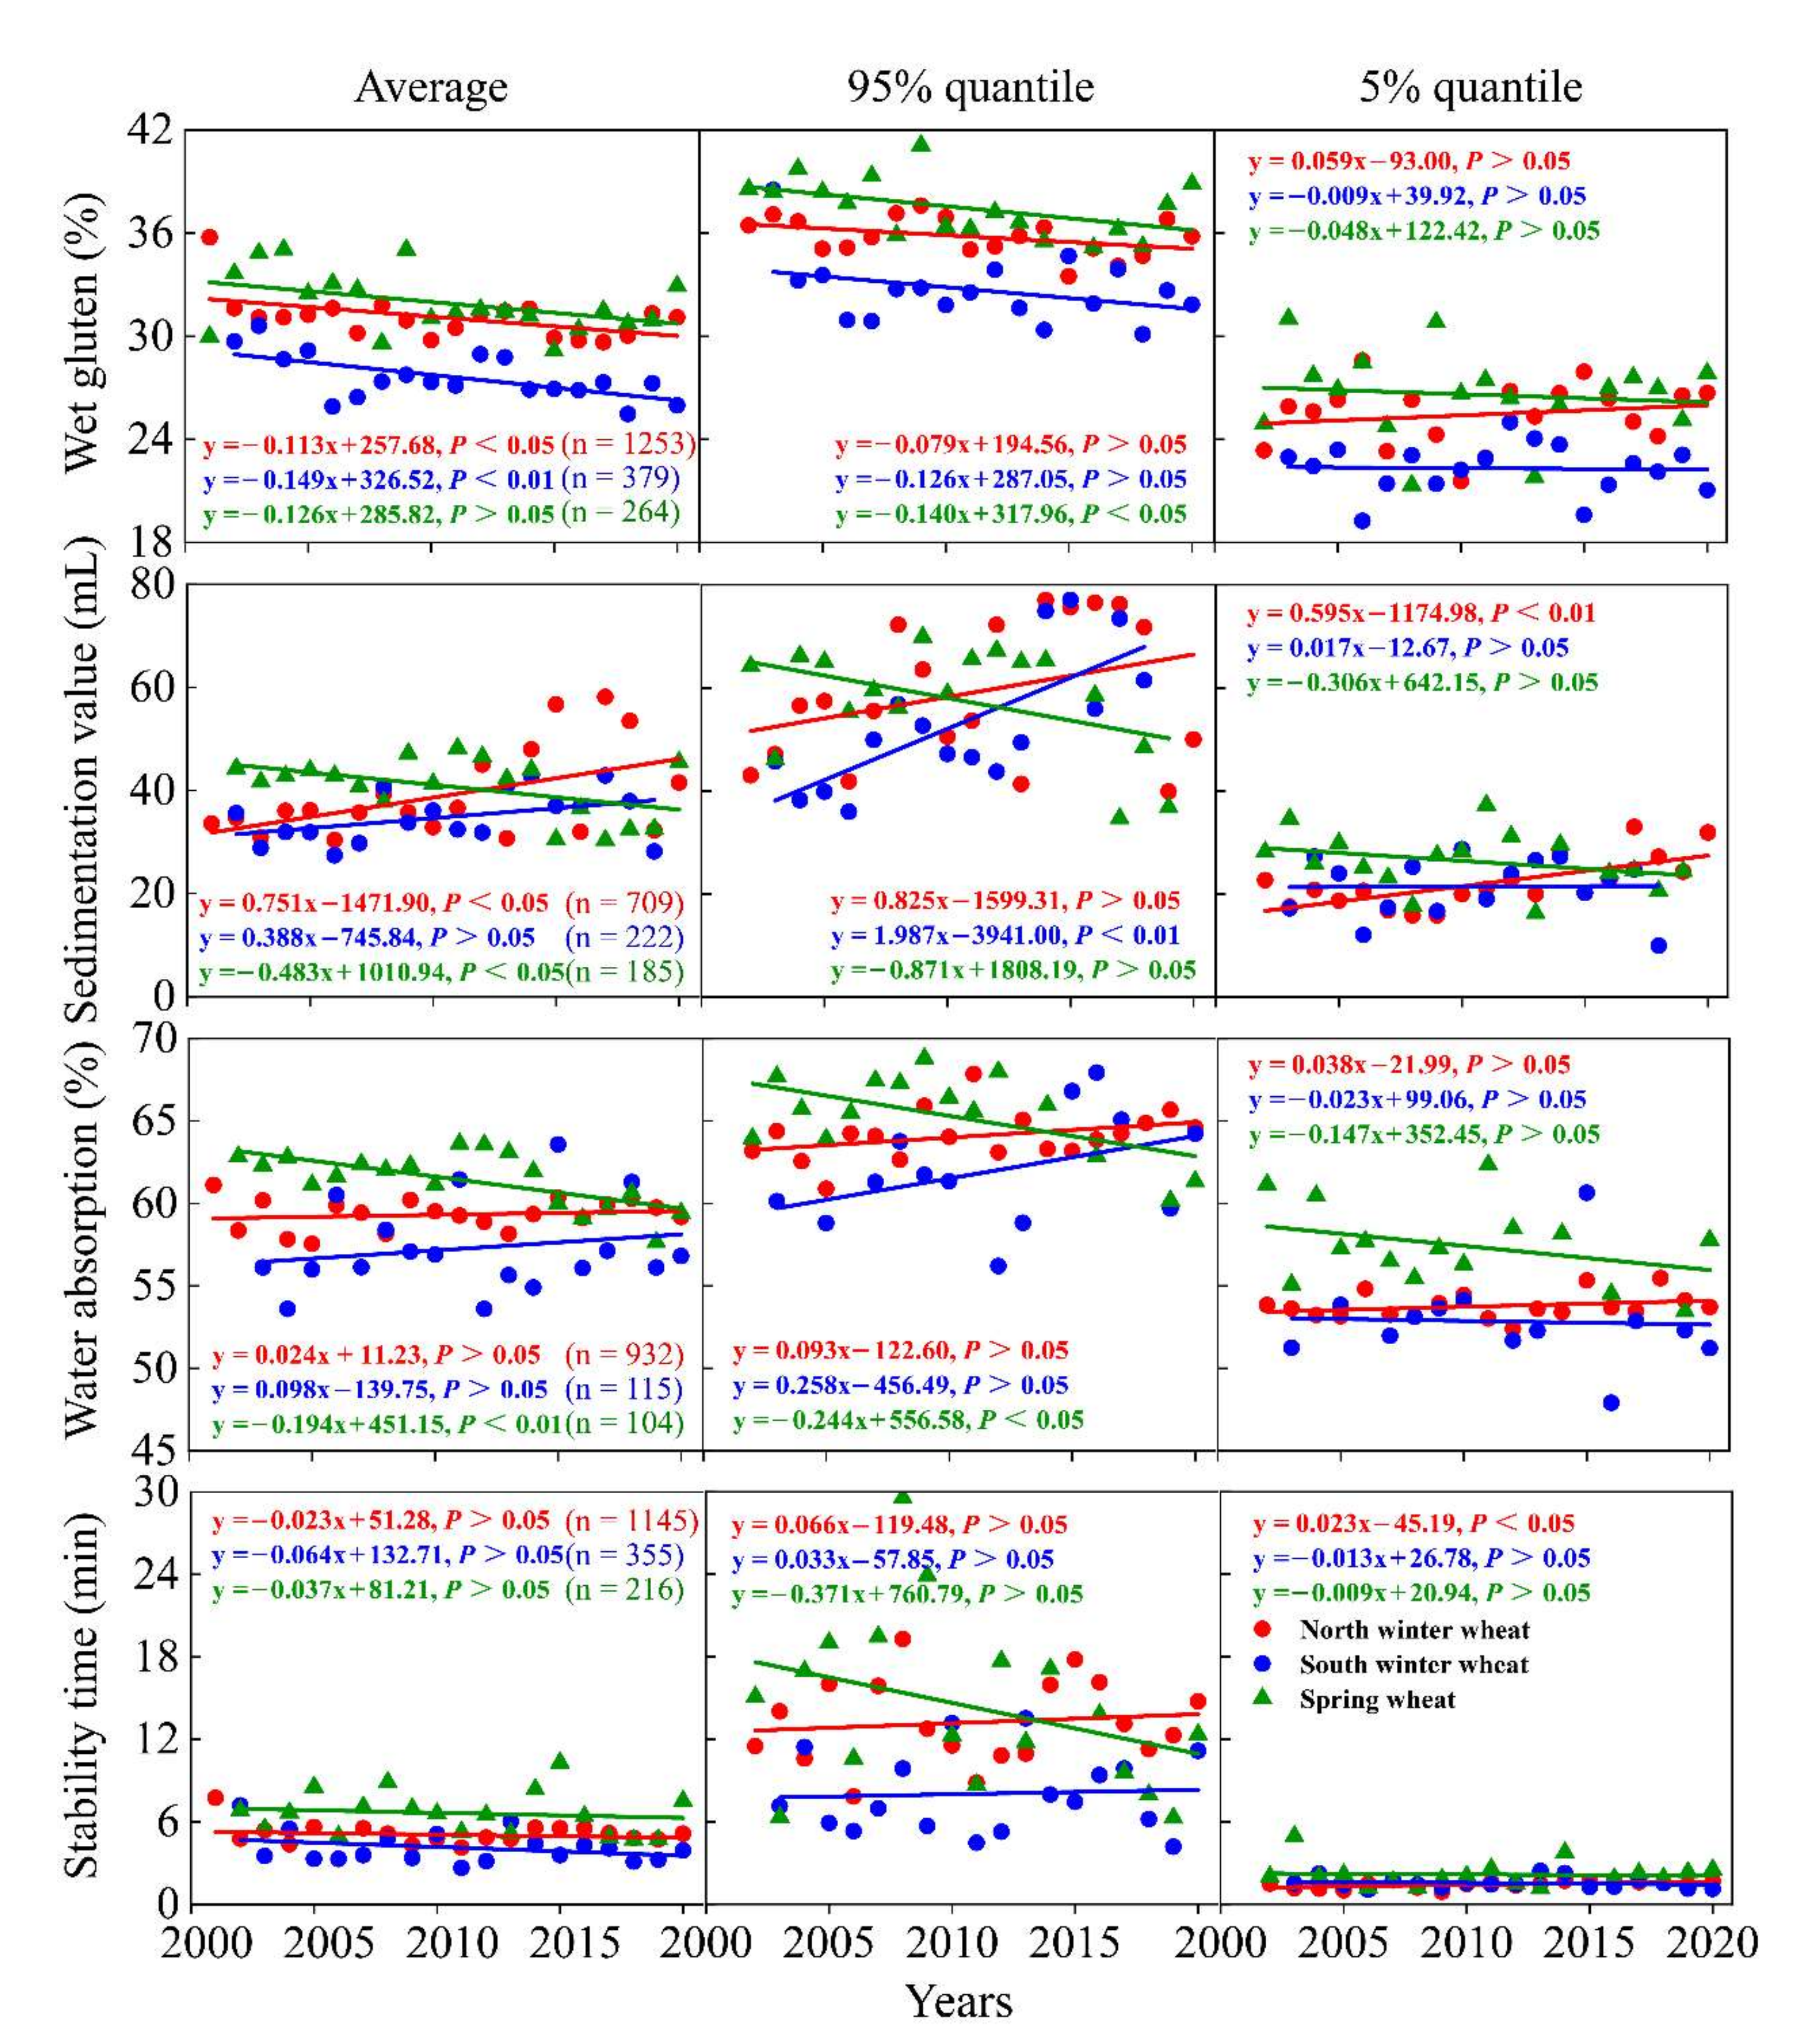
Wet gluten in the winter wheat-growing region significantly decreased with breeding progress. There was no change for the 95% quantile and 5% quantile of wet gluten except for the 95% quantile of the spring wheat, which decreased (0.140% yr−1) significantly over time (Figure 4). Sedimentation values for the average and 5% quantile of the north winter wheat significantly increased (0.751 and 0.595 mL yr−1) and for the 95% quantile of the south winter wheat significantly increased (1.987 mL yr−1). However, the average sedimentation value for the spring wheat decreased significantly (0.483 mL yr−1). There was no change in water absorption and stability time, except for the average and 95% quantile of water absorption in the winter wheat regions which significantly decreased with breeding progress.
The number of wheat varieties with different quality grades are shown in Table 2. The proportion of medium gluten wheat was the largest in the three wheat-growing regions, reaching 81.4%, 78.2%, and 62.8%, respectively, from 2001 to 2020 (Table 2). The proportion of weak gluten wheat was the lowest in the northern winter wheat region and the spring wheat region (0.7% and 2.3%), while the proportion of strong gluten wheat was the lowest in the southern winter wheat region (3.9%, Table 2).

3.4. Genetic Yield Potential and Genetic Yield Gap

Due to the breeding effort, the genetic yield potential increased, and the genetic yield gap closed in all three regions (Table 3). The genetic yield potential of the winter wheat significantly increased by 0.42 and 0.18 t ha−1 (for the north winter wheat and the south winter wheat, respectively) from 2010 to 2020 while the actual yield significantly increased by 0.74 and 1.00 t ha−1 (Table 3). As a result, the genetic yield gap significantly decreased by 0.44 and 0.82 t ha−1. The most recent genetic yield gap (i.e., in 2020) was between 2.06 and 3.72 t ha−1 in the three wheat-growing regions, representing 29–46% of wheat genetic yield potential (Table 3).
Genetic yield potential is represented by the average value of the top 10% yield of released wheat varieties. Actual yield was provided by the National Bureau of Statistics of China (http://www.stats.gov.cn/english/, accessed on 30 June 2022). Genetic yield gap was defined as the difference between genetic yield potential and actual yield. The genetic yield gap percentage was defined as the genetic yield gap relative to the genetic yield potential, expressed as a percentage.
For the genetic yield component potential (GYCP, Table 4), the TKW, spike number per m2, and kernel number per spike of GYCP were 3%, 5%, and 3% higher for the north winter wheat, 1%, 14%, and 2% higher for the south winter wheat, and 17%, 12%, and 11% higher for the spring wheat, respectively, as compared to the average value of yield components.
Genetic yield component potential (GYCP) is represented by the average value of yield components for the top 10% yield of released wheat varieties. Average yield component (AYC) is represented by the average value of yield components for all released wheat varieties from 2001 to 2020. Increasing range (IR) is represented by the difference between GYCP and AYC divided by AYC.

4. Discussion

4.1. Breeding Progress of Wheat Yield

The wheat yield exhibits a continuous increase from 2001 to 2020 in China (Figure 2), indicating that breeding programs have made a great contribution to wheat production in China. Shi et al. [31] also demonstrated that the adoption of new varieties was the decisive factor for improving yields. Although climate change had a negative impact on wheat yield [32,33], the adoption of new varieties and field management practises have offset the negative influence of climate change [31,34]. The increase rate of wheat yield in the winter wheat region found in this study (0.64–0.78% yr−1) was lower than (1.29–1.5% yr−1) in 1980–2000 [1]. This is likely due to two reasons: (1) From 2001 to 2020, the plant height of wheat in China had been stable since 2001 and was in the ideal range of 70–90 cm [1,35], although there was a slight decrease in plant height of the winter wheat (Figure S3). As a result, there is small space left with existing ‘Green Revolution’ wheats (bred with GA-insensitive dwarfing genes to reduce height) on yield improvement from 2001 to 2020 compared to between 1980 to 2000; (2) The genetic base of wheat breeding narrowed, and the genetic diversity decreased with the development of breeding [36].
As the most important wheat producing region, the wheat yield produced in the northern winter wheat region accounts for about 72% of the whole wheat production in China [37,38]. From the 1990s to 2010s, the north winter wheat varieties had the highest average yield, followed by the south winter wheat varieties, and the lowest by the spring wheat varieties [1], which was similar to the results observed in this study (Figure 2). It has been reported that the yield of the spring wheat is generally lower than that of the winter wheat [39]. The spring wheat had higher genetic yield potential and the highest yield variation coefficient (Table 1 and Table 3), and some varieties in the spring wheat region had higher yield, which indicates that the yield of the spring wheat had great potential to be improved.
It has been reported that breeding programs of wheat varieties had an impact on potential yield and yield gap [40,41,42]. In line with previous studies, this study found that genetic yield potential of the winter wheat was increased [41]. More importantly, at the same time, the genetic yield gap of the three wheat-growing regions was closed due to wheat breeding (Table 3). This finding was consistent with the conclusion reached by [40].
Our results indicated that in the past 20 years, the increase in wheat yield for the north winter wheat was attributed to the improvement of TKW and spike number, while for the south winter wheat and the spring wheat, it was attributed to the improvement of spike number (Figure 2, Table S2). It has been known that grain yield improvement of the winter wheat was primarily attributed to increased TKW, increased kernel number per spike, and reduced plant height. The spring wheat was primarily attributed to increased kernel number per spike from 1960 to 2000 [1,12,43]. As it is difficult to increase TKW and kernel number per spike continuously, future grain yield improvement may focus on the increase in spike number. It is worth noting that the increase in wheat yield for the north winter wheat was attributed to the improvement of TKW from 2001 to 2020. This may be because TKW has the highest heritability among the three yield components, and selecting TKW in breeding programs is an effective way in this region to increase wheat yield [44]. The larger the difference between average yield component and genetic yield component potential, the higher the space of yield component improvement in the future. According to the comparison of the average yield component and genetic yield component potential, future increases in wheat yield in the winter wheat region may be achieved by improvement in spike number, and in the spring wheat region may be achieved by improvement in TKW, spike number, and kernel number per spike (Table 4).

4.2. Breeding Progress of Wheat Quality

It has been reported that protein concentration in Europe decreased significantly with the year of registration between 1980 and 2010 [45,46], and the protein concentration in China also showed a downward trend from 1949 to 1999 [21]. However, no significant change in the protein concentration from 2001 to 2020 was observed in our study (Figure 3). The objective of wheat production in China has changed from high yield to high yield and quality since 2001, and the Ministry of Agriculture has arranged annual quality testing of wheat varieties nationwide since 2002 [18]. Consequently, the quality of wheat acquired increasing attention in China. The newly bred wheat varieties have maintained stable protein concentration in the past 20 years. One possible reason that the protein concentration is not increasing significantly is that the ceiling of the wheat species has been approximately reached as a result of luxury N uptake because historically, wheat is nitrogen starved. Another possible reason may be the significant increase in yield. The major component in the wheat grain is starch, which accounts for approximately 70% of the grain’s dry weight [45]. Hence, increases in yield essentially reflect an increase in starch accumulation. Increased starch accumulation in grains dilutes other grain components, including protein. Therefore, when the increasing rate of protein concentration did not exceed the increasing rate of yield, the protein concentration showed no significant increase. It has been known that varieties that combine a superior yield potential with a comparably high protein content can be developed by multi-trait genomic selection [47]. Therefore, with the development of molecular breeding, wheat protein concentration should be further improved in the future.
According to the classification data of wheat quality, 78% of wheat varieties in China belong to medium gluten wheat and 13% belong to medium-strong gluten wheat (Table 2). The number of strong gluten wheat and weak gluten wheat was lower, which may be related to the dietary habits of China. In China, steamed bread and noodles are the most popular wheat products [48,49,50], representing about 46% and 39% of the total consumption of wheat, respectively [48]. Although the number of weak gluten wheat in the southern winter wheat region and strong gluten wheat in the northern winter wheat region increased with the breeding progress, they still accounted for a low proportion in new-bred wheat variety (Table 2). The reason may be that the development of each quality trait is not coordinated. The number of wheat varieties with sedimentation value and stability time meeting the criteria of strong gluten wheat was much lower than that with protein concentration and wet gluten meeting the criteria of strong gluten wheat in the northern winter wheat region (Figure S4). The number of wheat varieties with sedimentation values meeting the criteria of weak gluten wheat was much lower than that with protein concentration, wet gluten, and stability time meeting the criteria of weak gluten wheat in the southern winter wheat region (Figure S4). Previous studies have also shown that the main problem of strong gluten and weak gluten wheat varieties in China is that the stability time is not coordinated with protein concentration and wet gluten [51]. The number of wheat varieties with different quality traits meeting the criteria of strong gluten wheat was much higher than the actual quantity of strong gluten wheat in the northern winter wheat region (Figure S4, Table 2), which suggests the potential of breeding more strong gluten wheat in this region in the future.

4.3. The Relationship between Wheat Yield and Protein Concentration

A strong negative relationship between wheat yield and protein concentration has been reported in the literature [39,46,52]. We observed the same in the present study (Figure S5). This is caused largely by the fact that the starch content of wheat increased [45,53]. Starch is the main component of wheat grain, accounting for about 70% of the dry weight of grain. Therefore, the increase in wheat yield is mainly due to increased starch accumulation, which dilutes the protein in the grain [45]. The simultaneous improvement of grain yield and quality is thereby a great challenge for wheat breeding.
To improve grain yield and quality of wheat simultaneously, various methods were reported in previous studies. Using protein yield as the selection criteria for wheat varieties is one of the methods [54]. The protein yield had a significant positive correlation with grain yield [47,55]. Michel et al. [47] also showed that the negative trade-off between grain yield and protein concentration could be alleviated by using genomic selection indices to achieve higher protein yield. Another method to improve grain yield and quality of wheat simultaneously is to improve the protein quality of wheat [25,46]. Sedimentation value, wet gluten content, and dough rheological properties are commonly used to indicate protein quality [23,24,25,26]. Michel et al. [25] demonstrated that gluten strength or viscosity and dough rheological traits had a smaller negative correlation with grain yield than the protein concentration. Our study showed similar results, although protein concentration was significantly negatively correlated with wheat yield, protein quality indicators, such as sedimentation value and stability time, had a significant positive correlation with grain yield in the winter wheat region (Figure S5). The protein quality of wheat could be improved by marker-assisted selection (e.g., by introducing individual genes (alleles) by conventional crossing) [47,56,57]. Genomic selection shows great promise for pre-selecting lines with superior quality in early generations [56]. Glu-U3a and Glu-U3b from the related 1U genome contribute to superior gluten content and stability time [58]. The functional markers of TaUBP24 could be directly used for marker-assisted selection to improve wheat quality and yield [59]. At the same time, wheat varieties with a high yield and high protein concentration have also existed in the past (Figure S6). Therefore, wheat varieties with high yield and high quality can be developed by a genomic selection of grain yield, protein concentration, and protein quality simultaneously [25].

5. Conclusions

This study summarizes the historical process of wheat breeding in China over the past 20 years and comprehensively evaluates the variability trend of yield and quality of wheat varieties in three wheat-growing regions. Great achievements have been made in yield improvement during the last 20 years in China. At the same time, there was no significant decrease in protein concentration. The increase in grain yield was attributed to the increase in thousand kernel weight and spike number in the northern winter wheat region and to the increase in spike number in the southern winter wheat region and the spring wheat region. The genetic yield potential of the winter wheat was increased and the genetic yield gap of the three wheat-growing regions was closed due to wheat breeding. Higher yield and better quality can be obtained simultaneously by genomic selection in future wheat breeding.

Supplementary Materials

The following supporting information can be downloaded at: https://www.mdpi.com/article/10.3390/agronomy12092109/s1, Figure S1. Grain yield, yield components, and grain quality data of wheat varieties released from 2001 to 2020 for three wheat-growing regions: Figure S2. The frequency distribution of yield and quality parameters for wheat varieties in three wheat-growing regions from 2001 to 2020: Figure S3. The average value, 95% quantile value, and 5% quantile value of plant height of wheat varieties released from 2001 to 2020 for three wheat-growing regions: Figure S4. Number and proportion of wheat varieties that meet the criteria of strong gluten wheat or weak gluten wheat for each quality trait of three wheat-growing regions. The classification criteria for the quality of wheat varieties are shown in Table S1. PC: protein concentration, WG: wet gluten, SV: sedimentation value, WA: water absorption, ST: stability time; Y1: 2001–2005, Y2: 2006–2010, Y3: 2011–2015, Y4: 2016–2020: Figure S5. Correlation coefficients among wheat yield and wheat quality. PC: protein concentration, PY: protein yield, WG: wet gluten, SV: sedimentation value, WA: water absorption, ST: stability time: Figure S6. Distribution plot of yield and protein concentration for wheat varieties released from 2001 to 2020 for three wheat-growing regions. The number of wheat varieties with a yield higher than 7.5 t ha−1 and protein concentration higher than 14% in the three wheat-growing regions were 438, 1, and 24, respectively: Table S1. Classification criteria for quality of wheat varieties (GB/T 17320-2013): Table S2. Path coefficients among wheat yield and yield components.

Author Contributions

Data collection, N.H., C.D. and W.Z.; data analysis, N.H., Y.L. and Y.Z.; writing—manuscript, N.H.; revision—manuscript, Z.Z. and Z.W. All authors have read and agreed to the published version of the manuscript.

Funding

This research was funded by the Key Research and Development Program of Hebei Province (grant numbers: 21327003D-1), and the China Agriculture Research System (CARS-3).

Data Availability Statement

The data included in this research are available upon request by contact with the corresponding author.

Acknowledgments

This work was supported by the Key Research and Development Program of Hebei Province (grant numbers: 21327003D-1), and the China Agriculture Research System (CARS-3). Financial support from the above sources is gratefully acknowledged.

Conflicts of Interest

We declare that we have no known competing financial interests or personal relationships that could have appeared to influence the work reported in this paper.

References

  1. Qin, X.; Zhang, F.; Liu, C.; Yu, H.; Cao, B.; Tian, S.; Liao, Y.; Siddique, K.H.M. Wheat yield improvements in China: Past trends and future directions. Field Crop. Res. 2015, 177, 117–124. [Google Scholar] [CrossRef]
  2. Mueller, N.D.; Gerber, J.S.; Johnston, M.; Ray, D.K.; Ramankutty, N.; Foley, J.A. Correction: Corrigendum: Closing yield gaps through nutrient and water management. Nature 2013, 494, 390. [Google Scholar] [CrossRef]
  3. Ortiz, R.; Braun, H.; Crossa, J.; Crouch, J.H.; Davenport, G.; Dixon, J.; Dreisigacker, S.; Duveiller, E.; He, Z.; Huerta, J.; et al. Wheat genetic resources enhancement by the International Maize and Wheat Improvement Center (CIMMYT). Genet. Resour. Crop. Ev. 2008, 55, 1095–1140. [Google Scholar] [CrossRef]
  4. Pingali, P.L. Green Revolution: Impacts, limits, and the path ahead. Proc. Natl. Acad. Sci. 2012, 109, 12302–12308. [Google Scholar] [CrossRef] [PubMed]
  5. Wang, F.; He, Z.; Sayre, K.; Li, S.; Si, J.; Feng, B.; Kong, L. Wheat cropping systems and technologies in China. Field Crop. Res. 2009, 111, 181–188. [Google Scholar] [CrossRef]
  6. Bodirsky, B.L.; Mueller, C. Robust relationship between yields and nitrogen inputs indicates three ways to reduce nitrogen pollution. Environ. Res. Lett. 2014, 9, 111005. [Google Scholar] [CrossRef]
  7. Tilman, D.; Fargione, J.; Wolff, B.; D’Antonio, C.; Dobson, A.; Howarth, R.; Schindler, D.; Schlesinger, W.H.; Simberloff, D.; Swackhamer, D. Forecasting agriculturally driven global environmental change. Science 2001, 292, 281–284. [Google Scholar] [CrossRef]
  8. Zheng, T.C.; Zhang, X.K.; Yin, G.H.; Wang, L.N.; Han, Y.L.; Chen, L.; Huang, F.; Tang, J.W.; Xia, X.C.; He, Z.H. Genetic gains in grain yield, net photosynthesis and stomatal conductance achieved in Henan Province of China between 1981 and 2008. Field Crop. Res. 2011, 122, 225–233. [Google Scholar] [CrossRef]
  9. Xiao, Y.G.; Qian, Z.G.; Wu, K.; Liu, J.J.; Xia, X.C.; Ji, W.Q.; He, Z.H. Genetic Gains in Grain Yield and Physiological Traits of Winter Wheat in Shandong Province, China, from 1969 to 2006. Crop. Sci. 2012, 52, 44–56. [Google Scholar] [CrossRef]
  10. Sun, Y.; Wang, X.; Wang, N.; Chen, Y.; Zhang, S. Changes in the yield and associated photosynthetic traits of dry-land winter wheat (Triticum aestivum L.) from the 1940s to the 2010s in Shaanxi Province of China. Field Crop. Res. 2014, 167, 1–10. [Google Scholar] [CrossRef]
  11. Yao, Y.; Lv, L.; Zhang, L.; Yao, H.; Dong, Z.; Zhang, J.; Ji, J.; Jia, X.; Wang, H. Genetic gains in grain yield and physiological traits of winter wheat in Hebei Province of China, from 1964 to 2007. Field Crop. Res. 2019, 239, 114–123. [Google Scholar] [CrossRef]
  12. Zhou, Y.; Zhu, H.Z.; Cai, S.B.; He, Z.H.; Zhang, X.K.; Xia, X.C.; Zhang, G.S. Genetic improvement of grain yield and associated traits in the southern China winter wheat region: 1949 to 2000. Euphytica 2007, 157, 465–473. [Google Scholar] [CrossRef]
  13. Zhang, X.; Davidson, E.A.; Mauzerall, D.L.; Searchinger, T.D.; Dumas, P.; Shen, Y. Managing nitrogen for sustainable development. Nature 2015, 528, 51–59. [Google Scholar] [CrossRef] [PubMed]
  14. Liu, W.; Yang, H.; Folberth, C.; Mueller, C.; Ciais, P.; Abbaspour, K.C.; Schulin, R. Achieving High Crop Yields with Low Nitrogen Emissions in Global Agricultural Input Intensification. Environ. Sci. Technol. 2018, 52, 13782–13791. [Google Scholar] [CrossRef]
  15. Li, S.; Lei, Y.; Zhang, Y.; Liu, J.; Shi, X.; Jia, H.; Wang, C.; Chen, F.; Chu, Q. Rational trade-offs between yield increase and fertilizer inputs are essential for sustainable intensification: A case study in wheat-maize cropping systems in China. Sci. Total Environ. 2019, 679, 328–336. [Google Scholar] [CrossRef] [PubMed]
  16. Haddad, L.; Hawkes, C.; Webb, P.; Thomas, S.; Beddington, J.; Waage, J.; Flynn, D. A new global research agenda for food. Nature 2016, 540, 30–32. [Google Scholar] [CrossRef] [PubMed]
  17. Asseng, S.; Martre, P.; Maiorano, A.; Roetter, R.P.; O’Leary, G.J.; Fitzgerald, G.J.; Girousse, C.; Motzo, R.; Giunta, F.; Babar, M.A.; et al. Climate change impact and adaptation for wheat protein. Glob. Change Biol. 2019, 25, 155–173. [Google Scholar] [CrossRef]
  18. Hu, X.; Sun, L.; Guiying, Z.; Wu, L.; Lu, W.; Li, W.; Wang, S.; Yang, X.; Song, J. Variations of Wheat Quality in China from 2006 to 2015. Sci. Agric. Sin. 2016, 49, 3063–3072. [Google Scholar]
  19. Shewry, P.R.; Halford, N.G. Cereal seed storage proteins: Structures, properties and role in grain utilization. J. Exp. Bot. 2002, 53, 947–958. [Google Scholar] [CrossRef]
  20. Uauy, C.; Brevis, J.C.; Dubcovsky, J. The high grain protein content gene Gpc-B1 accelerates senescence and has pleiotropic effects on protein content in wheat. J. Exp. Bot. 2006, 57, 2785–2794. [Google Scholar] [CrossRef]
  21. Hu, X. Study on the quality status of main wheat varieties in China and the variety evolution of winter wheat region in North China. Chin. Acad. Agric. Sci. 2006. [Google Scholar] [CrossRef]
  22. Yang, X.; Wu, L.; Zhu, Z.; Ren, G.; Liu, S. Variation and trends in dough rheological properties and flour quality in 330 Chinese wheat varieties. Crop. J. 2014, 2, 195–200. [Google Scholar] [CrossRef]
  23. Lin, Z.; Chang, X.; Wang, D.; Zhao, G.; Zhao, B. Long-term fertilization effects on processing quality of wheat grain in the North China Plain. Field Crop. Res. 2015, 174, 55–60. [Google Scholar] [CrossRef]
  24. Nuttall, J.G.; O’Leary, G.J.; Panozzo, J.F.; Walker, C.K.; Barlow, K.M.; Fitzgerald, G.J. Models of grain quality in wheat-A review. Field Crop. Res. 2017, 202, 136–145. [Google Scholar] [CrossRef]
  25. Michel, S.; Loeschenberger, F.; Ametz, C.; Pachler, B.; Sparry, E.; Buerstmayr, H. Simultaneous selection for grain yield and protein content in genomics-assisted wheat breeding. Theor. Appl. Genet. 2019, 132, 1745–1760. [Google Scholar] [CrossRef]
  26. Shewry, P.R.; Halford, N.G.; Tatham, A.S.; Popineau, Y.; Lafiandra, D.; Belton, P.S. The high molecular weight subunits of wheat glutenin and their role in determining wheat processing properties. Adv. Food Nutr. Res. 2003, 45, 219–302. [Google Scholar] [PubMed]
  27. Jin, S. Wheat Cultivation in China; Agriculture Press: Beijing, China, 1961. [Google Scholar]
  28. China Statistical Yearbook; China Statistical Publishing House: Beijing, China, 2021.
  29. Fischer, T.; Byerlee, D.; Edmeades, G. Crop Yields and Global Food Security: Will Yield Increase Continue to Feed the World? ACIAR Monograph No. 158.; Australian Centre for International Agricultural Research: Canberra, Australia, 2014; Volume 158, pp. 1–634. [Google Scholar]
  30. Senapati, N.; Semenov, M.A. Large genetic yield potential and genetic yield gap estimated for wheat in Europe. Glob. Food Secur.-Agric. Policy Econ. Environ. 2020, 24, 100340. [Google Scholar] [CrossRef]
  31. Shi, Y.; Lou, Y.; Zhang, Y.; Xu, Z. Quantitative contributions of climate change, new cultivars adoption, and management practices to yield and global warming potential in rice-winter wheat rotation ecosystems. Agr. Syst. 2021, 190, 103087. [Google Scholar] [CrossRef]
  32. Asseng, S.; Cammarano, D.; Basso, B.; Chung, U.; Alderman, P.D.; Sonder, K.; Reynolds, M.; Lobell, D.B. Hot spots of wheat yield decline with rising temperatures. Glob. Change Biol. 2017, 23, 2464–2472. [Google Scholar] [CrossRef]
  33. Lobell, D.B.; Schlenker, W.; Costa-Roberts, J. Climate trends and global crop production since 1980. Science 2011, 333, 616–620. [Google Scholar] [CrossRef]
  34. Bai, H.; Tao, F.; Xiao, D.; Liu, F.; Zhang, H. Attribution of yield change for rice-wheat rotation system in China to climate change, cultivars and agronomic management in the past three decades. Clim. Change 2016, 135, 539–553. [Google Scholar] [CrossRef]
  35. Hawkesford, M.; Araus, J.; Park, R.; Calderini, D.; Miralles, D.; Shen, T.; Zhang, J.; Parry, M. Prospects of doubling global wheat yields. Food Energy Secur. 2013, 2, 34–48. [Google Scholar] [CrossRef]
  36. Hao, C.; Wang, L.; Zhang, X.; You, G.; Dong, Y.; Jia, J.; Liu, X.; Shang, X.; Liu, S.; Cao, Y. Evolution of genetic diversity of wheat cultivars bred in China. Sci. China 2005, 35, 27–34. [Google Scholar]
  37. China Statistical Yearbook; China Statistical Publishing House: Beijing, China, 2019.
  38. Gao, J.; Yang, X.; Zheng, B.; Liu, Z.; Zhao, J.; Sun, S.; Li, K.; Dong, C. Effects of climate change on the extension of the potential double cropping region and crop water requirements in Northern China. Agr. For. Meteorol. 2019, 268, 146–155. [Google Scholar] [CrossRef]
  39. Zoerb, C.; Ludewig, U.; Hawkesford, M.J. Perspective on Wheat Yield and Quality with Reduced Nitrogen Supply. Trends Plant Sci. 2018, 23, 1029–1037. [Google Scholar] [CrossRef]
  40. Fischer, R.A.T.; Edmeades, G.O. Breeding and Cereal Yield Progress. Crop. Sci. 2010, 50, 85–98. [Google Scholar] [CrossRef]
  41. Senapati, N.; Brown, H.E.; Semenov, M.A. Raising genetic yield potential in high productive countries: Designing wheat ideotypes under climate change. Agr. For. Meteorol. 2019, 271, 33–45. [Google Scholar] [CrossRef]
  42. Li, K.; Yang, X.; Liu, Z.; Zhang, T.; Lu, S.; Liu, Y. Low yield gap of winter wheat in the North China Plain. Eur. J. Agron. 2014, 59, 1–12. [Google Scholar] [CrossRef]
  43. Zhou, Y.; He, Z.H.; Sui, X.X.; Xia, X.C.; Zhang, X.K.; Zhang, G.S. Genetic Improvement of Grain Yield and Associated Traits in the Northern China Winter Wheat Region from 1960 to 2000. Crop. Sci. 2007, 47, 245–253. [Google Scholar] [CrossRef]
  44. Wang, Y.; Hao, C.; Zheng, J.; Ge, H.; Zhou, Y.; Ma, Z.; Zhang, X. A haplotype block associated with thousand-kernel weight on chromosome 5DS in common wheat (Triticum aestivum L.). J. Integr. Plant Biol. 2015, 57, 662–672. [Google Scholar] [CrossRef]
  45. Shewry, P.R.; Hassall, K.L.; Grausgruber, H.; Andersson, A.A.M.; Lampi, A.M.; Piironen, V.; Rakszegi, M.; Ward, J.L.; Lovegrove, A. Do modern types of wheat have lower quality for human health? Nutr. Bull. 2020, 45, 362–373. [Google Scholar] [CrossRef] [PubMed]
  46. Laidig, F.; Piepho, H.; Rentel, D.; Drobek, T.; Meyer, U.; Huesken, A. Breeding progress, environmental variation and correlation of winter wheat yield and quality traits in German official variety trials and on-farm during 1983–2014. Theor. Appl. Genet. 2017, 130, 223–245. [Google Scholar] [CrossRef] [PubMed] [Green Version]
  47. Michel, S.; Loeschenberger, F.; Ametz, C.; Pachler, B.; Sparry, E.; Buerstmayr, H. Combining grain yield, protein content and protein quality by multi-trait genomic selection in bread wheat. Theor. Appl. Genet. 2019, 132, 2767–2780. [Google Scholar] [CrossRef] [PubMed]
  48. He, Z.H. Wheat quality requirements in China. In Developments in Plant Breeding; Springer: Dordrecht, The Netherlands, 2001; Volume 9, pp. 279–284. [Google Scholar]
  49. Wang, H.; Ma, H.; Cao, L.; Sun, D.; Li, X.; Min, D.; Feng, Y. Current situation and problems of winter wheat variety quality in China. J. Northwest AF Univ. (Nat. Sci. Ed.) 2003, 31, 34–40. [Google Scholar]
  50. Zhang, Y.; Nagamine, T.; He, Z.H.; Ge, X.X.; Yoshida, H.; Pena, R.J. Variation in quality traits in common wheat as related to Chinese fresh white noodle quality. Euphytica 2005, 141, 113–120. [Google Scholar] [CrossRef]
  51. Zan, X.; Zhou, G.; Wu, L.; Wang, S.; Hu, X.; Lu, W.; Wang, B. Present Status of Wheat Quality in China. J. Triticeae Crops 2006, 26, 46–49. [Google Scholar]
  52. Mosleth, E.F.; Wan, Y.; Lysenko, A.; Chope, G.A.; Penson, S.P.; Shewry, P.R.; Hawkesford, M.J. A novel approach to identify genes that determine grain protein deviation in cereals. Plant Biotechnol. J. 2015, 13, 625–635. [Google Scholar] [CrossRef]
  53. Ben Mariem, S.; Gamez, A.L.; Larraya, L.; Fuertes-Mendizabal, T.; Canameras, N.; Araus, J.L.; Mcgrath, S.P.; Hawkesford, M.J.; Gonzalez Murua, C.; Gaudeul, M.; et al. Assessing the evolution of wheat grain traits during the last 166 years using archived samples. Sci. Rep. UK 2020, 10, 21828. [Google Scholar] [CrossRef]
  54. Koekemoer, F.P.; Labuschagne, M.T.; Van Deventer, C.S. A selection strategy for combining high grain yield and high protein content in South African wheat cultivars. Cereal Res. Commun. 1999, 27, 107–114. [Google Scholar] [CrossRef]
  55. Rapp, M.; Lein, V.; Lacoudre, F.; Lafferty, J.; Mueller, E.; Vida, G.; Bozhanova, V.; Ibraliu, A.; Thorwarth, P.; Piepho, H.P.; et al. Simultaneous improvement of grain yield and protein content in durum wheat by different phenotypic indices and genomic selection. Theor. Appl. Genet. 2018, 131, 1315–1329. [Google Scholar] [CrossRef]
  56. Michel, S.; Kummer, C.; Gallee, M.; Hellinger, J.; Ametz, C.; Akgöl, B.; Epure, D.; Löschenberger, F.; Buerstmayr, H. Improving the baking quality of bread wheat by genomic selection in early generations. Theor. Appl. Genet. 2018, 131, 477–493. [Google Scholar] [CrossRef] [PubMed]
  57. Wang, Y.; Zhen, S.; Luo, N.; Han, C.; Lu, X.; Li, X.; Xia, X.; He, Z.; Yan, Y. Low molecular weight glutenin subunit gene Glu-B3h confers superior dough strength and breadmaking quality in wheat (Triticum aestivum L.). Sci. Rep. UK 2016, 6, 27182. [Google Scholar] [CrossRef] [PubMed]
  58. Wang, J.; Wang, C.; Zhen, S.; Li, X.; Yan, Y. Low-Molecular-Weight gluten in subunits from the 1U genome of Aegilops umbellulata confer superior dough rheological properties and improve breadmaking quality of bread wheat. J. Sci. Food Agr. 2018, 98, 2156–2167. [Google Scholar] [CrossRef] [PubMed]
  59. Liu, J.; Feng, B.; Xu, Z.; Fan, X.; Jiang, F.; Jin, X.; Cao, J.; Wang, F.; Liu, Q.; Yang, L.; et al. A genome-wide association study of wheat yield and quality-related traits in southwest China. Mol. Breed. 2017, 38, 1–11. [Google Scholar] [CrossRef]
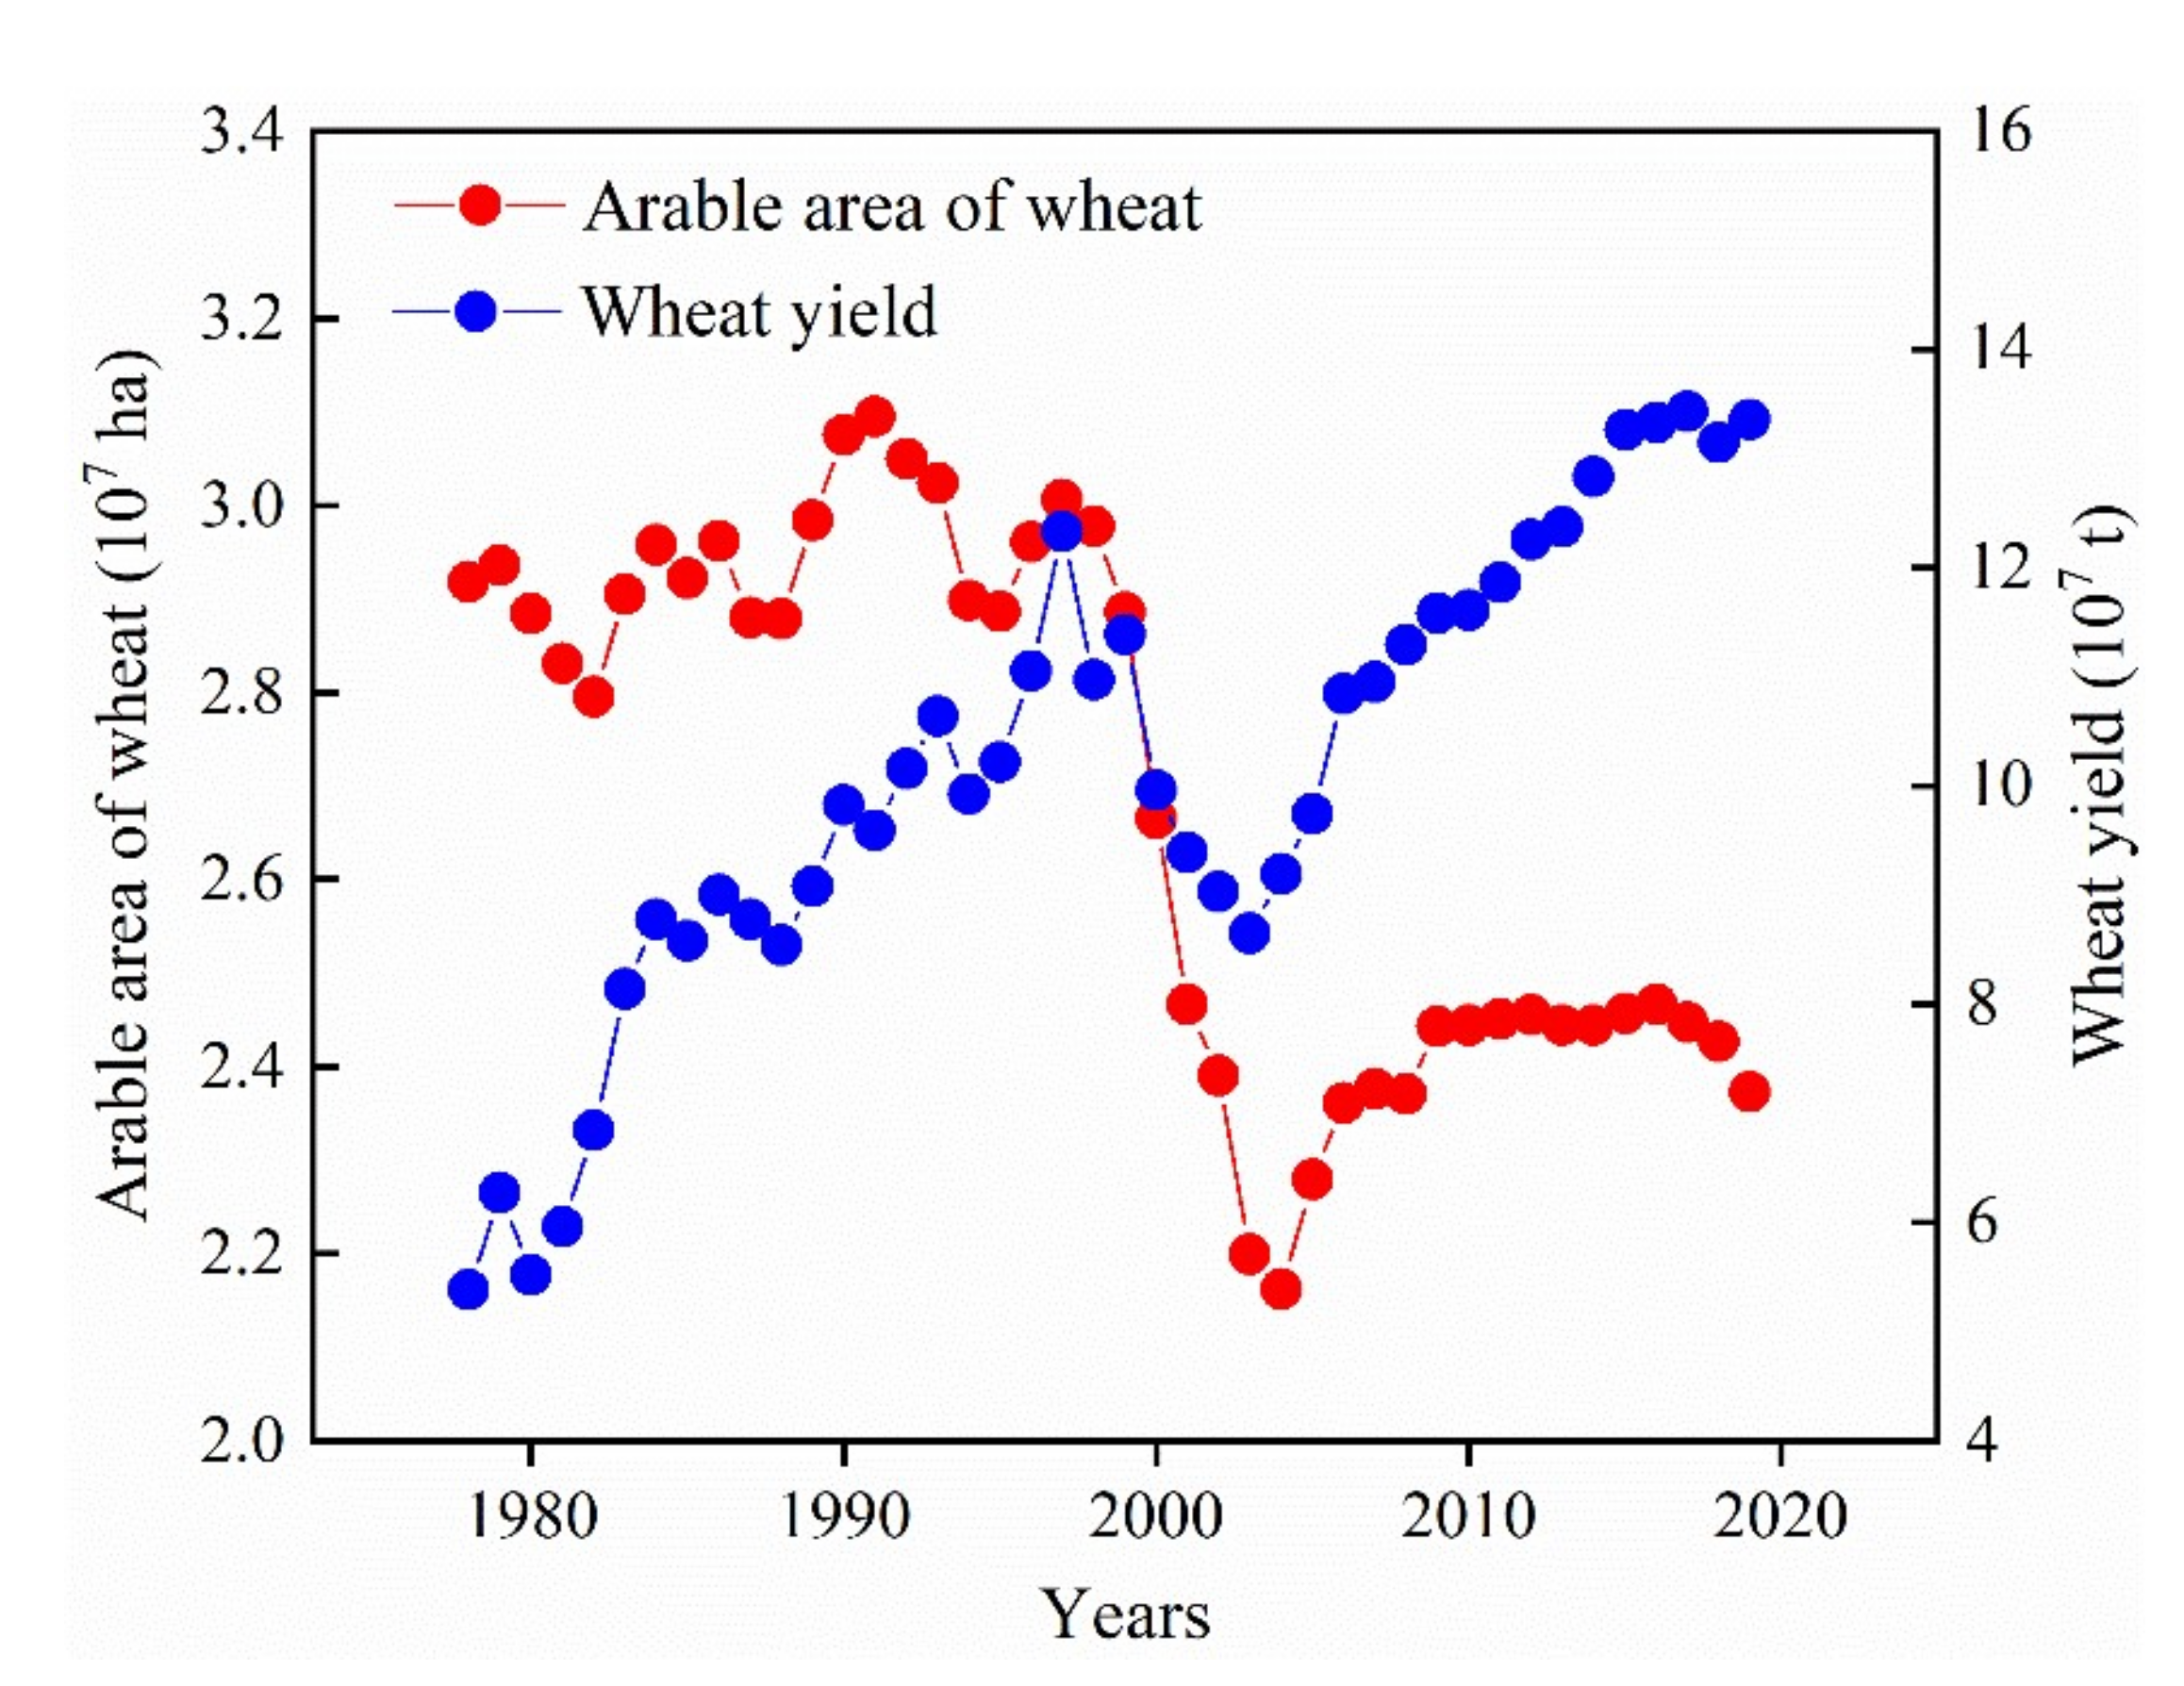
Figure 1. The arable area of wheat and wheat yield from 1978 to 2019 in China. Data were provided by National Bureau of Statistics of China (http://www.stats.gov.cn/english/, accessed on 30 June 2022).
Agronomy 12 02109 g001
Figure 2. The average value, 95% quantile value and 5% quantile value of grain yield and yield components of wheat varieties released in 2001–2020 for three wheat-growing regions.
Agronomy 12 02109 g002
Figure 3. The average value, 95% quantile value, and 5% quantile value of protein concentration, protein yield of wheat varieties released in 2001–2020 for three wheat-growing regions.
Agronomy 12 02109 g003
Figure 4. The average value, 95% quantile value and 5% quantile value of wet gluten, sedimentation value, water absorption, and stability time of wheat varieties released in 2001–2020 for three wheat-growing regions.
Agronomy 12 02109 g004
Table 1. Statistics of wheat yield and quality parameters for the three wheat-growing regions.
RegionStatisticsYield
t ha−1
TKW
g
SN
m−2
KN
Spike−1
PC
%
PY
t ha−1
WG
%
SV
mL
WA
%
ST
min
North winter wheatNumber12601259111412431259125812537099321145
Min2.828.239423.48.40.418.19.251.00.6
Max9.254.777453.518.61.441.682.077.141.0
Average7.242.459934.414.31.030.840.759.45.0
SD1.33.6613.51.10.23.316.03.54.1
CV (%)18910107181139682
South winter wheatNumber380379295358380379379222115355
Min3.234.924927.08.50.415.98.040.00.5
Max7.960.071355.217.31.339.083.568.226.7
Average5.843.442339.913.40.827.335.557.04.0
SD0.83.7935.21.30.13.813.24.63.0
CV (%)149221310161437875
Spring wheatNumber261263105209266261264185104216
Min1.330.224522.09.50.217.513.552.60.8
Max8.856.671358.019.91.646.571.369.138.0
Average5.341.055436.615.10.832.241.961.66.7
SD1.65.21046.51.70.24.313.03.45.9
CV (%)3113191811291331687
TKW: thousand kernel weight, SN: spike number, KN: kernel number, PC: protein concentration, PY: protein yield, WG: wet gluten, SV: sedimentation value, WA: water absorption, ST: stability time.
Table 2. The proportion of wheat varieties in different protein quality groups for three wheat-growing regions from 2001 to 2020.
RegionYearSG (%)MSG (%)MG (%)WG (%)
North winter wheat2001–200516.511.370.41.7
2006–20103.611.184.60.8
2011–20153.713.182.80.4
2016–20203.913.981.70.6
2001–20204.912.981.40.7
South winter wheat2001–20052.49.578.69.5
2006–20102.23.287.17.5
2011–20154.28.375.012.5
2016–20205.35.374.714.7
2001–20203.96.078.211.8
Spring wheat2001–200525.517.652.93.9
2006–201012.918.865.92.4
2011–201511.521.265.41.9
2016–202011.523.164.11.3
2001–202014.720.362.82.3
SG: strong gluten; MSG: medium-strong gluten; MG: medium gluten; WG: weak gluten.
Table 3. Genetic yield potential and genetic yield gap of wheat.
PeriodVariableNorth Winter WheatSouth Winter WheatSpring Wheat
2001–2010Genetic yield potential (t ha−1)8.236.968.20
Actual yield (t ha−1)5.334.083.96
Genetic yield gap (t ha−1)2.912.884.25
Genetic yield gap percentage (%)354152
2001–2020Genetic yield potential (t ha−1)8.657.148.10
Actual yield (t ha−1)6.175.084.38
Genetic yield gap (t ha−1)2.472.063.72
Genetic yield gap percentage (%)292946
Table 4. Genetic yield component potential and average yield component.
Yield ComponentsVariableNorth Winter WheatSouth Winter WheatSpring Wheat
TKW (g)GYCP43.6943.6348.02
AYC42.3943.3641.04
IR3%1%17%
Spike number (m−2)GYCP631482620
AYC599423554
IR5%14%12%
Kernel number (spike−1)GYCP35.5240.5440.73
AYC34.4439.9136.59
IR3%2%11%
Publisher’s Note: MDPI stays neutral with regard to jurisdictional claims in published maps and institutional affiliations.