
At Which Spatial Scale Does Crop Diversity Enhance Natural Enemy Populations and Pest Control? An Experiment in a Mosaic Cropping System

 ,
, 
 ,
,  and
and
Abstract
:1. Introduction
2. Material and Methods
2.1. Experimental Designs
2.2. Insect Sampling
2.3. Statistical Analyses
2.3.1. Effect of Crop Diversity on Natural Enemy and Pest Abundances and Diversity
2.3.2. Effect of Crop Diversity on Natural Enemy Spillover
2.3.3. Influence of the Spatial Scale of Crop Diversity
3. Results
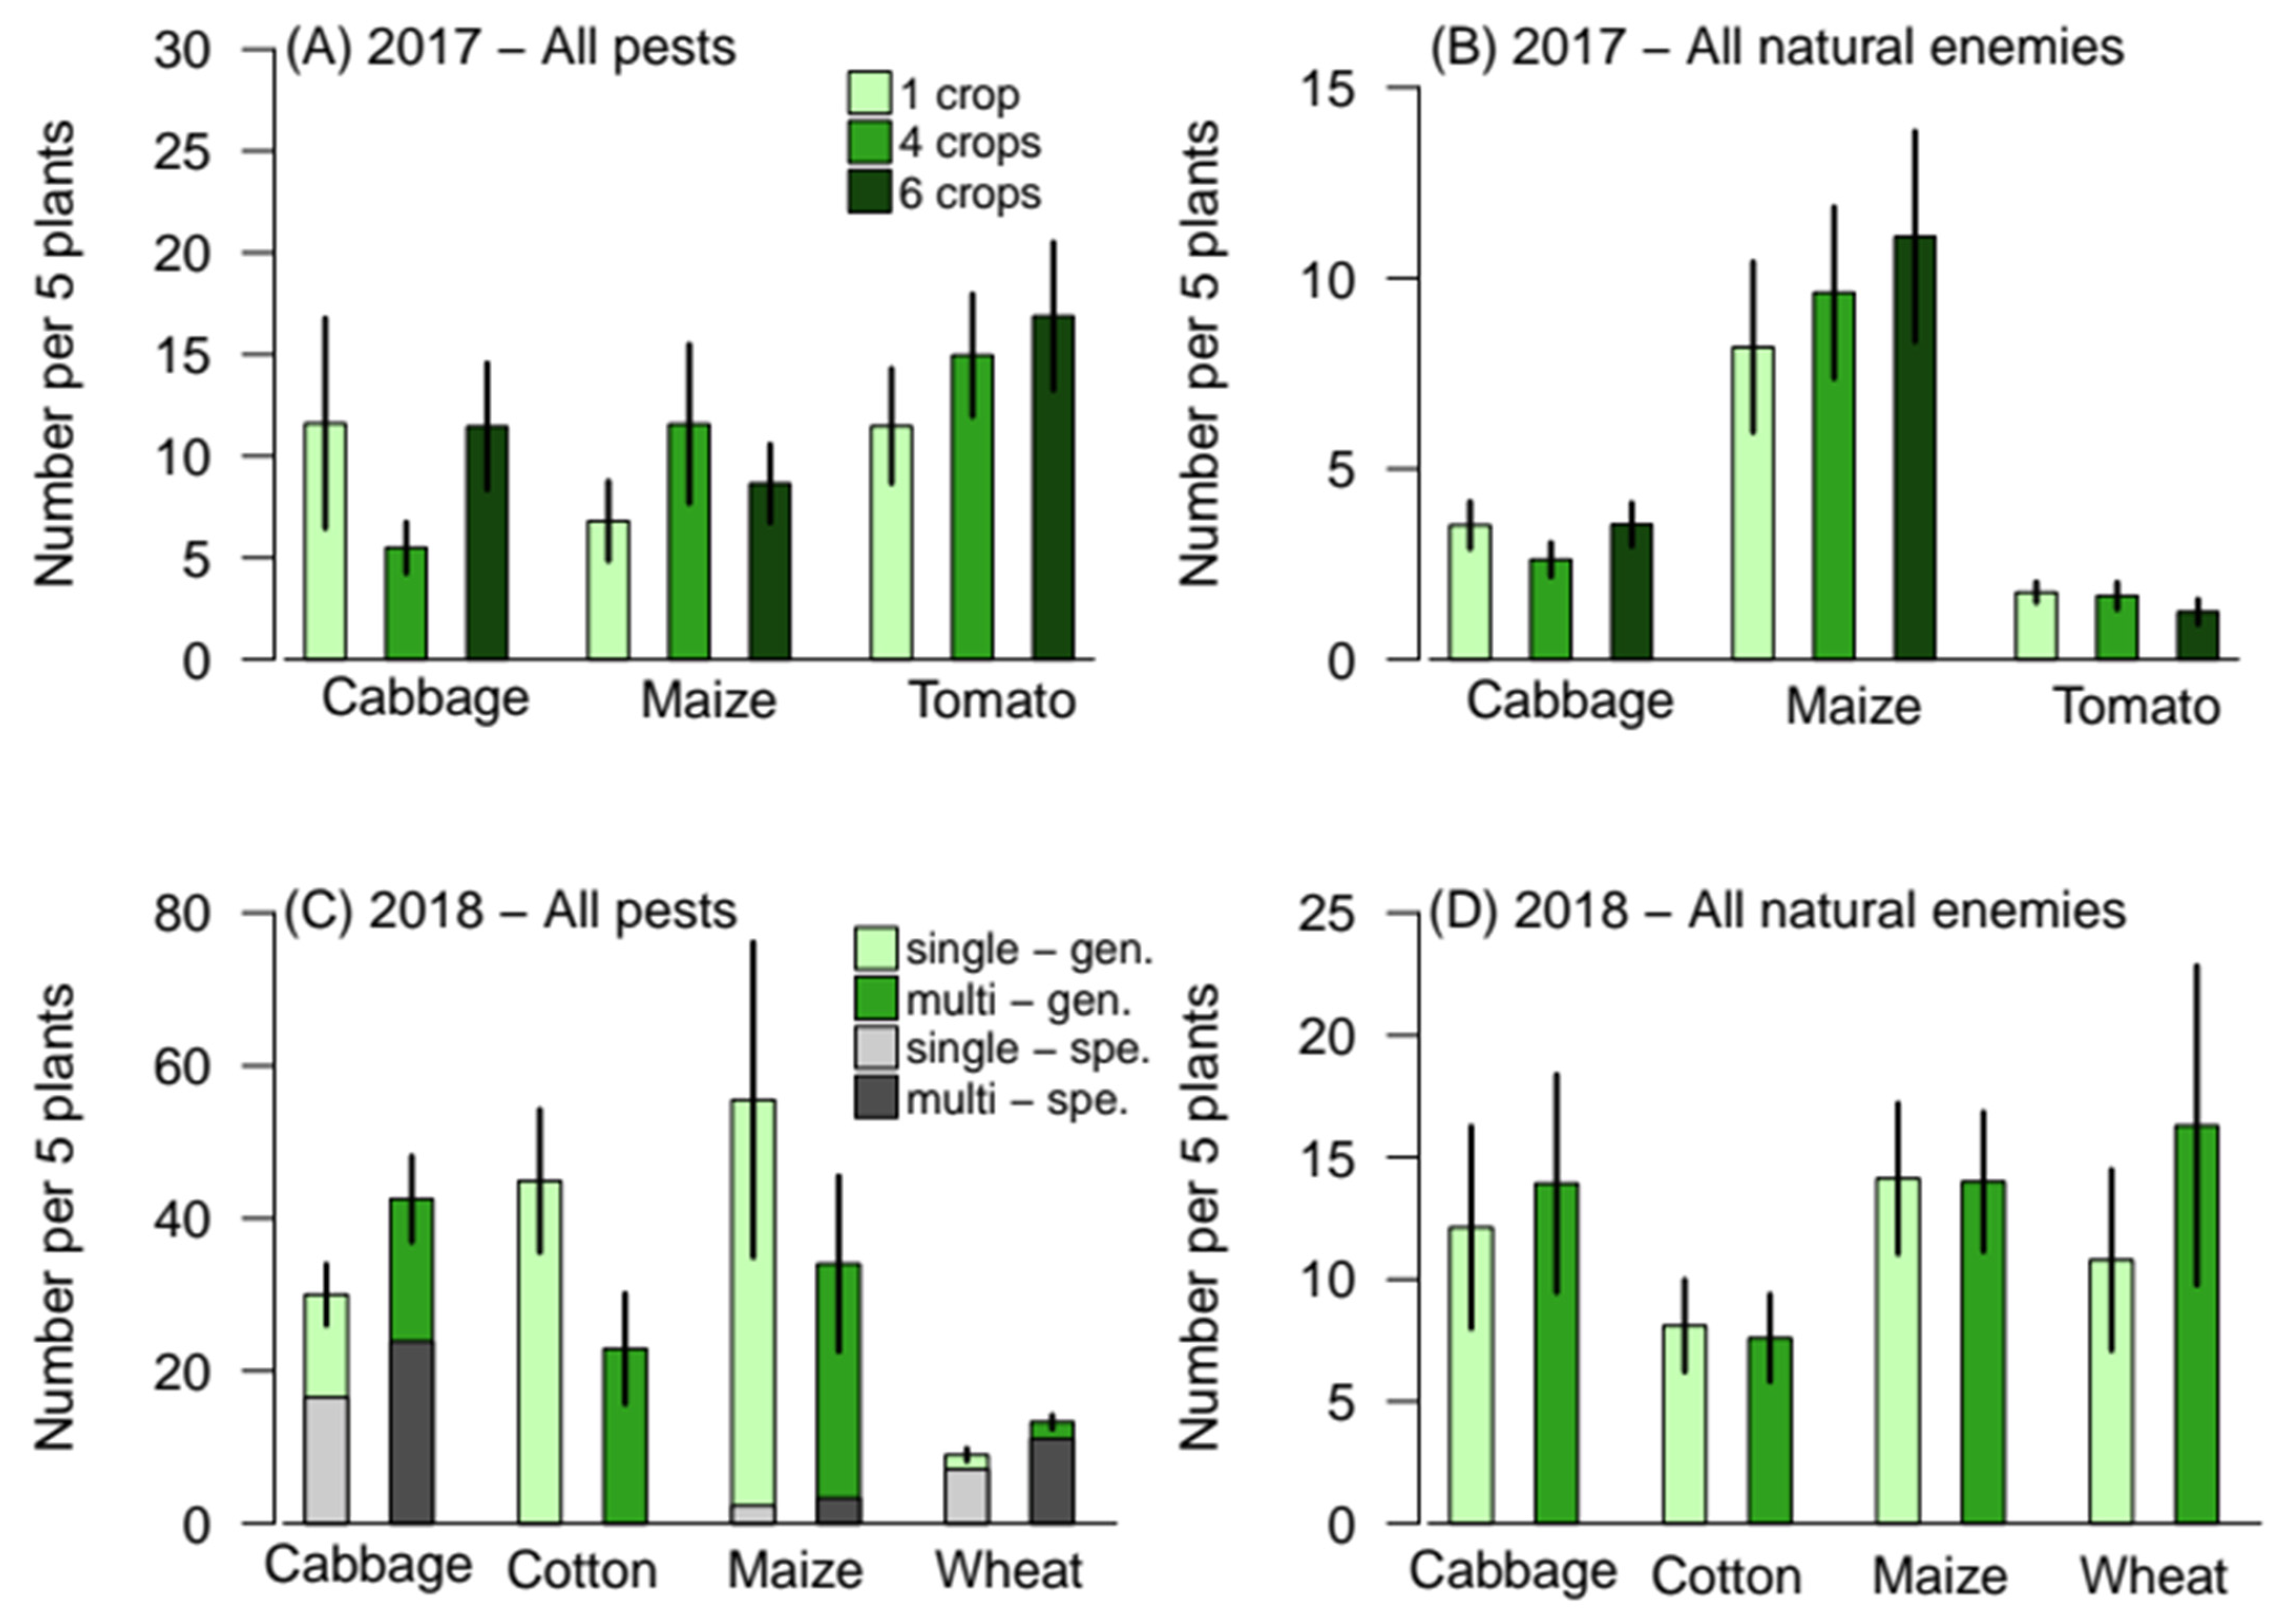
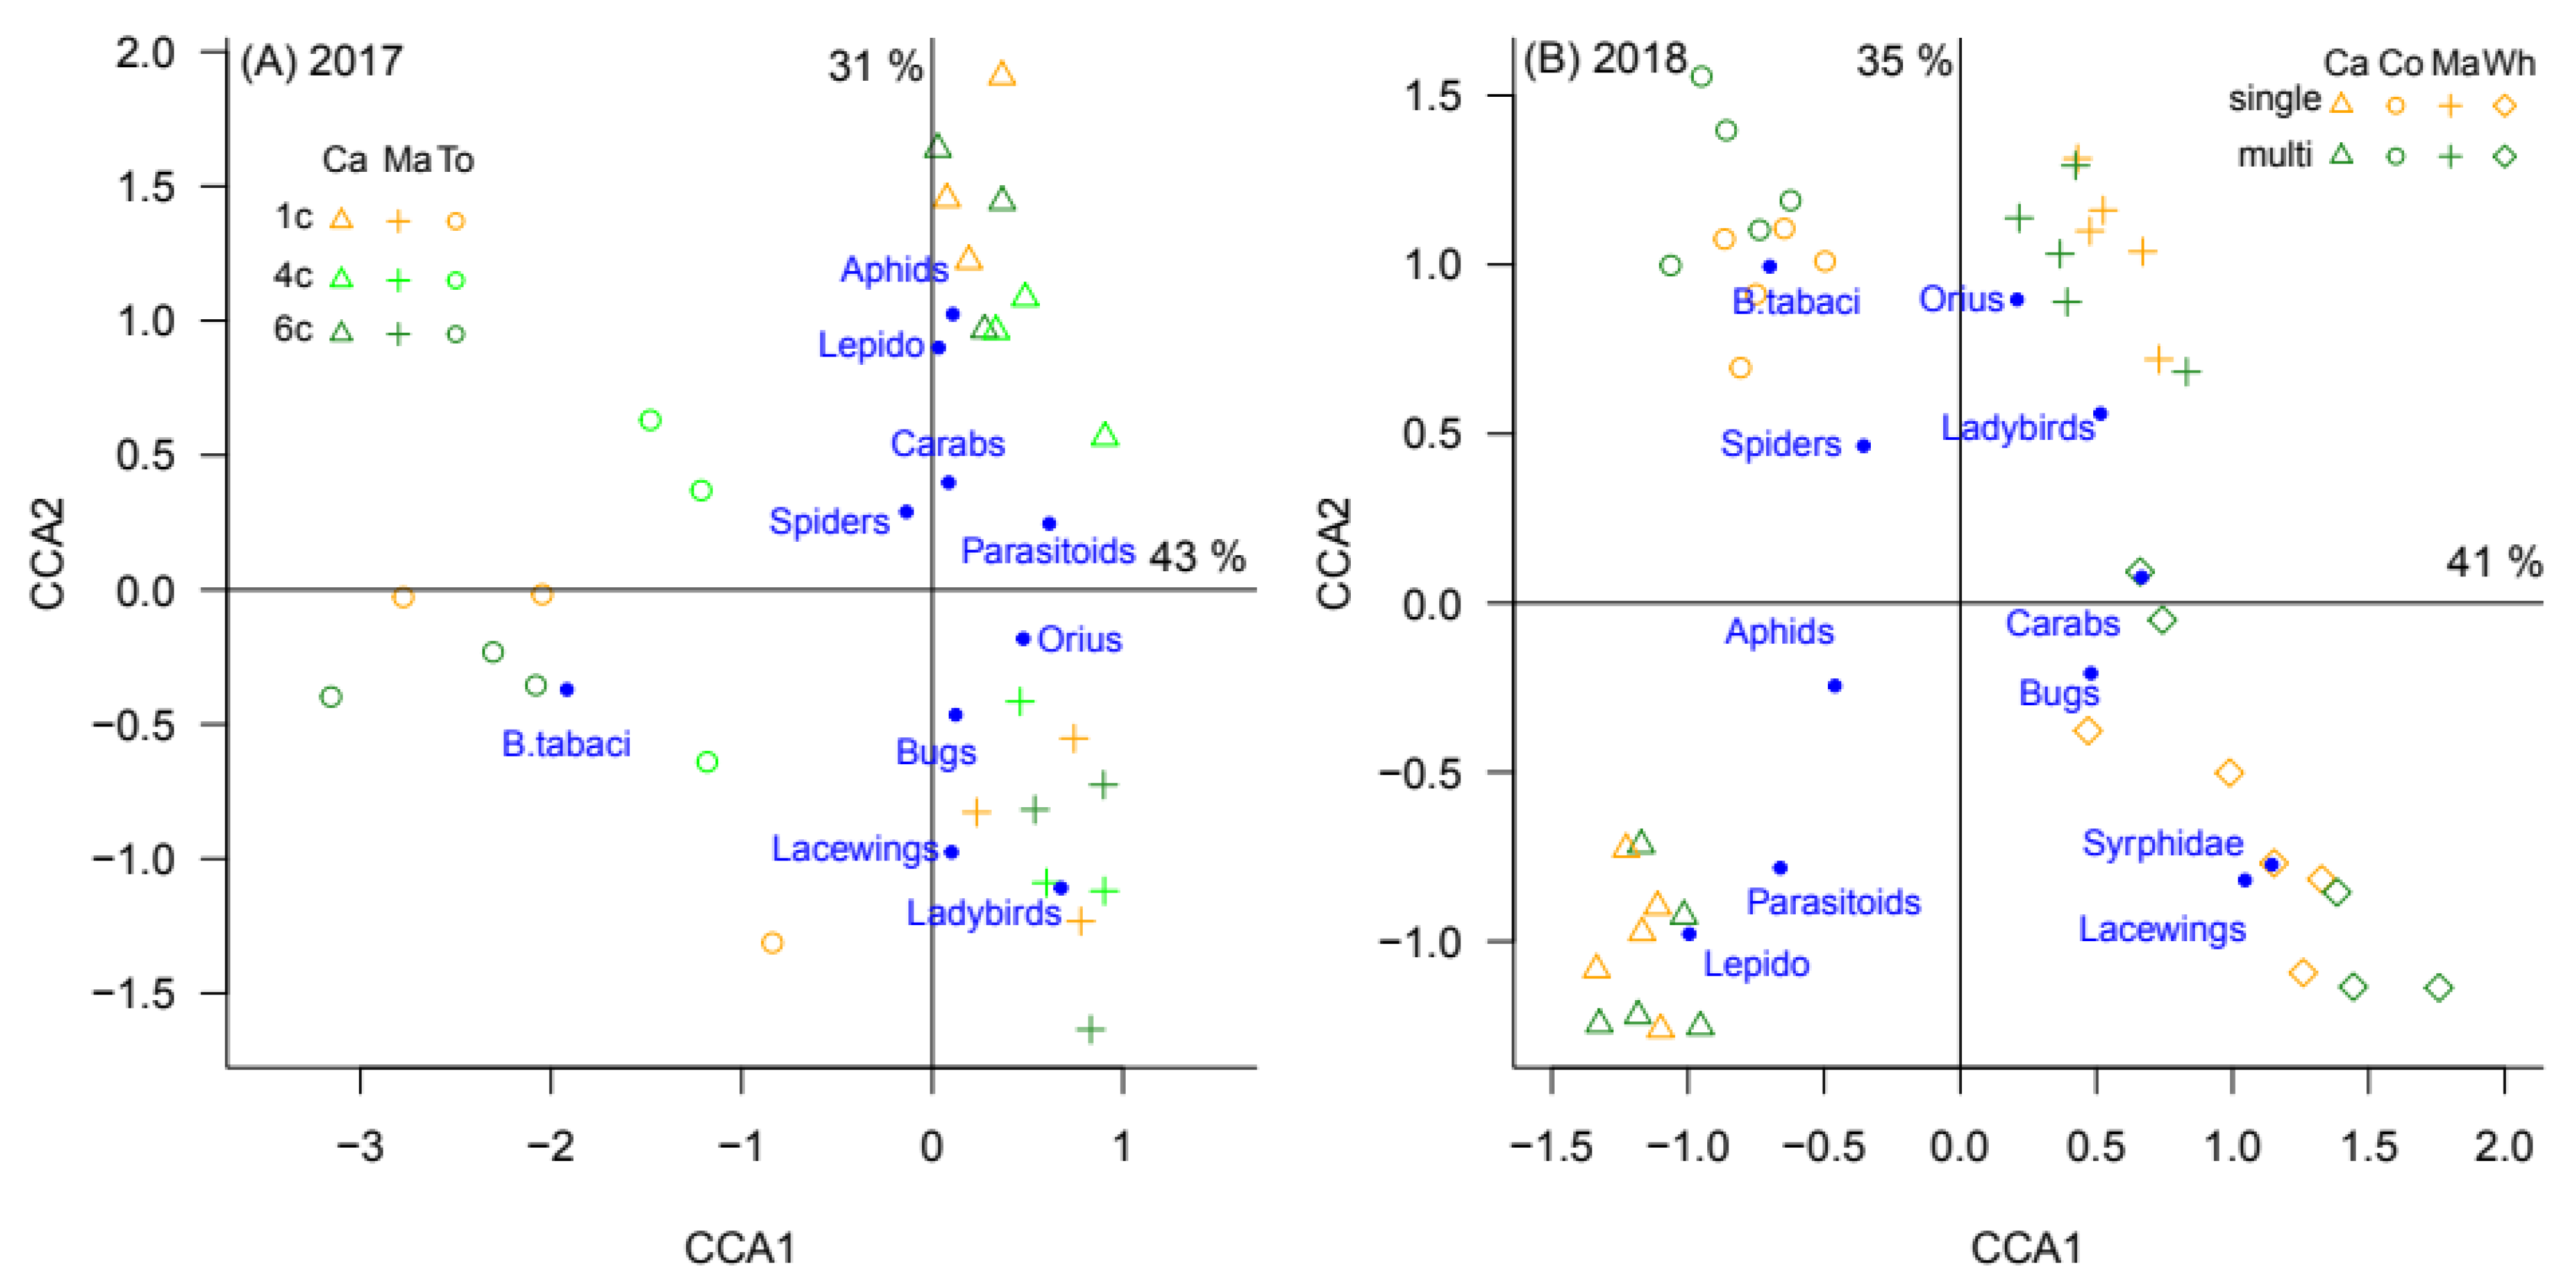
3.1. Effect of Crop Diversity on Pest and Natural Enemy Abundances and Diversity
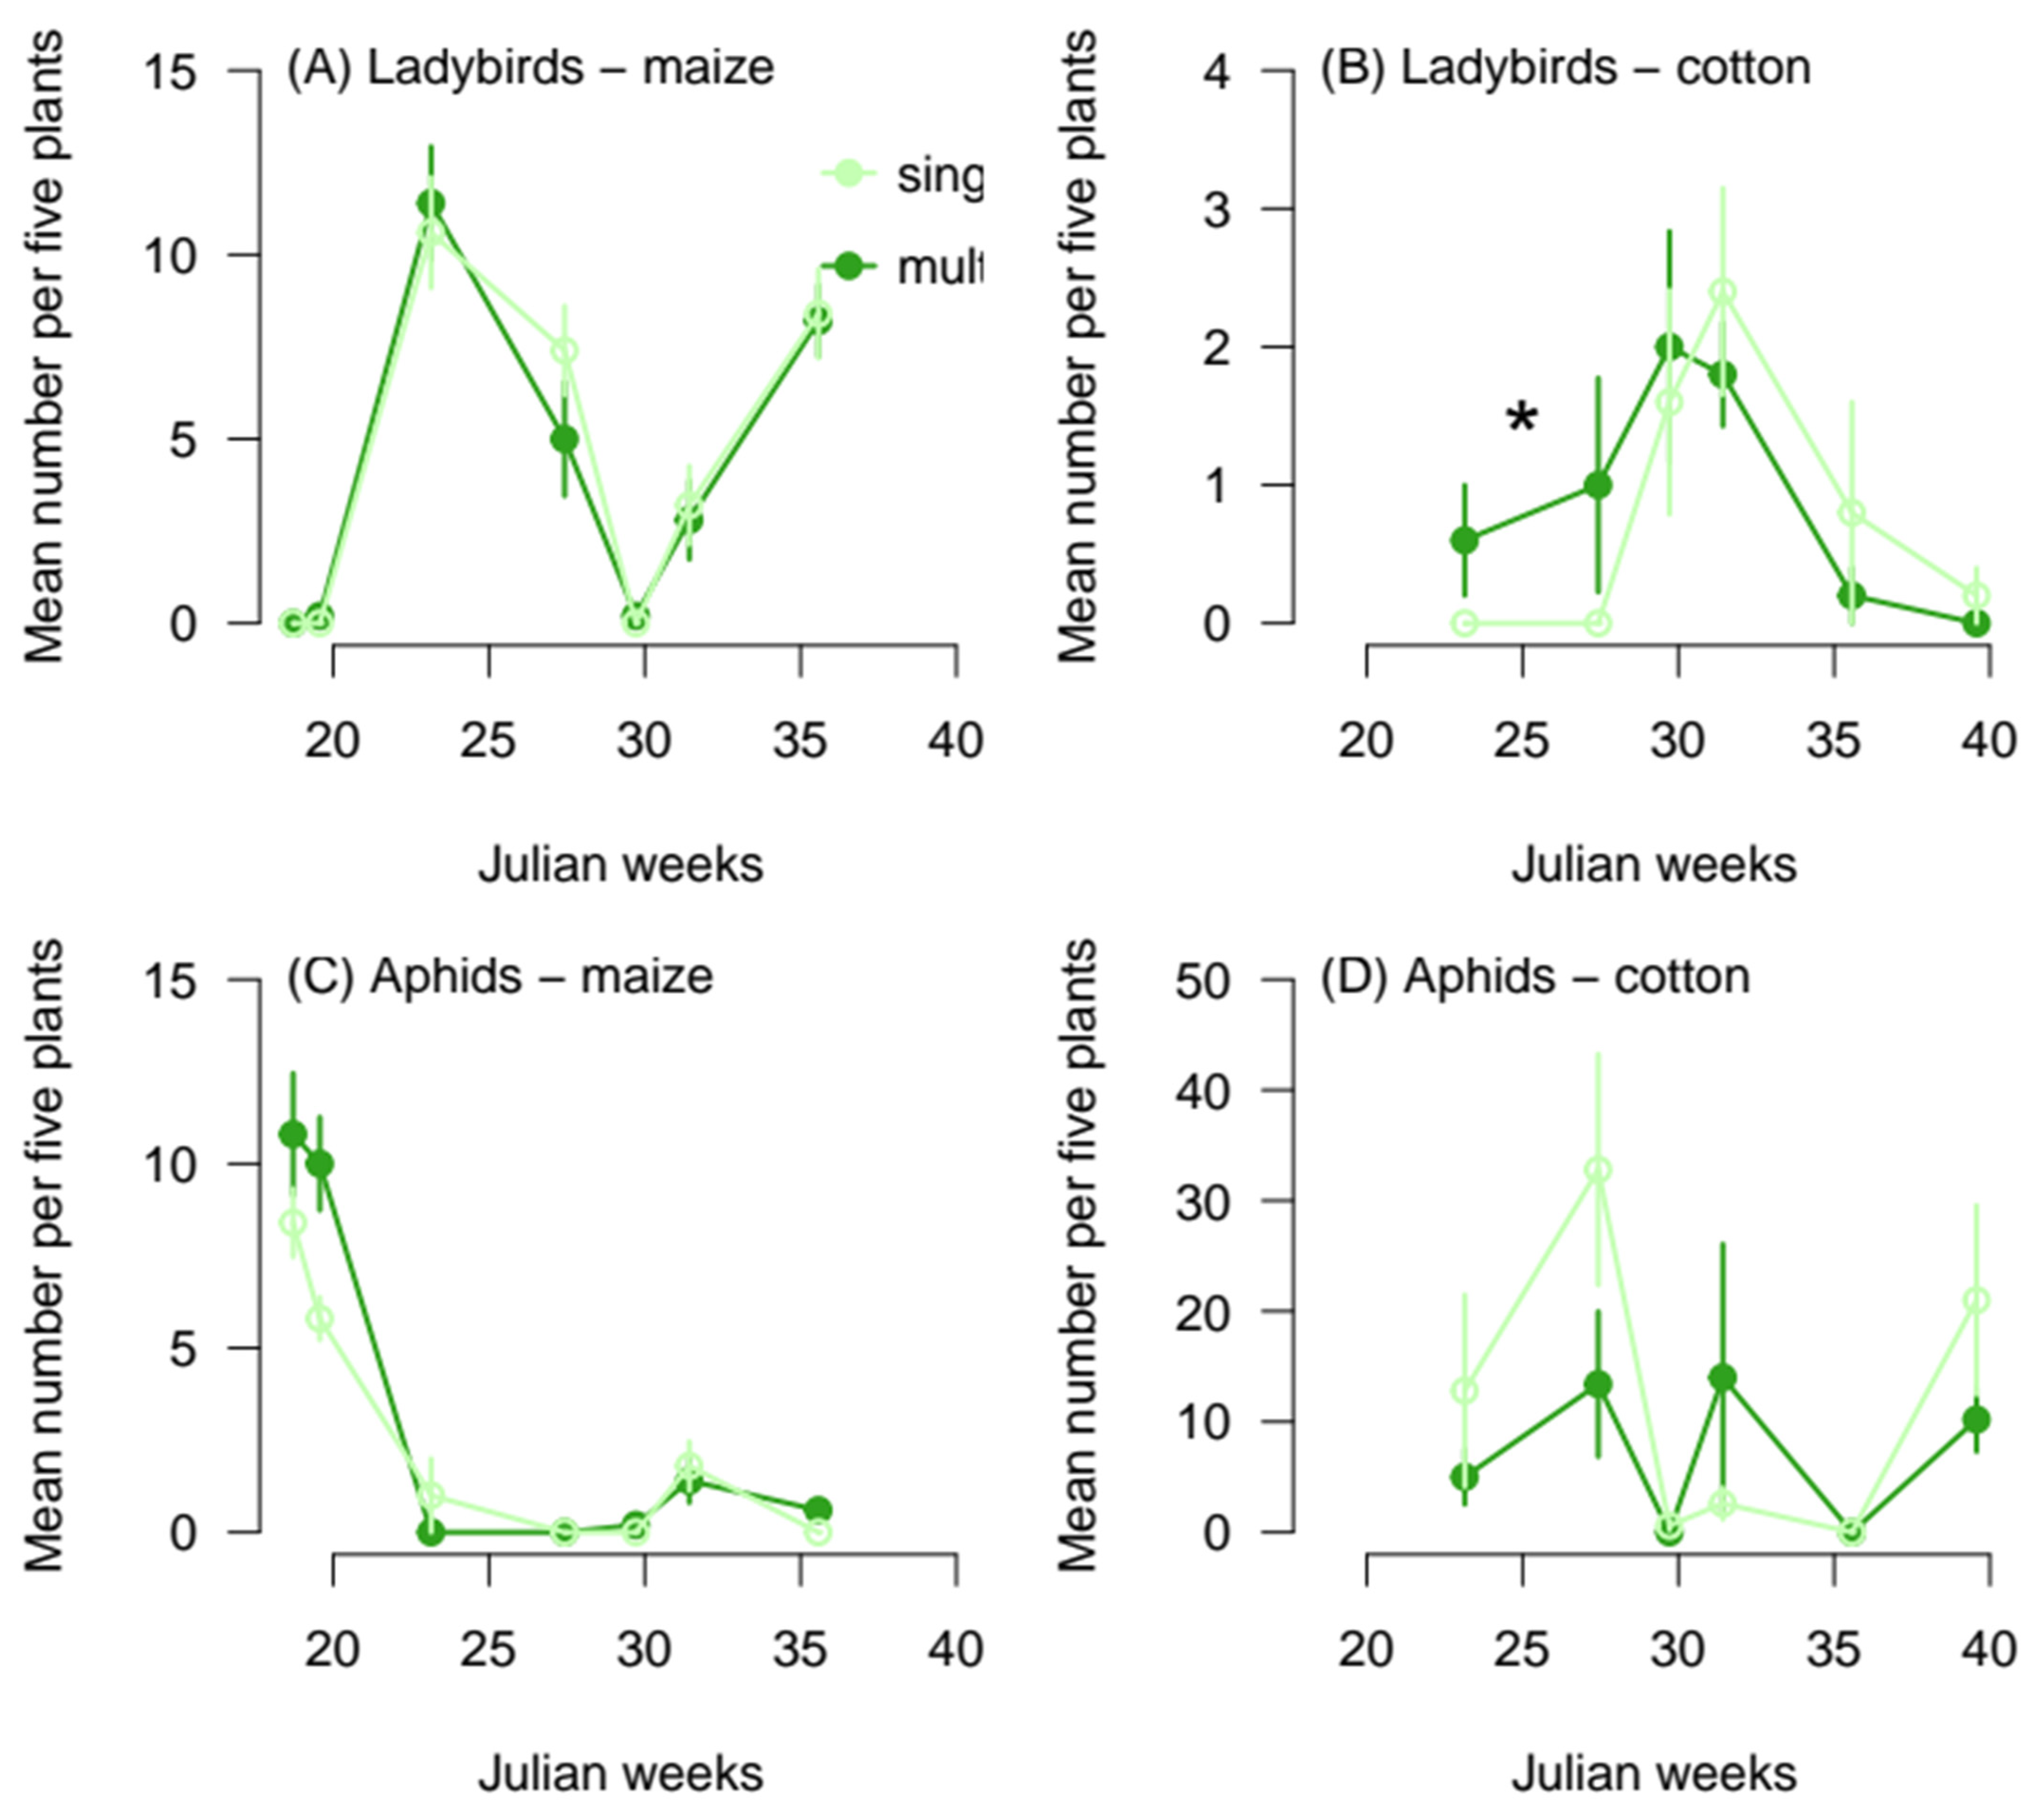
3.2. Effect of Crop Diversity on Natural Enemy Spillover
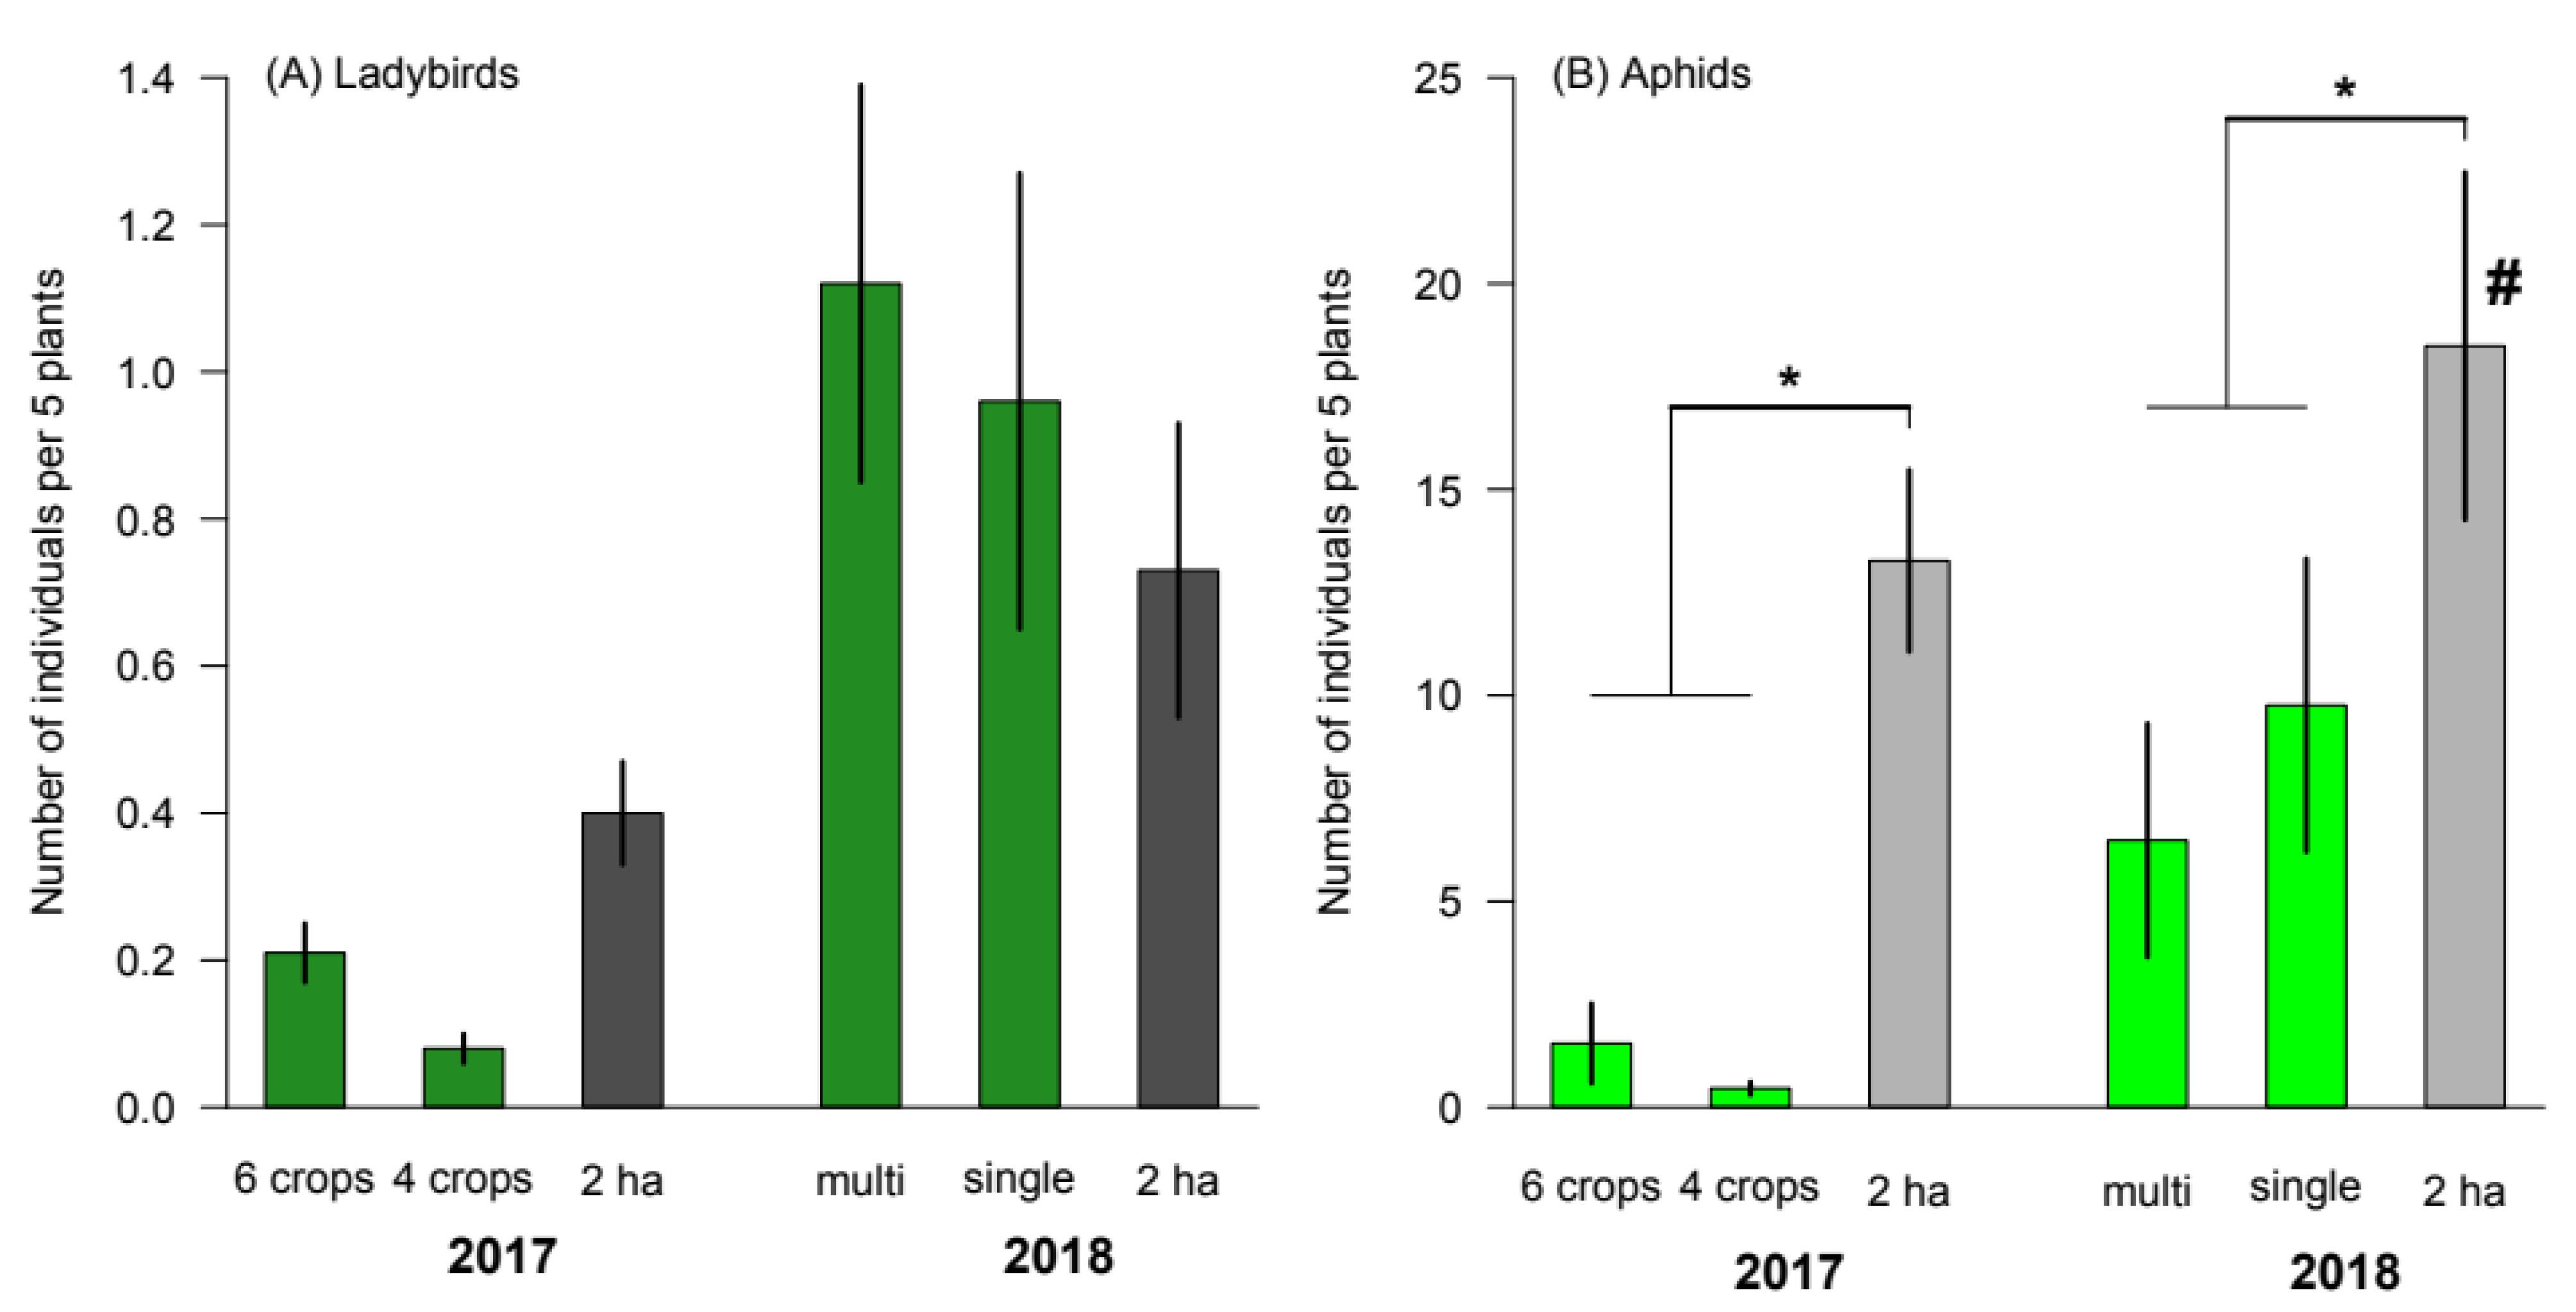
3.3. Influence of the Spatial Scale on Crop Diversity Effects

| χ2 | d.f. | p | |
|---|---|---|---|
| Ladybirds to aphids1 | |||
| Diversity:Crop:Pest | 4.95 | 2 | 0.026 * |
| Aphid parasitoids to aphids2 | |||
| Diversity:Crop:Pest | 1.37 | 2 | 0.51 |
| Crop:Pest | 2.67 | 2 | 0.26 |
| Diversity:Crop | 5.41 | 2 | 0.067 |
| Diversity:Pest | 1.68 | 1 | 0.20 |
| Diversity | 0.195 | 1 | 0.66 |
| Pest | 4.43 | 1 | 0.031 * |
4. Discussion
5. Conclusion
Supplementary Materials
Author Contributions
Funding
Institutional Review Board Statement
Informed Consent Statement
Data Availability Statement
Acknowledgments
Conflicts of Interest
References
- Desneux, N.; Decourtye, A.; Delpuech, J.M. The sublethal effects of pesticides on beneficial athropods. Annu. Rev. Entomol. 2007, 52, 81–106. [Google Scholar] [CrossRef] [PubMed]
- Lu, Y.; Wu, K.; Jiang, Y.; Guo, Y.; Desneux, N. Widespread adoption of Bt cotton and insecticide decrease promotes biocontrol services. Nature 2012, 487, 362–365. [Google Scholar] [CrossRef] [PubMed]
- Jonsson, M.; Bommarco, R.; Ekbom, B.; Smith, H.G.; Bengtsson, J.; Caballero-Lopez, B.; Winqvist, C.; Olsson, O. Ecological production functions for biological control services in agricultural landscapes. Methods Ecol. Evol. 2014, 5, 243–252. [Google Scholar] [CrossRef] [Green Version]
- Kehoe, L.; Romero-Muñoz, A.; Polaina, E.; Estes, L.; Kreft, H.; Kuemmerle, T. Biodiversity at risk under future cropland expansion and intensification. Nat. Ecol. Evol. 2017, 1, 1129. [Google Scholar] [CrossRef]
- Bommarco, R.; Kleijn, D.; Potts, S.G. Ecological intensification: Harnessing ecosystem services for food security. Trends Ecol. Evol. 2013, 28, 230–238. [Google Scholar] [CrossRef]
- Tilman, D.; Balzer, C.; Hill, J.; Befort, B.L. Global food demand and the sustainable intensification of agriculture. Proc. Natl. Acad. Sci. USA 2011, 108, 20260–20264. [Google Scholar] [CrossRef] [Green Version]
- Muller, A.; Schader, C.; Scialabba, N.E.H.; Brüggemann, J.; Isensee, A.; Erb, K.H.; Smith, P.; Klocke, P.; Leiber, F.; Stolze, M.; et al. Strategies for feeding the world more sustainably with organic agriculture. Nat. Commun. 2017, 8, 1290. [Google Scholar] [CrossRef] [Green Version]
- Gaba, S.; Alignier, A.; Aviron, S.; Barot, S.; Blouin, M.; Hedde, M.; Jabot, F.; Vergnes, A.; Bonis, A.; Bonthoux, S.; et al. Ecology for sustainable and multifunctional agriculture. In Sustainable Agriculture Reviews; Springer: Cham, Switzerland, 2018; Volume 28, pp. 1–46. [Google Scholar]
- Kogan, M. Integrated pest management: Historical perspectives and contemporary developments. Annu. Rev. Entomol. 1998, 43, 243–270. [Google Scholar] [CrossRef]
- Desneux, N.; Han, P.; Mansour, R.; Arnó, J.; Brévault, T.; Campos, M.R.; Chailleux, A.; Guedes, R.N.C.; Karimi, J.; Konan, K.A.J.; et al. Integrated pest management of Tuta absoluta: Practical implementations across different world regions. J. Pest Sci. 2022, 95, 17–39. [Google Scholar] [CrossRef]
- Huang, N.X.; Jaworski, C.C.; Desneux, N.; Zhang, F.; Yang, P.Y.; Wang, S. Long-term and large-scale releases of Trichogramma promote pesticide decrease in maize in northeastern China. Entomol. Gen. 2020, 40, 331–335. [Google Scholar] [CrossRef]
- Gurr, G.M.; Wratten, S.D.; Landis, D.A.; You, M. Habitat management to suppress pest populations: Progress and prospects. Annu. Rev. Entomol. 2017, 62, 91–109. [Google Scholar] [CrossRef] [PubMed]
- (Perovic, D.J.; Gámez-Virués, S.; Landis, D.A.; Wäckers, F.; Gurr, G.M.; Wratten, S.D.; You, M.-S.; Desneux, N. Managing biological control services through multi-trophic trait interactions: Review and guidelines for implementation at local and landscape scales. Biol. Rev. 2018, 93, 306–321. [Google Scholar] [CrossRef] [Green Version]
- Han, P.; Lavoir, A.V.; Rodriguez-Saona, C.; Desneux, N. Bottom-up forces in agroecosystems and their potential impact on arthropod pest management. Annu. Rev. Entomol. 2022, 67, 239–259. [Google Scholar] [CrossRef] [PubMed]
- Lundgren, J.G.; Wyckhuys, K.A.G.; Desneux, N. Population responses by Orius insidiosus to vegetational diversity. Biocontrol 2009, 54, 135–142. [Google Scholar] [CrossRef]
- Parolin, P.; Bresch, C.; Poncet, C.; Desneux, N. Functional characteristics of secondary plants for increased pest management. Int. J. Pest Manag. 2012, 58, 369–377. [Google Scholar] [CrossRef]
- Damien, M.; Llopis, S.; Desneux, N.; van Baaren, J.; Le Lann, C. How does floral nectar quality affect life history strategies in parasitic wasps? Entomol. Gen. 2020, 40, 147–156. [Google Scholar] [CrossRef]
- Thomine, E.; Rusch, A.; Supplisson, C.; Monticelli, L.S.; Amiens-Desneux, E.; Lavoir, A.-V.; Desneux, N. Highly diversified crop systems can promote the dispersal and foraging activity of the generalist predator Harmonia axyridis. Entomol. Gen. 2020, 40, 133–145. [Google Scholar] [CrossRef] [Green Version]
- Morris, M.A.; Croft, B.A.; Berry, R.E. Overwintering and effects of autumn habitat manipulation and carbofuran on Neoseiulus fallacis and Tetranychus urticae in peppermint. Exp. Appl. Acarol. 1996, 20, 249–257. [Google Scholar] [CrossRef]
- Rypstra, A.L.; Carter, P.E.; Balfour, R.A.; Marshall, S.D. Architectural features of agricultural habitats and their impact on the spider inhabitants. J. Arachnol. 1999, 27, 371–377. [Google Scholar]
- Bianchi, F.; Booij, C.; Tscharntke, T. Sustainable pest regulation in agricultural landscapes: A review on landscapes composition, biodiversity and natural pest control. Proc. R. Soc. B 2006, 273, 1715–1727. [Google Scholar] [CrossRef] [Green Version]
- Letourneau, D.K.; Armbrecht, I.; Salguero Rivera, B.; Lerma, J.M.; Carmona, E.J.; Daza, M.C.; Escobar, S.; Galindo, V.; Gutierrez, C.; Lopez, S.D.; et al. Does plant diversity benefit agroecosystems? A synthetic review. Ecol. Appl. 2011, 21, 9–21. [Google Scholar] [CrossRef] [PubMed]
- Veres, A.; Petit, S.; Conord, C.; Lavigne, C. Does landscape composition affect pest abundance and their control by natural enemies? A review. Agric. Ecosyst. Environ. 2013, 166, 110–117. [Google Scholar] [CrossRef]
- Rusch, A.; Chaplin-Kramer, R.; Gardiner, M.M.; Hawro, V.; Holland, J.; Landis, D.; Thies, C.; Tscharntke, T.; Weisser, W.W.; Winqvist, C.; et al. Agricultural landscape simplification reduces natural pest control: A quantitative synthesis. Agric. Ecosyst. Environ. 2016, 221, 198–204. [Google Scholar] [CrossRef] [Green Version]
- Karp, D.S.; Chaplin-Kramer, R.; Meehan, T.D.; Martin, E.A.; DeClerck, F.; Grab, H.; Gratton, C.; Hunt, L.; Larsen, A.E.; Martínez-Salinas, A.; et al. Crop pests and predators exhibit inconsistent responses to surrounding landscape composition. Proc. Natl. Acad. Sci. USA 2018, 115, E7863–E7870. [Google Scholar] [CrossRef] [Green Version]
- Tscharntke, T.; Karp, D.S.; Chaplin-Kramer, R.; Batáry, P.; DeClerck, F.; Gratton, C.; Hunt, L.; Ives, A.; Jonsson, M.; Larsen, A.; et al. When natural habitat fails to enhance biological pest control–Five hypotheses. Biol. Conserv. 2016, 204, 449–458. [Google Scholar] [CrossRef] [Green Version]
- Bosem Baillod, A.; Tscharntke, T.; Clough, Y.; Batáry, P. Landscape-scale interactions of spatial and temporal cropland heterogeneity drive biological control of cereal aphids. J. Appl. Ecol. 2017, 54, 1804–1813. [Google Scholar] [CrossRef] [Green Version]
- Hass, A.L.; Kormann, U.G.; Tscharntke, T.; Clough, Y.; Baillod, A.B.; Sirami, C.; Fahrig, L.; Martin, J.L.; Baudry, J.; Bertrand, C.; et al. Landscape configurational heterogeneity by small-scale agriculture, not crop diversity, maintains pollinators and plant reproduction in western Europe. Proc. R. Soc. B 2018, 285, 20172242. [Google Scholar] [CrossRef]
- Redlich, S.; Martin, E.A.; Steffan-Dewenter, I. Landscape-level crop diversity benefits biological pest control. J. Appl. Ecol. 2018, 55, 2419–2428. [Google Scholar] [CrossRef]
- Gardarin, A.; Plantegenest, M.; Bischoff, A.; Valantin-Morison, M. Understanding plant–arthropod interactions in multitrophic communities to improve conservation biological control: Useful traits and metrics. J. Pest Sci. 2018, 91, 943–955. [Google Scholar] [CrossRef]
- Vasseur, C.; Joannon, A.; Aviron, S.; Burel, F.; Meynard, J.M.; Baudry, J. The cropping systems mosaic: How does the hidden heterogeneity of agricultural landscapes drive arthropod populations? Agric. Ecosyst. Environ. 2012, 15, 3–14. [Google Scholar] [CrossRef]
- Schellhorn, N.A.; Gagic, V.; Bommarco, R. Time will tell: Resource continuity bolsters ecosystem services. Trends Ecol. Evol. 2015, 30, 524–530. [Google Scholar] [CrossRef] [PubMed]
- Heil, M.; Karban, R. Explaining evolution of plant communication by airborne signals. Trends Ecol. Evol. 2010, 25, 137–144. [Google Scholar] [CrossRef] [PubMed]
- Cook, S.M.; Khan, Z.R.; Pickett, J.A. The use of push-pull strategies in integrated pest management. Annu. Rev. Entomol. 2007, 52, 375–400. [Google Scholar] [CrossRef] [PubMed] [Green Version]
- Jaworski, C.C.; Xiao, D.; Xu, Q.; Ramirez-Romero, R.; Guo, X.; Wang, S.; Desneux, N. Varying the spatial arrangement of synthetic herbivore-induced plant volatiles and companion plants to improve conservation biological control. J. Appl. Ecol. 2019, 56, 1176–1188. [Google Scholar] [CrossRef]
- Fahrig, L.; Baudry, J.; Brotons, L.; Burel, F.G.; Crist, T.O.; Fuller, R.J.; Sirami, C.; Siriwardena, G.M.; Martin, J.-L. Functional landscape heterogeneity and animal biodiversity in agricultural landscapes. Ecol. Lett. 2011, 14, 101–112. [Google Scholar] [CrossRef] [PubMed]
- Holzschuh, A.; Steffan-Dewenter, I.; Tscharntke, T. How do landscape composition and configuration, organic farming and fallow strips affect the diversity of bees, wasps and their parasitoids? J. Anim. Ecol. 2010, 79, 491–500. [Google Scholar] [CrossRef]
- Hodek, I.; Iperti, G.A.E.L.; Hodkova, M. Long-distance flights in Coccinellidae (Coleoptera). Eur. J. Entomol. 1993, 90, 403–414. [Google Scholar]
- Roland, J.; Taylor, P.D. Herbivore-natural enemy interactions in fragmented and continuous forests. In Population Dynamics: New Approaches and Synthesis; Academic Press: Cambridge, MA, USA, 1995; pp. 195–208. [Google Scholar]
- Gutiérrez, D.; Menéndez, R. Patterns in the distribution, abundance and body size of carabid beetles (Coleoptera: Caraboidea) in relation to dispersal ability. J. Biogeogr. 1997, 24, 903–914. [Google Scholar] [CrossRef]
- Tscharntke, T.; Rand, T.A.; Bianchi, F.J. The landscape context of trophic interactions: Insect spillover across the crop-noncrop interface. In Annales Zoologici Fennici; Finnish Zoological and Botanical Publishing Board: Helsinki, Finland, 2005; pp. 421–432. [Google Scholar]
- Rand, T.A.; Louda, S.M. Spillover of agriculturally subsidized predators as a potential threat to native insect herbivores in fragmented landscapes. Conserv. Biol. 2006, 20, 1720–1729. [Google Scholar] [CrossRef] [Green Version]
- Blitzer, E.J.; Dormann, C.F.; Holzschuh, A.; Klein, A.M.; Rand, T.A.; Tscharntke, T. Spillover of functionally important organisms between managed and natural habitats. Agric. Ecosyst. Environ. 2012, 146, 34–43. [Google Scholar] [CrossRef] [Green Version]
- Bortolotto, O.C.; Júnior, M.; de Oliveira, A.; Hoshino, A.T.; Campos, T.A. Distance from the edge of forest fragments influence the abundance of aphidophagous hoverflies (Diptera: Syrphidae) in wheat fields. Acta Sci. Agron. 2016, 38, 157–164. [Google Scholar] [CrossRef]
- Lövei, G.L.; Sunderland, K.D. Ecology and behavior of ground beetles (Coleoptera: Carabidae). Annu. Rev. Entomol. 1993, 41, 231–256. [Google Scholar] [CrossRef] [PubMed]
- Evans, E.W. Searching and reproductive behaviour of female aphidophagous ladybirds (Coleoptera: Coccinellidae): A review. Eur. J. Entomol. 2003, 100, 1–10. [Google Scholar] [CrossRef]
- Vet, L.E.M.; Lewis, W.J.; Papaj, D.R.; Van Lenteren, J.C. A variable-response model for parasitoid foraging behavior. J. Insect Behav. 1990, 3, 471–490. [Google Scholar] [CrossRef]
- Martin, E.A.; Seo, B.; Park, C.R.; Reineking, B.; Steffan-Dewenter, I. Scale-dependent effects of landscape composition and configuration on natural enemy diversity, crop herbivory, and yields. Ecol. Appl. 2016, 26, 448–462. [Google Scholar] [CrossRef]
- Pywell, R.F.; Heard, M.S.; Woodcock, B.A.; Hinsley, S.; Ridding, L.; Nowakowski, M.; Bullock, J.M. Wildlife-friendly farming increases crop yield: Evidence for ecological intensification. Proc. R. Soc. B 2015, 282, 20151740. [Google Scholar] [CrossRef] [Green Version]
- Thomine, E.; Mumford, J.; Rusch, A.; Desneux, N. Using.g crop diversity to lower pesticide use: Socio-ecological approaches. Sci. Total Environ. 2022, 804, 150156. [Google Scholar] [CrossRef]
- Geno, L.M.; Geno, B.J. Polyculture Production: Principles, Benefits and Risks of Multiple Cropping Land Management Systems for Australia: A Report for the Rural Industries Research and Development Corporation; Rural Industries Research and Development Corporation: Wagga Wagga, Australia, 2001.
- Pan, H.S.; Liu, B.; Lu, Y.H. Host-plant switching promotes the population growth of Apolygus lucorum: Implications for laboratory rearing. Bull. Entomol. Res. 2019, 109, 309–315. [Google Scholar] [CrossRef]
- Desneux, N.; O’neil, R.J.; Yoo, H.J.S. Suppression of population growth of the soybean aphid, Aphis glycines Matsumura, by predators: The identification of a key predator and the effects of prey dispersion, predator abundance, and temperature. Environ. Entomol. 2006, 35, 1342–1349. [Google Scholar] [CrossRef] [Green Version]
- Desneux, N.; O’neil, R.J. Potential of an alternative prey to disrupt predation of the generalist predator, Orius insidiosus, on the pest aphid, Aphis glycines, via short-term indirect interactions. Bull. Entomol. Res. 2008, 98, 631–639. [Google Scholar] [CrossRef]
- Li, W.; Wang, L.; Jaworski, C.C.; Yang, F.; Liu, B.; Jiang, Y.; Lu, Y.; Wu, K.; Desneux, N. The outbreaks of nontarget mirid bugs promote arthropod pest suppression in Bt cotton agroecosystems. Plant Biotechnol. J. 2020, 18, 322–324. [Google Scholar] [CrossRef] [PubMed] [Green Version]
- R Core Team. R: A Language and Environment for Statistical Computing; R Foundation for Statistical Computing: Vienna, Austria, 2020; Available online: https://www.R-project.org/ (accessed on 17 July 2022).
- Paradis, E.; Schliep, K. Ape 5.0: An environment for modern phylogenetics and evolutionary analyses in R. Bioinformatics 2019, 35, 526–528. [Google Scholar] [CrossRef] [PubMed]
- Benjamini, Y.; Hochberg, Y. Controlling the false discovery rate: A practical and powerful approach to multiple testing. J. R. Stat. Soc. Ser. B 1995, 57, 289–300. [Google Scholar] [CrossRef]
- Hartig, F. DHARMa: Residual Diagnostics for Hierarchical (Multi-Level/Mixed) Regression Models. R Package Version 0.3.3.0. 2020. Available online: https://CRAN.R-project.org/package=DHARMa (accessed on 17 July 2022).
- Lenth, R. Emmeans: Estimated Marginal Means, Aka Least-Squares Means. R Package Version 1.5.4. 2021. Available online: https://CRAN.R-project.org/package=emmeans (accessed on 17 July 2022).
- Bates, D.; Maechler, M.; Bolker, B.; Walker, S. Fitting linear mixed-effects models using lme4. J. Stat. Softw. 2015, 67, 1–48. [Google Scholar] [CrossRef]
- Root, R.B. Organization of a plant–arthropod association in simple and diverse habitats: The fauna of collards (Brassica oleraceae). Ecol. Monogr. 1973, 43, 95–124. [Google Scholar] [CrossRef]
- Andow, D.A. Vegetational diversity and arthropod population response. Annu. Rev. Entomol. 1991, 36, 561–586. [Google Scholar] [CrossRef]
- Oksanen, J.; Blanchet, F.G.; Friendly, M.; Kindt, R.; Legendre, P.; McGlinn, D.; Minchin, P.R.; O’Hara, R.B.; Simpson, G.L.; Solymos, P.; et al. Vegan: Community Ecology Package. R Package Version 2.5-7. 2020. Available online: https://CRAN.R-project.org/package=vegan (accessed on 17 July 2022).
- Hulle, M.; Chaubet, B.; Turpeau, E.; Simon, J.C. Encyclop’Aphid: A website on aphids and their natural enemies. Entomol. Gen. 2020, 40, 97–101. [Google Scholar] [CrossRef]
- Ali, A.; Desneux, N.; Lu, Y.; Liu, B.; Wu, K. Characterization of the natural enemy community attacking cotton aphid in the Bt cotton ecosystem in Northern China. Sci. Rep. 2016, 6, 24273. [Google Scholar] [CrossRef]
- Ali, A.; Desneux, N.; Lu, Y.; Wu, K. Key aphid natural enemies showing positive effects on wheat yield through biocontrol services in northern China. Agric. Ecosyst. Environ. 2018, 266, 1–9. [Google Scholar] [CrossRef]
- Yang, F.; Yao, Z.W.; Zhu, Y.L.; Wu, Y.K.; Liu, L.T.; Liu, B.; Desneux, N.; Lu, Y.H. A molecular detection approach for assessing wheat aphid-parasitoid food webs in northern China. Entomol. Gen. 2020, 40, 273–284. [Google Scholar] [CrossRef]
- Ragsdale, D.W.; Landis, D.A.; Brodeur, J.; Heimpel, G.E.; Desneux, N. Ecology and management of the soybean aphid in North America. Annu. Rev. Entomol. 2011, 56, 375–399. [Google Scholar] [CrossRef] [Green Version]
- Di, N.; Zhang, K.; Xu, Q.; Zhang, F.; Harwood, J.D.; Wang, S.; Desneux, N. Predatory ability of Harmonia axyridis (Coleoptera: Coccinellidae) and Orius sauteri (Hemiptera: Anthocoridae) for suppression of fall armyworm Spodoptera frugiperda (Lepidoptera: Noctuidae). Insects 2021, 12, 1063. [Google Scholar] [CrossRef] [PubMed]
- Pan, H.; Liu, B.; Jaworski, C.C.; Yang, L.; Liu, Y.; Desneux, N.; Thomine, E.; Lu, Y. Effects of aphid density and plant taxa on predatory ladybeetle abundance at field and landscape scales. Insects 2020, 11, 695. [Google Scholar] [CrossRef] [PubMed]
- Xiao, D.; Xu, Q.X.; Chen, X.; Du, X.Y.; Desneux, N.; Thomine, E.; Dai, H.J.; Harwood, J.D.; Wang, S. Development of a molecular gut-content identification system to identify aphids preyed upon by the natural enemy Coccinella septempunctata. Entomol. Gen. 2021, 41, 591–599. [Google Scholar] [CrossRef]
- Wäckers, F.L.; Van Rijn, P.C. Pick and mix: Selecting flowering plants to meet the requirements of target biological control insects. In Biodiversity and Insect Pests: Key Issues for Sustainable Management; John Wiley & Sons, Ltd.: Hoboken, NJ, USA, 2012; Chapter 9; pp. 139–165. [Google Scholar]
- Wang, Y.S.; Yao, F.L.; Soares, M.A.; Basiri, S.E.; Amiens-Desneux, E.; Campos, M.; Lavoir, A.; Desneux, N. Effects of four non-crop plants on life history traits of the lady beetle Harmonia axyridis. Entomol. Gen. 2020, 40, 243–252. [Google Scholar] [CrossRef]
- Gagic, V.; Hänke, S.; Thies, C.; Scherber, C.; Tomanović, Ž.; Tscharntke, T. Agricultural intensification and cereal aphid–parasitoid–hyperparasitoid food webs: Network complexity, temporal variability and parasitism rates. Oecologia 2012, 170, 1099–1109. [Google Scholar] [CrossRef] [Green Version]
- Pareja, M.; Brown, V.K.; Powell, W. Aggregation of parasitism risk in an aphid-parasitoid system: Effects of plant patch size and aphid density. Basic Appl. Ecol. 2008, 9, 701–708. [Google Scholar] [CrossRef]
- Sirami, C.; Gross, N.; Baillod, A.B.; Bertrand, C.; Carrié, R.; Hass, A.; Henckel, L.; Miguet, P.; Vuillot, C.; Alignier, A.; et al. Increasing crop heterogeneity enhances multitrophic diversity across agricultural regions. Proc. Natl. Acad. Sci. USA 2019, 116, 16442–16447. [Google Scholar] [CrossRef] [Green Version]
- Aguilera, G.; Roslin, T.; Miller, K.; Tamburini, G.; Birkhofer, K.; Caballero-Lopez, B.; Lindström, S.A.M.; Öckinger, E.; Rundlöf, M.; Rusch, A.; et al. Crop diversity benefits carabid and pollinator communities in landscapes with semi-natural habitats. J. Appl. Ecol. 2020, 57, 2170–2179. [Google Scholar] [CrossRef]
- Chapman, J.W.; Reynolds, D.R.; Brooks, S.J.; Smith, A.D.; Woiwod, I.P. Seasonal variation in the migration strategies of the green lacewing Chrysoperla carnea species complex. Ecol. Entomol. 2006, 31, 378–388. [Google Scholar] [CrossRef]
- Evans, E.W.; Youssef, N.N. Numerical responses of aphid predators to varying prey density among Utah alfalfa fields. J. Entomol. Soc. 1992, 65, 30–38. [Google Scholar]
- Ouyang, F.; Men, X.; Yang, B.; Su, J.; Zhang, Y.; Zhao, Z.; Ge, F. Maize benefits the predatory beetle, Propylea japonica (Thunberg), to provide potential to enhance biological control for aphids in cotton. PLoS ONE 2012, 7, e44379. [Google Scholar] [CrossRef]
- Ouyang, F.; Su, W.; Zhang, Y.; Liu, X.; Su, J.; Zhang, Q.; Men, X.; Ju, Q.; Ge, F. Ecological control service of the predatory natural enemy and its maintaining mechanism in rotation-intercropping ecosystem via wheat-maize-cotton. Agric. Ecosyst. Environ. 2020, 301, 107024. [Google Scholar] [CrossRef]
- Harwood, J.D.; Desneux, N.; Yoo, H.J.S.; Rowley, D.L.; Greenstone, M.H.; Obrycki, J.J.; O’Neil, R.J. Tracking the role of alternative prey in soybean aphid predation by Orius insidiosus: A molecular approach. Mol. Ecol. 2007, 16, 4390–4400. [Google Scholar] [CrossRef]
- Jiao, Z.; Jaworski, C.C.; Lu, Y.; Ye, L.; Wu, K.; Desneux, N. Maize fields are a potential sink for an outbreaking mirid bug pest in Chinese Bt-cotton agricultural landscapes. Agric. Ecosyst. Environ. 2019, 279, 122–129. [Google Scholar] [CrossRef] [Green Version]
- Thomine, E.; Jeavons, E.; Rusch, A.; Bearez, P.; Desneux, N. Effect of crop diversity on predation activity and population dynamics of the mirid predator Nesidiocoris tenuis. J. Pest Sci. 2020, 93, 1255–1265. [Google Scholar] [CrossRef]

| χ2 | d.f. | p | |
|---|---|---|---|
| 2017 | |||
| Pests | |||
| Diversity:Crop | 6.41 | 4 | 0.17 |
| Diversity | 0.683 | 2 | 0.71 |
| Natural enemies | |||
| Diversity:Crop | 2.78 | 4 | 0.86 |
| Diversity | 0.199 | 2 | 0.69 |
| 2018 | |||
| Pests | |||
| Diversity:Crop:Diet | 0.674 | 3 | 0.88 |
| Diversity:Crop | 1.54 | 3 | 0.67 |
| Diversity:Diet | 1.61 | 1 | 0.20 |
| Natural enemies | |||
| Diversity:Crop | 0.575 | 3 | 0.90 |
| Diversity | 0.236 | 1 | 0.63 |
| F | d.f. | p | |
|---|---|---|---|
| 2017 | |||
| Pests | |||
| Diversity:Crop | 1.49 | 4, 22 | 0.067 |
| Diversity | 1.17 | 4, 24 | 0.30 |
| Crop | 8.88 | 2, 26 | <0.001 |
| 2018 | |||
| Diversity:Crop | 0.368 | 3, 35 | 0.99 |
| Diversity | 0.303 | 1, 36 | 0.96 |
| Crop | 22.5 | 3, 36 | <0.001 |
Publisher’s Note: MDPI stays neutral with regard to jurisdictional claims in published maps and institutional affiliations. |
© 2022 by the authors. Licensee MDPI, Basel, Switzerland. This article is an open access article distributed under the terms and conditions of the Creative Commons Attribution (CC BY) license (https://creativecommons.org/licenses/by/4.0/).
Share and Cite
Jaworski, C.C.; Thomine, E.; Rusch, A.; Lavoir, A.-V.; Xiu, C.; Ning, D.; Lu, Y.; Wang, S.; Desneux, N. At Which Spatial Scale Does Crop Diversity Enhance Natural Enemy Populations and Pest Control? An Experiment in a Mosaic Cropping System. Agronomy 2022, 12, 1973. https://doi.org/10.3390/agronomy12081973
Jaworski CC, Thomine E, Rusch A, Lavoir A-V, Xiu C, Ning D, Lu Y, Wang S, Desneux N. At Which Spatial Scale Does Crop Diversity Enhance Natural Enemy Populations and Pest Control? An Experiment in a Mosaic Cropping System. Agronomy. 2022; 12(8):1973. https://doi.org/10.3390/agronomy12081973
Chicago/Turabian StyleJaworski, Coline C., Eva Thomine, Adrien Rusch, Anne-Violette Lavoir, Chunli Xiu, Di Ning, Yanhui Lu, Su Wang, and Nicolas Desneux. 2022. "At Which Spatial Scale Does Crop Diversity Enhance Natural Enemy Populations and Pest Control? An Experiment in a Mosaic Cropping System" Agronomy 12, no. 8: 1973. https://doi.org/10.3390/agronomy12081973
APA StyleJaworski, C. C., Thomine, E., Rusch, A., Lavoir, A.-V., Xiu, C., Ning, D., Lu, Y., Wang, S., & Desneux, N. (2022). At Which Spatial Scale Does Crop Diversity Enhance Natural Enemy Populations and Pest Control? An Experiment in a Mosaic Cropping System. Agronomy, 12(8), 1973. https://doi.org/10.3390/agronomy12081973