Article

Remote Sensing-Based Evaluation of Heat Stress Damage on Paddy Rice Using NDVI and PRI Measured at Leaf and Canopy Scales

1
Department of Applied Plant Science, Chonnam National University, 77 Yongbong-ro, Gwangju 61186, Korea
2
National Institute of Agricultural Sciences, Rural Development Administration, Wanju 55365, Korea
3
Agricultural Resources Research Institute, Gyeonggi Agricultural Research and Extension Service, 61 Yeoncheon-ro, Yeoncheon-gun 11017, Korea
4
Satellite Application Division, Korea Aerospace Research Institute, 115 Gwahangno, Yuseong-gu, Daejeon 34133, Korea
5
BK21 FOUR Center for IT-Bio Convergence System Agriculture, Chonnam National University, Yongbong-ro 77, Gwangju 61186, Korea
*
Author to whom correspondence should be addressed.
Agronomy 2022, 12(8), 1972; https://doi.org/10.3390/agronomy12081972
Submission received: 4 July 2022 / Revised: 12 August 2022 / Accepted: 17 August 2022 / Published: 20 August 2022
(This article belongs to the Special Issue Advances in Field Spectroscopy in Agriculture)

Abstract

:
Extremely high air temperature at the heading stage of paddy rice causes a yield reduction due to the increasing spikelet sterility. Quantifying the damage to crops caused by high temperatures can lead to more accurate estimates of crop yields. The remote sensing technique evaluates crop conditions indirectly but provides information related to crop physiology, growth, and yield. In this study, we aim to assess the crop damage caused by heat stress in paddy rice examined under elevated air temperatures in a temperature gradient field chamber from 2016 to 2019, using remote-sensed vegetation indices. A leaf-spectrometer, field-spectrometers, and a multi-spectral camera were used to monitor the conditions of paddy rice. Although, in the leaf- and canopy-scales, the values of normalized difference vegetation index (NDVI) and photochemical reflectance index (PRI) decreased after the heading of rice under normal conditions, the decreasing sensitivity of NDVI and PRI was different depending on the degree of physiological heat stress by high temperature conditions. The NDVI after the heading under extremely high air temperature was not dropped and remained the value before heading. The PRI decreased at all air temperature conditions after the heading; the PRI of the plot exposed to the elevated air temperature was higher than that under ambient air temperature. Further, the relative change in NDVI and PRI after the heading exhibited a strong relationship with the ripening ratio of paddy rice, which is the variable related to crop yield. These remote-sensing results aid in evaluating the crop damage caused by heat stress using vegetation indices.

1. Introduction

The impact of global warming in agriculture has been analyzed since the 1980s [1]. The change in yield components for the crop has been examined under elevated air temperatures and increased concentrations of carbon dioxide (CO2) [2,3,4,5]. The change in crop productivity has been assessed using accumulated data for decades [6]. To predict the effect of climate change in grain yields, crops have been cultivated using an infrared heater [7] or a CO2 fumigation system to perform a free-air carbon dioxide enrichment (FACE) experiment [8,9,10]. Additionally, the impacts of air temperature and CO2 were considered together in a temperature gradient field chamber (TGFC) [3,11]. Moreover, field warming experiments and crop models were used to estimate the grain yield under future climate environments in regional and global scales [12].
According to previous studies, crop response to global warming varies depending on the region and type of crop; global warming has had both positive and negative aspects on crops. In the Jiangsu Province, China, the damage to winter wheat caused by frost and chilling stress was reduced due to the increased daily minimum air temperature [7]. In addition, the rapid growth on winter wheat under the elevated air temperature shortened the growth period, and this phenomenon prevented heat stress in the ripening stage of winter wheat [7]. Additionally, the cultivated area for a double or triple cropping system can be increased by the shift in the sowing date [13]. However, crop yields of major crops, such as rice, wheat, maize, and soybeans, are reduced under elevated air temperatures [12]. High air temperature accelerates the evapotranspiration rate from crops and soil [14], leading to a higher water demand. Additionally, the photosynthetic activity decreases under extremely high air temperatures [15], and vegetation may become withered due to heat stress.
Grain yield of crops declined under extremely high air temperatures [14,16,17], although the crops did not wither due to sufficient moisture conditions. For example, the spikelet sterility (inversely related to the spikelet fertility percentage) of paddy rice, which is related to the grain yield, normally increases above ~35 °C, although the threshold temperature varies depending on the cultivar crop [18,19,20]. In paddy rice, spikelet sterility demonstrates a correlation with the maximum air temperature [20]; however, spatially displaying the spikelet sterility and ripening ratio of paddy rice is challenging. Given that air temperature is affected by complex topographic parameters, such as elevation, direction, and land slope [21], air temperature data should be measured by various stations to reflect these spatial variations. Land surface temperature (LST) or canopy temperature estimated using an infrared camera was known to a high correlation with air temperature, but air temperature could not be estimated using only LST [22] due to the effects of surface and atmospheric conditions [23].
The vegetation indices can be used to non-destructively diagnose crop conditions [24] and spatially express the information [25]. Vegetation indices based on spectral reflectance express specific properties of vegetation, such as biomass, chlorophyll, water contents, carotenoid, and leaf area index [26,27,28,29]. In particular, the normalized difference vegetation index (NDVI) has been known to effectively represent the crop growth and development [30]. The change in vegetation phenology has been detected by satellite-based NDVI [31,32], and numerous studies have reported that the start of the growing season was faster in past decades [33]. Additionally, vegetation indices are utilized as input data to estimate grain yield because they are affected by meteorological conditions, diseases, and insects. Furthermore, the physical damage and the physiological conditions of crops have been monitored using the vegetation index [34,35]. The photochemical reflectance index (PRI), which represents the physiological condition of crops and is calculated using the spectral reflectance at 531 nm and 570 nm wavelengths. The responsive property of PRI to heat stress will cause the reduction of observed value under the extremely high air temperature [17,36].
Indeed, according to previous studies, the wavelengths between 531 nm and 722 nm are sensitive to the heat stress of crops [37]. In addition, the spectral reflectance of heat-stressed rice was shown as increasing in a whole range of visible wavelength due to the declined growth of leaf area [38]. However, the responses of these spectral reflectance-based vegetation indices might be different on the basis of the physiological properties and degrees of heat stress. Further, they must be approached differently according to the observation scales of leaf and canopy [39]. Therefore, the relationship between vegetation indices and heat stress should be evaluated considering the crop type, the degree of heat condition, and the measurement method.
This study aims to evaluate the crop damage caused by heat stress in paddy rice using remote sensing vegetation indices. The data for this study were obtained from the cultivation experiment of paddy rice under elevated air temperatures in a TGFC from 2016 to 2019. The crop growth and physiology were monitored under the extremely high air temperature using remote sensing techniques. The seasonal trends of NDVI and PRI were examined after the heading stage to assess the physiological damage caused by the heat stress in different spatial scales using a leaf-spectrometer (leaf scale), field-spectrometers (canopy scale), and a multi-spectral camera (leaf and canopy scale). Finally, the ripening ratio of paddy rice, which is affected by extremely high air temperatures and is related to grain yield, was estimated using NDVI and PRI at the canopy scale.

2. Materials and Methods

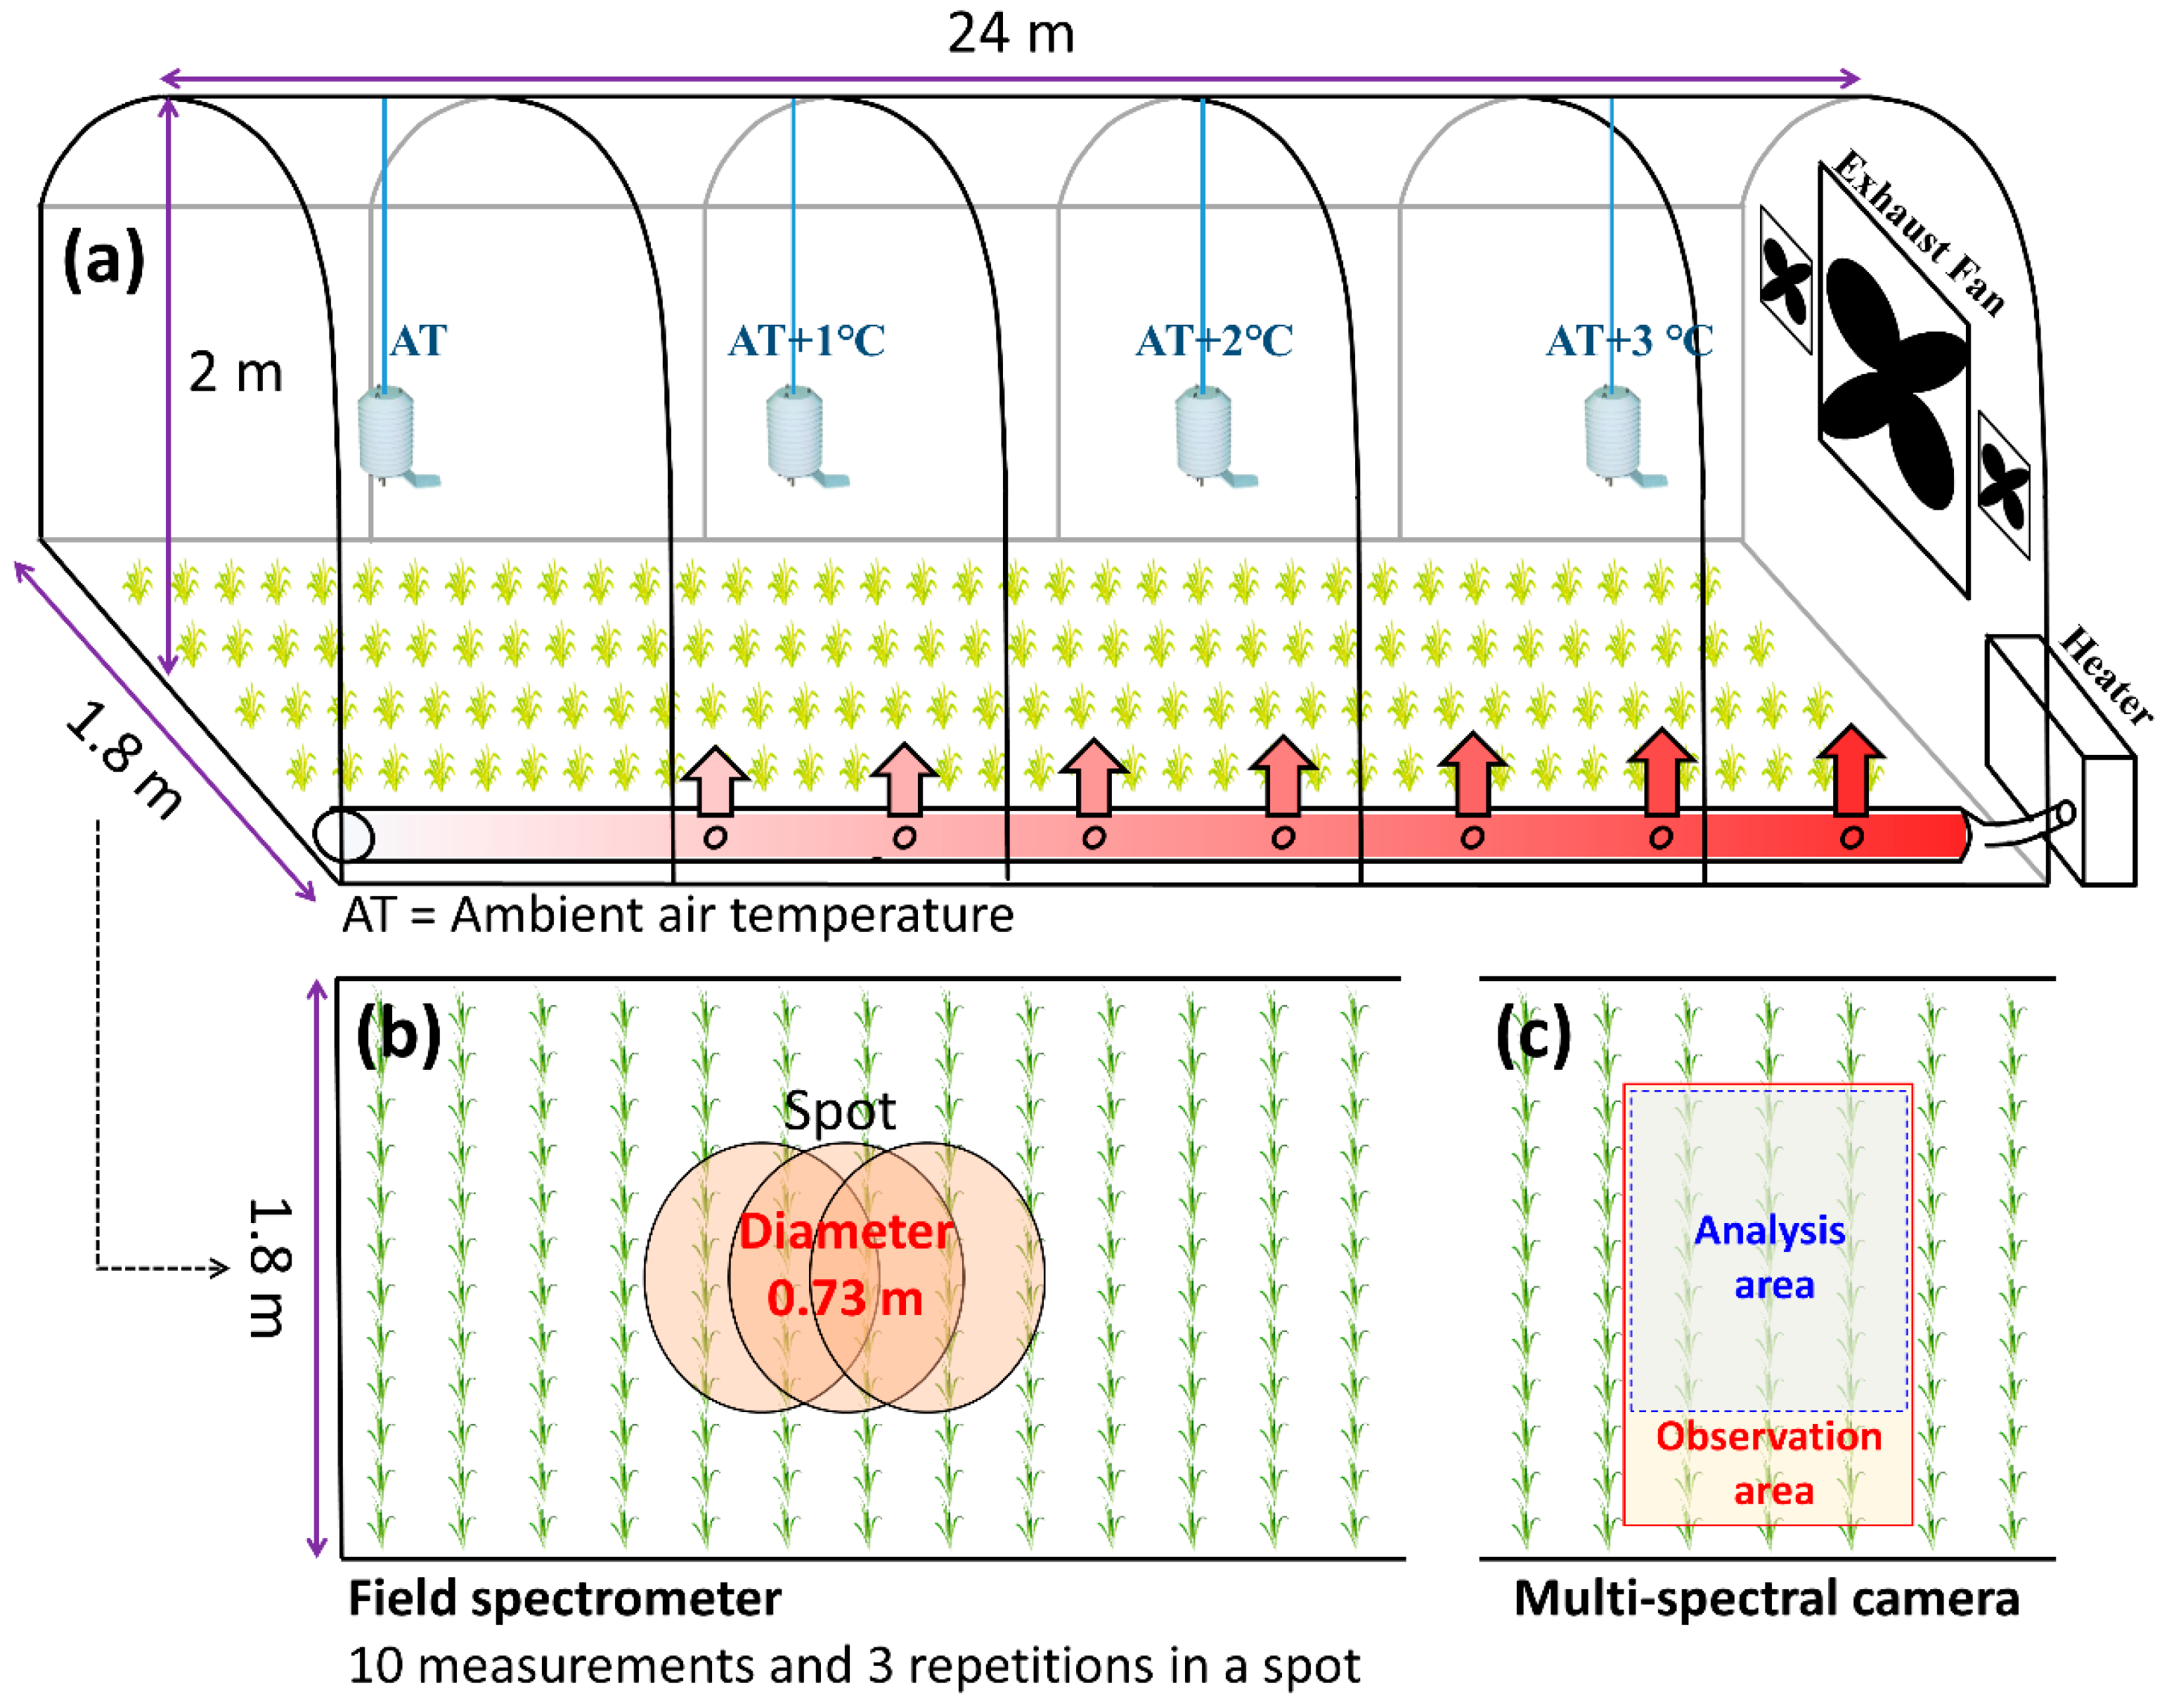
2.1. Experimental Facility and Cultivation of Paddy Rice

The study area corresponds to paddy fields located in the Chonnam National University, Gwangju, South Korea. The TGFC was used from 2016 to 2019 (Figure 1). The purpose of TGFC is to simulate elevated air temperature environments in preparation for future environmental changes [40,41]; the response of crops to the TGFC has been evaluated in previous studies [2,42]. In particular, the type of TGFC used in this study has the advantage of using natural sunlight that reflects the real environment rather than artificial light. Instrument shelters were located in four positions at equal intervals to measure the air temperature. In this study, the air temperature in the TGFC was continually controlled using a heater and three exhaust fans, comprising one big fan and two small fans, during the cultivation period (Figure 1a). The air temperature measured by the first instrument shelter was defined as ambient air temperature (AT). The heater and fans were operated to maintain a constant difference (AT+3 °C) between the air temperature values measured by the first and fourth instrument shelters, day and night. However, because the air temperature was controlled based on the first and fourth instrument shelters, the air temperatures at the second (AT+1 °C) and third (AT+2 °C) instrument shelters did not maintain a constant difference.
Paddy rice was cultivated in the TGFCs and the outside paddy field for four years. Paddy rice of the Ilmi cultivar was transplanted on 3 June 2016; 1 June 2018; and 31 May 2019, and was harvested on 13 October 2016; 27 September 2018; and 4 October 2019, respectively. Paddy rice of the Saenuri cultivar was cultivated from 15 June 2017 to 10 October 2017. These japonica rice cultivars were characterized by medium-late maturity. Given the width and length of TGFC to be 1.8 m and 24 m, respectively, with a planting distance of 15 × 30 cm, approximately 960 samples were transplanted in each TGFC.
The heading date, spikelet sterility, and ripening ratio were examined, as this study focused on crop damage caused by heat stress. Spikelet sterility and ripening ratio (%) are the variables affected by heat stress. The spikelet sterility is defined as an empty grain state within the spikelet, and it is associated with pollen germination, pollen activity, and floret fertility of paddy rice under the extremely high air temperature at the heading stage [43]. The ripening ratio is the percentage of ripened grain; it can be affected by the spikelet sterility at the heading stage and air temperature and insolation during the ripening stage. The spikelet sterility and ripening ratio were measured after harvesting and drying the rice at 70 °C in a dryer for four days. Then, these variables were analyzed using remote sensing-based vegetation indices.

2.2. Remote Sensing Data

2.2.1. Leaf-Spectrometer

The spectral reflectance at the leaf scale was measured on paddy rice using a leaf-spectrometer (CID CI-710, Bio-Science, Camas, WA, USA). The wavelength range of this leaf-spectrometer was 400–950 nm, with a sampling wavelength interval of ~0.215 nm at 400 nm and ~0.171 nm at 950 nm. This leaf-spectrometer had a broadband light source, and the user could select to either measure the reflectance or transmittance. The leaf-spectrometer was calibrated using a white reflectance standard circle, and then the spectral reflectance was measured on the upper side of a leaf. In this study, measurements using the leaf-spectrometer were conducted three times per leaf, and the mean value of these three measurements was used for the analysis. This process was repeated for the twenty upper leaves at each position, AT and AT+3 °C, every week after 26 June 2018 (Figure 2a). The measured reflectance was recalculated at 1 nm intervals. Then, NDVI [44] and PRI [45] were calculated as follows:
NDVI = ( R 800 R 680 ) ( R 800 + R 680 ) ,
PRI = ( R 531 R 570 ) ( R 531 + R 570 ) ,
where R800, R680, R531, and R570 indicate the spectral reflectance at 800, 680, 531, and 570 nm, respectively. In this study, the bandwidths used for NDVI and PRI were 10 nm and 1 nm, respectively.

2.2.2. Field-Spectrometer

Field-spectrometers were used to measure the spectral reflectance at the canopy scale in the TGFCs. Two analytical spectral devices (ASD) Fieldspec 3 spectrometers (Malvern Panalytical Ltd., Malvern, UK, USA) in 2016 and two Avantes AvaSpec-ULS2048L spectrometers (Avantes BV, Apeldoorn, the Netherlands) in 2017 to 2019 were used. One spectrometer measured the solar irradiance and the other measured the radiance of the target (Figure 2b). The Fieldspec 3 had a wavelength range of 350–2500 nm and a wavelength sampling interval of 1.4 nm at 350–1050 nm. The wavelength range and wavelength sampling interval of AvaSpec-ULS2048L were 300–1100 nm and 0.576 nm, respectively, at 700 nm. Inter-calibrations between the two spectrometers were conducted using white reference panels with reflectance above 99% and 97% for visible and near-infrared (NIR) wavelengths, respectively [46]. The measurements of field-spectrometers were conducted at approximately 1.8 m height from the target at transplanting stage, and the distance between the fiber and target got closer as the vegetation grew. The spectral reflectance was measured in the same position 10 times using a spectrometer; this process was repeated three times (Figure 1b). The optical measurements were conducted near solar noontime on a clear day, and the number of measurement positions was 44 for 4 years. All the measurement data, such as the leaf-spectrometer data, were resampled at 1-nm intervals, and the vegetation indices were then calculated.

2.2.3. Multi-Spectral Camera

The multi-spectral camera was used to measure the spectral reflectance at the leaf and canopy scale. In this study, a Rededge (RedEdge, MicaSense Inc., Seattle, WA, USA) device was used among various multi-spectral cameras. This device is originally equipped with five bands: blue (475 nm), green (560 nm), red (668 nm), red-edge (717 nm), and NIR (840 nm). The images of the spectral reflectance in the multi-spectral camera were measured in the heading stage (16 August 2018) and mature stage (27 September 2018) at four positions, AT, AT+1 °C, AT+2 °C, and AT+3 °C (Figure 1a). The measurements were conducted at near solar noontime on a clear day at approximately 1.6 m height in the stage of rice transplanting (Figure 2c). The digital number of the multi-spectral camera was converted to spectral reflectance using a calibrated reflectance panel of MicaSense Inc., and then only NDVI was calculated. To confirm the response of paddy rice under heat stress, the background effect was eliminated. The pixels in which the NIR was greater than 0.24 were extracted and defined as vegetation; this threshold was set considering the distribution of NIR between the vegetation and background. Additionally, the sun glint effect in the images was excluded by cutting out part of the affected area (Figure 1c). The information of the optical observation on the leaf-spectrometer, field-spectrometer, and multi-spectral camera is summarized in Table 1.

2.3. Relative Change in Vegetation Index after Heading

A new concept was suggested to evaluate the effect of heat stress after the heading stage in paddy rice. In this study, there was a focus on the change of vegetation indices after the heading stage. Relative changes in the field-spectrometer based on the NDVI after the heading stage were calculated as follows:
rNDVI = ( NDVI heading + 40 days NDVI minimum ) ( NDVI heading NDVI minimum ) ,
where NDVIheading and NDVIheading+40days indicate the NDVI values measured at the heading date and 40 days after heading, respectively. The meaning of NDVIminimum in this study is defined as the minimum value that NDVI can theoretically have for the cultivation period; this value was set to zero. rNDVI indicates the relative change in NDVI at each position after the heading stage.
The relative change in PRI was calculated using the same method as that for rNDVI. First, PRI was calculated as the scaled PRI (hereafter, sPRI). Second, the relative scaled PRI (hereafter, rsPRI) was calculated using Equation (5) to determine the relative change in sPRI after heading at the canopy scale.
sPRI = ( PRI + 1 ) / 2 ,
rsPRI = ( sPRI heading + 40 days sPRI minimum ) ( sPRI heading sPRI minimum ) ,
where sPRI indicates a scaled PRI. sPRIheading and sPRIheading+40days indicate sPRI values measured at the heading date and 40 days after heading, respectively. In this study, sPRIminimum was set to 0.425 based on the distribution of sPRI values measured over our four years by the field-spectrometer.

2.4. Meteorological Characteristics

In 2016, the highest air temperature was recorded during the reproductive stage, i.e., from panicle initiation to the flowering stage (Figure 3a) [47]. The mean air temperature was higher than the climatic mean air temperature from 19 July 2016 to 24 August 2016, except for one day. Moreover, when compared to the climatic air temperature, the increase in the maximum (+3.26 °C) air temperature was greater than that in the mean (+2.37 °C) and minimum (+1.76 °C) air temperatures. In 2017, the air temperature was higher in the vegetative and early reproductive stages (Figure 3b). Although the air temperature increased in the heading stage, it did not exceed the threshold air temperature, which is typically set to 35 °C [48]. In 2018, the historical heatwave occurred, and the critical air temperature was recorded (Figure 3c). The air temperatures averagely exhibited an increase of approximately 3.15, 2.33, and 4.71 °C in the daily mean, minimum, and maximum air temperatures from 10 July 2018 to 23 August 2018. The extremely high air temperatures were recorded in 2018 for longer continuous periods than in 2016. Most heatwaves occurred before the heading stage in 2018, whereas in 2016, they occurred mostly after the heading stage. In 2019, the air temperature was similar to the climatic data from 1981 to 2010 (Figure 3d).

3. Results

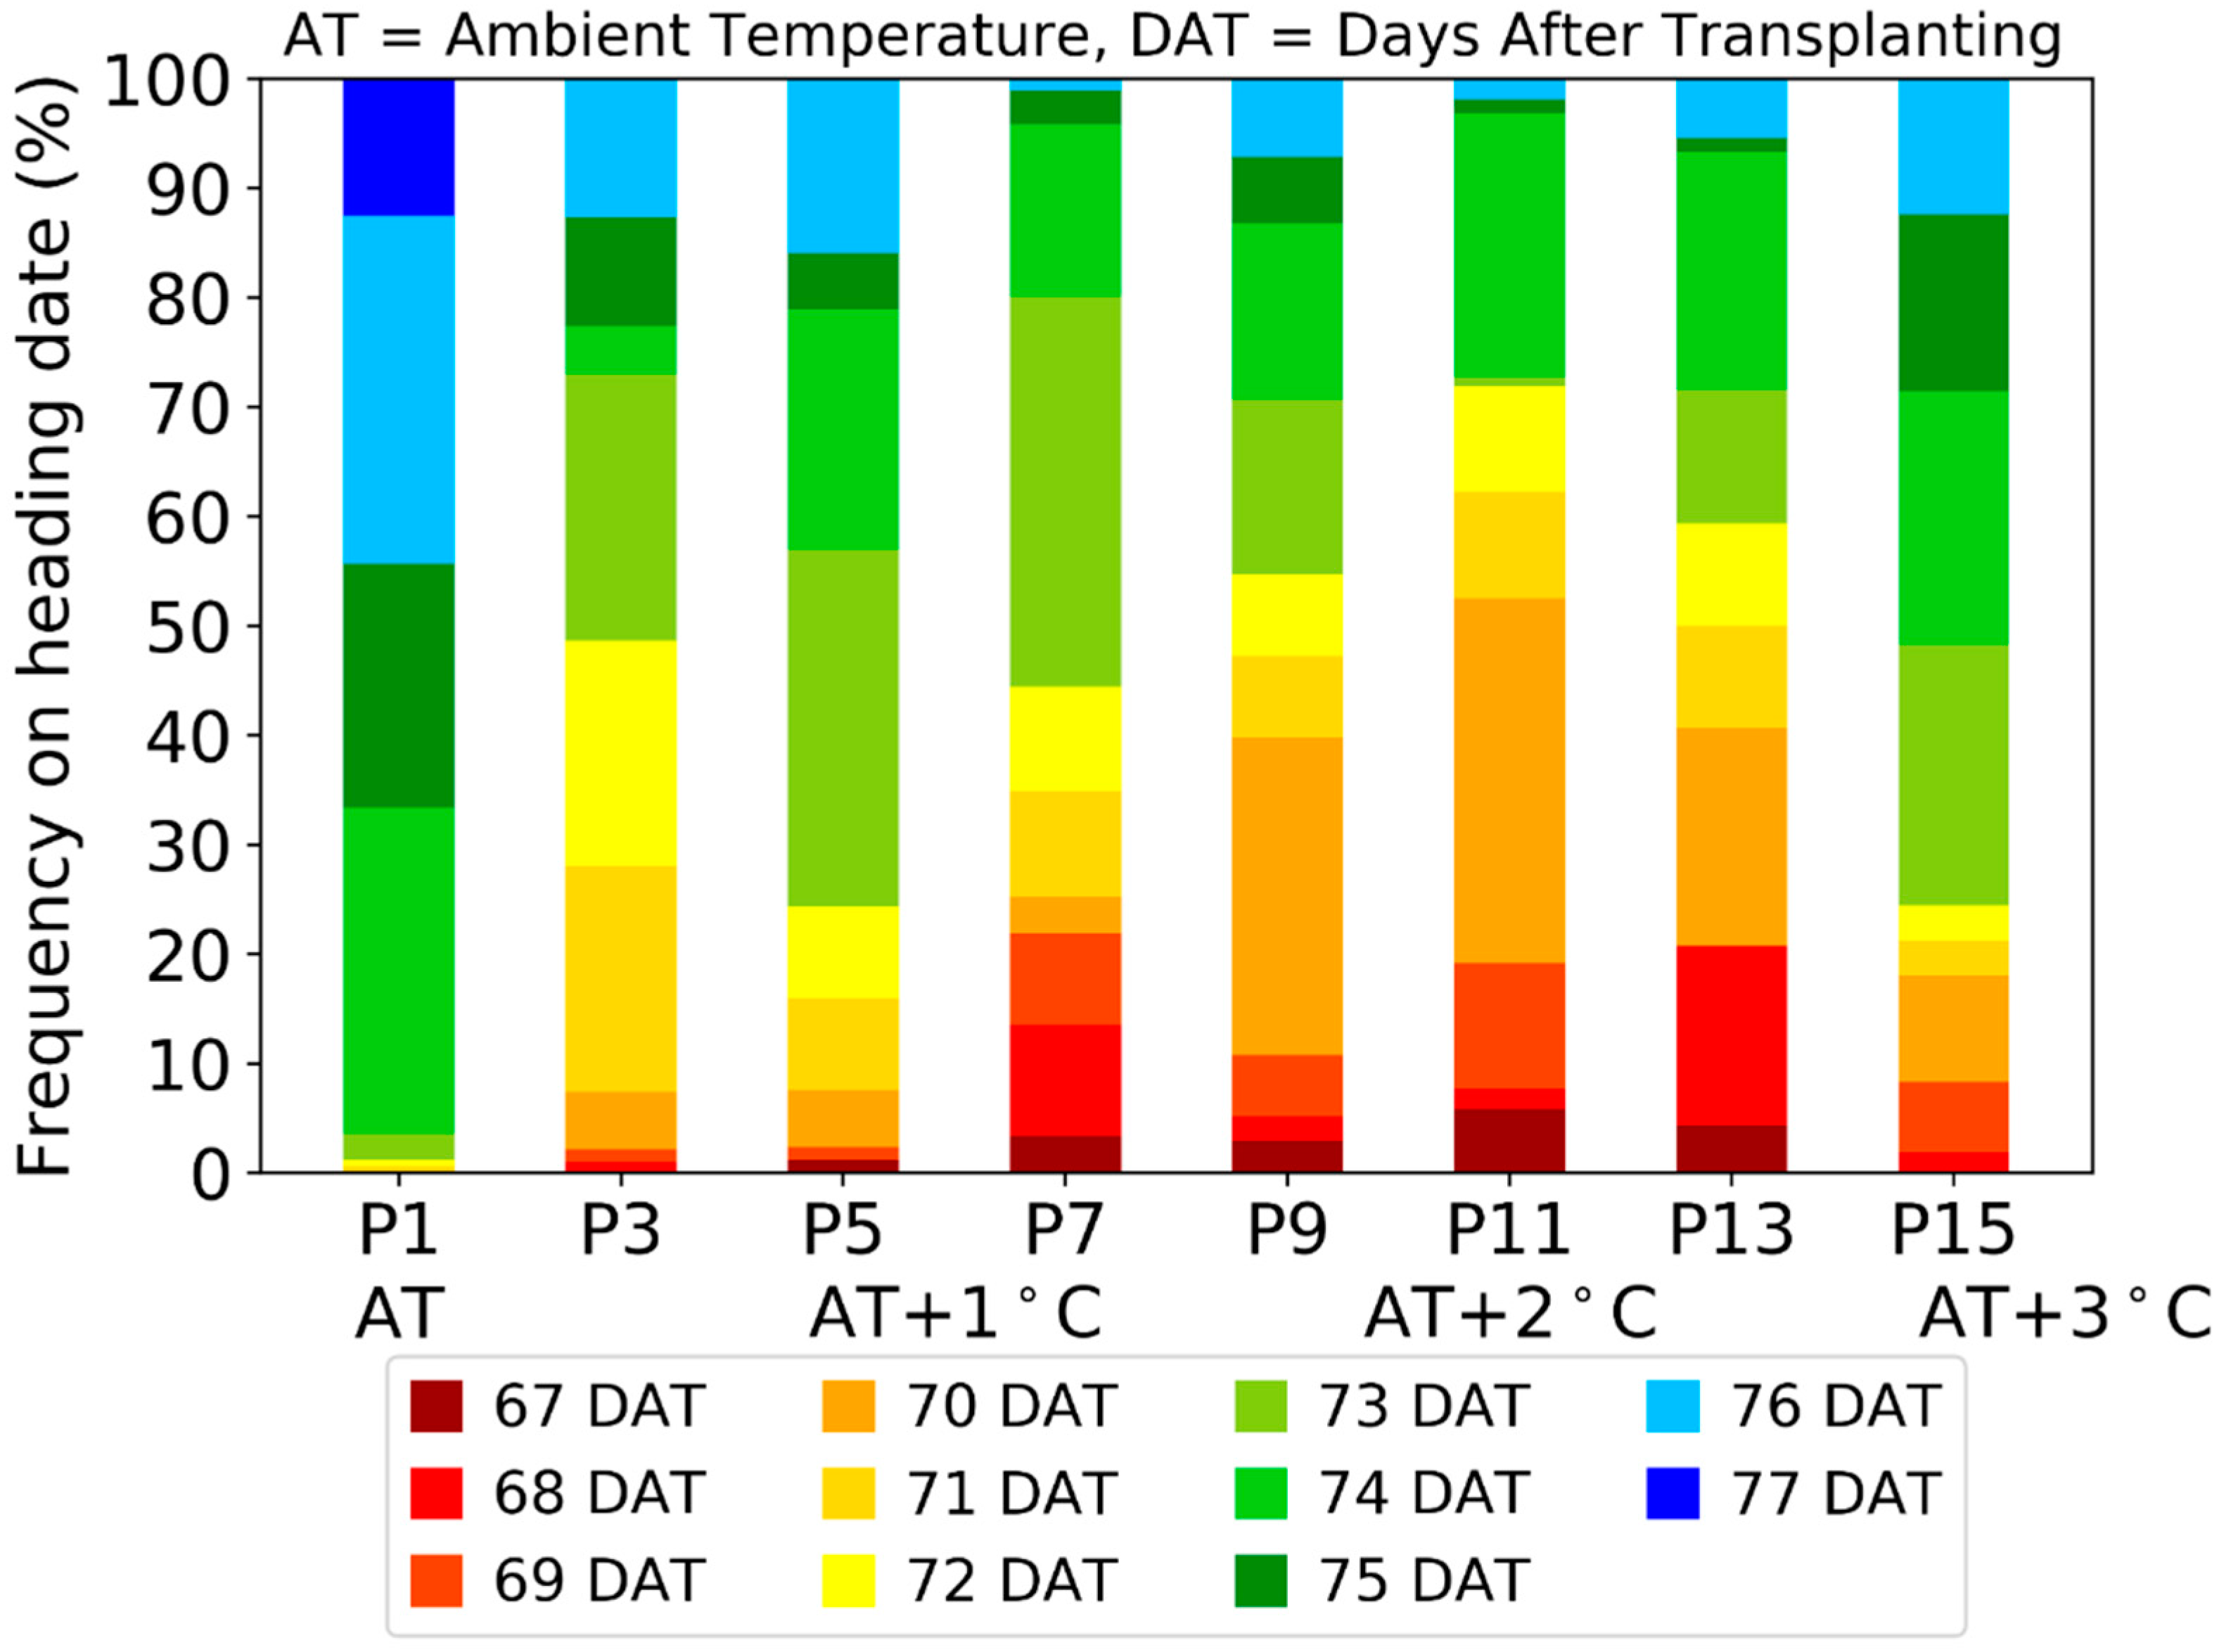
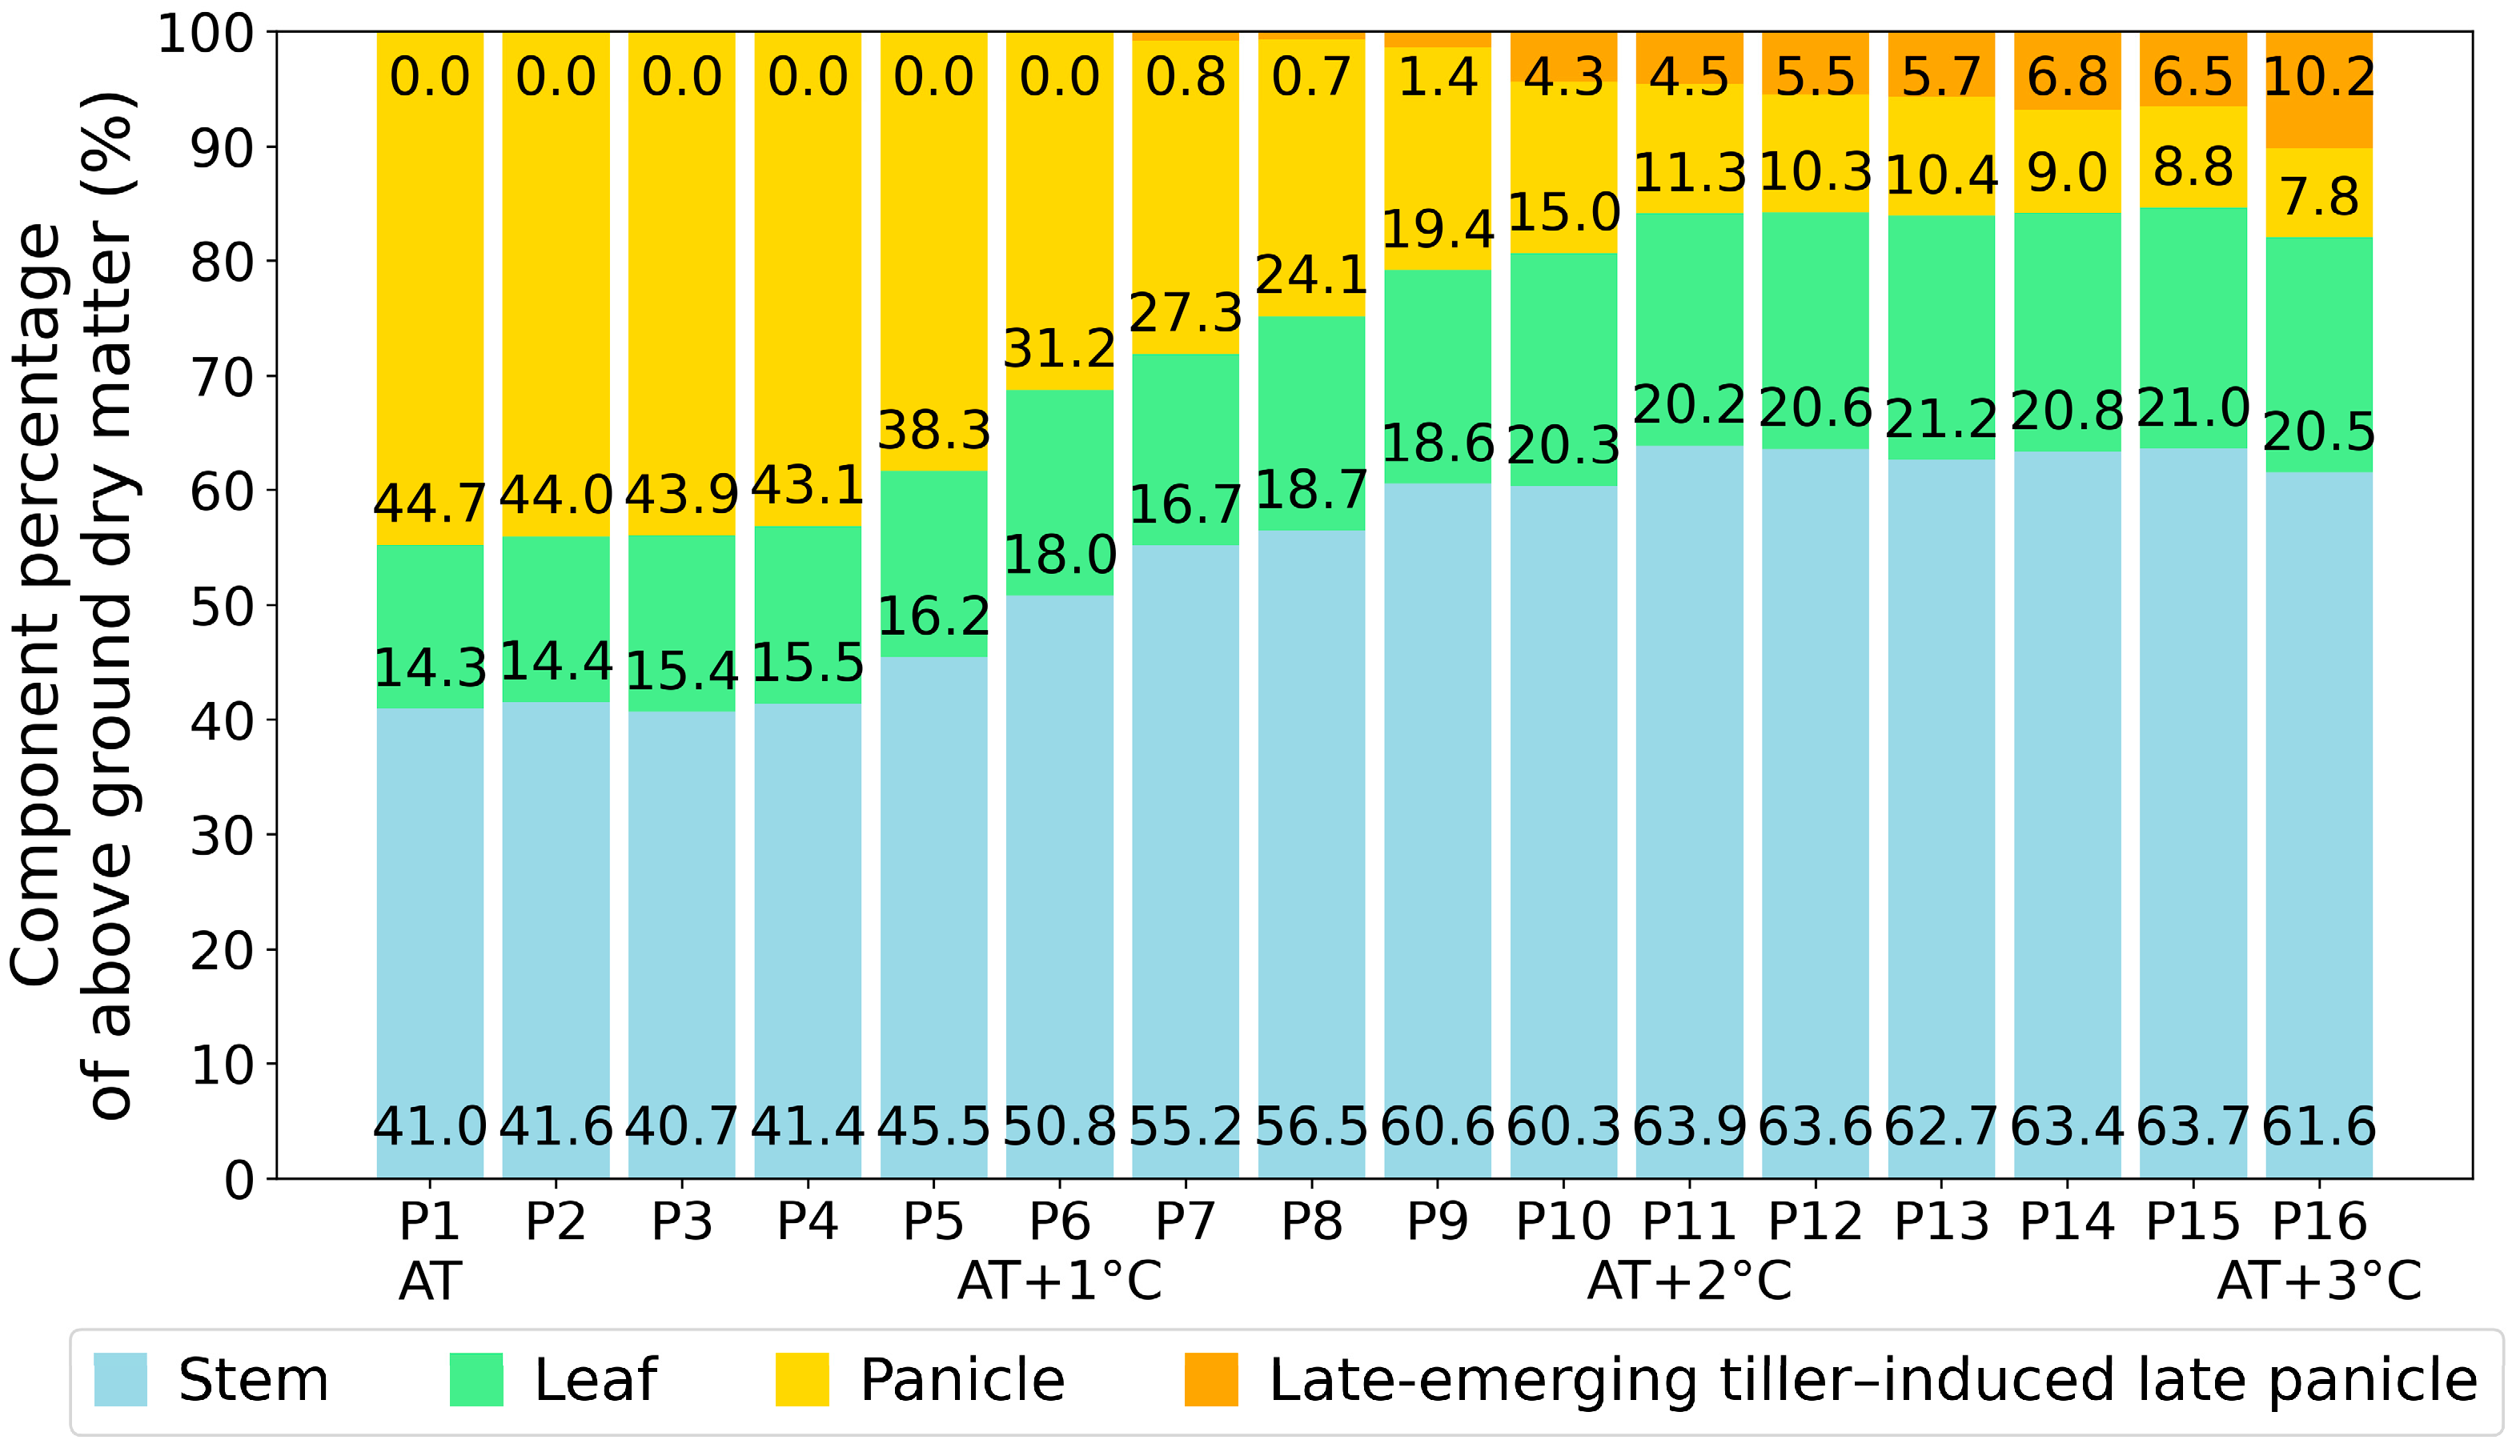
3.1. Response of Paddy Rice under Elevated Air Temperature

The heading date was surveyed every day at each TGFC position from 7 August 2018 (67 days after transplanting, DAT) to 17 August 2018 (77 DAT) to comprehend the response of paddy rice to the elevated air temperature. Figure 4 depicts a cumulative bar graph to express the different heading dates according to air temperature. When approximately 40–50% of the total panicles exhibit heading conditions, the growing stage is defined as the heading stage [49]. At the P1 (AT) position, most heading dates ranged from 74 DAT to 76 DAT, and the heading date was set to 75 DAT. At the P11 (AT+2 °C) position, the first heading date of some panicles was 67 DAT, and the heading date was 70 DAT. In AT to AT+2 °C position range, the heading date at the position exposed to the higher air temperature was earlier. However, the heading date at P15 (AT+3 °C) was later than that at P11 (AT+2 °C) due to growth degradation caused by the late of root implantation at P15 in the transplanting period.
The elevated air temperature affected the heading date and the grain components of paddy rice. The AGDM ratios of the stem, leaf, panicle, and late merging tiller-induced late panicle varied according to the heat stress (Figure 5). At the P1 (AT) position, the ratios of the stem, leaf, and panicle were 41.0, 14.3, and 44.7%, respectively. The ratios of the stem were similar until the P4 position; however, they started to gradually increase from the P4 position to the P11 position. The leaf ratios exhibited similar behavior to that of the stem ratios. Conversely, the ratios of the total panicle (panicle + late-emerging tiller-induced late panicle) decreased under the elevated air temperature, although they reached their highest values near the P1 (AT) position. The weight of the total panicle was just 15.3% at the P15 position. The late-emerging tiller-induced late panicle first appeared at P7 and was caused by heat stress. The ratio of late-emerging tiller-induced late panicle gradually increased under the elevated air temperature.

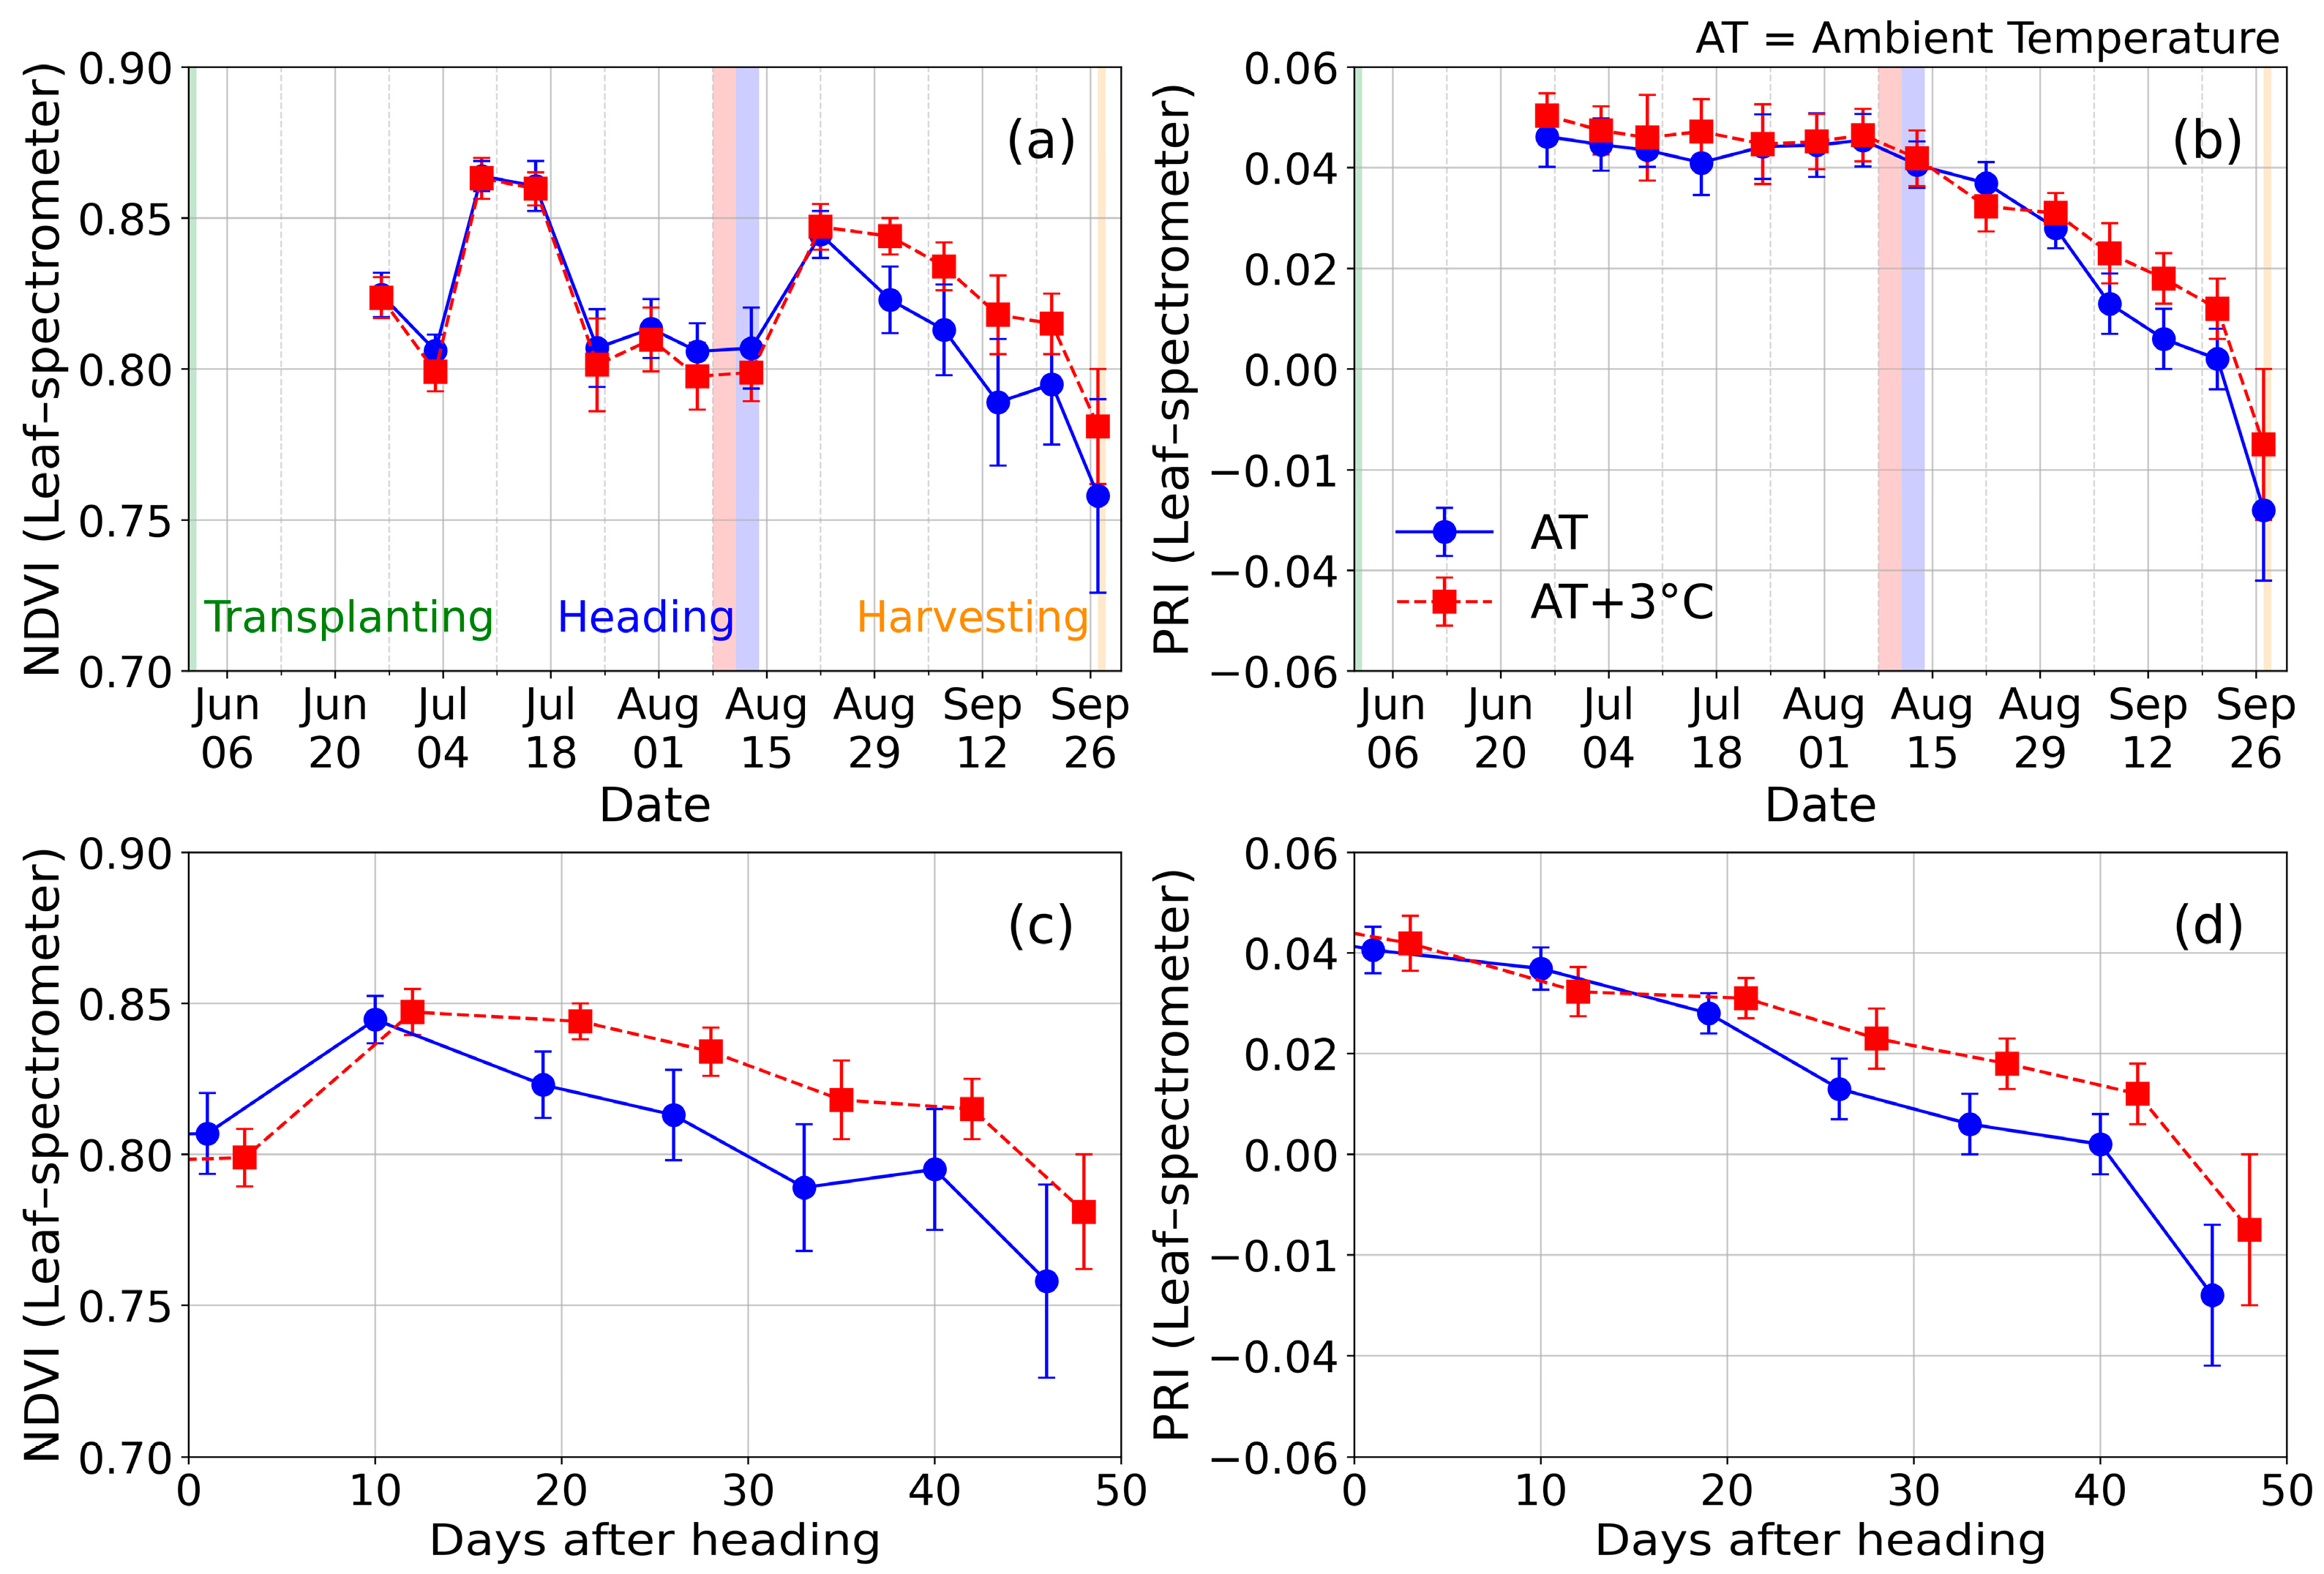
3.2. Time Series of NDVI and PRI at Leaf Scale

Figure 6 depicts the time series of NDVI and PRI at the leaf scale for AT and AT+3 °C. Vegetation indices were measured considering leaf size since 6 July 2018. NDVIs at AT and AT+3 °C were significantly similar until 22 August 2018 and started to differ after 22 August 2018 (Figure 6a). Similar to the NDVIs, the two PRIs at AT and AT+3 °C started to differ after August 31, 2018 (Figure 6b). In this study, the time series of NDVI and PRI were rearranged based on the heading dates at AT and AT+3 °C considering the vegetation indices usually decrease after the heading stage (Figure 6c,d).
The change in spectral reflectance for paddy rice at the leaf scale was analyzed depending on the date after the heading stage. The spectral reflectance, which was measured on 22 August 2018, was set as a standard wavelength. The wavelength from 512 nm to 720 nm exhibited an increasing trend in the ripening phase, while the range from 720 nm to 900 nm was less than the standard wavelength at the AT position (Figure 7a). The maximum variations of spectral reflectance at 531, 570, 670, and 800 nm were +38.51, +57.76, +62.05, and –4.17%, respectively. The increasing trend of spectral reflectance at 570 nm had a higher slope than that at 531 nm; thus, PRI decreased after heading. Conversely, at AT+3 °C, the rate of change of spectral reflectance at PRI and NDVI wavelengths was lower than that at AT (Figure 7b). The maximum changes of spectral reflectance at 531, 570, 670, and 800 nm that are used to calculate PRI and NDVI were +30.43, +43.40, +51.56, and +4.76%, respectively. Although the PRI decreased after the heading stage at both AT and AT+3 °C positions, its decreasing rates were different due to different variations of reflectance at 531 nm and 570 nm. Additionally, the NDVI at AT+3 °C was relatively higher than that at AT because of the NIR value; the change in spectral reflectance at the NIR wavelength was low under heat stress.

3.3. Time Series of NDVI and PRI at Canopy Scale

The time series of NDVI and PRI at the canopy scale during the cultivation period was analyzed (Figure 8). The spectral reflectance at the canopy scale was measured earlier than that at the leaf scale. The NDVI sharply increased after the transplanting stage, and saturated faster at AT+3 °C than at AT (Figure 8a). After the heading stage, a difference in NDVIs among AT, AT+1 °C, AT+2 °C, and AT+3 °C was observed. This was maintained until approximately 40 DAH. NDVI at AT (AT+3 °C) decreased from 0.905 to 0.596 (from 0.924 to 0.912) from 17 August 2018 to 26 September 2018. The change in spectral reflectance after the heading stage was investigated to comprehend the different trends of NDVIs at each position. The standard wavelength on spectral reflectance at the canopy scale was set based on 17 August 2018, the date on which the heading of paddy rice was finished at all positions. The spectral reflectance at 670 nm and 800 nm used for calculating NDVI exhibited the opposite trend after the heading stage (Figure 9a,c). On 10 September 2018, the spectral reflectance at the red wavelength (670 nm) increased to approximately 208.60, 134.81, 16.16, and 11.29% at AT, AT+1 °C, AT+2 °C, and AT+3 °C, respectively, in comparison with the standard wavelength measured on 17 August 2018. Conversely, the NIR reflectance (800 nm) decreased by approximately 4.34, 21.85, and 1.85% at AT, AT+1 °C, and AT+2 °C, respectively, and increased by approximately 7.37% at AT+3 °C. These different changes in spectral reflectance at each position were evident on September 26, 2018, when the spectral reflectance at 670 nm (800 nm) changed to approximately +387.63, +289.51, +98.97, and +10.98% (–4.04, –13.43, –15.42, and –4.15%) at AT, AT+1 °C, AT+2 °C, and AT+3 °C, after the heading stage. The red wavelength at all positions increased, and the increasing slope at AT was higher than that at AT+3°C. The red wavelength at AT+3 °C increased by only +10.98%, and this caused the slight change in NDVI. These differences in the change rate of the red wavelength affected the NDVI.
The PRI increased before the heading stage, and then decreased (Figure 8b). Unlike NDVI, PRI decreased after the heading stage at all positions. However, the degrees of decrease varied depending on the heat stress. PRI at AT was –0.0207 on 17 August 2018, and it decreased to –0.0964 on 26 September 2018. Conversely, PRI at AT+3 °C changed from –0.0072 to –0.0581 for the same period. The decreasing rate of PRI at AT+3 °C was higher than that at AT due to the different decreasing ratios of spectral reflectance after the heading stage. Between 17 August 2018 and 10 September 2018, there was an increase in spectral reflectance at 531 nm (570 nm) of approximately 73.63%, 32.34%, 5.96%, and 9.61% (93.97%, 47.32%, 11.70%, and 15.22%) at AT, AT+1 °C, AT+2 °C, and AT+3 °C, respectively (Figure 9b,d). The change ratio at 570 nm was larger than that at 531 nm. Thus, the PRI at the canopy scale decreased after the heading stage, similar to results in leaf scale. The decreasing trends at all positions were maintained until the harvesting. On 26 September 2018, the spectral reflectance at 531 nm (570 nm) increased approximately 115.11%, 89.91%, 23.51%, and 8.54% (153.33%, 122.02%, 41.13%, and 20.29%) at the four positions, respectively. The relatively larger increase in the spectral reflectance at 570 nm than at 531 nm led to the continuous decrease of PRI.

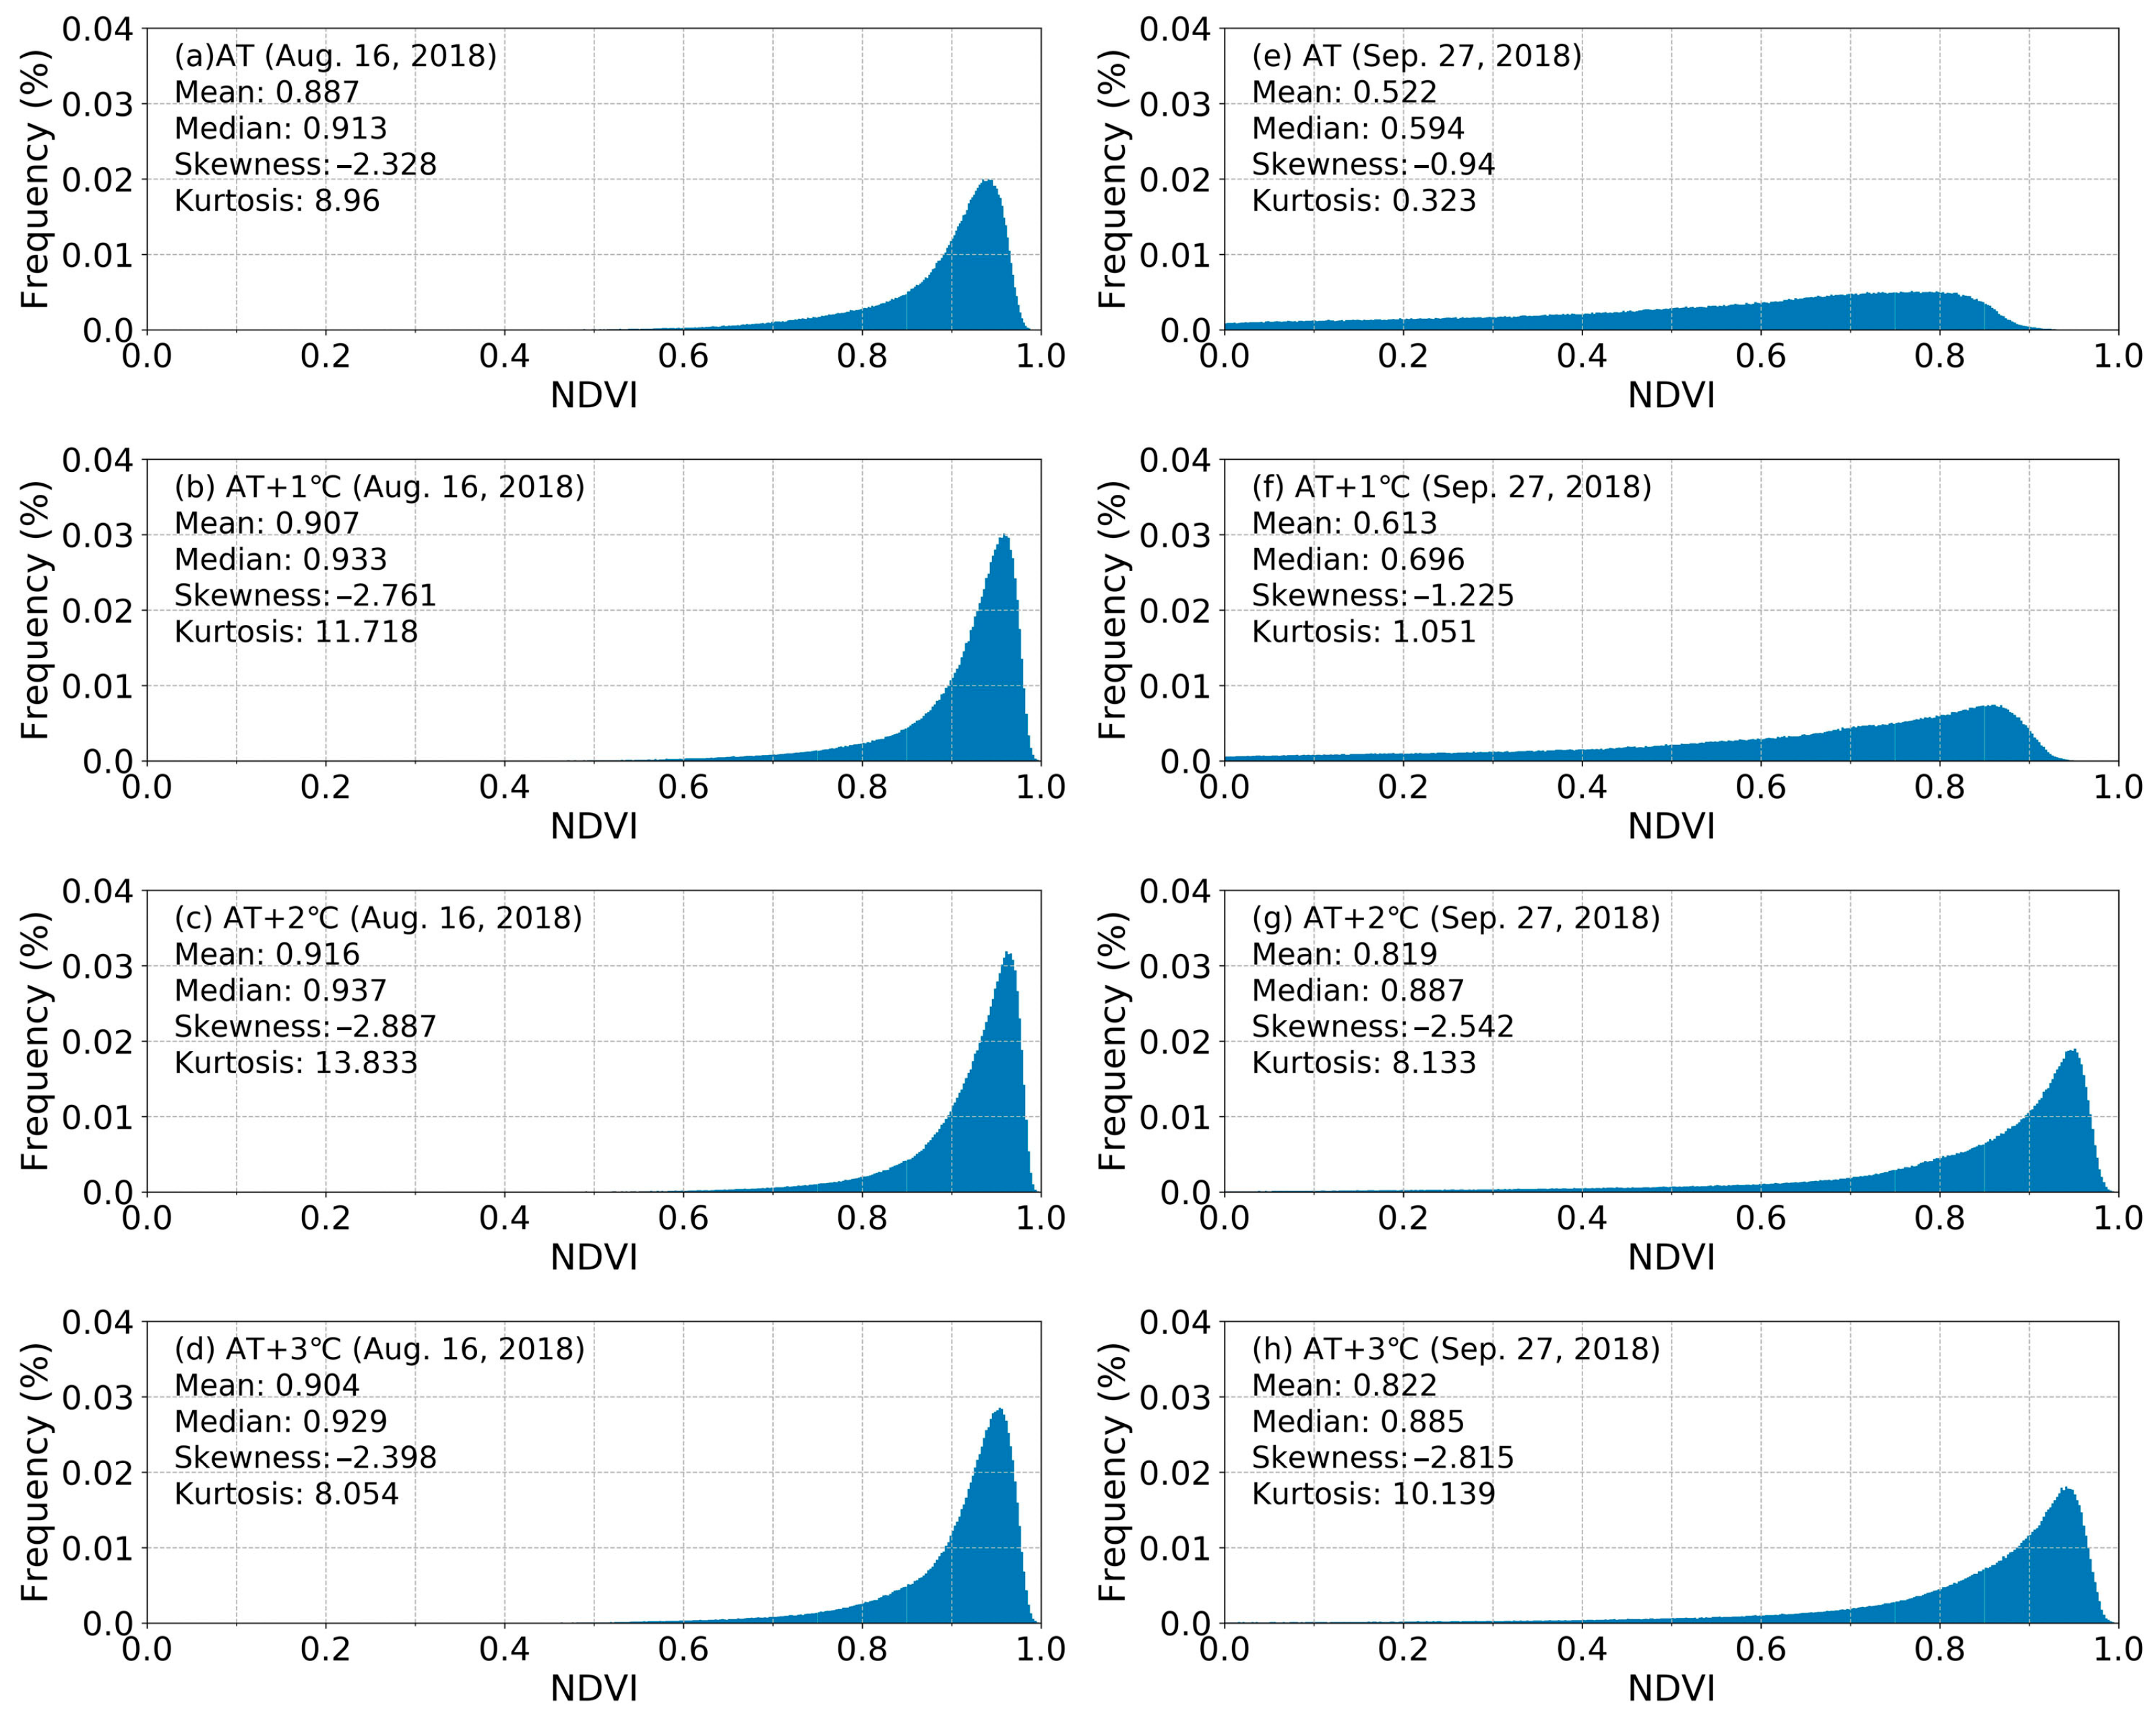
3.4. NDVI Captured by a Multi-Spectral Camera

Spectral reflectance of vegetable pixels captured by the multi-spectral camera was evaluated depending on the degree of heat stress (Figure 10 and Figure 11). In the heading stage, the NDVIs almost reached the maximum value at each position. The mean values on 16 August 2018 were 0.887, 0.907, 0.916, and 0.904 at AT, AT+1 °C, AT+2 °C, and AT+3 °C, respectively (Figure 10). Most of the pixels on vegetation exhibited high NDVI values, and NDVI for the panicle was relatively lower than that for the leaf and stem. However, the NDVI images captured on 27 September 2018 varied depending on the positions. The mean value of NDVI was 0.522 at AT and 0.613 at AT+1 °C. Although the NDVI decreased at AT+2 °C and AT+3 °C, the decreasing slope of the mean value of NDVI was lower than those at AT and AT+1 °C. The panicle NDVI was below 0.5 at AT, whereas it was relatively high at AT+3 °C. Additionally, the leaf senescence started at the end of the leaf at AT+3 °C. These results were similar to the results found at the leaf and canopy scales.

3.5. Characteristics of NDVI and PRI after the Heading Stage

Changes in vegetation indices after the heading stage varied depending on the degree of heat stress. To effectively quantify the variation in vegetation indices, a relative change in the vegetation index was calculated using values measured at the heading date and 40 days after heading, and the minimum value that was set was 0 in NDVI and 0.425 in sPRI in this study. Figure 12 depicts the relationship between rNDVI and rsPRI after the heading stage depending on the degree of heat stress. rNDVI and rsPRI exhibited values close to 1.0 immediately after the heading stage, and then decreased at all positions. At the P1 position (AT), a decrease of approximately 34.21% and 60.62% in rNDVI and rsPRI, respectively, was observed under an ambient meteorological environment, with a ripening ratio of 89%. However, the decreasing degrees of rNDVI and rsPRI under the elevated air temperature were lower than that at P1 (AT); The rNDVI (rsPRI) decreased by approximately 23.94, 16.22, 7.16, and 1.1% (52.03, 47.26, 39.5, and 34.98%) in P5, P7, P9, and P15, respectively. The slope between two the vegetation indices measured at the heading stage and approximately 40 days after heading (hereafter (1−rsPRI)/(1−rNDVI)) was found to vary depending on the ripening ratio of paddy rice (Figure 12).

3.6. Estimation of Ripening Ratio of Paddy Rice

NDVI and PRI decreased differently depending on the degree of heat stress after the heading stage. Additionally, the (1−rsPRI)/(1−rNDVI) measured at the heading date and 40 days after heading were different. In this study, the ripening ratio of paddy rice was estimated using the mean air temperature for 40 days after heading, (1−rsPRI)/(1−rNDVI), rNDVI, and rsPRI (Figure 13). The ripening ratio demonstrated a sigmoid relationship with the mean air temperature for 40 days after heading (Figure 13a). The coefficient of determination (R-square) was 0.961 and the RMSE was 7.18%. This method was effective in estimating the ripening ratio caused by spikelet sterility; however, it had a limitation in that it was unable to express the ripening ratio spatially in a wide. Although the (1−rsPRI)/(1−rNDVI) had a high R-square (0.922) and low RMSE (10.162%) with the ripening ratio, this method was not effective for low ripening ratios because the minimum estimated value using the (1−rsPRI)/(1−rNDVI) was approximately 8.066% (Figure 13b). Conversely, among the three methods used to estimate the vegetation index, the rNDVI exhibited the best performance to estimate the ripening ratio caused by spikelet sterility, with an R-square of 0.954 and an RMSE value of 7.820%. Furthermore, rNDVI had the advantage of being able to estimate the ripening value until 1.628%, which was lower than the minimum value of the (1−rsPRI)/(1−rNDVI) method (Figure 13c). As seen with (1−rsPRI)/(1−rNDVI) and rNDVI, the rsPRI exhibited a sigmoid trend (R-square: 0.943; RMSE: 8.64%) with the ripening ratio (Figure 13d). This trend line reached zero when rsPRI was approximately 0.7835, and the minimum value of this equation was set to zero. The equations for the four methods using air temperature, (1−rsPRI)/(1−rNDVI), rNDVI, and rsPRI are summarized in Table 2.

4. Discussion

The growth and development of paddy rice under the global warming conditions were faster than those of paddy rice under the ambient meteorological conditions. The heading stage appeared for a maximum of 4–5 days earlier than in the previous studies [9,50,51]. Vegetative and reproductive growth periods were shortened from 3.81 days in early rice cultivars to 5.31 days in late rice cultivars [51].
The panicle weight cultivated at AT+2 °C to AT+3 °C in 2018 was approximately 10% compared to that cultivated at AT. However, the weight excluding the husk of paddy rice (white-polished rice) was near zero due to the ripening ratio. In this study, the major reason why the ripening ratio of paddy rice was low was because of the high spikelet sterility at heading stage of paddy rice under the extremely high air temperature [52]. The determinant of the coefficient between the ripening ratio and spikelet sterility was 0.995 in 2018 and 0.997 in 2019. The late-emerging tiller-induced late panicle appeared at the positions at which the ripening ratio of paddy rice decreased because the translocation of assimilation products from the leaf sheath to panicle did not take place. Accordingly, the ratio of late-emerging tiller-induced late panicle at the position exposed to the extremely high air temperature was higher.
The panicle ratio started to significantly decrease at AT+0.91 °C, and the late-emerging tiller-induced late panicle appeared at AT+1.17 °C; this behavior indicates that the crop damage caused by heatwaves may occur over South Korea in the near future. Additionally, the fertility percentage of spikelets of paddy rice may be relatively low under the water deficits caused by drought [53,54]. This is because the leaf temperature increases [55] when the evaporation of paddy rice does not actively conduct due to the water deficit.
The low ripening ratio of paddy rice caused by heatwaves was estimated using the relative change in the vegetation index from the heading stage to 40 days after the heading stage; the relative vegetation index was found to have a significant relationship with the ripening ratio of paddy rice (Figure 13). The different responses of the vegetation index after the heading stage were evaluated at the leaf and canopy scales. After the heading stage, the NDVI at the leaf scale decreased at AT and AT+3 °C; however, the decreased degrees were different due to the chlorophyll content. At the leaf scale, the change in reflectance at the NIR wavelength (800 nm) after the heading stage was minimal. Conversely, the reflectance at the red wavelength (670 nm), which is related to the chlorophyll content [56], increased after the heading stage due to the decrease in the leaf chlorophyll content [57]. At the canopy scale, NDVIs at AT+2 °C and AT+3 °C maintained constant values because the change in reflectance at the red wavelength was minimal. These results at the leaf and canopy scales indicate that the reason why NDVIs vary depending on the damage degree of heat stress is the difference in the chlorophyll content.
The change degree of reflectance at the red wavelength at the canopy scale was larger than that at other wavelengths; however, the changing trend at the leaf scale was different from that at the canopy scale. The changing degree at the red wavelength (670 nm) at the leaf scale was lower than that at 550 nm and 690 nm (Figure 7) because the footprint of the optical measurements at the leaf scale was all vegetation. Data at the leaf scale seems to have been more affected by the ratio of relatively high chlorophyll content than that at the canopy scale. Conversely, the effect of radiation on the panicle, as well as the leaf and stem, was reflected at the canopy scale. The reflectance at the red wavelength in the panicle was relatively higher than that in the leaf and stem [58], and the NDVI for the panicle was relatively lower than that for the leaf and stem (Figure 11). The change in reflectance at the red wavelength at the canopy scale occurred not only because of the change in pigments in the leaf but also due to the structural change of paddy rice such as the emergence of the panicle that has a relatively high red wavelength (Figure 5 and Figure 7). Thus, the change in reflectance at the red wavelength at the canopy scale was larger than that at the leaf scale.
The reflectance at visible wavelength increased after the heading stage, unlike at the NIR wavelength; thus, the vegetation index estimated using a visible wavelength, such as PRI, changed at all positions after the heading stage. Because the chlorophyll decreased faster than the carotenoid under the normal condition after the heading stage due to the leaf senescence [59], the reflectance at 570 nm was relatively higher than that at 531 nm at the leaf and canopy scales. After the heading stage, PRI at AT decreased faster than that at AT+3 °C, and this phenomenon is related to the leaf senescence.
Assimilation products were saved in the stems before the heading/flowering stages, including the leaf sheaths and culms, which were translocated from the stems to the panicle of paddy rice after the heading/flowering stages [60]. Approximately 30% of the panicle was filled from the assimilation products saved in stems (leaf sheath and culms) before the heading/flowering stages [61], and approximately 70% of the panicle was filled from photosynthesis after the heading/flowering stages. Most of the photosynthesis was conducted in the upper leaves [62]. However, spikelet sterility appeared under extremely high air temperatures at the heading/flowering stages [18,50] because the pollen germination, pollen activity, and floret fertility of paddy rice decreased under high air temperatures [43]. The translocation of the assimilation products from the stems (leaf sheath and culms) to the panicle did not occur due to spikelet sterility. Thus, the paddy rice exposed to heat stress maintained a high chlorophyll content until the appearance of the late-emerging tiller-induced late panicle. The vegetation index represented the conditions of paddy rice caused by the different spikelet sterilities, and the ripening ratio of paddy rice could be estimated using the changing trend of the vegetation index after the heading stage.

5. Conclusions

The grain yield of paddy rice decreased under the extremely high air temperature due to the low ripening ratio induced by spikelet sterility. The ripening ratio was estimated using the NDVI and PRI vegetation indices. The major conclusions are summarized as follows:
(1)
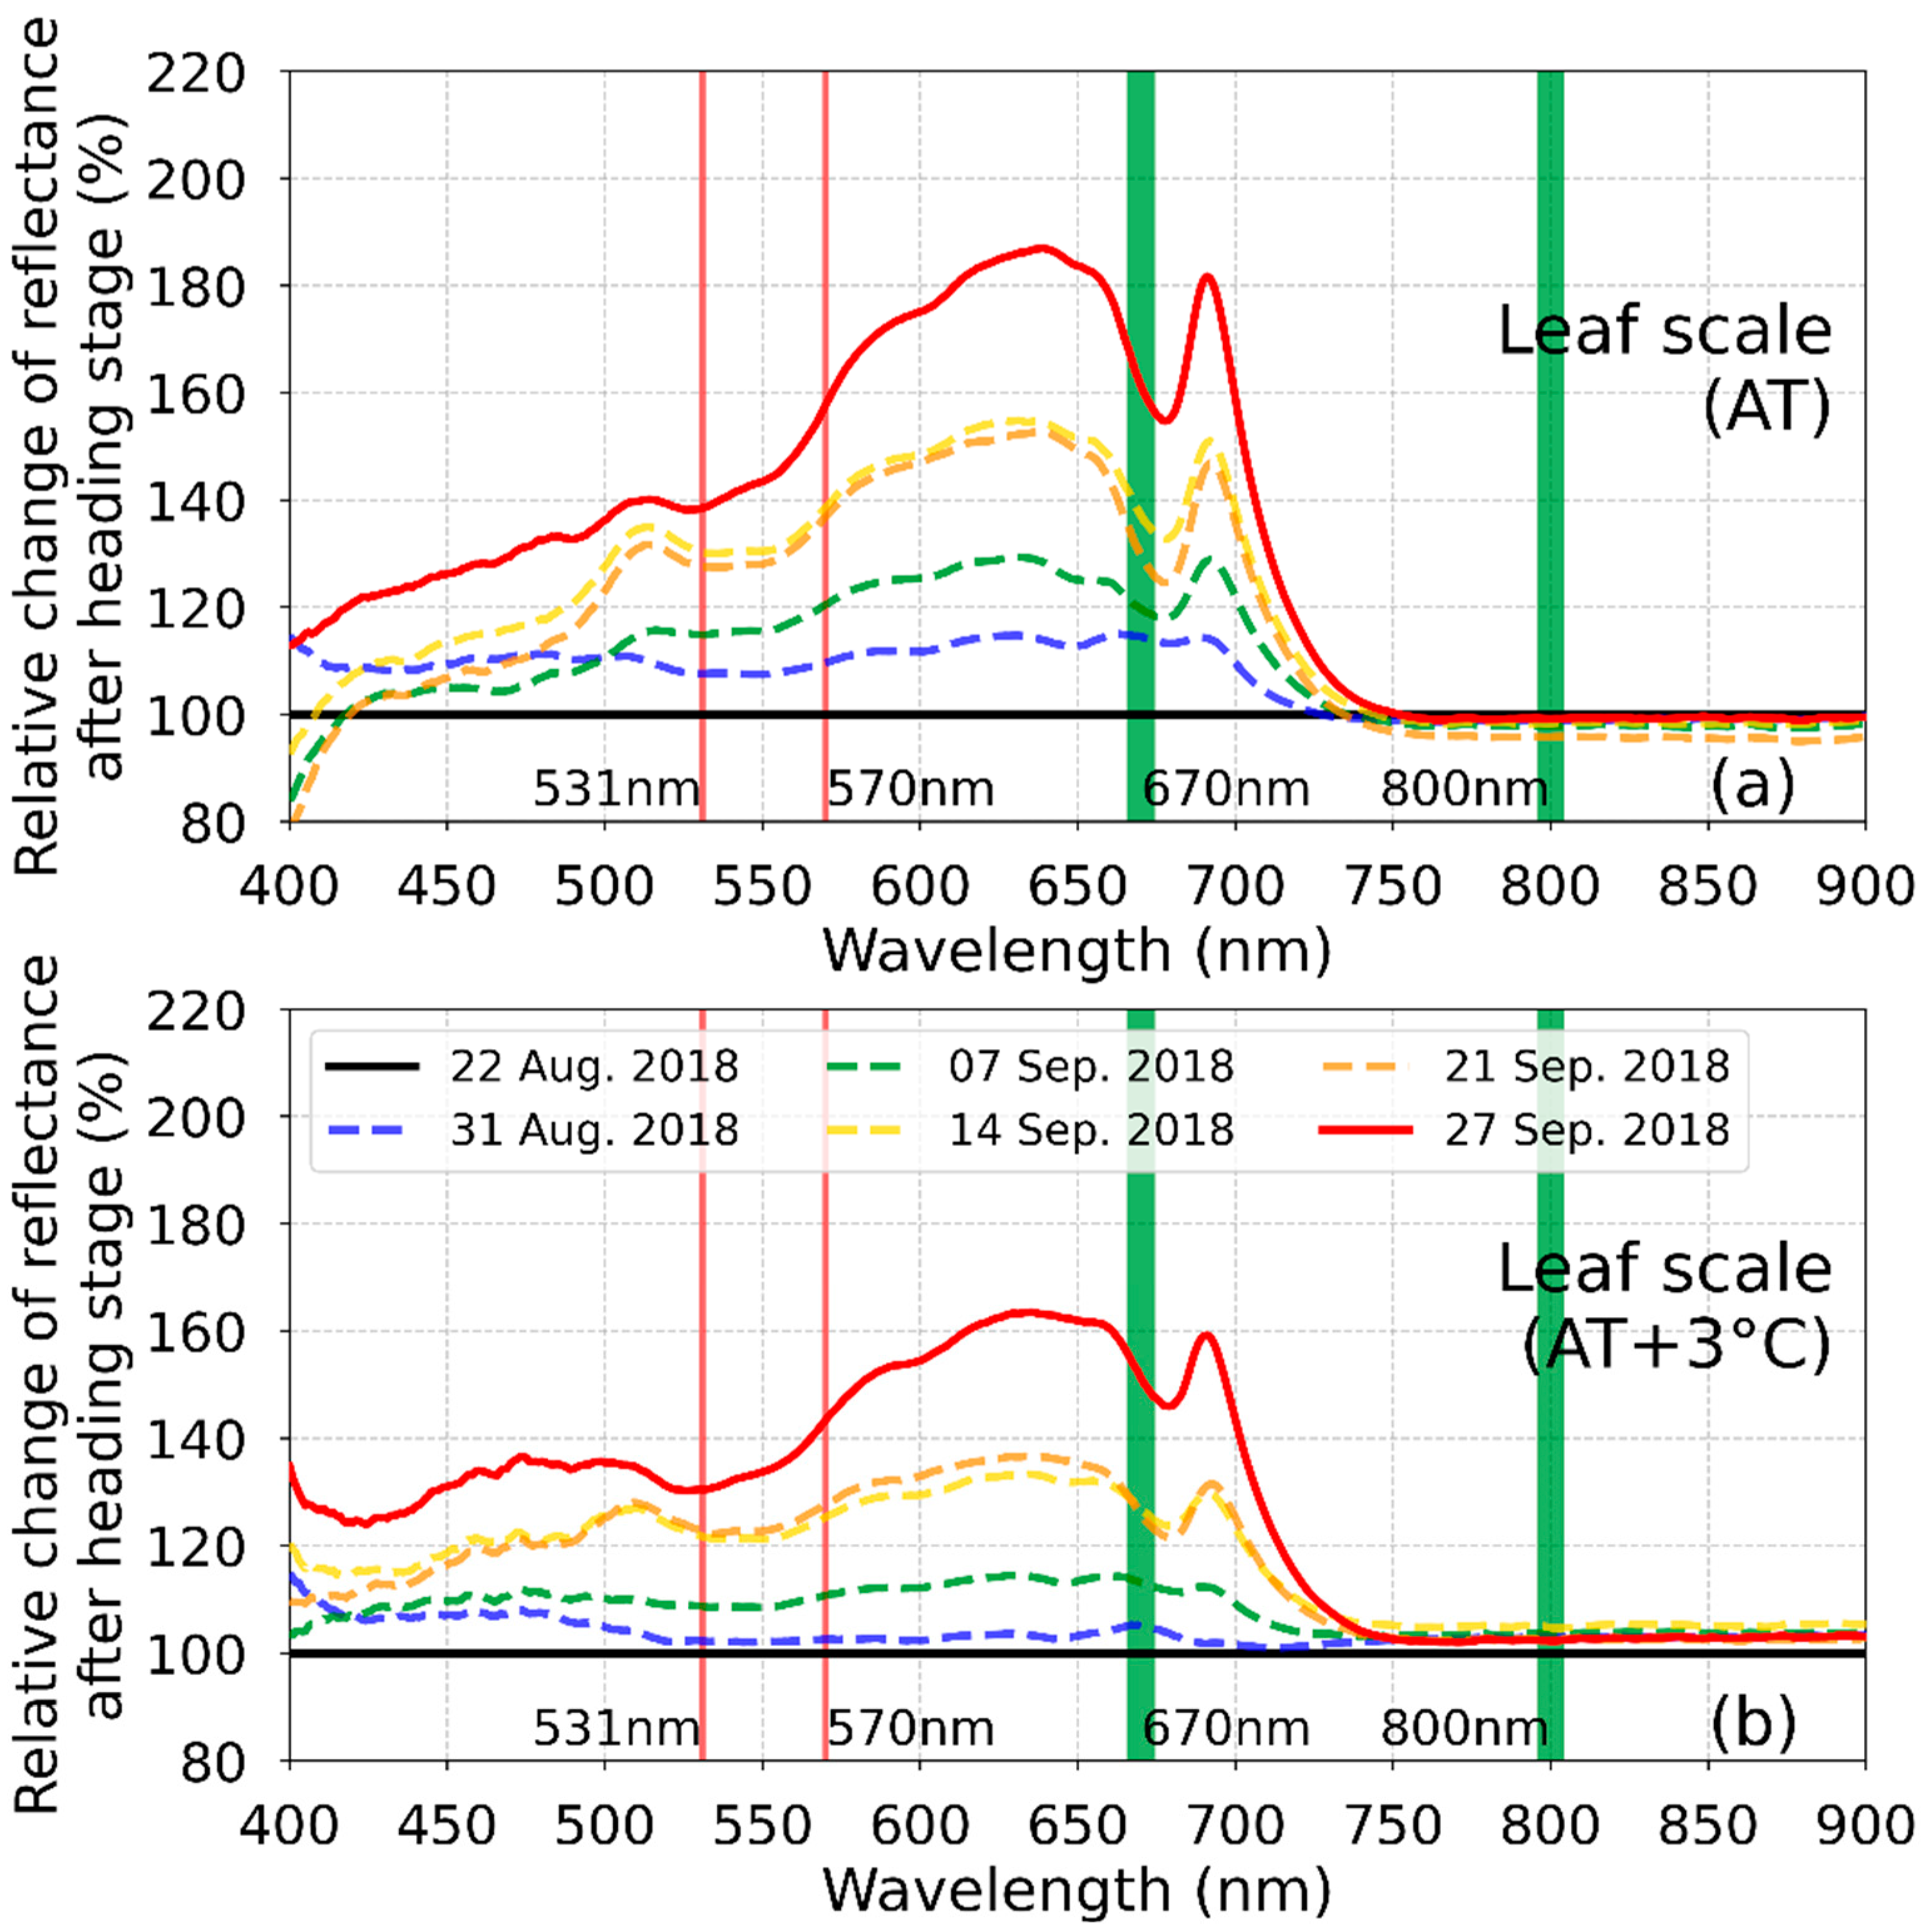
The changing trend of the vegetation indices are dependent on the degree of heat stress after the heading stage at the leaf and canopy scales. Vegetation indices of NDVI and PRI decrease under normal conditions after the heading stage due to leaf senescence; however, the decreased degree of vegetation indices is minimal under extremely high air temperatures.
(2)
The spectral reflectance at the red wavelength causes different NDVI trends after the heading stage. The changing degree of the spectral reflectance at the red wavelength at the positions exposed to the heatwave is lower than that under normal conditions.
(3)
The PRI, which uses visible wavelengths, decreases after the heading stage regardless of the damage of heat stress. However, the decreasing degree at AT+3 °C is lower than that at AT, similar to the NDVI.
(4)
The low spectral reflectance value at the red wavelength indicates that paddy rice maintains a high chlorophyll content, as the translocation of assimilates from the stems (leaf sheath and culms) to the panicle does not occur due to spikelet sterility.
(5)
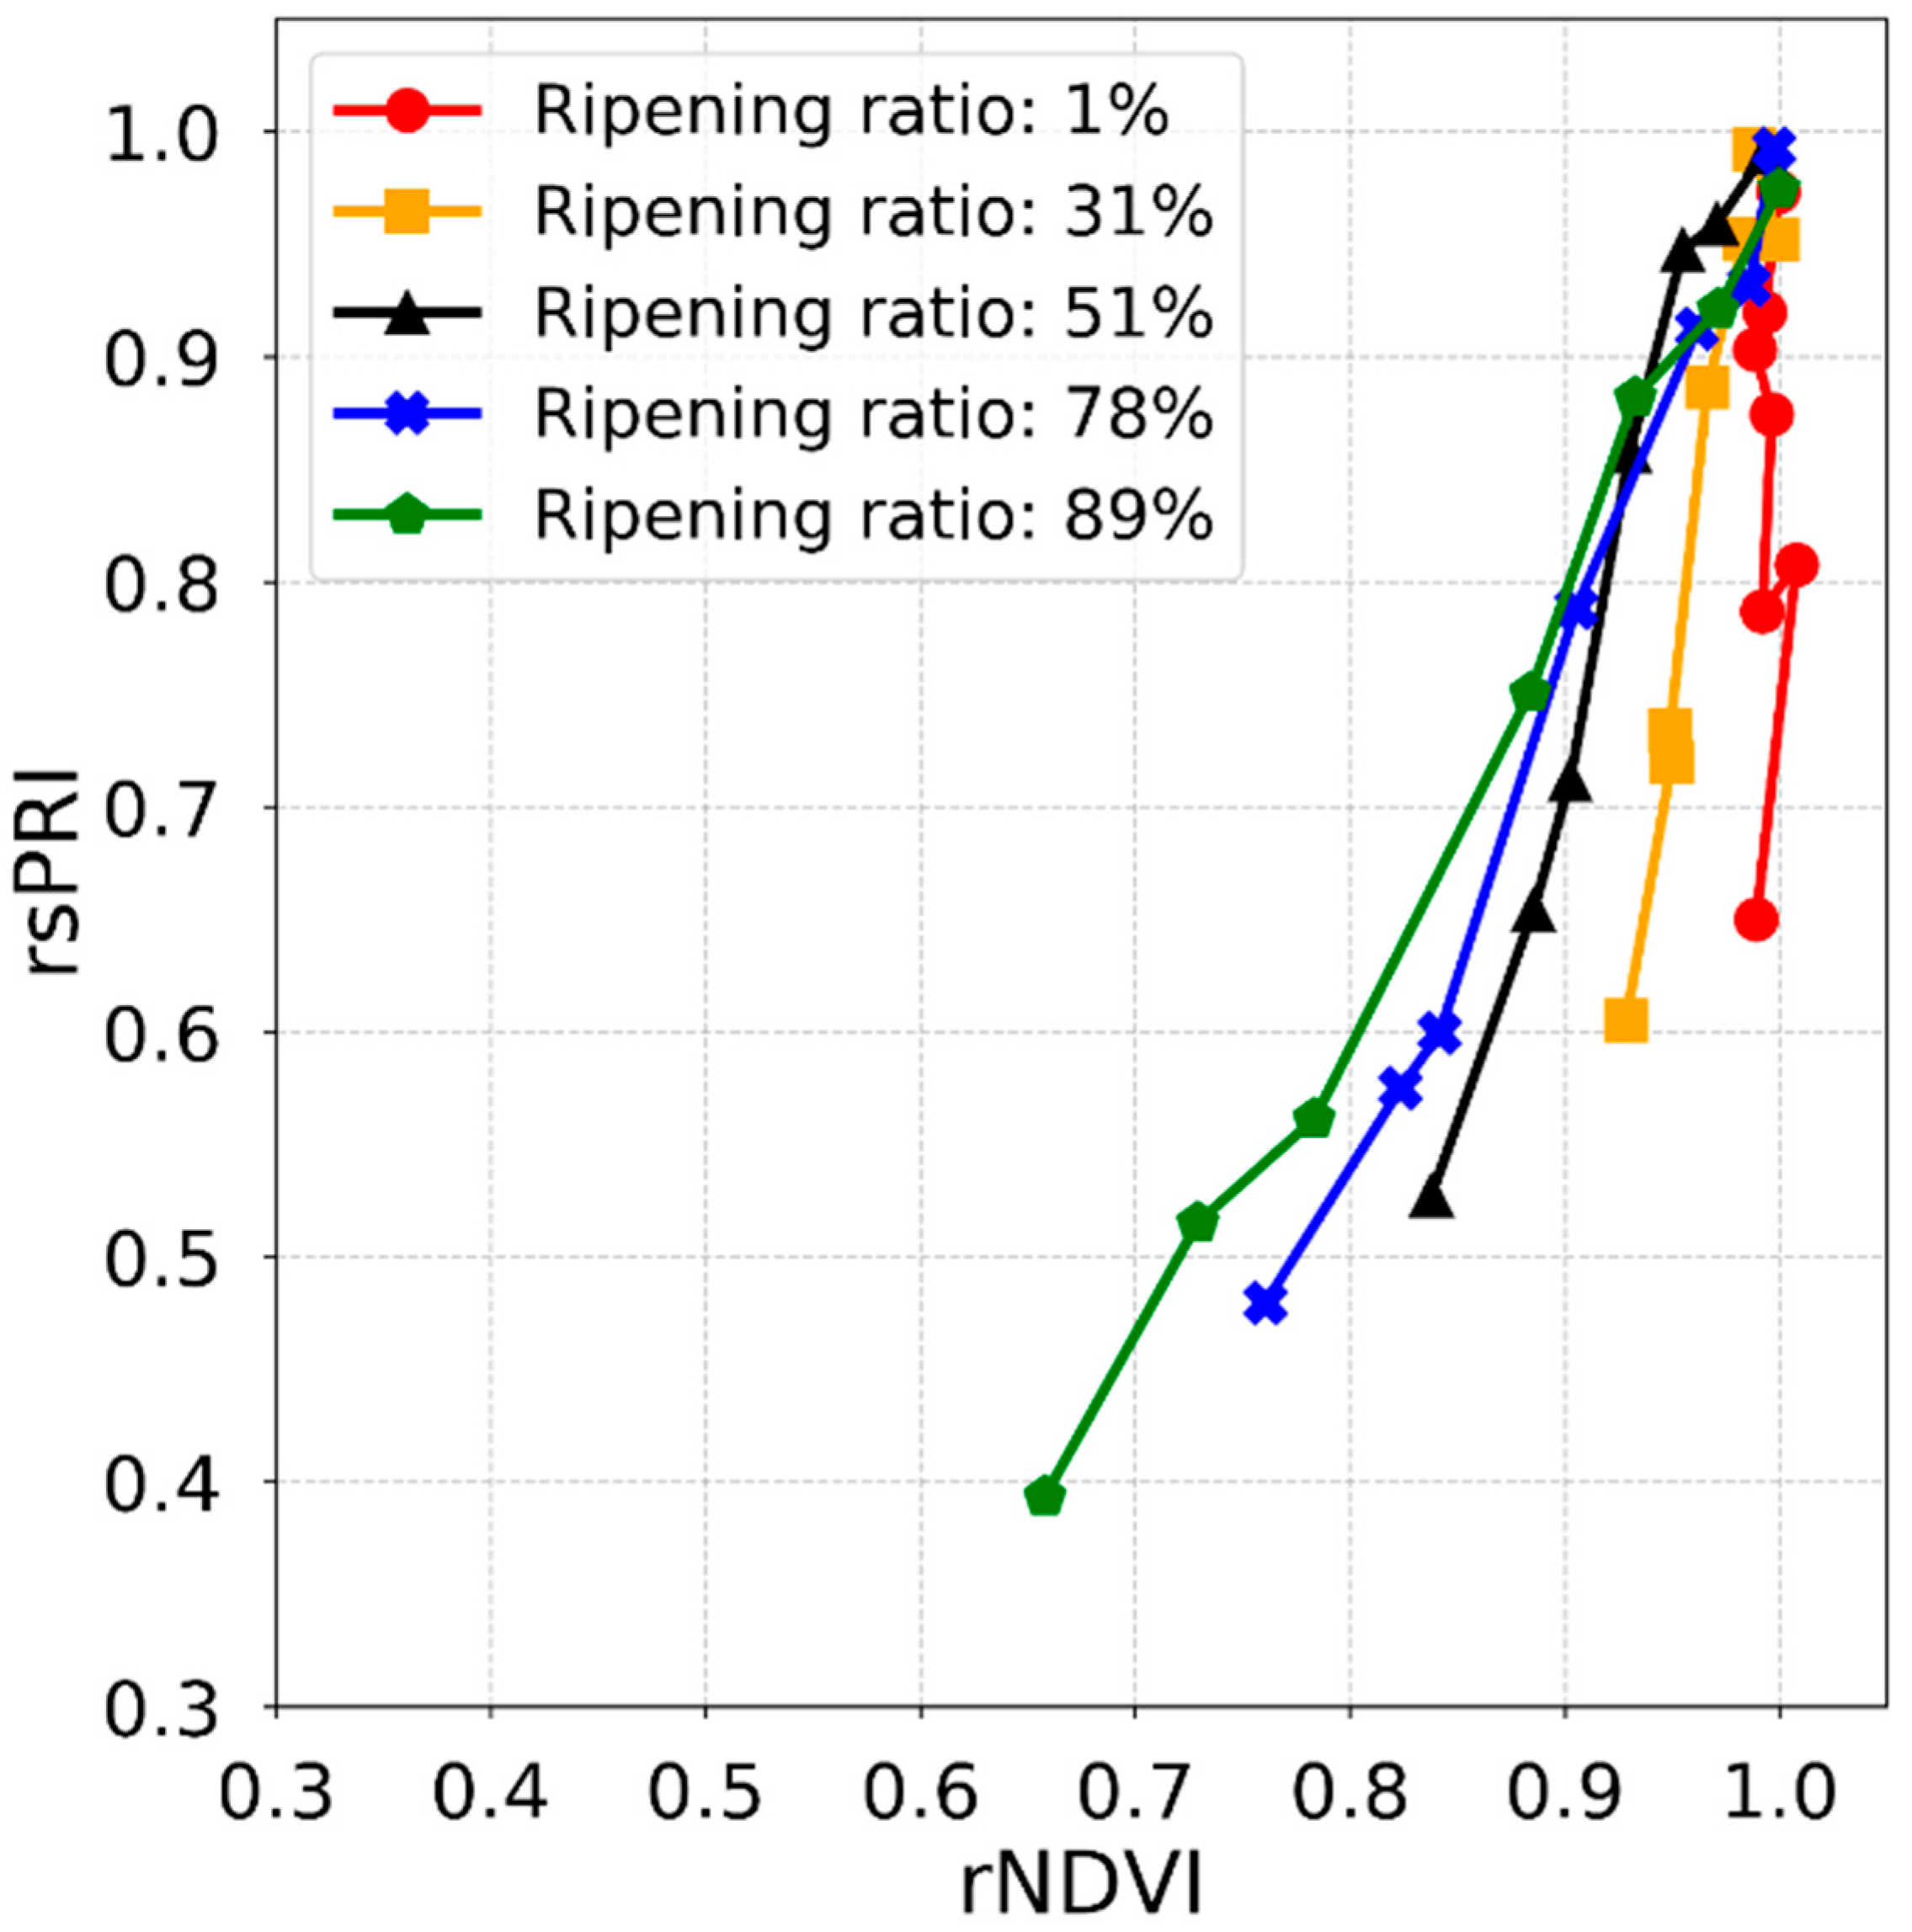
The vegetation index reflects the conditions of paddy rice caused by heat stress, and the relative change in the vegetation index after the heading stage exhibits a significant sigmoid relation with the ripening ratio affected by the spikelet sterility of paddy rice.
The grain yield for paddy rice decreases due to the low ripening ratio, although physical damage does not occur under the extremely high air temperature. It is possible to estimate the ripening ratio of paddy rice using the trend of the vegetation index after the heading stage. The high vegetation index value before the heading stage can have positive effects, such as the rapid growth and development of the crop; however, after the heading stage, it might be negative feedback, such as the low ripening ratio induced by heat stress. These results can aid in understanding the meaning of a high vegetation index value for the ripening stage of paddy rice and assessing the crop damage induced by heat stress. To apply to practical use in the field, it needs to evaluate the characteristics depending on the cultivar of paddy rice in further study.

Author Contributions

Conceptualization, J.-H.R., D.O. and J.C.; methodology, J.-H.R., D.O. and J.C.; software, J.-H.R.; formal analysis, J.-H.R., D.O. and J.C.; writing—original draft preparation, J.-H.R., D.O. and J.C.; writing—review and editing, J.-H.R., D.O., J.K., H.-Y.K., J.-M.Y. and J.C. All authors have read and agreed to the published version of the manuscript.

Funding

This work was supported by Basic Science Research Program through the National Research Foundation of Korea (NRF) funded by the Ministry of Education (NRF-2016R1D1A1B03933218).

Acknowledgments

The authors would like to thank the editors and the anonymous reviewers for their helpful comments.

Conflicts of Interest

The authors declare no conflict of interest.

References

  1. Horie, T. Global warming and rice production in Asia: Modeling, impact prediction and adaptation. Proc. Jpn. Acad. Ser. B Phys. Biol. Sci. 2019, 95, 211–245. [Google Scholar] [CrossRef] [Green Version]
  2. Horie, T.; Nakagawa, H.; Nakano, J.; Hamotani, K.; Kim, H.Y. Temperature gradient chambers for research on global environment change. III. A system designed for rice in Kyoto, Japan. Plant Cell Environ. 1995, 18, 1064–1069. [Google Scholar] [CrossRef]
  3. Kim, H.Y.; Horie, T.; Nakagawa, H.; Wada, K. Effects of elevated CO2 concentration and high temperature on growth and yield of rice: II. The effect on yield and its components of Akihikari rice. Jpn. J. Crop. Sci. 1996, 65, 644–651. [Google Scholar] [CrossRef] [Green Version]
  4. Oh-e, I.; Saitoh, K.; Kuroda, T. Effects of high temperature on growth, yield and dry-matter production of rice grown in the paddy field. Plant Prod. Sci. 2007, 10, 412–422. [Google Scholar] [CrossRef]
  5. Prasad, P.V.V.; Boote, K.J.; Alle, L.H., Jr.; Sheehy, J.E.; Thomas, J.M.G. Species, ecotype and cultivar differences in spikelet fertility and harvest index of rice in response to high temperature stress. Field Crops Res. 2006, 95, 398–411. [Google Scholar] [CrossRef]
  6. You, L.; Rosegrant, M.W.; Wood, S.; Sun, D. Impact of growing season temperature on wheat productivity in China. Agric. For. Meteorol. 2009, 149, 1009–1014. [Google Scholar] [CrossRef]
  7. Tian, Y.; Chen, J.; Chen, C.; Deng, A.; Song, Z.; Zheng, C.; Hoodgmoed, W.; Zhang, W. Warming impacts on winter wheat phenophase and grain yield under field conditions in Yangtze Delta Plain, China. Field Crops Res. 2012, 134, 193–199. [Google Scholar] [CrossRef]
  8. Ainsworth, E.A.; Long, S.P. 30 years of free-air carbon dioxide enrichment (FACE): What have we learned about future crop productivity and its potential for adaptation? Glob. Change Biol. 2020, 27, 27–49. [Google Scholar] [CrossRef]
  9. Kobayasi, K.; Sakai, H.; Tokida, T.; Nakamura, H.; Usui, Y.; Yoshimoto, M.; Hasegawa, T. Effects of free-air CO2 enrichment on flower opening time in rice. Plant Prod. Sci. 2019, 22, 367–373. [Google Scholar] [CrossRef] [Green Version]
  10. McLeod, A.R.; Long, S.P. Free-air carbon dioxide enrichment (FACE) in global change research: A review. Adv. Ecol. Res. 1999, 28, 1–56. [Google Scholar] [CrossRef]
  11. Usui, Y.; Sakai, H.; Tokida, T.; Nakamura, H.; Nakagawa, H.; Hasegawa, T. Rice grain yield and quality responses to free-air CO2 enrichment combined with soil and water warming. Glob. Change Biol. 2016, 22, 1256–1270. [Google Scholar] [CrossRef] [PubMed]
  12. Zhao, C.; Liu, B.; Piao, S.; Wang, X.; Lobell, D.B.; Huang, Y.; Huang, M.; Yao, Y.; Bassu, S.; Ciais, P.; et al. Temperature increase reduces global yields of major crops in four independent estimates. Proc. Natl. Acad. Sci. USA 2017, 114, 9326–9331. [Google Scholar] [CrossRef] [PubMed] [Green Version]
  13. Yang, X.; Chen, F.; Lin, X.; Liu, Z.; Zhang, H.; Zhao, J.; Li, K.; Ye, Q.; Li, Y.; Lv, S.; et al. Potential benefits of climate change for crop productivity in China. Agric. For. Meteorol. 2015, 208, 76–84. [Google Scholar] [CrossRef]
  14. Long, S.P.; Ort, D.R. More than taking the heat: Crops and global change. Curr. Opin Plant. Biol. 2010, 13, 240–247. [Google Scholar] [CrossRef] [PubMed]
  15. Yamori, W.; Hikosaka, K.; Way, D.A. Temperature response of photosynthesis in C 3, C 4, and CAM plants: Temperature acclimation and temperature adaptation. Photosynth. Res. 2014, 119, 101–117. [Google Scholar] [CrossRef]
  16. Wu, C.; Tang, S.; Li, G.; Wang, S.; Fahad, S.; Ding, Y. Response of phytohormone homeostasis to heat stress and the roles of phytohormones in rice grain yield: A review. PeerJ Prepr. 2019, 7, e27843v1. [Google Scholar] [CrossRef]
  17. Ryu, J.H.; Jeong, H.; Cho, J. Performances of Vegetation Indices on Paddy Rice at Elevated Air Temperature, Heat Stress, and Herbicide Damage. Remote Sens. 2020, 12, 2654. [Google Scholar] [CrossRef]
  18. Matsui, T.; Namuco, O.S.; Ziska, L.H.; Horie, T. Effects of high temperature and CO2 concentration on spikelet sterility in indica rice. Field Crops Res. 1997, 51, 213–219. [Google Scholar] [CrossRef]
  19. Matsui, T.; Omasa, K.; Horie, T. The Difference in sterility due to high temperatures during the flowering period among japonica-rice varieties. Plant Prod. Sci. 2001, 4, 90–93. [Google Scholar] [CrossRef]
  20. Maruyama, A.; Weerakoon, W.M.W.; Wakiyama, Y.; Ohba, K. Effects of increasing temperatures on spikelet fertility in different rice cultivars based on temperature gradient chamber experiments. J. Agron. Crop. Sci. 2013, 199, 416–423. [Google Scholar] [CrossRef]
  21. Lai, Y.J.; Li, C.F.; Lin, P.H.; Wey, T.H.; Chang, C.S. Comparison of MODIS land surface temperature and ground-based observed air temperature in complex topography. Int. J. Remote Sens. 2012, 33, 7685–7702. [Google Scholar] [CrossRef]
  22. Yan, H.; Zhang, J.; Hou, Y.; He, Y. Estimation of air temperature from MODIS data in east China. Int. J. Remote Sen. 2009, 30, 6261–6275. [Google Scholar] [CrossRef]
  23. Ryu, J.H.; Han, K.S.; Cho, J.; Lee, C.S.; Yoon, H.J.; Yeom, J.M.; Ou, M.L. Estimating midday near-surface air temperature by weighted consideration of surface and atmospheric moisture conditions using COMS and SPOT satellite data. Int. J. Remote Sens. 2015, 36, 3503–3518. [Google Scholar] [CrossRef]
  24. Lu, J.; Miao, Y.; Huang, Y.; Shi, W.; Hu, X.; Wang, X.; Wan, J. Evaluating an unmanned aerial vehicle-based remote sensing system for estimation of rice nitrogen status. In Proceedings of the 2015 Fourth International Conference on Agro-Geoinformatics (Agro-Geoinformatics), Istanbul, Turkey, 20–24 July 2015; IEEE: Piscataway, NJ, USA, 2015; pp. 198–203. [Google Scholar] [CrossRef]
  25. Satir, O.; Berberoglu, S. Crop yield prediction under soil salinity using satellite derived vegetation indices. Field Crops Res. 2016, 192, 134–143. [Google Scholar] [CrossRef]
  26. Gao, B.C. NDWI—A normalized difference water index for remote sensing of vegetation liquid water from space. Remote Sens. Environ. 1996, 58, 257–266. [Google Scholar] [CrossRef]
  27. Gitelson, A.A.; Zur, Y.; Chivkunova, O.B.; Merzlyak, M.N. Assessing carotenoid content in plant leaves with reflectance spectroscopy. Photochem. Photobiol. 2002, 75, 272–281. [Google Scholar] [CrossRef]
  28. Haboudane, D.; Miller, J.R.; Pattey, E.; Zarco-Tejada, P.J.; Strachan, I.B. Hyperspectral vegetation indices and novel algorithms for predicting green LAI of crop canopies: Modeling and validation in the context of precision agriculture. Remote Sens. Environ. 2004, 90, 337–352. [Google Scholar] [CrossRef]
  29. Kim, M.S.; Daughtry, C.S.T.; Chappelle, E.W.; McMurtrey, J.E.; Walthall, C.L. The use of high spectral resolution bands for estimating absorbed photosynthetically active radiation (Apar). In Proceedings of the 6th Symposium on Physical Measurements and Signatures in Remote Sensing, Val D’Isere, France, 17–21 January 1994. [Google Scholar]
  30. Verhulst, N.; Govaerts, B.; Nelissen, V.; Sayre, K.D.; Crossa, J.; Raes, D.; Deckers, J. The effect of tillage, crop rotation and residue management on maize and wheat growth and development evaluated with an optical sensor. Field Crops Res. 2011, 120, 58–67. [Google Scholar] [CrossRef]
  31. Hmimina, G.; Dufrêne, E.; Pontailler, J.Y.; Delpierre, N.; Aubinet, M.; Caquet, B.; de Grandcourt, A.; Burban, B.; Flechard, C.; Granier, A.; et al. Evaluation of the potential of MODIS satellite data to predict vegetation phenology in different biomes: An investigation using ground-based NDVI measurements. Remote Sens. Environ. 2013, 132, 145–158. [Google Scholar] [CrossRef]
  32. Wu, C.; Peng, D.; Soudani, K.; Siebicke, L.; Gough, C.M.; Arain, M.A.; Bohrer, G.; Lafleur, P.M.; Peichl, M.; Gonsamo, A.; et al. Land surface phenology derived from normalized difference vegetation index (NDVI) at global FLUXNET sites. Agric. For. Meteorol. 2017, 233, 171–182. [Google Scholar] [CrossRef]
  33. Jeong, S.-J.; Ho, C.-H.; Gim, H.-J.; Brown, M.E. Phenology shifts at start vs. end of growing season in temperate vegetation over the Northern Hemisphere for the period 1982–2008. Glob. Change Biol. 2011, 17, 2385–2399. [Google Scholar] [CrossRef]
  34. He, M.; Kimball, J.S.; Running, S.; Ballantyne, A.; Guan, K.; Huemmrich, F. Satellite detection of soil moisture related water stress impacts on ecosystem productivity using the MODIS-based photochemical reflectance index. Remote Sens. Environ. 2016, 186, 173–183. [Google Scholar] [CrossRef] [Green Version]
  35. Suárez, L.; Zarco-Tejada, P.J.; Sepulcre-Cantó, G.; Pérez-Priego, O.; Miller, J.R.; Jiménez-Muñoz, J.C.; Sobrino, J. Assessing canopy PRI for water stress detection with diurnal airborne imagery. Remote Sens. Environ. 2008, 112, 560–575. [Google Scholar] [CrossRef]
  36. Cao, Z.; Yao, X.; Liu, H.; Liu, B.; Cheng, T.; Tian, Y.; Cao, W.; Zhu, Y. Comparison of the abilities of vegetation indices and photosynthetic parameters to detect heat stress in wheat. Agric. For. Meteorol. 2019, 265, 121–136. [Google Scholar] [CrossRef]
  37. Park, E.; Kim, Y.-S.; Omari, M.K.; Suh, H.-K.; Faqeerzada, M.A.; Kim, M.S.; Baek, I.; Cho, B.-K. High-Throughput Phenotyping Approach for the Evaluation of Heat Stress in Korean Ginseng (Panax ginseng Meyer) Using a Hyperspectral Reflectance Image. Sensors 2021, 21, 5634. [Google Scholar] [CrossRef]
  38. Xie, X.J.; Zhang, Y.H.; Li, R.Y.; Shen, S.H.; Bao, Y.X. Prediction model of rice crude protein content, amylose content and actual yield under high temperature stress based on hyper-spectral remote sensing. Qual. Assur. Saf. Crop. 2019, 11, 517–527. [Google Scholar] [CrossRef]
  39. Ryu, J.-H.; Na, S.-I.; Cho, J. Inter-Comparison of normalized difference vegetation index measured from different footprint sizes in cropland. Remote Sens. 2020, 12, 2980. [Google Scholar] [CrossRef]
  40. Liu, L.; Hoogenboom, G. Ingram, K.T. Controlled-environment sunlit plant growth chambers. Crit. Rev. Plant. Sci. 2000, 19, 347–375. [Google Scholar] [CrossRef]
  41. Okada, M.; Hamasaki, T.; Hayashi, T. Temperature gradient chambers for research on global environment change. I. Thermal environment in a large chamber. Biotronics 1995, 24, 85–97. [Google Scholar] [CrossRef]
  42. Hadley, P.; Batts, G.R.; Ellis, R.H.; Morison, J.I.L.; Pearson, S.; Wheeler, T.R. Temperature gradient chambers for research on global environment change. II. A twin-wall tunnel system for low-stature, field-grown crops using a split heat pump. Plant Cell Environ. 1995, 18, 1055–1063. [Google Scholar] [CrossRef]
  43. Tang, R.S.; Zheng, J.C.; Jin, Z.Q.; Zhang, D.D.; Huang, Y.H.; Chen, L.G. Possible correlation between high temperature-induced floret sterility and endogenous levels of IAA, GAs and ABA in rice (Oryza sativa L.). Plant Growth Regul. 2008, 54, 37–43. [Google Scholar] [CrossRef]
  44. Rouse, J.; Haas, R.; Schell, J.; Deering, D. Monitoring vegetation systems in the Great Plains with ERTS-1. In Proceedings of the Third Earth Resources Technology Satellite Symposium, Washington, DC, USA, 10–14 December 1974. [Google Scholar]
  45. Gamon, J.A.; Peñuelas, J.; Field, C.B. A narrow-waveband spectral index that tracks diurnal changes in photosynthetic efficiency. Remote Sens. Environ. 1992, 41, 35–44. [Google Scholar] [CrossRef]
  46. Yeom, J.M.; Ko, J.; Hwang, J.; Lee, C.S.; Choi, C.U.; Jeong, S. Updating absolute radiometric characteristics for KOMPSAT-3 and KOMPSAT-3A multispectral imaging sensors using well-characterized pseudo-invariant tarps and microtops II. Remote Sens. 2018, 10, 697. [Google Scholar] [CrossRef] [Green Version]
  47. Mosleh, M.; Hassan, Q.; Chowdhury, E. Application of remote sensors in mapping rice area and forecasting its production: A review. Sensors 2015, 15, 769–791. [Google Scholar] [CrossRef] [Green Version]
  48. Zhang, S.; Tao, F.; Zhang, Z. Changes in extreme temperatures and their impacts on rice yields in southern China from 1981 to 2009. Field Crops Res. 2016, 189, 43–50. [Google Scholar] [CrossRef] [Green Version]
  49. Kim, C.G.; Cho, H.S.; Choi, S.H.; Lee, J.M.; Pyon, J.Y. Varietal Difference in Heading Date of Rice by Night Illumination. Korean J. Crop. Sci. 2003, 38, 209–215, (In Korean with English Abstract). [Google Scholar]
  50. Krishnan, P.; Ramakrishnan, B.; Reddy, K.R.; Reddy, V.R. High-temperature effects on rice growth, yield, and grain quality. Adv. Agron. 2011, 111, 87–206. [Google Scholar] [CrossRef]
  51. Wang, Y.; Zhang, J.; Song, G.; Long, Z.; Chen, C. Impacts of recent temperatures rise on double-rice phenology across Southern China. Int. J. Plant Prod. 2019, 13, 1–10. [Google Scholar] [CrossRef]
  52. Tanaka, A.; Toriyama, K.; Kobayashi, K. Less yield reduction induced by high temperature in a paddy field under organic fertilizer management in Tochigi prefecture. J. Agric. Meteorol. 2011, 67, 249–258. [Google Scholar] [CrossRef]
  53. Ekanayake, I.J.; Datta, S.D.; Steponkus, P.L. Spikelet sterility and flowering response of rice to water stress at anthesis. Ann. Bot. 1989, 63, 257–264. [Google Scholar] [CrossRef]
  54. Rang, Z.W.; Jagadish, S.V.K.; Zhou, Q.M.; Craufurd, P.Q.; Heuer, S. Effect of high temperature and water stress on pollen germination and spikelet fertility in rice. Environ. Exp. Bot. 2011, 70, 58–65. [Google Scholar] [CrossRef] [Green Version]
  55. Gerhards, M.; Rock, G.; Schlerf, M.; Udelhoven, T. Water stress detection in potato plants using leaf temperature, emissivity, and reflectance. Int. J. Appl. Earth Obs. Geoinf. 2016, 53, 27–39. [Google Scholar] [CrossRef]
  56. Sims, D.A.; Gamon, J.A. Relationships between leaf pigment content and spectral reflectance across a wide range of species, leaf structures and developmental stages. Remote Sens. Environ. 2002, 81, 337–354. [Google Scholar] [CrossRef]
  57. Shon, J.; Kim, J.; Lee, C.; Yang, W. Effect of high temperature on leaf physiological changes as chlorophyll composition and photosynthesis rate of rice. Korean J. Crop. Sci. 2015, 60, 266–272. [Google Scholar] [CrossRef]
  58. He, J.; Zhang, N.; Su, X.; Lu, J.; Yao, X.; Cheng, T.; Zhu, Y.; Cao, W.; Tian, Y. Estimating leaf area index with a new vegetation index considering the influence of rice panicles. Remote Sens. 2019, 11, 1809. [Google Scholar] [CrossRef] [Green Version]
  59. Gitelson, A.; Merzlyak, M.N. Spectral reflectance changes associated with autumn senescence of Aesculus hippocastanum L. and Acer platanoides L. leaves. Spectral features and relation to chlorophyll estimation. J. Plant. Physiol. 1994, 143, 286–292. [Google Scholar] [CrossRef]
  60. Li, Z.W.; Xiong, J.; Li, Z.F.; Qi, X.H.; Chen, H.F.; Shao, C.H.; Wang, J.Y.; Liang, Y.Y.; Lin, W.X. Analysis of differential expression of proteins in rice leaf sheath during grain filling. Acta Agron. Sin. 2008, 34, 619–626. [Google Scholar] [CrossRef]
  61. Chen, H.-J.; Wang, S.-J. Molecular regulation of sink–source transition in rice leaf sheaths during the heading period. Acta Physiol. Plant. 2008, 30, 639–649. [Google Scholar] [CrossRef]
  62. Rahman, M.A.; Haque, M.E.; Sikdar, B.; Islam, M.A.; Matin, M.N. Correlation analysis of flag leaf with yield in several rice cultivars. J. Life Earth Sci. 2013, 8, 49–54. [Google Scholar] [CrossRef] [Green Version]
Figure 1. Temperature gradient field chamber (TGFC) diagram. (a) Structural characteristics of the TGFC. Observation methods of (b) field-spectrometer and (c) multi-spectral camera.
Agronomy 12 01972 g001
Figure 2. Observation images of optical devices such as (a) leaf-spectrometer, (b) field-spectrometer, and (c) multi-spectral camera.
Agronomy 12 01972 g002
Figure 3. Time series of air temperature for three years in Gwanju, Republic of Korea. Red square plots indicate air temperature and orange shaded lines indicate the minimum and maximum air temperatures. Grey plots and shaded lines represent the mean, minimum, and maximum air temperatures for climatic data (1981–2010 years). (a) 2016, (b) 2017, (c) 2018, and (d) 2019.
Agronomy 12 01972 g003
Figure 4. Different heading dates of paddy rice depending on air temperature. The survey positions were expressed as P1 to P15. P1 indicates a position at ambient temperature (AT) and P15 indicates a position at near AT+3 °C.
Agronomy 12 01972 g004
Figure 5. Component percentage of above ground dry matter (AGDM) depending on heat stress. The survey positions were expressed as P1 to P16. P1 indicates a position at ambient temperature (AT) and P16 indicates a position at AT+3 °C.
Agronomy 12 01972 g005
Figure 6. Time series of the NDVI and PRI measured from leaf-spectrometer (leaf scale) depending on heat stress. Time series of (a) NDVI and (b) PRI during cultivation periods. Changes in (c) NDVI and (d) PRI after the heading date.
Agronomy 12 01972 g006
Figure 7. Relative change of spectral reflectance measured from leaf-spectrometer (leaf scale) after the heading stage of paddy rice at (a) AT and (b) AT+3 °C positions. The vertical red lines denote 531 nm and 570 nm and are used to compute PRI, and the vertical green lines denote 670 nm and 800 nm and are used to calculate NDVI. The black solid line is the standard, which is based on spectral reflectance measured on August 22, 2018. The blue, green, gold, and orange dashed lines were measured on 31 August 2018, 7 September 2018, 14 September 2018, and 21 September 2018, respectively. The red solid line represents the final measurement of the change ratio of spectral reflectance after the heading stage.
Agronomy 12 01972 g007
Figure 8. Time series of NDVI and PRI measured from field-spectrometers (canopy scale) depending on heat stress. Time series of (a) NDVI and (b) PRI during cultivation periods. Changes of (c) NDVI and (d) PRI based on the heading date.
Agronomy 12 01972 g008
Figure 9. Relative change of reflectance measured from field-spectrometers (canopy scale) after heading stage of paddy rice at AT, AT+1 °C, AT+2 °C, and AT+3 °C positions on 10 September 2018 (a) and 26 September 2018 (b). The vertical red lines indicate the 531 nm and 570 nm values used to compute PRI, and the vertical green lines denote the 670 nm and 800 nm values used to calculate NDVI. The black solid lines represent the standard lines, which are based on the spectral reflectance measured on 17 August 2018.
Agronomy 12 01972 g009
Figure 10. Distribution of NDVI for vegetation pixels on 16 August 2018 (heading stage) (ad) and 27 September 2018 (harvesting stage) (eh) under different air temperature conditions. NDVI was calculated based on spectral reflectance captured by the multi-spectral camera.
Agronomy 12 01972 g010
Figure 11. NDVI images for paddy rice measured by the multi-spectral camera on 16 August 2018 (heading stage) (ad) and 27 September 2018 (harvesting stage) under different air temperature conditions (eh). Color is observed when NDVI is above 0.5.
Agronomy 12 01972 g011
Figure 12. Different slopes between rNDVI and rsPRI after the heading stage depending on ripening ratio of paddy rice. rNDVI and rsPRI were calculated using data measured from field-spectrometers (canopy scale).
Agronomy 12 01972 g012
Figure 13. Relationship between ripening ratio of paddy rice and (a) mean air temperature for 40 days after heading, (b) (1−rsPRI)/(1−rNDVI), (c) rNDVI, and (d) rsPRI. Each relationship equation was presented in Table 2. NDVI and PRI were calculated using spectral reflectance measured from field-spectrometers (canopy scale). rNDVI and rsPRI indicate the relative change in vegetation index after the heading stage of paddy rice.
Agronomy 12 01972 g013
Table 1. Information of optical observation.
Optical DevicesYearsNumber of Observation Positions
Leaf-spectrometer20182
Field-spectrometer2016, 2017, 2018, 201910, 12, 16, 6
Multi-spectral camera20184
Table 2. Statistical results of the estimation of ripening ratio using air temperature and relative vegetation index.
Input VariablesR-SquareRMSE (%)Equation
Air temperature0.9617.180Y = 88.933/(1 + exp(−(X − 27.244)/−0.330)) − 1.225
if (Y > 0, Y, 0)
(1−rsPRI)/(1−rNDVI)0.92210.162Y = 83.414/(1 + exp(−(X − 3.809)/−0.636)) + 8.066,
if (rNDVI < 0.99, rNDVI, 0.99)
rNDVI0.9547.820Y = 97.317/(1 + exp(−(X − 0.900)/−0.044)) − 7.462
if (Y > 0, Y, 0)
rsPRI0.9438.640Y = 91.386/(1 + exp(−(X − 0.608)/−0.043)) − 1.515,
if (Y > 0, Y, 0)
p-value < 0.0001.
Publisher’s Note: MDPI stays neutral with regard to jurisdictional claims in published maps and institutional affiliations.

