
Evaluation of Morpho-Physiological Traits in Rice Genotypes for Adaptation under Irrigated and Water-Limited Environments

 ,
,  ,
,  ,
,  , and
, and 
Abstract
1. Introduction
2. Materials and Methods
2.1. Experimental Site
2.2. Experimental Design and Treatments
2.3. Crop Husbandry Practices
2.4. Measurements of Morpho-Physiological and Agronomic Traits
2.5. Statistical Analysis
3. Results
3.1. Effect of Studied Factor on Morpho-Physiological Traits
3.2. Morpho-Physiological Variation among Genotypes
3.3. Agronomic Performance of Rice Genotypes
3.4. Agronomic Performance of Rice Genotypes
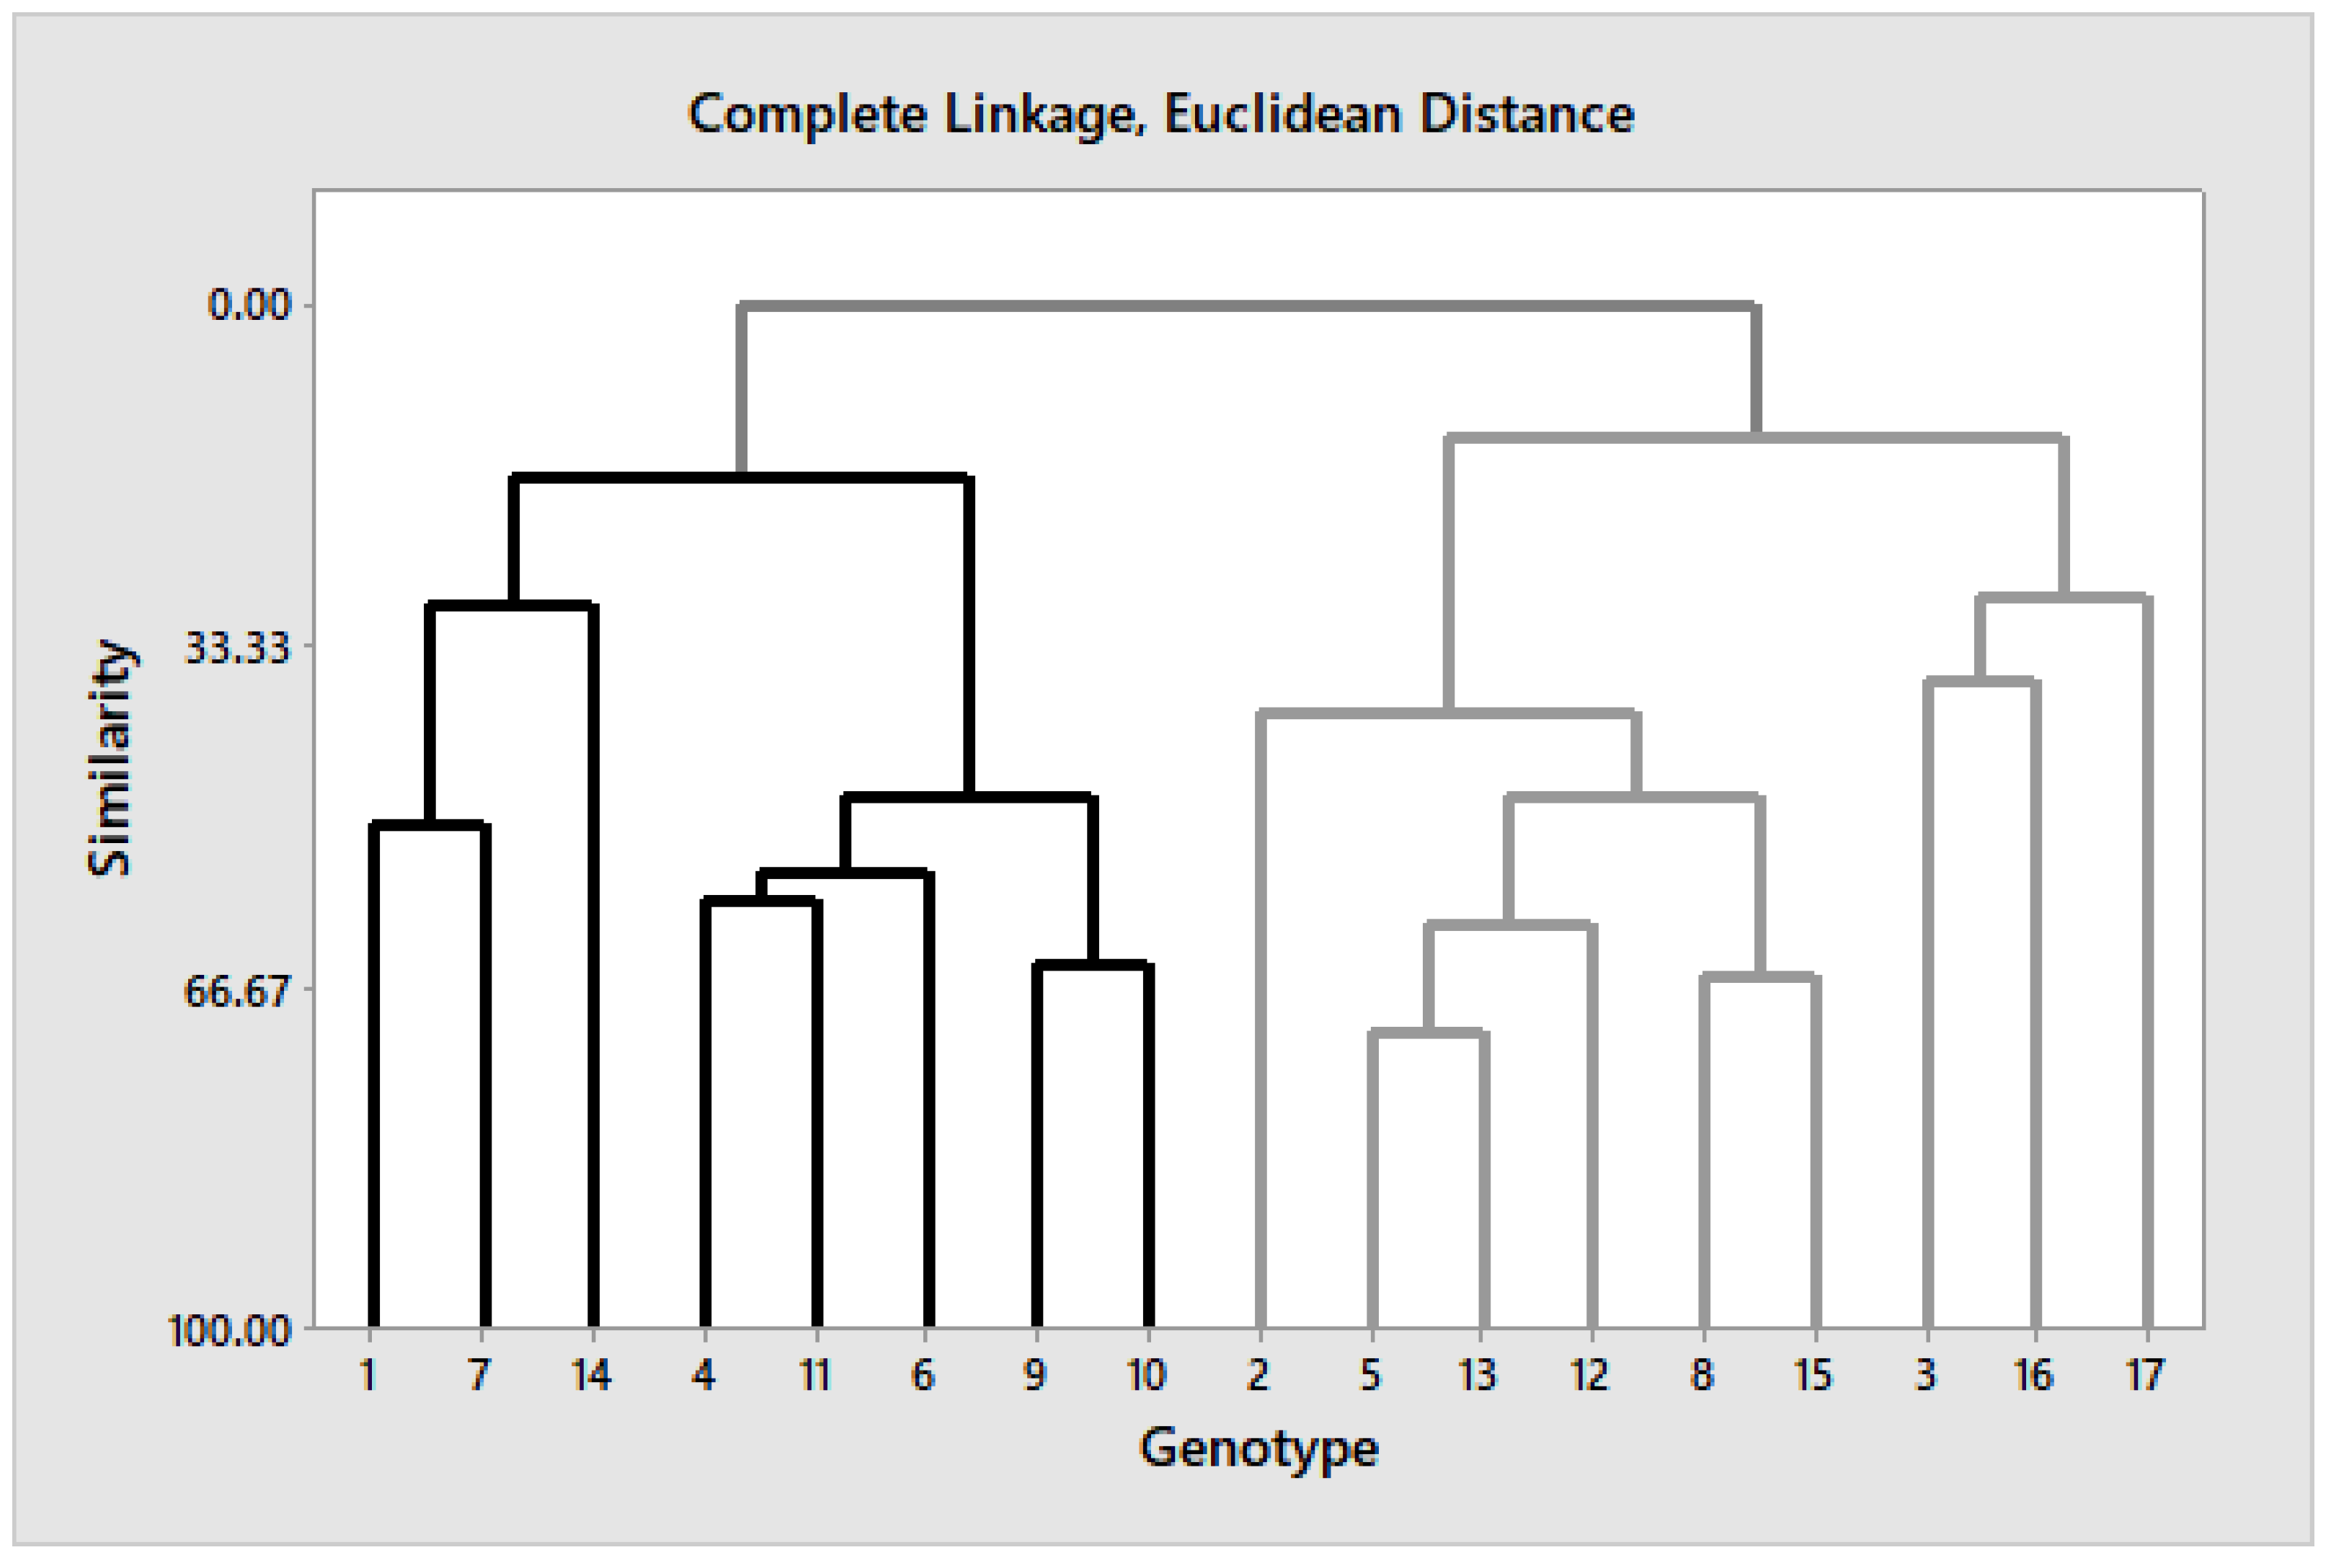
3.5. Cluster Analysis and Pearson Correlation
4. Discussion
5. Conclusions
Author Contributions
Funding
Institutional Review Board Statement
Informed Consent Statement
Conflicts of Interest
References
- Wu, H.; Hubbard, K.G.; Wilhite, D.A. An agricultural drought risk assessment model for corn and soybeans. Int. J. Climatol. 2004, 24, 723–741. [Google Scholar] [CrossRef]
- Sheffield, J.; Wood, E.F.; Chaney, N.; Guan, K.; Sadri, S.; Yuan, X.; Olang, L.; Amani, A.; Ali, A.; Demuth, S.; et al. A drought monitoring and forecasting system for Sub-Sahara African water resources and food security. Bull. Am. Meteorol. Soc. 2014, 95, 861–882. [Google Scholar] [CrossRef]
- Lesk, C.; Rowhani, P.; Ramankutty, N. Influence of extreme weather disasters on global crop production. Nature 2016, 529, 84–87. [Google Scholar] [CrossRef]
- Li, X.; Kristiansen, K.; Rosenqvist, E.; Liu, F. Elevated CO2 modulates the effects of drought and heat stress on plant water relations and grain yield in wheat. J. Agron. Crop Sci. 2019, 205, 362–371. [Google Scholar] [CrossRef]
- Zhao, M.; Running, S.W. Drought-induced reduction in global terrestrial net primary production from 2000 through 2009. Science 2010, 329, 940–943. [Google Scholar] [CrossRef] [PubMed]
- Dai, A. Increasing drought under global warming in observations and models. Nat. Clim. Chang. 2013, 3, 52–58. [Google Scholar] [CrossRef]
- Gaballah, M.M.; Af El-Ezz, A.F.; Ghoneim, A.M.; Yang, B.; Xiao, X. Exploiting heterosis and combining ability in two-line hybrid rice. Acta Agric. Slovenica 2021, 117, 1–16. [Google Scholar] [CrossRef]
- Gaballah, M.M.; Ghoneim, A.M.; Ghazy, M.I.; Mohammed, H.M.; Raghda, M.S.; Rehman, H.U.; Shamsudin, N.A. Root traits responses to irrigation intervals in rice (Oryza sativa L.). Inter. J. Agri. Biol. 2021, 26, 23–30. [Google Scholar] [CrossRef]
- Gewaily, E.E.; Ghoneim, A.M.; Osman, M.O. Effects of nitrogen levels on growth, yield and nitrogen use efficiency of some newly released Egyptian rice genotypes. Open Agric. 2018, 3, 310–318. [Google Scholar] [CrossRef]
- Ghoneim, A.M. Soil nutrients availability, rice productivity and water saving under deficit irrigation conditions. J. Plant Prod. 2020, 11, 7–16. [Google Scholar] [CrossRef]
- Upadhyaya, H.; Panda, S.K. Drought stress responses and its management in rice. In Advances in Rice Research for Abiotic Stress Tolerance; Hasanuzzaman, M., Fujita, M., Nahar, K., Biswas, J.K., Eds.; Elsevier: London, UK, 2019; pp. 177–200. [Google Scholar]
- Gupta, A.; Rico-Medina, A.; Caño-Delgado, A.I. The physiology of plant responses to drought. Science 2020, 368, 266–269. [Google Scholar] [CrossRef] [PubMed]
- Melandri, G.; AbdElgawad, H.; Riewe, D.; Hageman, J.A.; Asard, H.; Beemster, G.T.S.; Kadam, N.; Jagadish, K.; Altmann, T.; Ruyter-Spira, C.; et al. Biomarkers for grain yield stability in rice under drought stress. J. Exp. Bot. 2020, 71, 669–683. [Google Scholar] [CrossRef] [PubMed]
- Ghazy, M.I. Genetic Studies on Components of Drought and Heat Stresses Tolerance in Rice. Ph.D. Thesis, Kafrelsheikh University, Kafr el-Sheikh, Egypt, 2017; p. 233. [Google Scholar]
- Krishnamurthy, S.L.; Sharma, P.C.; Sharma, D.K.; Singh, Y.P.; Mishra, V.K.; Burman, D.; Maji, B.; Mandal, S.; Sarangi, S.K.; Gautam, P.K.; et al. Additive main effects and multiplicative interaction analyses of yield performance in rice genotypes for general and specific adaptation to salt stress in locations in India. Euphytica 2021, 217, 20. [Google Scholar] [CrossRef]
- Ghazy, M.; Salem, S.; Sallam, A. Utilize of genetic diversity and marker-trait association to improve drought tolerance in rice (Oryza sativa L.). Mol. Biol. Rep. 2020, 1–18. [Google Scholar] [CrossRef]
- Pandey, V.; Shukla, A. Acclimation and tolerance strategies of rice under drought stress. Rice Sci. 2015, 22, 147–161. [Google Scholar] [CrossRef]
- Kumari, B.K.; Kumar, R.B.; Dpb, J.; Rao, R. Diversity analysis in rice breeding lines for yield and its components using principal component analysis. J. Pharmacogn. Phytochem. 2021, 10, 905–909. [Google Scholar] [CrossRef]
- Torres, R.O.; McNally, K.L.; Cruz, C.V.; Serraj, R.; Henry, A. Screening of rice Genebank germplasm for yield and selection of new drought tolerance donors. Field Crops Res. 2013, 147, 12–22. [Google Scholar] [CrossRef]
- Bin Rahman, A.N.M.R.; Zhang, J.H. Flood and drought tolerance in rice: Opposite but may coexist. Food Energy Secur. 2016, 5, 76–88. [Google Scholar] [CrossRef]
- Kumar, A.; Bernier, J.; Verulkar, R.; Lafitte, G.; Atlin, C. Breeding for drought tolerance: Direct selection for yield, response to selection and use of drought-tolerant donors in upland and lowland-adapted populations. Field Crops Res. 2008, 107, 221–231. [Google Scholar] [CrossRef]
- Venuprasad, R.; Cruz, M.T.S.; Amante, M.; Magbanua, R.; Kumar, A.; Atlin, G. Response to two cycles of divergent selection for grain yield under drought stress in four rice breeding populations. Field Crops Res. 2008, 107, 232–244. [Google Scholar] [CrossRef]
- Ruth, N.M.; Julia, S.; John, D.; John, M.K.; Pangirayi, T. Genotype environment interactions for grain yield in rice under no drought and drought conditions. Afr. J. Plant Sci. 2017, 11, 282–293. [Google Scholar] [CrossRef][Green Version]
- Sitaresmi, T.; Susanto, U.; Pramudyawardani, E.F.; Nafisah, E.; Nugraha, Y.; Sasmita, P. Genotype × environment interaction of rice genotype. IOP Conf. Ser. Earth Environ. Sci. 2020, 484, 012028. [Google Scholar] [CrossRef]
- Kumar, A.; Dhillon, T.S. Stability of French bean (Phaseolus vulgaris) genotypes under diverse environments. Indian J. Agric. Sci. 2020, 90, 157–162. [Google Scholar]
- Gaballah, M.M.; Metwally, A.M.; Skalicky, M.; Hassan, M.M.; Brestic, B.; Sabagh, A.; Fayed, A.M. Genetic diversity of selected rice genotypes under water stress conditions. Plants 2020, 10, 27. [Google Scholar] [CrossRef] [PubMed]
- De Datta, S.K.; Malabuyoc, J.A.; Aragon, E.L. A field screening technique for evaluating rice germplasm for drought tolerance during vegetative stage. Field Crops Res. 1988, 19, 123–124. [Google Scholar] [CrossRef]
- Hall, A.E.; Lange, O.L.; Schulze, E.D.; Walz, H. LI-1600 Steady State Promoter Instruction Manual. October (8210–0030); LI-COR, Inc.: Lincoln, NE, USA, 1989; p. 16. [Google Scholar]
- Steel, R.D.; Torrie, G.; DA Dickey, J.H. Principles and Procedures of Statistics: A Biometrical Approach, 3rd ed.; McGraw Hill Book Co.: New York, NY, USA, 1997; pp. 400–408. [Google Scholar]
- Wang, B.; Zhong, Z.; Wang, X.; Han, X.; Yu, D.; Wang, C.; Song, W.W.; Zheng, X.; Chen, C.; Zhang, Y. Knockout of the OsNAC006 transcription factor causes drought and heat sensitivity in rice. Int. J. Mol. Sci. 2020, 21, 2288. [Google Scholar] [CrossRef] [PubMed]
- Zain, M.N.A.; Ismail, M.R.; Puteh, A.; Mahmood, M.; Islam, M.R. Drought tolerance and ion accumulation of rice following application of additional potassium fertilizer. Commun. Soil Sci. Plant Anal. 2014, 45, 2502–2514. [Google Scholar] [CrossRef]
- Bernier, J.; Kumar, A.; Spaner, D.; Verulkar, S.; Mandal, N.P.; Sinha, P.K.; Peeraju, P.; Dongre, P.R.; Mahto, R.N.; Atlin, G.N. Characterization of the effect of rice drought tolerance qtl12.1 over a range of environments in the Philippines and eastern India. Euphytica 2009, 166, 207–217. [Google Scholar]
- Bunnag, S.; Pongthai, P. Selection of Rice (Oryza sativa L.) cultivars tolerant to drought stress at the vegetative stage under field conditions. Am. J. Plant Sci. 2013, 4, 1701–1708. [Google Scholar] [CrossRef]
- Ashfaq, M.; Haider, M.S.; Khan, A.S.; Allah, S.U. Breeding potential of the basmati rice germplasm under water stress condition. Afr. J. Biotechnol. 2012, 11, 6647–6657. [Google Scholar]
- Naik, S.M.; Raman, A.K.; Nagamallika, M.; Venkateshwarlu, C.; Singh, S.P.; Kumar, S.; Singh, S.K.; Tomizuddin, A.; Das, S.P.; Prasad, T.; et al. Genotype × environment interactions for grain iron and zinc content in rice. J. Sci. Food Agric. 2020, 100, 4150–4164. [Google Scholar] [CrossRef] [PubMed]
- Fukai, S.; Pantuwan, G.; Jongdee, B.; Cooper, M. Screening for drought resistance in rainfed lowland rice. Field Crop Res. 1999, 64, 61–74. [Google Scholar] [CrossRef]
- Pantuwan, G.; Fukai, S.; Cooper, M.; Rajataserreekul, S.; O’Toole, J.C. Yield response of rice (Oryza sativa L.) genotypes to different types of drought under rainfed lowlands Part 1. Grain yield and yield components. Field Crop Res. 2002, 73, 153–168. [Google Scholar] [CrossRef]
- Shamsudin, N.A.A.; Swamy, B.P.M.; Ratnam, W.; Sta Cruz, M.T.; Raman, A.; Kumar, A. Marker assisted pyramiding of drought yield QTLs into a popular Malaysian rice cultivar, MR219. BMC Genet. 2016, 17, 30. [Google Scholar] [CrossRef] [PubMed]
- Romyen, P.; Hanviriyapant, P.; Rajatasereekul, S.; Khunthasuvon, S.; Fukai, S.; Basnayake, J.; Skulkhu, E. Lowland rice improvement in northern and northeast Thailand: 2. Cultivar differences. Field Crop Res. 1998, 59, 109–119. [Google Scholar] [CrossRef]
- Lafitte, H.R.; Price, A.H.; Courtois, B. Yield response to water deficit in an upland rice mapping population: Associations among traits and genetic markers. Theor. Appl. Genet. 2004, 109, 1237–1246. [Google Scholar] [CrossRef] [PubMed]
- Mishra, S.S.; Panda, D. Leaf traits and antioxidant defense for drought tolerance during early growth stage in some popular traditional rice landraces from Koraput, India. Rice Sci. 2017, 24, 207–217. [Google Scholar] [CrossRef]
- Hussain, H.A.; Hussain, S.; Khaliq, A.; Ashraf, U.; Anjum, S.A.; Men, S.N.; Wang, L.C. Chilling and drought stresses in crop plants: Implications, cross talk, and potential management opportunities. Front. Plant Sci. 2018, 9, 393. [Google Scholar] [CrossRef]
- Tejaswini, K.L.; Manukonda, Y.; Kumar, S.; Rao, R.; Ahamed, M.L.; Raju, S.K. Application of principal component analysis for rice germplasm characterization and evaluation. Emergent Life Sci. Res. 2018, 4, 72–84. [Google Scholar] [CrossRef]
- Zhang, L.; Yan, Y.; Hu, Z.; Wang, K.; Cao, L.; Wu, S. Association and principal component analyses of eating quality traits of 141 japonica rice cultivars in China. Am. J. Agric. For. 2021, 9, 37–41. [Google Scholar]
- Kumar, A.; Shalabh Dixit, T.; Ram, R.B.; Yadaw, K.K.; Mishra, N.P.; Mandal, P. Breeding high-yielding drought-tolerant rice: Genetic variations and conventional and molecular approaches. J. Exp. Bot. 2014, 65, 6265–6278. [Google Scholar] [CrossRef] [PubMed]
- Ha, P.T.T. Physiological responses of rice seedlings under drought stress. J. Sci. Dev. 2014, 12, 635–640. [Google Scholar]
- Poorter, L.; Markesteijn, L. Seedling traits determine drought tolerance of tropical tree species. Biotropica 2008, 40, 321–331. [Google Scholar] [CrossRef]
- Kadioglu, A.; Terzi, R.A. Dehydration Avoidance Mechanism: Leaf Rolling. Bot. Rev. 2007, 73, 290–302. [Google Scholar] [CrossRef]
- Chozin, M.A.; Lubis, I.; Junaedi, A.; Ehara, H. Some physiological character responses of rice under drought conditions in a paddy system. J. Int. Soc. Southeast Asian Agric. Sci. 2014, 20, 104–114. [Google Scholar]
- Sikuku, P.; Onyango, J.; Netondo, G.W. Physiological and biochemical responses of five nerica rice varieties (Oryza sativa L.) to water deficit at vegetative and reproductive stage. Agric. Biol. J. N. Am. 2012, 3, 93–104. [Google Scholar] [CrossRef]
- Asma, A.; Hussain, L.; Ashraf, M.Y.; Rasheed, R.; Iqbal, M.; Anwar, S.; Shereen, A.; Khan, M.K. Assessment of rice (Oryza sativa L.) genotypes for drought stress tolerance using morpho-physiological indices as a screening technique. Pak. J. Bot. 2021, 53, 45–58. [Google Scholar] [CrossRef]
- Abdel-Hafez, A.G.; Abdallah, A.A.; Ghazy, M.I.; El-Degwy, I.S. Genetic analysis of water deficit and heat tolerance in rice under Egyptian conditions. Plant Breed. 2017, 21, 202–218. [Google Scholar]
- Abdallah, A.A. Development of high yielding rice lines tolerant to drought and heat stress conditions in Egypt. World Rural Obs. 2015, 7, 58–64. [Google Scholar]
- Fahad, S.; Bajwa, A.A.; Nazir, U.; Anjum, S.A.; Farooq, F.; Zohaib, S.; Sadia, W.; Nasim, S.; Adkins, S.; Saud, M.Z.; et al. Crop production under drought and heat stress: Plant responses and management options. Front. Plant Sci. 2017, 8, 1147. [Google Scholar] [CrossRef]
- Eltaher, S.; Baenziger, P.S.; Belamkar, V.; Emara, H.A.; Nower, A.A.; Salem, K.F.B.; Alqudah, A.M.; Sallam, A. GWAS revealed effect of genotype×environment interactions for grain yield of Nebraska winter wheat. BMC Genom. 2021, 22, 1–14. [Google Scholar] [CrossRef] [PubMed]
- Gaballah, M.M.; Abu El-Ezz, E. Genetic Behavior of Some Rice Genotypes under Normal and High Temperature Stress. Alex. Sci. Exch. J. 2019, 40, 370–384. [Google Scholar] [CrossRef][Green Version]
- Jeevanapriya, P.; Saraswathi, R.; Thiruvengadam, V.; Surendar, K.K. Assessment of Genetic Diversity in New Restorer Lines of Hybrid Rice. Int. J. Curr. Microbiol. Appl. Sci. 2019, 8, 530–536. [Google Scholar] [CrossRef]
- Kang, D.; Futakuchi, K. Effect of moderate drought-stress on flowering time of interspecific hybrid progenies (Oryza sativa L. × Oryza glaberrima Steud). J. Crop Sci. Biotech. 2019, 22, 75–81. [Google Scholar] [CrossRef]
- Lakshmi, I.; Sreedhar, V.; Vanisri, M.; Anantha, S.; Subba, M.; Rao, L.; Gireesh, C. Multivariate analysis and selection criteria for identification of African rice (Oryza glaberrima) for genetic improvement of indica rice cultivars. Plant Genet. Resour. Charact. Util. 2019, 7, 499–505. [Google Scholar] [CrossRef]


| Soil Depth (cm) | Field Capacity (F.C.) (%) | Permanent Wilting Point (PWP) (%) | Available Water (AW) (cm) | Bulk Density (g/cm3) |
|---|---|---|---|---|
| 0–20 | 41.14 | 25.43 | 16.49 | 1.24 |
| 20–40 | 35.47 | 23.27 | 12.64 | 1.37 |
| 40–60 | 26.54 | 21.29 | 15.43 | 1.24 |
| Genotypes | Pedigree | Origin |
|---|---|---|
| Giza 177 | Giza 171/Yomji No. 1//Pi No. 4 | Japonica |
| Giza 178 | Giza 175/Milyang 49 | Indica/Japonica |
| Giza 179 | GZ 6296/GZ 1368 | Indica/Japonica |
| Giza 182 | Giza 181/IR 39422-161-1-3-1/Giza 181 | Indica |
| Sakha 101 | Giza 176/Milyang | Japonica |
| Sakha 102 | GZ 4096-7-1/GZ 4120-2-5-2 (Giza 177) | Japonica |
| Sakha 103 | Giza 177/Suweon 349 | Japonica |
| Sakha 104 | GZ 4096-8-1/GZ 4100-9-1 | Japonica |
| Sakha 105 | GZ 5581-46-3/GZ 4316-7-1-1 | Japonica |
| Sakha 106 | Giza 176/Milyang 79 | Japonica |
| Sakha 107 | Giza 177/BLI | Japonica |
| Sakha 108 | Sakha 101/HR 1315824 | Japonica |
| Hybrid 2 | IR 6962SA/Giza 179 | Indica |
| Egyptian Yasmine | Introduction | Indica |
| GZ 1368-S-5-4 | IR 1615-31/BG 94-2349 | Indica |
| IET 1444 | TN 1/CO 29 | Indica |
| IRAT 170 | IRAT 13/Palawan | Indica |
| Growing Year | Month | Air Temperature (°C) | Relative Humidity (%) | Wind Speed (km/d) | Solar Radiation (Mj/m2) | Pan Evaporation (mm) | ||||
|---|---|---|---|---|---|---|---|---|---|---|
| Max. | Min. | Mean | Max. | Min. | Mean | |||||
| 2019 | May | 29.65 | 13.07 | 21.41 | 76.78 | 38.79 | 57.79 | 111.56 | 22.71 | 6.83 |
| June | 31.86 | 17.79 | 24.82 | 82.61 | 47.24 | 64.92 | 109.55 | 28.24 | 7.84 | |
| July | 32.36 | 19.10 | 25.73 | 88.14 | 52.86 | 70.55 | 89.95 | 23.52 | 7.34 | |
| August | 32.56 | 19.50 | 26.03 | 88.84 | 53.27 | 71.05 | 77.39 | 21.31 | 6.83 | |
| September | 31.26 | 17.79 | 24.52 | 87.84 | 53.77 | 70.85 | 78.59 | 17.89 | 6.43 | |
| October | 29.25 | 13.47 | 21.41 | 76.58 | 52.36 | 64.52 | 91.96 | 12.06 | 4.62 | |
| 2020 | May | 28.64 | 11.66 | 20.20 | 79.70 | 45.23 | 62.51 | 111.56 | 22.91 | 7.34 |
| June | 31.86 | 17.09 | 24.52 | 81.81 | 47.24 | 64.52 | 117.59 | 23.12 | 8.34 | |
| July | 31.46 | 17.59 | 24.52 | 85.53 | 58.29 | 71.96 | 78.39 | 20.50 | 7.14 | |
| August | 33.17 | 18.69 | 25.93 | 92.06 | 59.30 | 75.68 | 65.33 | 22.41 | 6.53 | |
| September | 33.17 | 16.88 | 25.02 | 89.45 | 52.26 | 70.85 | 76.38 | 20.40 | 5.93 | |
| October | 29.15 | 13.47 | 21.31 | 76.38 | 49.75 | 63.11 | 70.35 | 15.28 | 4.72 | |
| Source | DF | PH | LR | FLA | FLAR | LT | CHC | RWC | SC | TR |
|---|---|---|---|---|---|---|---|---|---|---|
| Model | 70 | 618.25 ** | 8.62 ** | 578.71 ** | 137.92 ** | 3.75 ** | 42.91 ** | 156.39 ** | 0.000341 ** | 435.17 ** |
| Covariates | 1 | 9.36 | 0.51 | 19.28 | 0.19 | 0.03 | 7.86 | 1.09 | 0.000001 | 0.03 |
| DTH | 1 | 9.36 | 0.51 | 19.28 | 0.19 | 0.03 | 7.86 | 1.09 | 0.000001 | 0.03 |
| Blocks | 2 | 6.22 | 0.53 | 31.95 | 5.44 | 0.76 | 1.26 | 2.86 | 0.000063 ** | 1.14 |
| Linear | 18 | 2060.52 ** | 26.09 ** | 1971.88 ** | 348.45 ** | 13.52 ** | 116.90 ** | 550.73 ** | 0.000837 ** | 986.03 ** |
| Y | 1 | 0.04 | 0.28 | 1.48 | 0.04 | 13.08 ** | 1.05 | 0.02 | 0.000084 ** | 42.33 ** |
| I | 1 | 2673.96 ** | 69.72 ** | 39.76 * | 636.31 ** | 14.70 ** | 142.75 ** | 695.90 ** | 0.000814 ** | 621.36 ** |
| G | 16 | 1234.47 ** | 5.93 ** | 2061.63 ** | 187.51 ** | 6.76 ** | 51.69 ** | 276.08 ** | 0.000649 ** | 787.82 ** |
| 2-Way Interactions | 33 | 37.94 ** | 2.01 ** | 76.14 ** | 32.55 ** | 0.42 | 17.10 ** | 23.24 ** | 0.000189 ** | 378.13 ** |
| Y × I | 1 | 3.82 | 0.67 | 0.53 | 2.49 | 0.01 | 0.23 | 1.11 | 0.000001 | 0.45 |
| Y × G | 16 | 3.70 | 0.16 | 4.37 | 2.99 | 0.00 | 1.69 | 2.08 | 0.000000 | 0.08 |
| I × G | 16 | 74.35 ** | 3.88 ** | 153.1 ** | 60.86 ** | 0.85 | 33.76 ** | 45.76 ** | 0.000388 ** | 777.98 ** |
| 3-Way Interactions | 16 | 3.93 | 0.18 | 1.96 | 2.79 | 0.00 | 3.11 | 2.23 | 0.000000 | 0.08 |
| Y × I × G | 16 | 3.93 | 0.18 | 1.96 | 2.79 | 0.00 | 3.11 | 2.23 | 0.000000 | 0.08 |
| Error | 133 | 2.69 | 0.69 | 7.13 | 2.19 | 0.53 | 2.43 | 1.83 | 0.000011 | 0.83 |
| Total | 203 |
| Genotypes | DTH | PH | LR | FLA | FLAR | LT | CHC | RWC | SC | TR | ||||||||||
|---|---|---|---|---|---|---|---|---|---|---|---|---|---|---|---|---|---|---|---|---|
| (cm) | (cm2) | (°C) | (%) | |||||||||||||||||
| NS | DS | NS | DS | NS | DS | NS | DS | NS | DS | NS | DS | NS | DS | NS | DS | NS | DS | NS | DS | |
| Giza 177 | 91.83 | 84.33 | 101.66 | 82.64 | 2.69 | 6.15 | 49.68 | 53.72 | 29.09 | 16.75 | 26.81 | 27.86 | 42.04 | 36.65 | 83.16 | 66.44 | 0.07 | 0.07 | 44.88 | 43.47 |
| Giza 178 | 98.17 | 98.00 | 98.18 | 74.60 | 2.61 | 3.79 | 26.99 | 27.58 | 30.14 | 29.67 | 25.85 | 28.09 | 41.07 | 33.58 | 88.08 | 80.74 | 0.07 | 0.05 | 51.91 | 46.93 |
| Giza 179 | 88.50 | 82.50 | 95.71 | 77.97 | 2.82 | 4.89 | 32.08 | 28.66 | 35.20 | 30.11 | 24.74 | 26.84 | 42.42 | 41.00 | 88.36 | 82.94 | 0.06 | 0.05 | 91.50 | 41.07 |
| Giza 182 | 99.50 | 89.17 | 93.60 | 82.28 | 1.39 | 5.30 | 28.62 | 25.98 | 30.42 | 20.27 | 24.85 | 25.79 | 43.08 | 41.19 | 81.88 | 67.53 | 0.07 | 0.06 | 46.98 | 43.62 |
| Sakha 101 | 111.17 | 105.5 | 89.37 | 69.56 | 2.27 | 5.66 | 45.92 | 39.12 | 29.04 | 20.43 | 25.96 | 26.99 | 45.46 | 36.91 | 83.62 | 72.95 | 0.07 | 0.06 | 45.95 | 41.45 |
| Sakha 102 | 92.50 | 87.83 | 108.83 | 84.04 | 2.33 | 6.02 | 52.33 | 51.38 | 25.61 | 17.83 | 25.75 | 26.79 | 46.56 | 42.19 | 81.19 | 70.53 | 0.05 | 0.05 | 44.02 | 39.18 |
| Sakha 103 | 91.50 | 85.17 | 97.95 | 76.83 | 2.37 | 8.12 | 54.73 | 43.02 | 25.49 | 14.91 | 26.19 | 27.23 | 40.39 | 35.08 | 83.08 | 65.54 | 0.10 | 0.05 | 44.95 | 40.63 |
| Sakha 104 | 103.50 | 97.83 | 104.78 | 93.18 | 1.90 | 5.13 | 42.84 | 27.62 | 35.01 | 28.48 | 26.24 | 27.28 | 40.14 | 34.94 | 85.09 | 73.80 | 0.07 | 0.05 | 46.77 | 41.12 |
| Sakha 105 | 97.33 | 89.00 | 103.70 | 75.63 | 1.31 | 5.30 | 60.90 | 71.36 | 33.08 | 15.22 | 24.63 | 25.58 | 39.21 | 37.94 | 78.58 | 69.71 | 0.06 | 0.05 | 46.32 | 43.04 |
| Sakha 106 | 92.17 | 85.33 | 106.30 | 83.73 | 1.68 | 6.28 | 62.18 | 56.44 | 27.23 | 14.30 | 24.88 | 25.85 | 48.86 | 34.67 | 78.72 | 71.01 | 0.07 | 0.06 | 43.01 | 41.04 |
| Sakha 107 | 92.83 | 86.33 | 103.32 | 91.79 | 1.57 | 3.91 | 62.25 | 46.01 | 28.98 | 21.90 | 23.83 | 25.86 | 43.74 | 40.47 | 89.25 | 78.52 | 0.07 | 0.06 | 49.77 | 40.99 |
| Sakha 108 | 108.83 | 100.50 | 87.69 | 70.96 | 1.36 | 5.36 | 50.41 | 53.80 | 25.62 | 18.74 | 25.84 | 26.83 | 43.65 | 37.95 | 82.04 | 71.74 | 0.06 | 0.05 | 45.97 | 44.15 |
| Hybrid 2 | 106.50 | 97.17 | 101.21 | 79.75 | 1.45 | 4.82 | 28.45 | 25.55 | 35.56 | 23.13 | 25.27 | 27.38 | 42.96 | 37.92 | 78.54 | 69.65 | 0.06 | 0.06 | 45.72 | 42.35 |
| Egyptian Yasmine | 120.50 | 110.50 | 105.05 | 79.27 | 1.24 | 4.80 | 19.15 | 27.18 | 40.39 | 17.58 | 26.69 | 27.70 | 37.75 | 33.76 | 70.95 | 65.02 | 0.07 | 0.07 | 43.24 | 39.37 |
| GZ 1368-S-5-4 | 101.50 | 96.50 | 108.19 | 86.01 | 1.82 | 4.18 | 21.06 | 18.88 | 27.79 | 18.25 | 25.60 | 27.77 | 38.05 | 37.07 | 88.44 | 74.86 | 0.06 | 0.05 | 95.55 | 41.27 |
| IET 1444 | 101.00 | 95.50 | 103.16 | 82.36 | 1.67 | 2.55 | 22.98 | 20.84 | 32.61 | 27.07 | 24.23 | 26.28 | 40.67 | 38.28 | 90.28 | 82.66 | 0.07 | 0.07 | 38.85 | 35.24 |
| IRAT 170 | 105.00 | 98.67 | 133.21 | 117.05 | 1.18 | 3.43 | 30.08 | 32.71 | 34.64 | 28.22 | 24.24 | 26.28 | 37.59 | 36.80 | 78.29 | 75.38 | 0.08 | 0.06 | 44.24 | 43.59 |
| Mean | 100.02 | 93.52 | 102.47 | 82.80 | 1.86 | 5.04 | 40.62 | 38.23 | 30.94 | 21.34 | 25.38 | 26.85 | 41.98 | 37.44 | 82.91 | 72.88 | 0.07 | 0.06 | 51.15 | 41.68 |
| Source | DF | PL | NT | NPP | PW | TGW | SP | GY | HI |
|---|---|---|---|---|---|---|---|---|---|
| Model | 70 | 26.58 ** | 76.09 ** | 79.28 ** | 1.99 ** | 0.50 ** | 170.60 ** | 18.39 ** | 313.89 ** |
| Covariates | 1 | 0.46 | 0.29 | 0.28 | 0.27 * | 0.01 | 1.12 | 0.32 | 3.29 |
| DTH | 1 | 0.46 | 0.29 | 0.28 | 0.27 * | 0.01 | 1.12 | 0.32 | 3.29 |
| Blocks | 2 | 1.88 | 0.31 | 0.32 | 0.04 | 0.01 | 8.80 ** | 0.05 | 0.73 |
| Linear | 18 | 55.68 ** | 230.57 ** | 244.57 ** | 7.27 ** | 1.21 ** | 556.89 ** | 58.53 ** | 1037.00 ** |
| Y | 1 | 0.44 | 1.62 | 12.11 ** | 0.25 * | 0.06 | 0.04 | 0.05 | 0.05 |
| I | 1 | 127.80 ** | 497.80 ** | 511.42 ** | 3.80 ** | 2.35 ** | 1328.94 ** | 116.45 ** | 2008.65 ** |
| G | 16 | 19.66 ** | 61.91 ** | 66.58 ** | 4.85 ** | 0.60 ** | 78.65 ** | 13.08 ** | 244.77 ** |
| 2-Way Interactions | 33 | 9.45 ** | 13.56 ** | 14.84 ** | 0.16 ** | 0.19 ** | 31.43 ** | 3.40 ** | 51.62 ** |
| Y × I | 1 | 0.02 | 2.16 | 22.29 ** | 0.19 | 0.04 | 0.27 | 0.20 | 0.21 |
| Y × G | 16 | 2.24 | 2.30 ** | 4.37 ** | 0.09 | 0.12 ** | 0.83 | 0.17 | 2.17 |
| I × G | 16 | 16.83 ** | 25.53 ** | 24.42 ** | 0.24 ** | 0.27 ** | 62.29 ** | 6.70 ** | 101.04 ** |
| 3-Way Interactions | 16 | 2.68 * | 2.21 ** | 2.39 ** | 0.08 | 0.16 ** | 0.89 | 0.19 | 1.35 |
| Y × I × G | 16 | 2.68 * | 2.21 | 2.39 ** | 0.08 | 0.16 ** | 0.89 | 0.19 | 1.35 |
| Error | 133 | 1.42 | 1.06 | 1.06 | 0.06 | 0.02 | 0.76 | 0.16 | 3.01 |
| Total | 203 |
| Genotypes | PL | NT | NPP | PW (g) | TGW | SP | GY | HI (%) | ||||||||
|---|---|---|---|---|---|---|---|---|---|---|---|---|---|---|---|---|
| (cm) | (g) | (%) | (t ha−1) | |||||||||||||
| NS | DS | NS | DS | NS | DS | NS | DS | NS | DS | NS | DS | NS | DS | NS | DS | |
| Giza 177 | 24.68 | 16.61 | 22.04 | 10.01 | 20.51 | 8.94 | 4.63 | 3.59 | 27.00 | 17.15 | 5.48 | 21.82 | 9.89 | 6.69 | 47.78 | 25.02 |
| Giza 178 | 23.28 | 18.76 | 26.78 | 14.66 | 25.24 | 14.40 | 4.71 | 4.32 | 22.84 | 14.70 | 7.23 | 11.16 | 11.79 | 7.98 | 41.82 | 33.66 |
| Giza 179 | 21.98 | 19.64 | 23.03 | 16.25 | 24.19 | 14.94 | 5.46 | 4.86 | 23.56 | 20.74 | 6.26 | 18.79 | 13.02 | 9.05 | 49.81 | 39.46 |
| Giza 182 | 20.55 | 16.08 | 22.84 | 11.97 | 21.52 | 10.48 | 3.54 | 2.79 | 26.51 | 21.52 | 7.35 | 25.39 | 11.57 | 6.12 | 42.51 | 20.67 |
| Sakha 101 | 23.17 | 19.78 | 23.06 | 16.50 | 21.87 | 15.72 | 2.16 | 1.30 | 27.63 | 23.01 | 5.46 | 19.37 | 11.98 | 7.10 | 50.55 | 28.02 |
| Sakha 102 | 21.12 | 18.46 | 24.85 | 13.84 | 24.12 | 12.89 | 3.56 | 2.56 | 26.42 | 21.38 | 5.92 | 22.52 | 10.59 | 6.49 | 43.50 | 25.07 |
| Sakha 103 | 21.65 | 15.29 | 21.85 | 10.29 | 20.15 | 8.72 | 3.86 | 2.97 | 23.32 | 15.72 | 7.07 | 29.74 | 10.93 | 4.75 | 43.35 | 20.02 |
| Sakha 104 | 21.55 | 17.86 | 22.80 | 17.05 | 21.86 | 16.27 | 3.29 | 2.26 | 26.81 | 19.54 | 6.32 | 20.63 | 10.91 | 7.27 | 46.37 | 26.93 |
| Sakha 105 | 22.01 | 17.49 | 23.98 | 13.23 | 22.49 | 11.62 | 3.43 | 2.68 | 27.26 | 21.23 | 5.99 | 24.28 | 11.19 | 5.95 | 47.10 | 24.46 |
| Sakha 106 | 20.02 | 19.47 | 23.19 | 13.83 | 21.61 | 11.91 | 4.46 | 3.13 | 27.28 | 21.58 | 7.72 | 20.47 | 11.92 | 6.85 | 47.17 | 28.54 |
| Sakha 107 | 22.62 | 19.20 | 24.14 | 19.42 | 23.23 | 17.86 | 3.69 | 3.37 | 33.86 | 22.90 | 6.35 | 15.80 | 11.64 | 9.52 | 47.33 | 35.80 |
| Sakha 108 | 21.20 | 16.85 | 25.04 | 15.56 | 23.42 | 13.30 | 3.37 | 2.45 | 27.50 | 22.20 | 6.66 | 22.48 | 11.62 | 6.39 | 49.50 | 26.99 |
| Hybrid 2 | 25.84 | 17.74 | 28.02 | 16.82 | 25.91 | 14.80 | 4.34 | 3.74 | 24.87 | 20.85 | 9.35 | 25.84 | 13.16 | 7.70 | 52.09 | 28.80 |
| Egyptian Yasmine | 25.66 | 16.29 | 18.62 | 12.55 | 16.90 | 11.14 | 3.30 | 2.38 | 31.98 | 21.55 | 7.60 | 28.31 | 10.25 | 4.10 | 35.60 | 20.98 |
| GZ 1368-S-5-4 | 22.77 | 18.68 | 24.02 | 16.19 | 22.16 | 13.73 | 3.41 | 2.91 | 23.25 | 22.89 | 6.58 | 17.32 | 9.38 | 6.49 | 36.90 | 20.49 |
| IET 1444 | 20.88 | 20.30 | 25.56 | 20.66 | 24.42 | 19.52 | 3.56 | 3.16 | 24.19 | 23.06 | 8.00 | 15.27 | 8.86 | 7.26 | 34.21 | 26.39 |
| IRAT 170 | 25.35 | 22.75 | 18.01 | 14.78 | 16.55 | 13.76 | 2.97 | 2.65 | 28.41 | 23.50 | 8.85 | 14.63 | 7.97 | 7.18 | 32.40 | 26.98 |
| Mean | 22.61 | 18.31 | 23.40 | 14.92 | 22.13 | 13.53 | 3.75 | 3.01 | 26.63 | 20.80 | 6.95 | 20.81 | 10.98 | 6.88 | 44.00 | 26.96 |
| DTH | PH | LR | FLA | FLAR | LT | CHC | RWC | SC | TR | PL | NT | NPP | PW | TGW | SP | GY | |
|---|---|---|---|---|---|---|---|---|---|---|---|---|---|---|---|---|---|
| PH | −0.042 | ||||||||||||||||
| LR | −0.365 | −0.375 | |||||||||||||||
| FLA | −0.403 | −0.190 | 0.510 * | ||||||||||||||
| FLAR | 0.177 | 0.332 | −0.663 ** | -0.617 ** | |||||||||||||
| LT | 0.367 | −0.223 | 0.080 | -0.402 | 0.137 | ||||||||||||
| CC | −0.449 | 0.037 | −0.099 | 0.086 | 0.057 | −0.485 * | |||||||||||
| RWC | −0.054 | 0.152 | −0.702 ** | -0.363 | 0.767 ** | −0.092 | 0.200 | ||||||||||
| SC | 0.207 | 0.142 | −0.258 | -0.158 | −0.076 | −0.034 | −0.120 | −0.161 | |||||||||
| TR | 0.011 | −0.031 | 0.096 | 0.188 | 0.075 | 0.183 | −0.194 | −0.115 | −0.349 | ||||||||
| PL | 0.092 | 0.557 * | −0.622 ** | -0.183 | 0.550 * | −0.267 | 0.108 | 0.699 ** | 0.075 | −0.126 | |||||||
| NT | 0.229 | 0.137 | −0.709 ** | -0.374 | 0.564 * | −0.191 | 0.236 | 0.763 ** | 0.021 | −0.384 | 0.587 * | ||||||
| NP | 0.245 | 0.157 | −0.726 ** | -0.392 | 0.655 ** | −0.150 | 0.203 | 0.804 ** | 0.038 | −0.360 | 0.627 ** | 0.981 ** | |||||
| PW | −0.523 * | −0.038 | −0.193 | -0.178 | 0.389 | 0.163 | 0.126 | 0.444 | −0.083 | 0.195 | 0.062 | 0.043 | 0.046 | ||||
| TGW | 0.262 | 0.298 | −0.428 | -0.061 | −0.018 | −0.540 * | 0.436 | 0.171 | 0.229 | −0.407 | 0.483 * | 0.529 * | 0.444 | −0.426 | |||
| SP | −0.039 | −0.342 | 0.710 ** | 0.243 | −0.636 ** | 0.009 | −0.007 | −0.848 ** | 0.041 | −0.138 | −0.777 ** | −0.581 * | −0.645 ** | −0.279 | −0.125 | ||
| GY | −0.296 | 0.202 | −0.473 | -0.138 | 0.634 ** | −0.159 | 0.380 | 0.777 ** | −0.118 | 0.122 | 0.581 * | 0.656 ** | 0.683 ** | 0.512 * | 0.129 | −0.702 ** | |
| HI | −0.232 | 0.008 | −0.337 | -0.006 | 0.601 * | −0.093 | 0.219 | 0.728 ** | −0.149 | 0.159 | 0.493 * | 0.512 * | 0.557 * | 0.581 * | −0.013 | −0.576 * | 0.884 ** |
Publisher’s Note: MDPI stays neutral with regard to jurisdictional claims in published maps and institutional affiliations. |
© 2022 by the authors. Licensee MDPI, Basel, Switzerland. This article is an open access article distributed under the terms and conditions of the Creative Commons Attribution (CC BY) license (https://creativecommons.org/licenses/by/4.0/).
Share and Cite
Gaballah, M.M.; Ghoneim, A.M.; Rehman, H.U.; Shehab, M.M.; Ghazy, M.I.; El-Iraqi, A.S.; Mohamed, A.E.; Waqas, M.; Shamsudin, N.A.A.; Chen, Y. Evaluation of Morpho-Physiological Traits in Rice Genotypes for Adaptation under Irrigated and Water-Limited Environments. Agronomy 2022, 12, 1868. https://doi.org/10.3390/agronomy12081868
Gaballah MM, Ghoneim AM, Rehman HU, Shehab MM, Ghazy MI, El-Iraqi AS, Mohamed AE, Waqas M, Shamsudin NAA, Chen Y. Evaluation of Morpho-Physiological Traits in Rice Genotypes for Adaptation under Irrigated and Water-Limited Environments. Agronomy. 2022; 12(8):1868. https://doi.org/10.3390/agronomy12081868
Chicago/Turabian StyleGaballah, Mahmoud M., Adel M. Ghoneim, Hafeez Ur Rehman, Mohamed M. Shehab, Mohamed I. Ghazy, Ahmed S. El-Iraqi, Abdelwahed E. Mohamed, Muhammad Waqas, Noraziyah Abd Aziz Shamsudin, and Yaning Chen. 2022. "Evaluation of Morpho-Physiological Traits in Rice Genotypes for Adaptation under Irrigated and Water-Limited Environments" Agronomy 12, no. 8: 1868. https://doi.org/10.3390/agronomy12081868
APA StyleGaballah, M. M., Ghoneim, A. M., Rehman, H. U., Shehab, M. M., Ghazy, M. I., El-Iraqi, A. S., Mohamed, A. E., Waqas, M., Shamsudin, N. A. A., & Chen, Y. (2022). Evaluation of Morpho-Physiological Traits in Rice Genotypes for Adaptation under Irrigated and Water-Limited Environments. Agronomy, 12(8), 1868. https://doi.org/10.3390/agronomy12081868