Article

Transcriptome and Metabolome Analyses of Salt Stress Response in Cotton (Gossypium hirsutum) Seed Pretreated with NaCl

1
State Key Laboratory of Desert and Oasis Ecology, Xinjiang Institute of Ecology and Geography, Chinese Academy of Sciences, Urumqi 830011, China
2
Fukang Station of Desert Ecology, Chinese Academy of Sciences, Fukang 831505, China
3
College of Agriculture, Xinjiang Agricultural University, Urumqi 830052, China
*
Author to whom correspondence should be addressed.
Agronomy 2022, 12(8), 1849; https://doi.org/10.3390/agronomy12081849
Submission received: 6 July 2022 / Revised: 10 July 2022 / Accepted: 12 July 2022 / Published: 4 August 2022

Abstract

:
Abiotic stresses adversely influence crop productivity and salt stress is one limiting factor. Plants need to evolve their defense mechanisms to survive in such fluctuating scenarios at either the biochemical, physiological, or molecular level. The analytical/critical investigations of cotton (Gossypium hirsutum) plants that involve looking into transcriptomic and metabolomic profiles could give a comprehensive picture of the response of the cotton plant to salt stress. This study was conducted on pre-treated cotton seeds by soaking them in a 3% sodium chloride (NaCl) solution at room temperature for 0.5, 1, and 1.5 h. In total, 3738 and 285 differentially expressed genes (DEGs) and metabolites, respectively, were discovered. The prominent DEGs included AtCCC1, EP1, NHE, AtpOMT, GAST1, CLC-c, ARP, AtKIN14, AtC3H2, COP9, AtHK-2, and EID1 to code for the regulation of seed growth, abscisic acid receptor PYR/PYL, a cellular response regarding stress tolerance (especially to salt) and germination, jasmonic acid, salicylic acid, and auxin-activated signaling pathways. A more significant amount of transcription factors, including the ethylene-responsive TFs ERF (205), bHLH (252), ZF-domains (167), bHLH (101), MYB (92), NAC (83), GATA (43), auxin-responsive proteins (30), MADs-box (23), bZIP (27), and HHO (13) were discovered in samples of NaCl-pretreated cotton seedlings under different treatments. The functional annotations of DEGs exposed their important roles in regulating different phytohormones and signal-transduction-mediated pathways in salt-treated seeds. The metabolites analysis revealed differential accumulation of flavonols, phenolic acid, amino acids, and derivatives in seedling samples treated for 0.5 h with NaCl. The conjoint analysis that showed most of the DEGs were associated with the production and regulation of glucose-1-phosphate, uridine 5′-diphospho-D-glucose, and 2-deoxyribose 1-phosphate under salt stress conditions. These results indicated positive effects of NaCl 0.5 h treatments on seedlings’ germination and growth, seemingly by activating specific growth-promoting enzymes and metabolites to alleviate adverse effects of salt stress. Hence, seed pre-treatment with NaCl can be beneficial in future cotton management and breeding programs to enhance growth and development under salt stress.

1. Introduction

Salinity stress is among the most prominent stresses (abiotic) usually faced by cotton (Gossypium hirsutum) crops around the globe. Salinization hinders the sustainable productivity and development of plants by negatively influencing the metabolic and biological pathways [1]. The increasing amount of NaCl, MgCl2, and CaCl2 as a consequence of many activities, such as wastewater treatment, freshwater channel alterations, or deicing of roads with salt applications is deteriorating the natural environment [2,3]. Tolerance against abiotic stress involves a consortium of several different biological processes [4,5,6,7]. The major essential systems involved are stress signaling, osmotic adjustment, antioxidant metabolism, hormone metabolism, and others [8]. The hypertonic salt solution in the plant cell may create different alterations, such as osmolytes or reactive oxygen species production, altered membrane integrity, and balance of Ca+2 and K+ ions [9,10]. There are different toxic effects of osmotic stresses and salts, e.g., Na+ and Cl ions, on seed germination of the crop plants [2,11]. A characteristic trend of plant cell response to NaCl stress is increased ROS and Ca+2 ion concentrations followed by high expression levels of transcription factors (TFs), including MYC/MYB, bZIP, NAC, and CBF/DREB. These TFs trigger the production of salt-responsive proteins in the plant by switching on the respective genes that consequently enhance tolerance against the saline environment [4]. Moreover, the activation of the regulatory mechanism in response to saline stress occurs, which is a signaling pathway for salt sensitivity (SOS) that primarily controls potassium (K+)/sodium (Na+) homeostasis [6,12,13]. The capability of plants to tolerate salinity varies among different species, indicating the presence of varying salt stress regulatory mechanisms [5,14]. Hence, discovering different molecular and biochemical principles related to salinity tolerance would help scientists to develop tolerant crop varieties.
Upland cotton is classified as moderately tolerant to salt and can withstand a saline medium without being significantly harmed, which is comparable to other major cash crops [1,2,15]. Moreover, the cultivars of G. hirsutum vary considerably regarding their tolerance toward salinity. Salinity can be a possible severe threat to cotton productivity [16]. The sensitivity of the crop to the salinity condition is highly specific to the growth stage and salt type. Understanding the response of the cotton crop to salt, its tolerance mechanism, and comprehensive knowledge related to management practices may be helpful [1,17]. Recently, many advanced studies, such as whole-genome sequencing, on different cotton species (diploid and tetraploid) facilitated us with the reference genome(s) of cotton for a better understanding of genes and transcription factors in relation to their functions under stress conditions in terms of controlling several biological and metabolic pathways [2,6,14,16,17,18,19,20].
Various reported studies revealed that emergence/germination and seedling stages exhibit more sensitivity to salt stress than the later stages [21,22,23,24,25,26]. Salt stress ultimately affects crop productivity by inhibiting growth, delaying flowering, lowering fruiting nodes, fruit shedding, and lowering the boll weight. Depression in metabolic enzyme activities, including cytokinins, salicylic acid, alkaline invertase, acidic invertase, and sucrose phosphate synthase, may deteriorate the fiber quality under salt stress [2,6,27]. The molecular mechanism behind this tolerance can logically be understood by detecting and examining the genes expressed when the plant roots experience salinity in their growing medium/environment. In previous studies, numerous genes were discovered to be expressed in response to a salt stress condition and used to develop various cotton cultivars. A few of those discovered genes are GhMT3a [28], GhZFP1 [29], GhRLK [30], GhDREB [31], GhWRKY [32,33], and GhNAC [34,35]. Every gene that gets turned on in response to abiotic stresses produces a crucial function-performing protein that is involved in complicated signaling mechanisms to combat the situation.
As far as the expression patterns of salt-responsive gene families in cotton are concerned, numerous genome-wide studies [17,36,37,38] have been conducted to date. In previous investigations, the microarray comparison tests helped discover many salt-sensitive and tolerant cultivars of cotton [39]. A significant amount of unigenes was identified in cotton by Zhang et al. [40] through a suppression subtractive hybridization approach that was applied to roots growing in a saline medium [40]. The strategy first required sufficient knowledge of involved gene sets [41]. In the recent decade, bioinformatics tools and next-generation sequencing (NGS) technologies have made significant advancements that aided in identifying and characterization of related differentially expressed genes (DEGs). For example, as shown in previous research investigations, a substantial amount of up- and down-regulated genes were discovered with Solexa sequencing [42], and TFs, unigenes, and miRNAs were identified through Illumina sequencing [43] in cotton accessions grown in the NaCl stressed environments.
Previous transcriptome results from cotton studies are insufficient to detect definite salt-responsive genes due to reasons such as an insufficient annotated genome and reference database. Now, upland cotton’s quality class reference genome is at hand and can be efficiently utilized to investigate relevant transcriptome profiles [44,45,46]. The transcriptome data of investigated samples of cotton genotypes tested in the stressed environment could be analyzed to detect DEGs and putative hub genes using co-expression network analysis.

2. Materials and Methods

2.1. Experimental Material

The experiment was conducted in pots in a greenhouse in mid-September 2021. The soil used for experimentation was collected from the wasteland of the experimental farm at Fukang Station of Desert Ecology, Chinese Academy of Sciences. The soil texture was alluvial with a gray color and the following physio-chemical properties: “salt content (14.63 mgg−1), electrical conductivity (EC) (4088 µScm−1), Ca2+ (1.776 mgg−1), K+ (0.265 mgg−1), Mg2+ (0.182 mgg−1), Cl (0.537 mgg−1), Na+ (2.473 mgg−1), SO42− (8.49 mgg−1) and pH 8.03”. For the seed pretreatment, soaking of cotton seeds was carried out using 3% sodium chloride solution at room temperature in the laboratory for 0.5 h (N0.5), 1 h (N1), and 1.5 h (N1.5), with three replicates per treatment. This 3% solution was used based on our previous experiment where we optimized the NaCl concentrations using (0%, 1%, 2%, 3% and 4%) solutions, with the 3% solution giving the best results for pretreatment. After the pre-treatment, the seeds were taken out immediately and rinsed with clean water for 25 min. On the 10th day after planting (DAP), 100 mL of water was applied gently to avoid damage to germinated seedlings. Ten selected seeds were planted using a metallic cylinder with a 13 cm height and 8.5 cm internal diameter inside triplicated pots per treatment with 350 g of soil. Approximately 170 mL of water was poured into each pot. The soil was gently pressed to ensure full contact of the seeds with the soil. The seeds were covered with 0.2 cm of surface soil. At 10 DAP, the germination percentage was counted as germination percentage (10 DAP). At 25 DAP, the final plant population as a germination percentage (25 DAP) was calculated and the plants were carefully removed from the pots; the shoots and roots were separated from each other to obtain the fresh weight of their aboveground (stem and leaves) and underground parts (roots) separately with the help of electronic balance.

2.2. RNA Isolation and Sequencing

Twelve randomly selected seedlings from each replication and each treatment were considered for a sample collection from the root and leaf tissues. Collected samples were instantly placed in liquid nitrogen prior to storage under −80 °C. Qinghai Keju Biotechnology Co., Ltd. (Xining, China) conducted the RNA-sequencing (RNA-seq) and generated 12 libraries (4 × 3) on an Illumina HiSeq 2000 platform and sequencing of the above- and underground plant tissues using TRIzol reagent. For this purpose, the following were the main steps followed: RNA sample purification, cDNA synthesis, joint-addition, and amplification plus quality detection of DNA libraries; some other steps were also followed using transcriptome sequencing. Afterward, the raw sequenced read quality was improved by deserializing and removing the low-quality ones. After the quality improvement, reassembling of the transcriptome data was carried out with the help of Velvet/Oases software (http://www.ebi.ac.uk/~zerbino/oases/, accessed on 19 November 2021). Furthermore, cleaned reads were obtained at Q20 and Q30, followed by the calculation of the GC contents.

2.3. Functional Annotation

After sequencing, the raw reads obtained were filtered to obtain clean and high-quality reads by eliminating the low-quality basis with Q-value ≤ 20, poly-N > 10%, and adaptors using ‘fastp’ (version 0.18.0) [47]. Simultaneously, the GC contents, Q20, and duplication level of the sequence in clean data were assessed. This high-quality clean data obtained were utilized across onward downstream analyses. The Bowtie2 (version 2.2.8) tool [48], aligned short reads with mRNA on the RNA database. The HISAT2 (version 2.4) software ([49], performed paired-end sequencing of clean reads with the reference genome. The StringTie (version 1.3.1) tool [50,51] was utilized to assemble the mapped clean reads using each sample’s reference-based approach. This software also gave the FPKM (fragment/kb of transcript/million mapped reads) values for each transcription region to estimate their variation and abundance of expression. The threshold value of the false discovery rate (FDR) for the significance of observed differential gene/transcript expression was kept at ≤0.05, with the absolute value of fold change being ≥2.

2.4. Differentially Expressed Genes (DEGs)

The differential expression of RNAs between two groups of samples was assessed with the help of the software package DESeq2 tool [52]. However, edgeR [53], was used to calculate the RNA differential expression between two samples. The gene ontology (GO) analysis [54], of mapped DEGs in the database (http://www.geneontology.org/, accessed on 19 November 2021) was accomplished by calculating their gene numbers regarding each GO term, followed by the hypergeometric test. It involved the evaluation of significant enriched GO terms related to DEGs while comparing the whole transcriptome background. The Blastall tool was utilized further to identify and annotate the significant enriched metabolic pathways related to the DEGs on the Kyoto Encyclopedia of Genes and Genomes (KEGG) database [55]. Furthermore, gene set enrichment analysis was carried out using GESA and MSigDB software [56] to determine the significant differences between genes regarding the GO terms and pathways.

2.5. Validation through qRT-PCR

To further validate the reliability of the DEGs in response to NaCl seed pre-treatment in cotton seedlings, ten randomly selected DEGs from cotton seedling samples were examined for their expression in response to NaCl seed pretreatment via quantitative real-time PCR (qRT-PCR) analysis. Total RNA was extracted from above- and underground plant parts using a TRIzol reagent (Invitrogen) by following the manufacturer’s protocol. Complementary DNA was synthesized using a PrimeScript RT reagent kit with a gDNA eraser (TaKaRa). Cotton Actin9 (GhActin9) was selected for normalization. Primers were designed in Primer Premier 5.0 (Premier Biosoft International, Palo Alto, CA, United States). Each 50 μL reaction sample was run on a Bio-Rad IQ2 sequence detection system with Applied Biosystems software. The relative expression was calculated using the 2−ΔΔCt method.

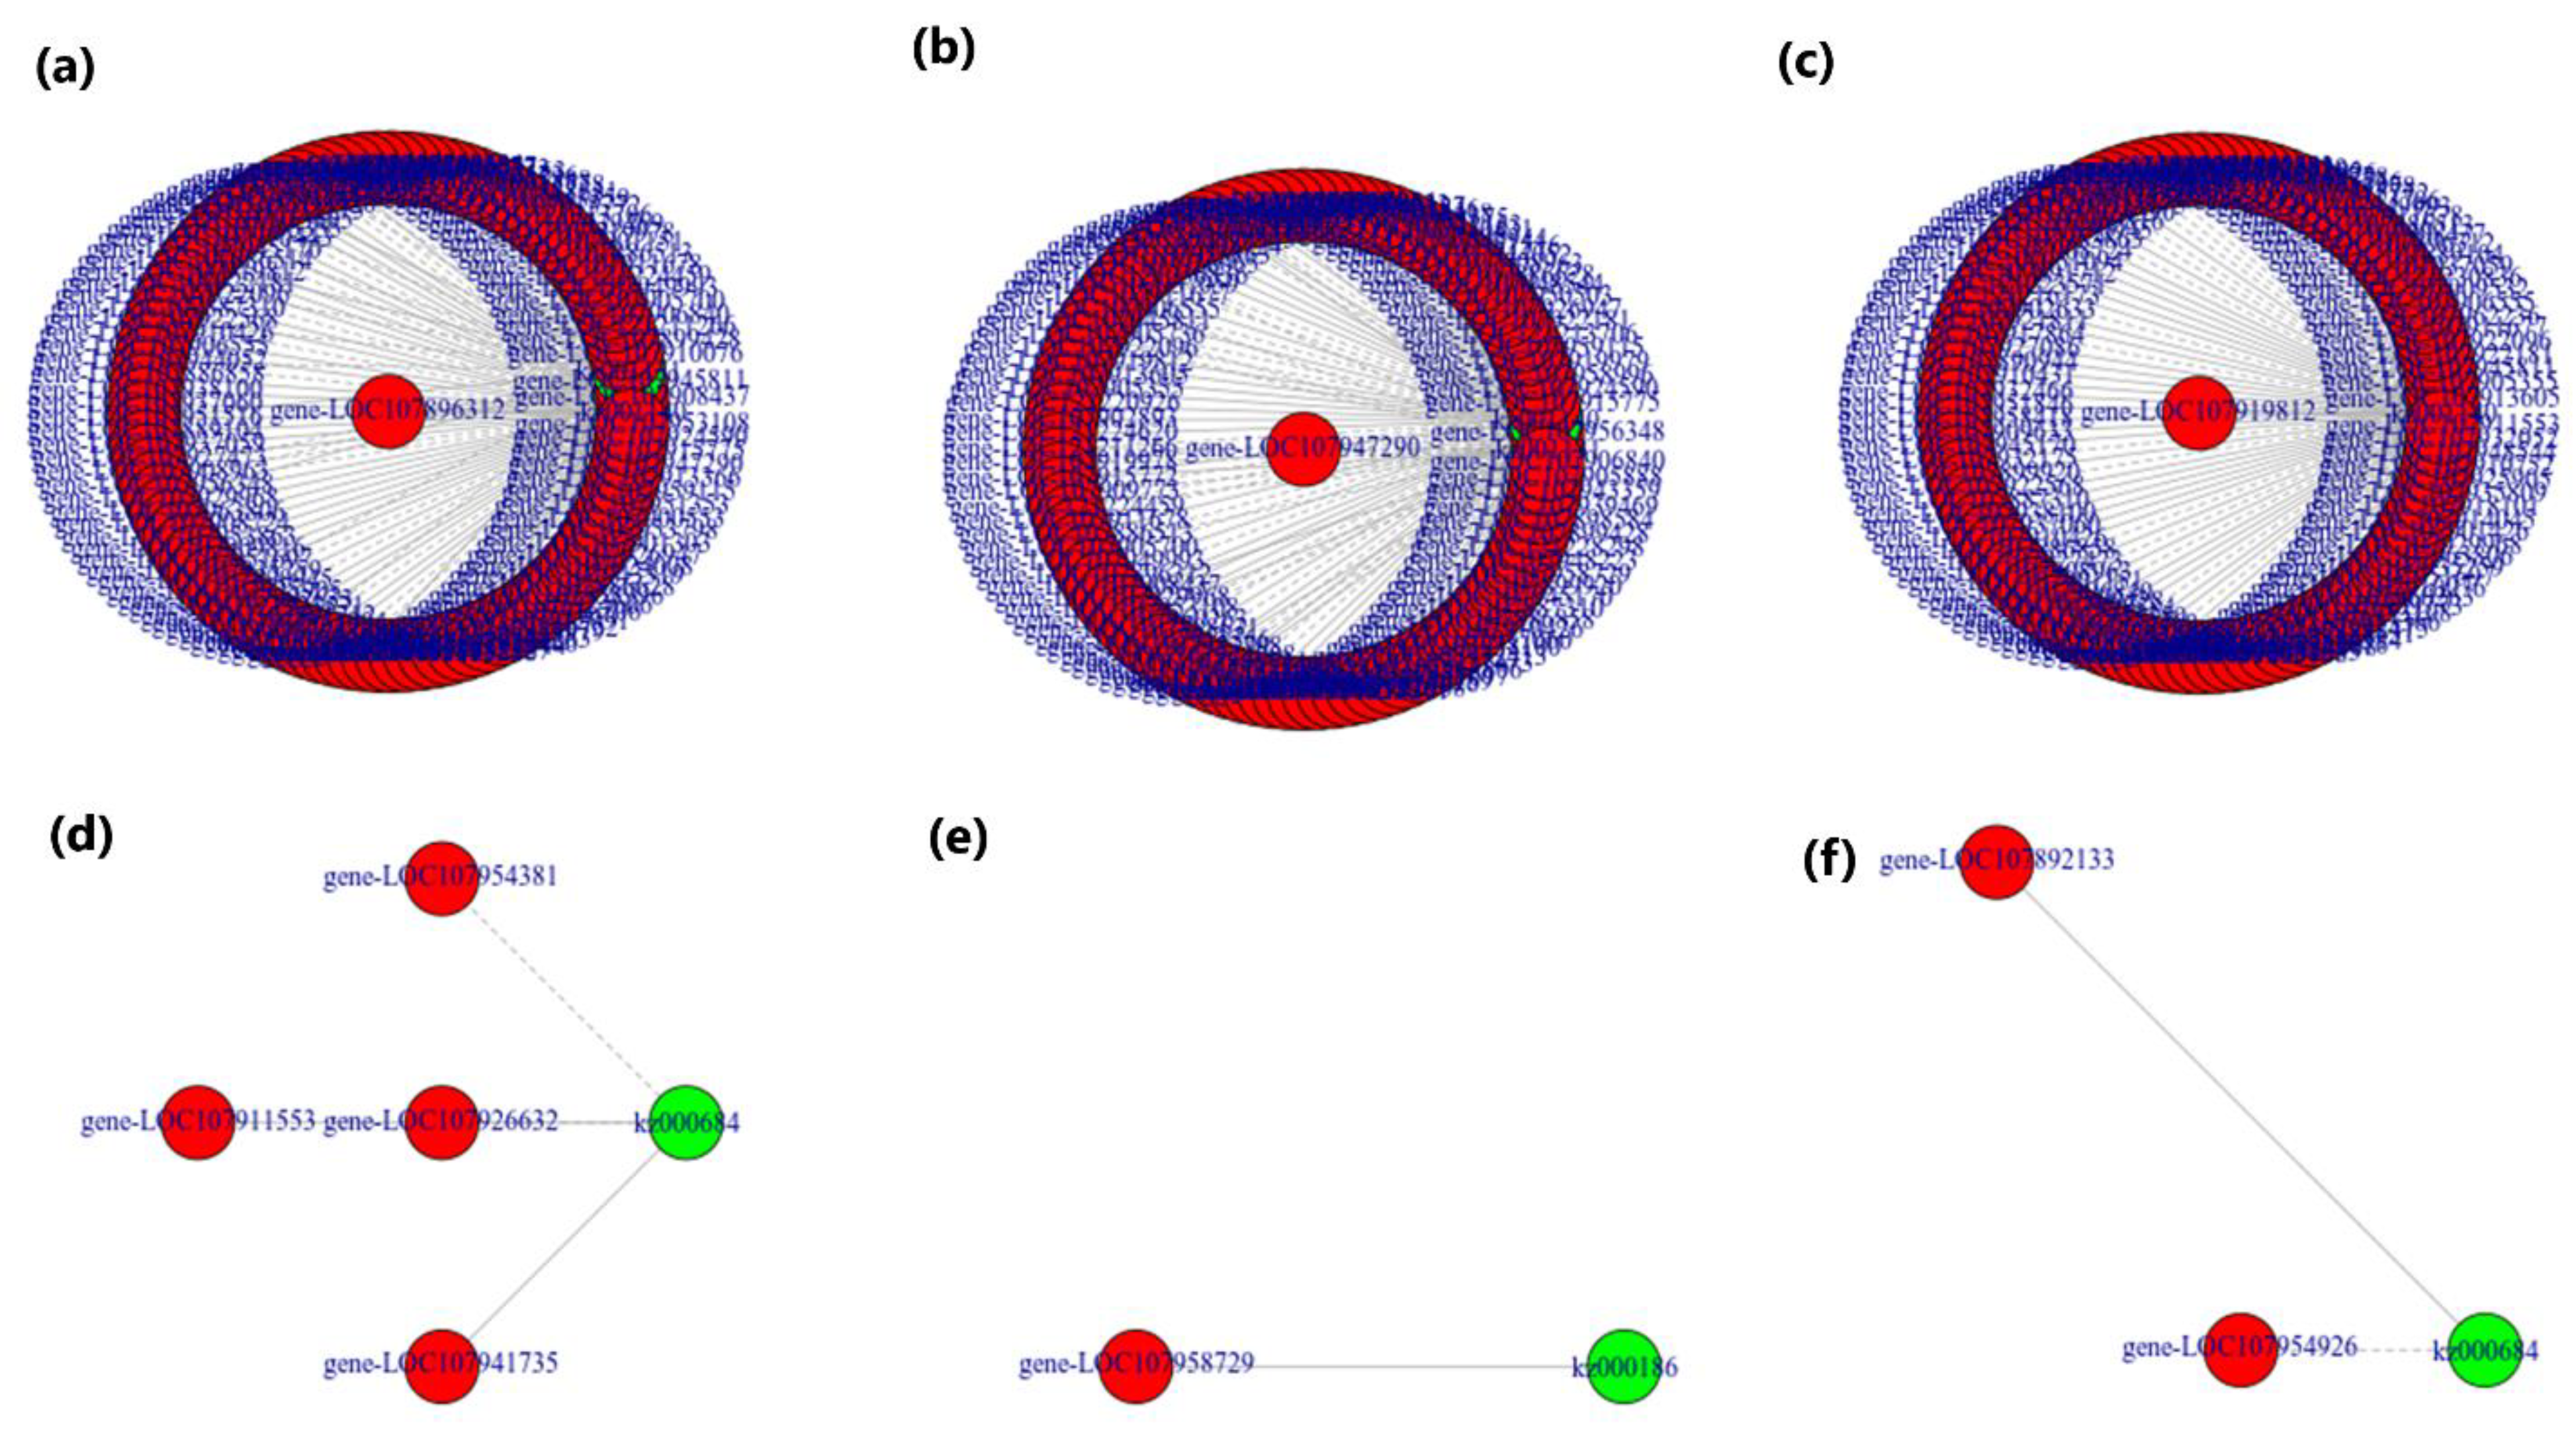
2.6. Network Analysis

The identified DEGs were further scrutinized while investigating their protein–protein interactions with the help of String v10 [57]. It gave networks of hub-genes harboring nodes and lines to reveal genes and interactions among them, respectively. The resultant files comprising these networks were visualized with the help of Cytoscape (version 3.7.1) software [58].

2.7. Metabolite’s Profiling

The sample preparation for the extraction and quantification of metabolites was performed by Norminkoda Biotechnology Co., Ltd. (Wuhan, China) [59]. An amount of 100 mg of vacuum freeze-dried cotton tissue (above- and underground plant parts) fine powder was dissolved in 1.0 mL methanol (70%) via a vortex for 30 min for 30 s each time and kept at 4 °C overnight. Then, after centrifugation at 12,000 rpm for 10 min, extracts were filtered (0.22 µm pore size) and analyzed via a UPLC-MS/MS system (UPLC, SHIMADZU CBM30A, www.shimadzu.com.cn/, accessed on 19 November 2021; MS/MS), (4500 QTRAP, http://sciex.com/, accessed on 19 November 2021). Metabolite quantification was carried out using triple and quadruple mass spectrometry through multi-reaction monitoring (MRM) analysis. LIT and triple quadrupole (QQQ) scans were developed on a triple quadrupole linear ion trap mass spectrometer (Q TRAP). The metabolite data were analyzed via principal component analysis (PCA), orthogonal partial least squares discrimination analysis (OPLS-DA), cluster analysis, and Pearson’s correlation analysis. R software was used to carry out the PCA, correlation, and cluster analyses [60]. The metabolites identified through them were subjected to the OPLS-DA model [61]; then, the metabolites with fold change >2 or <0.5 and variable importance in projection (VIP) values > 1 were taken as differential metabolites for the discrimination of treatments and control groups. Moreover, the KEGG pathway database (http://www.kegg.jp/kegg/pathway.html, accessed on 19 November 2021) (Kanehisa and Goto, 2000) was utilized for the classification and pathway enrichment analyses related to differentially accumulated metabolites (DAMs) to determine their related key pathways.

2.8. Data Analyses

Statistical data analyses were performed using SPSS 17.0 (SPSS, Chicago, IL, United States) and each result is presented as a mean with its SD. The significance level of analyzed triplicated data was determined using Student’s t-test (p < 0.05). DESeq2 R package was carried out differential expression analysis to obtain the DEGs. Benjamini and Hochberg’s approach was adapted for the p-value adjustments to minimize the FDR (false discovery rate). Only the genes with an adjusted p(padj) < 0.05 were categorized as DEGs. GO enrichment analysis related to these DEGs was implemented using the R package: clusterProfiler, where the gene length bias was considered for correction. GO terms with adjusted p-values (padj < 0.05) were termed as “significantly enriched”. Further determination of enriched pathways was carried out through KEGG, and the R package clusterProfiler was considered to determine the significant KEGG enriched pathways.

3. Results

The salinity effects on germination and growth of cotton seedlings were investigated by germinating 3%-NaCl-treated seeds in the laboratory. The emergence rate was determined on the 10th and 25th days after sowing. Then, on the 25th day after sowing, the germinated seedlings were collected for their above- (stem and leaves) and underground (root) part fresh weight measurements. Analysis of variance showed significant differences across different treatments for the abovementioned traits. As shown in Figure 1, the comparison of means displayed significant differences between NaCl treatments of seedlings from seeds pre-treated for 0.5, 1, and 1.5 h (Figure 1). The seed treatment for 0.5 h produced enhanced effects on seedling growth by influencing all the investigated parameters, i.e., germination percentage at 10 DAP and the survived plants as a final germination percentage was taken at 25 DAP, along with the roots and shoots fresh weight (Figure 1).

3.1. Transcriptome Profiling and Functional Annotations

The samples from three salt stress treatments were collected in triplicates 25 DAP. The number of raw reads obtained after RNA sequencing was about 635 million reads, which were filtered via the removal of adaptors and ambiguous or low-quality reads. Consequently, approximately 621 million (97.78%) clean reads were obtained. The Q20 value is the average Q20 of all bases in a read, which represents the ratio of bases with a probability of containing no more than one error in 100 bases. The Q30 value is the average Q30 of all bases in a read, which represents the ratio of bases with a probability of containing no more than one error in 1000 bases on average. A total of 7.74 Gb of clean bases were obtained from each seedling sample with a Q20 of 97.81% and a Q30 of 93.74%. The clean base data had percentages of guanine (G) and cytosine (C) bases in the clean data, i.e., GC contents, ranging between 45.03 and 46.59% (Table S1).
After the filtering procedure, about 681,572,380 clean reads were aligned against the reference cotton genome [62] using the HISAT2 program. A set of 605,007,315 (88.8%) total mapped reads was generated. They comprised 46,154,596 (6.8%) secondary alignments and 558,852,719 (82.02%) unique alignments sited in the seeding tissues genes (Table S2). These genes were annotated for their functions through GO (Table S4) and KEGG classifications (Table S5). For the classification of identified 65,573 expressed genes (Table S3) functions among the CK, N0.5, N1, and N1.5 treatment groups seedlings, the assembled transcripts have been annotated across various databases, i.e., Gene Ontology (GO) and Kyoto Encyclopedia of Genes and Genomes (KEGG), for the sake of homologous alignment with the reference genome. The discovered expressed genes were categorized through GO term classification as biological processes, cellular components, and molecular functions (Figure 2). Further details revealed 40,983 highly expressed genes (FPKM > 1) with a maximum number related to molecular functions of 34,226, followed by biological processes with 4745 and cellular components with 1812 (Table S4).
The KEGG pathway analysis revealed 20,372 highly expressed genes related to 127 significant KEGG pathways. The largest class observed was of ribosomes: ko03010 (1006), followed by plant hormone and signal transduction: ko04075 (898), carbon metabolism: ko01200 (689), starch and sucrose metabolism: ko00500 (648), biosynthesis of amino acids: ko01230 (616), and protein processing in the endoplasmic reticulum: ko04141 (607). These outcomes gave information regarding the activation of DEGs in seedling samples treated with NaCl for 0.5 h, as the salt-stress-related genes were expressed in these treated samples. The expression profiles revealed their significant roles in the hormones and signal transduction, carbohydrates metabolism, and biosynthesis of amino acids, promoting salt stress tolerance (Table S5).
The FPKM values based on the gene expression level of 65,575 genes in samples from control and different treatments of 3% NaCl after 0.5, 1, and 1.5 h of soaking were demonstrated through violin plots (Figure 2a). The PCA analysis illustrated that the biological replicates of CK and all the treatments were grouped (Figure 2b).

3.2. Identification of DEGs in CK and Treated Cotton Seedlings

For the prediction of candidate genes controlling the salt tolerance mechanism, the difference in the amount of gene expression in the sample was considered for the DEGs, where the log2 (fold change) was logFC < 1 for down-regulated genes and logFC > 1 for up-regulated genes (p < 0.05) in CK as compared with cotton seedling samples treated with NaCl for 0.5, 1, and 1.5 h. A total of 28,884 DEGs were discovered across the CK and treatment comparisons of cotton seedling samples (Table S6a).
The identified DEGs with up- and down-regulated expressions across CK and treatment comparison groups were as follows: CK vs. N0.5: 19,686 (up-regulated 11,866; down-regulated 7819), CK vs. N1: 18,701 (up-regulated 11,864; down-regulated 6837), CK vs. N1.5: 22,799 (up-regulated 13,779; down-regulated 9220), N0.5 vs. N1: 1,26 (up-regulated 1086; down-regulated 740), N0.5 vs. N1.5: 1804 (up-regulated 1996; down-regulated 808), N1 vs. N1.5: 2952 (up-regulated 1300; down-regulated 1652) (Figure 3, Table S6b).
Further exploration of transcriptional changes among the treated cotton seedling sample groups illustrated co-expression of 13,364 DEGs between the CK-vs.-N0.5, CK-vs.-N1, and CK-vs.-N1.5 comparisons, and 63 DEGs between the N0.5-vs.-N1, N0.5-vs.-N1.5, and N1-vs.-N1.5 comparisons. The maximum number of DEGs, i.e., 3281, was commonly expressed in the comparison group CK-vs.-N0.5 and CK-vs.-1.5 regarding salinity tolerance (Figure 4).

3.3. Functional Annotation of DEGs

For the identified DEG functions among the CK, 0.5, 1, and 1.5 h treatment groups of seedlings, the annotated transcripts were explored for their functions related to salt stress tolerance and related functions. We discovered 3738 DEGs categorized through GO term classification as biological processes, cellular components, and molecular functions (Table S7). Among them, many DEGs concerning different biological and metabolic processes included cation-chloride cotransporter 1 (AtCCC1), EP1-like glycoprotein, sodium/hydrogen exchanger (NHE), dicarboxylate transporter (AtpOMT), GAST1 protein, chloride channel protein (CLC-c), ABA-regulated RNA-binding protein (ARP), kinesin-like protein (AtKIN14), AtC3H2, COP9 signalosome complex, histidine kinase 2 (AtHK-2), and EID1-like F-box protein. These are responsible for the following functions: response to salt stress, cellular response to salt stress, abscisic acid receptor PYR/PYL, regulation of seed growth and germination, auxin-activated signaling pathways, response to abscisic acid, and gibberellic acid-mediated signaling pathways. Likewise, a significant count of DEGs related to sodium ions’ different molecular functions was identified. These included sodium ion homeostasis (GO:0005524), response to sodium salt (GO:1904383), sodium ion imports across the plasma membrane (GO:0098719; GO:0015081; GO:0006814), sodium:proton antiporter activity (GO:0015385), and sodium:potassium:chloride symporter activity (GO:0008511). Other salt-stress-related DEGs included chloride ion homeostasis (GO:0055064), chloride transmembrane transport (GO:1902476), response to salt stress (GO:0009651), and regulation of seed germination (GO:0010029; GO:0009845; GO:0010187). Some DEGs related to growth-regulating hormonal pathways included gibberellic acid-mediated signaling pathway (GO:0009740), response to auxin and auxin-mediated signaling pathways (GO:0009733; GO:0009734), jasmonic acid-mediated signaling pathways (GO:0009867), response to abscisic acid (GO:0009737), regulation of root meristem growth (GO:0010082), root hair cell differentiation (GO:0048765), regulation of shoot system development (GO:0048831), regulation of salicylic acid-mediated signaling pathway (GO:2000031), and response to osmotic stress (GO:0006970) (Table S7). A sum of 1799 transcription factors was found in the discovered DEGs’ functional annotations. A significant count of ethylene-responsive transcription factors ERF (205) was identified with differential expressions, followed by zinc finger CCCH domain (167), WRKY (151), bHLH (101), MYB (92), NAC domain-containing protein and TF (83), GATA (43), scarecrow-like proteins (40), auxin-responsive protein (30), MADs-box (23), bZIP (27), HHO (13), and many others in the pre-treated cotton seedling samples (Table S7).

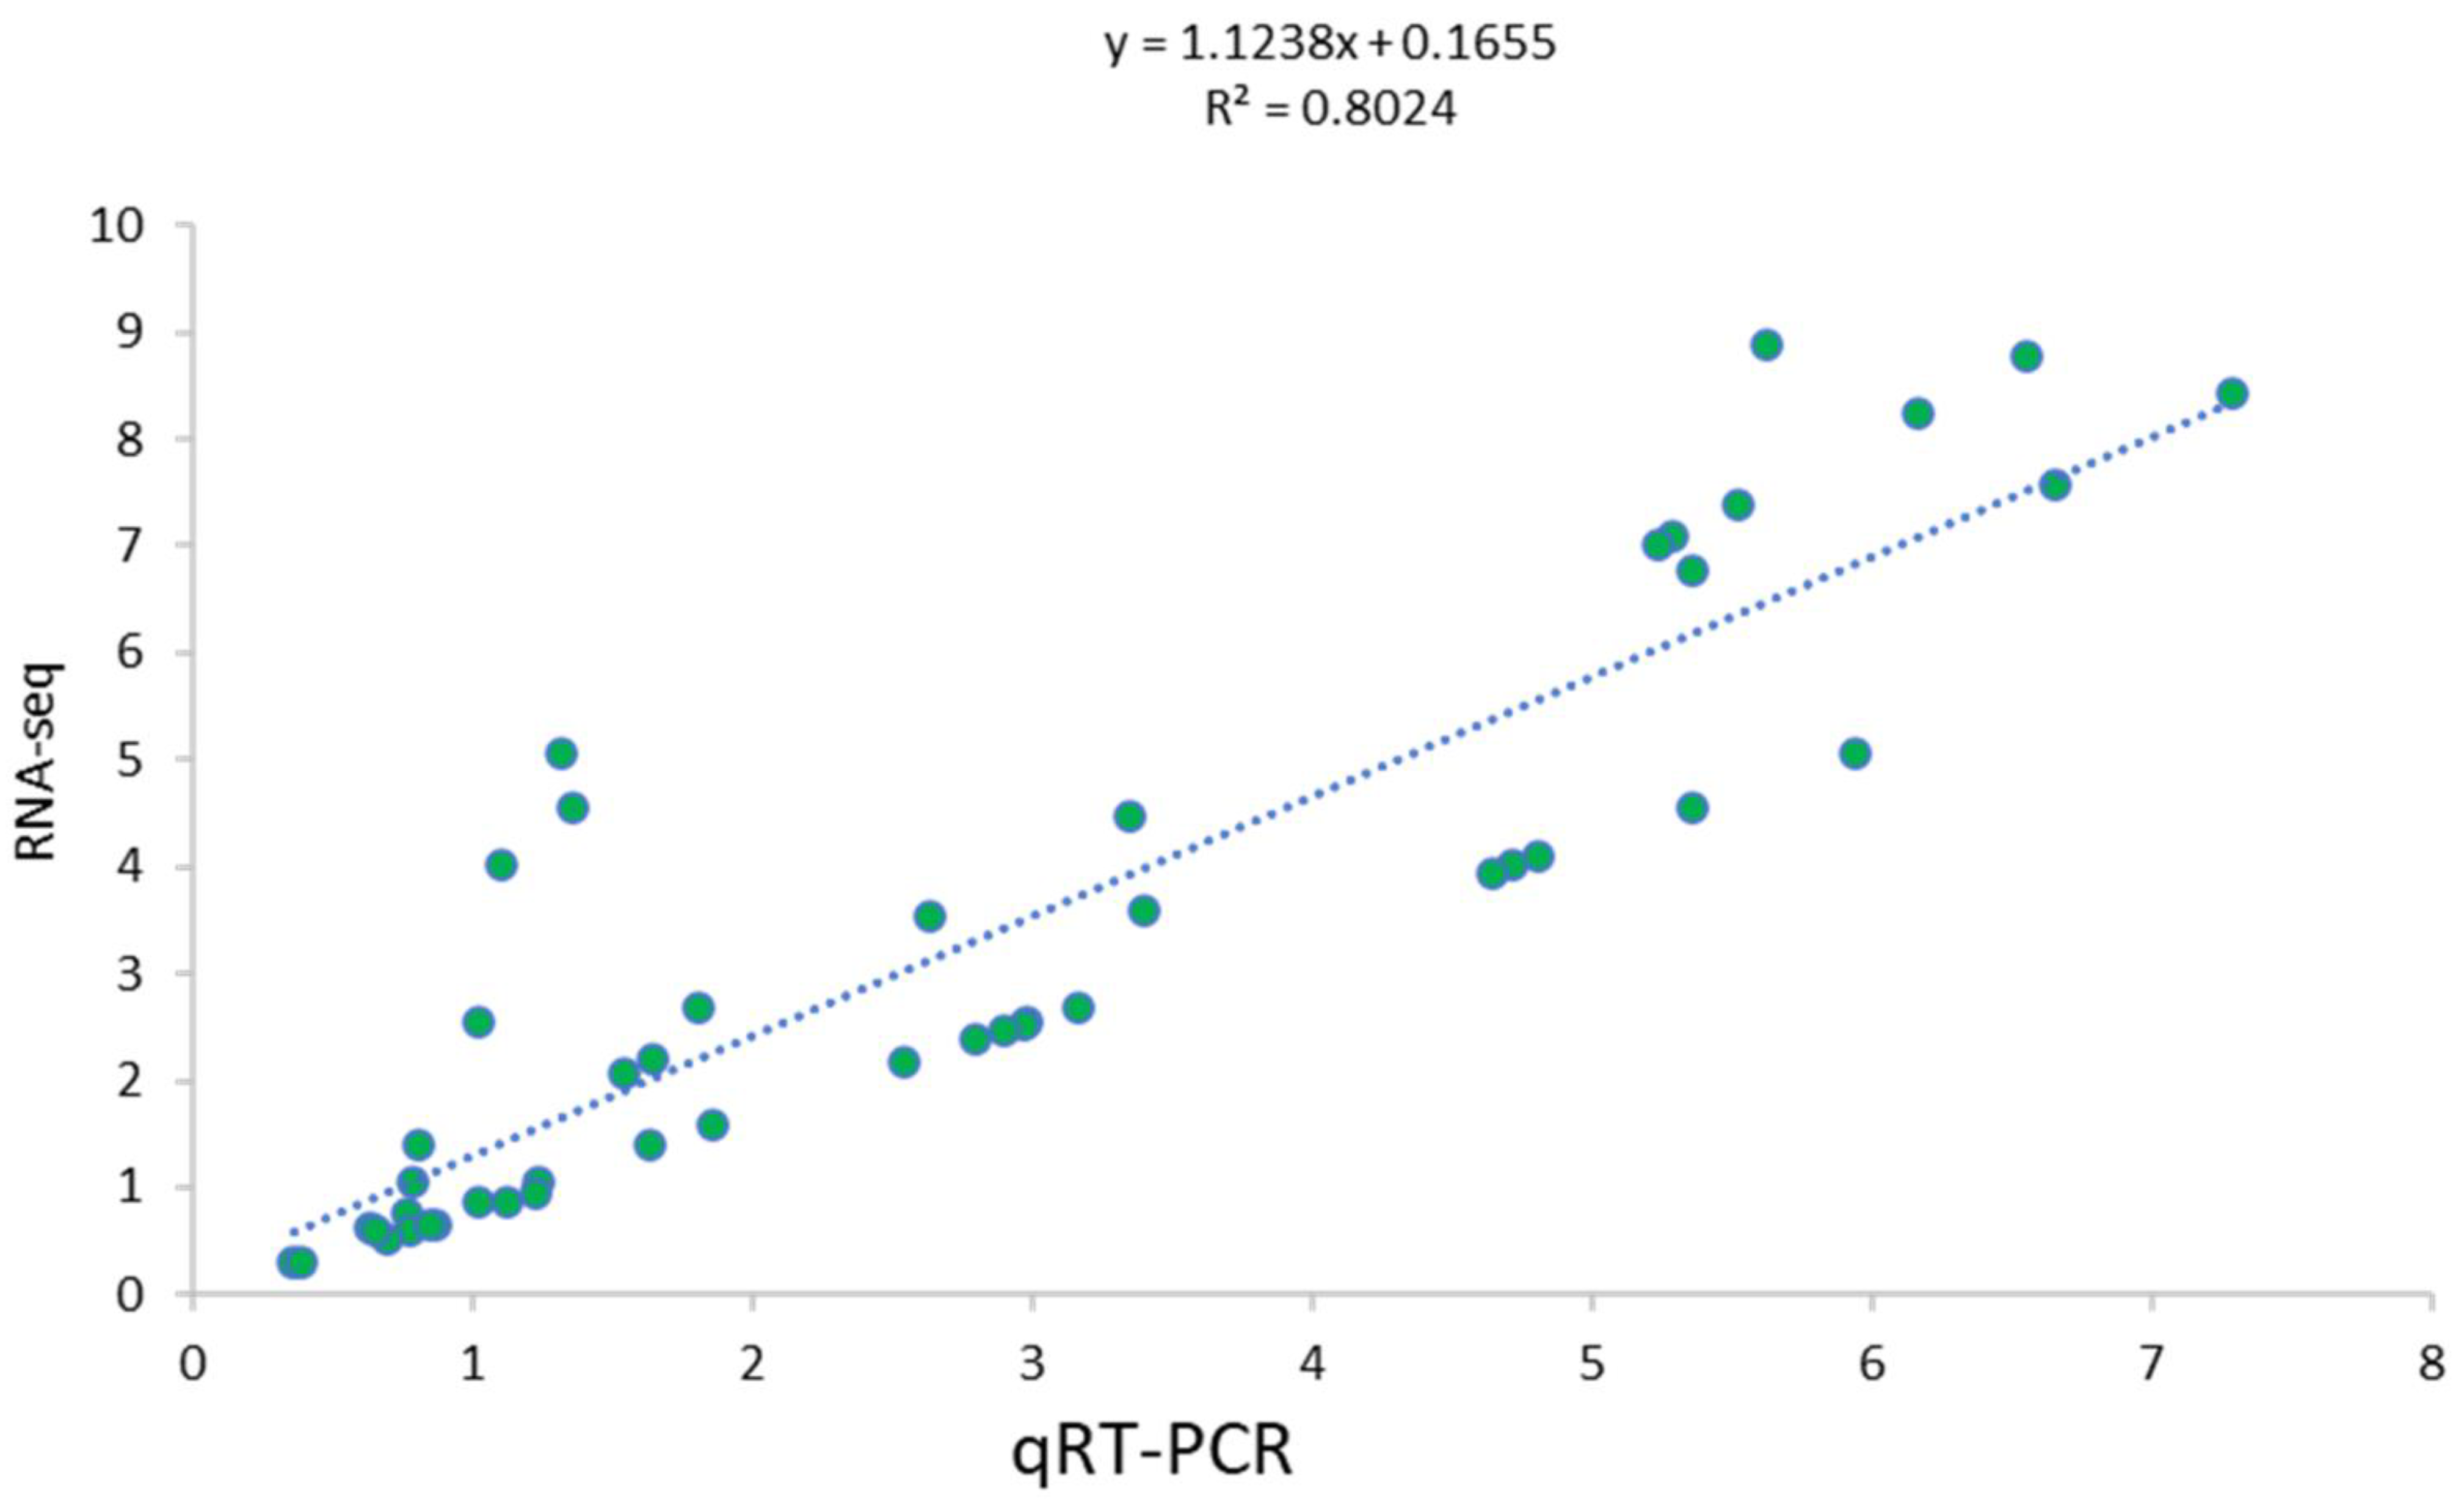
3.4. Validation Using qRT-PCR

By integrating the transcriptome data with metabolomics, 10 randomly selected genes were considered to verify the changes in their expression through qRT-PCR (Table S8). A considerable amount of similarity was observed between the transcriptome and qRT-PCR results, inferring the reliability of our reported results. The results showed that there was good consistency between the expression levels of the eight genes analyzed using qRT-PCR and their levels detected using RNA-seq (Figure 5).

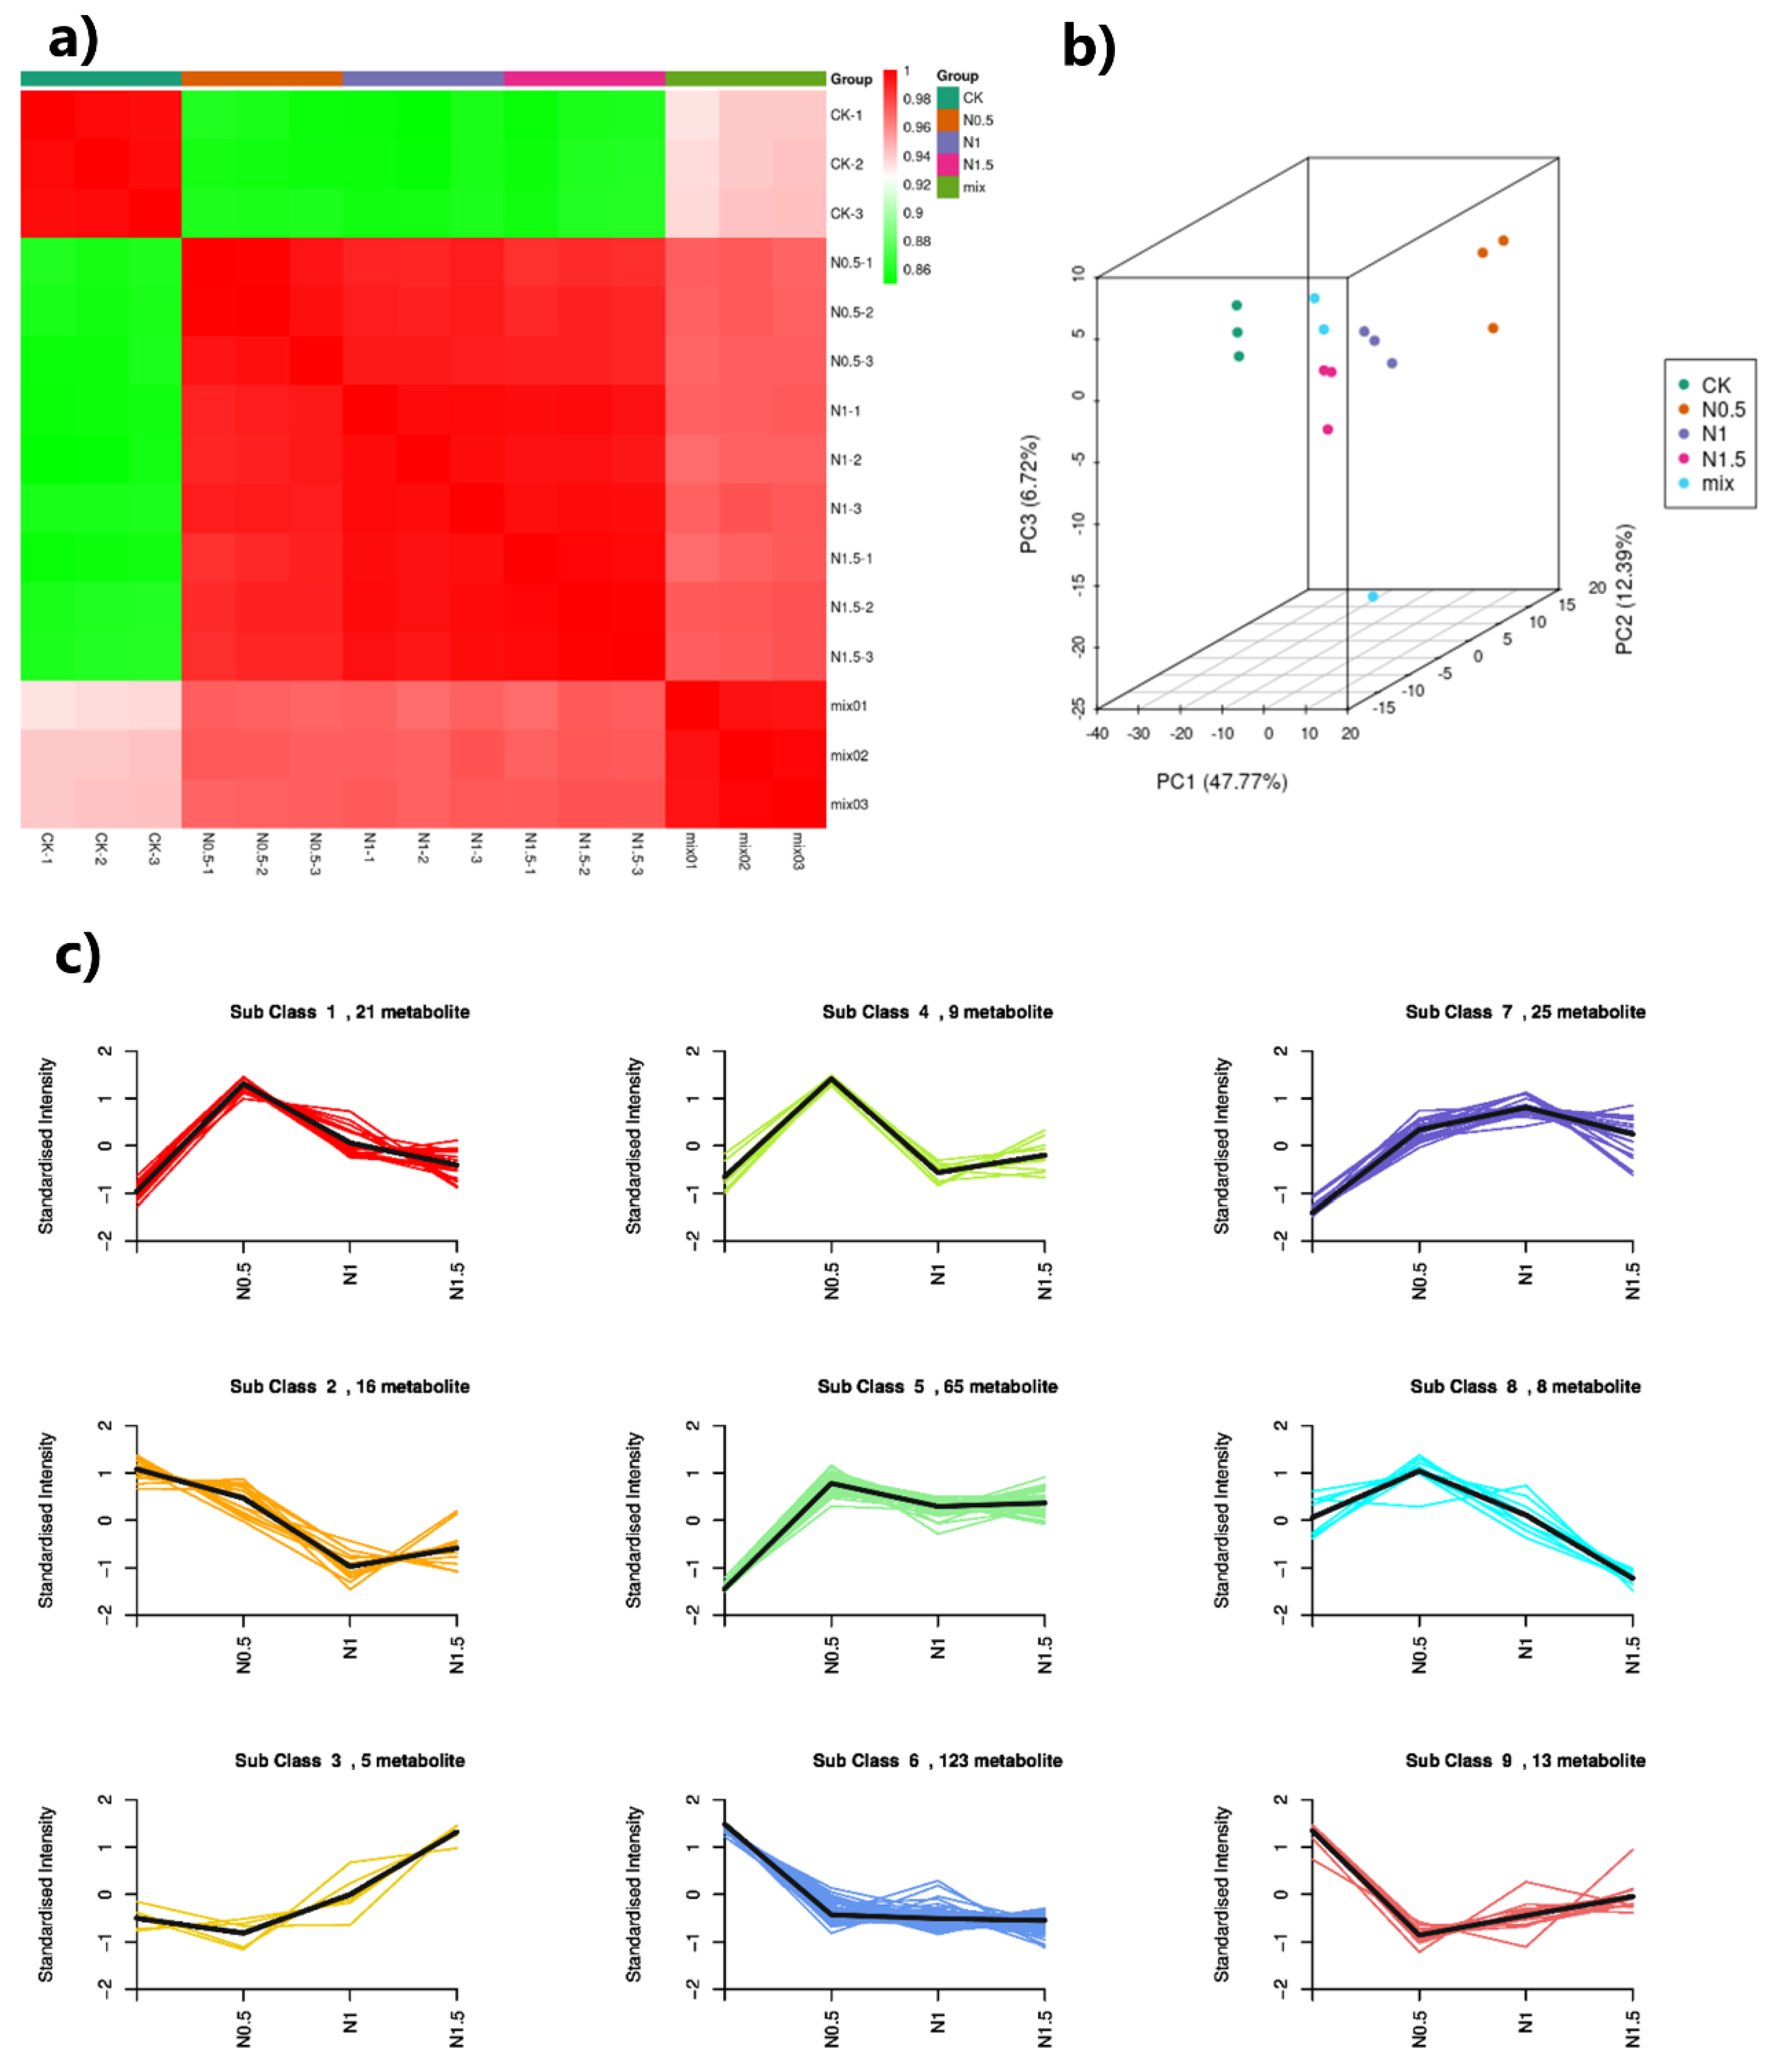
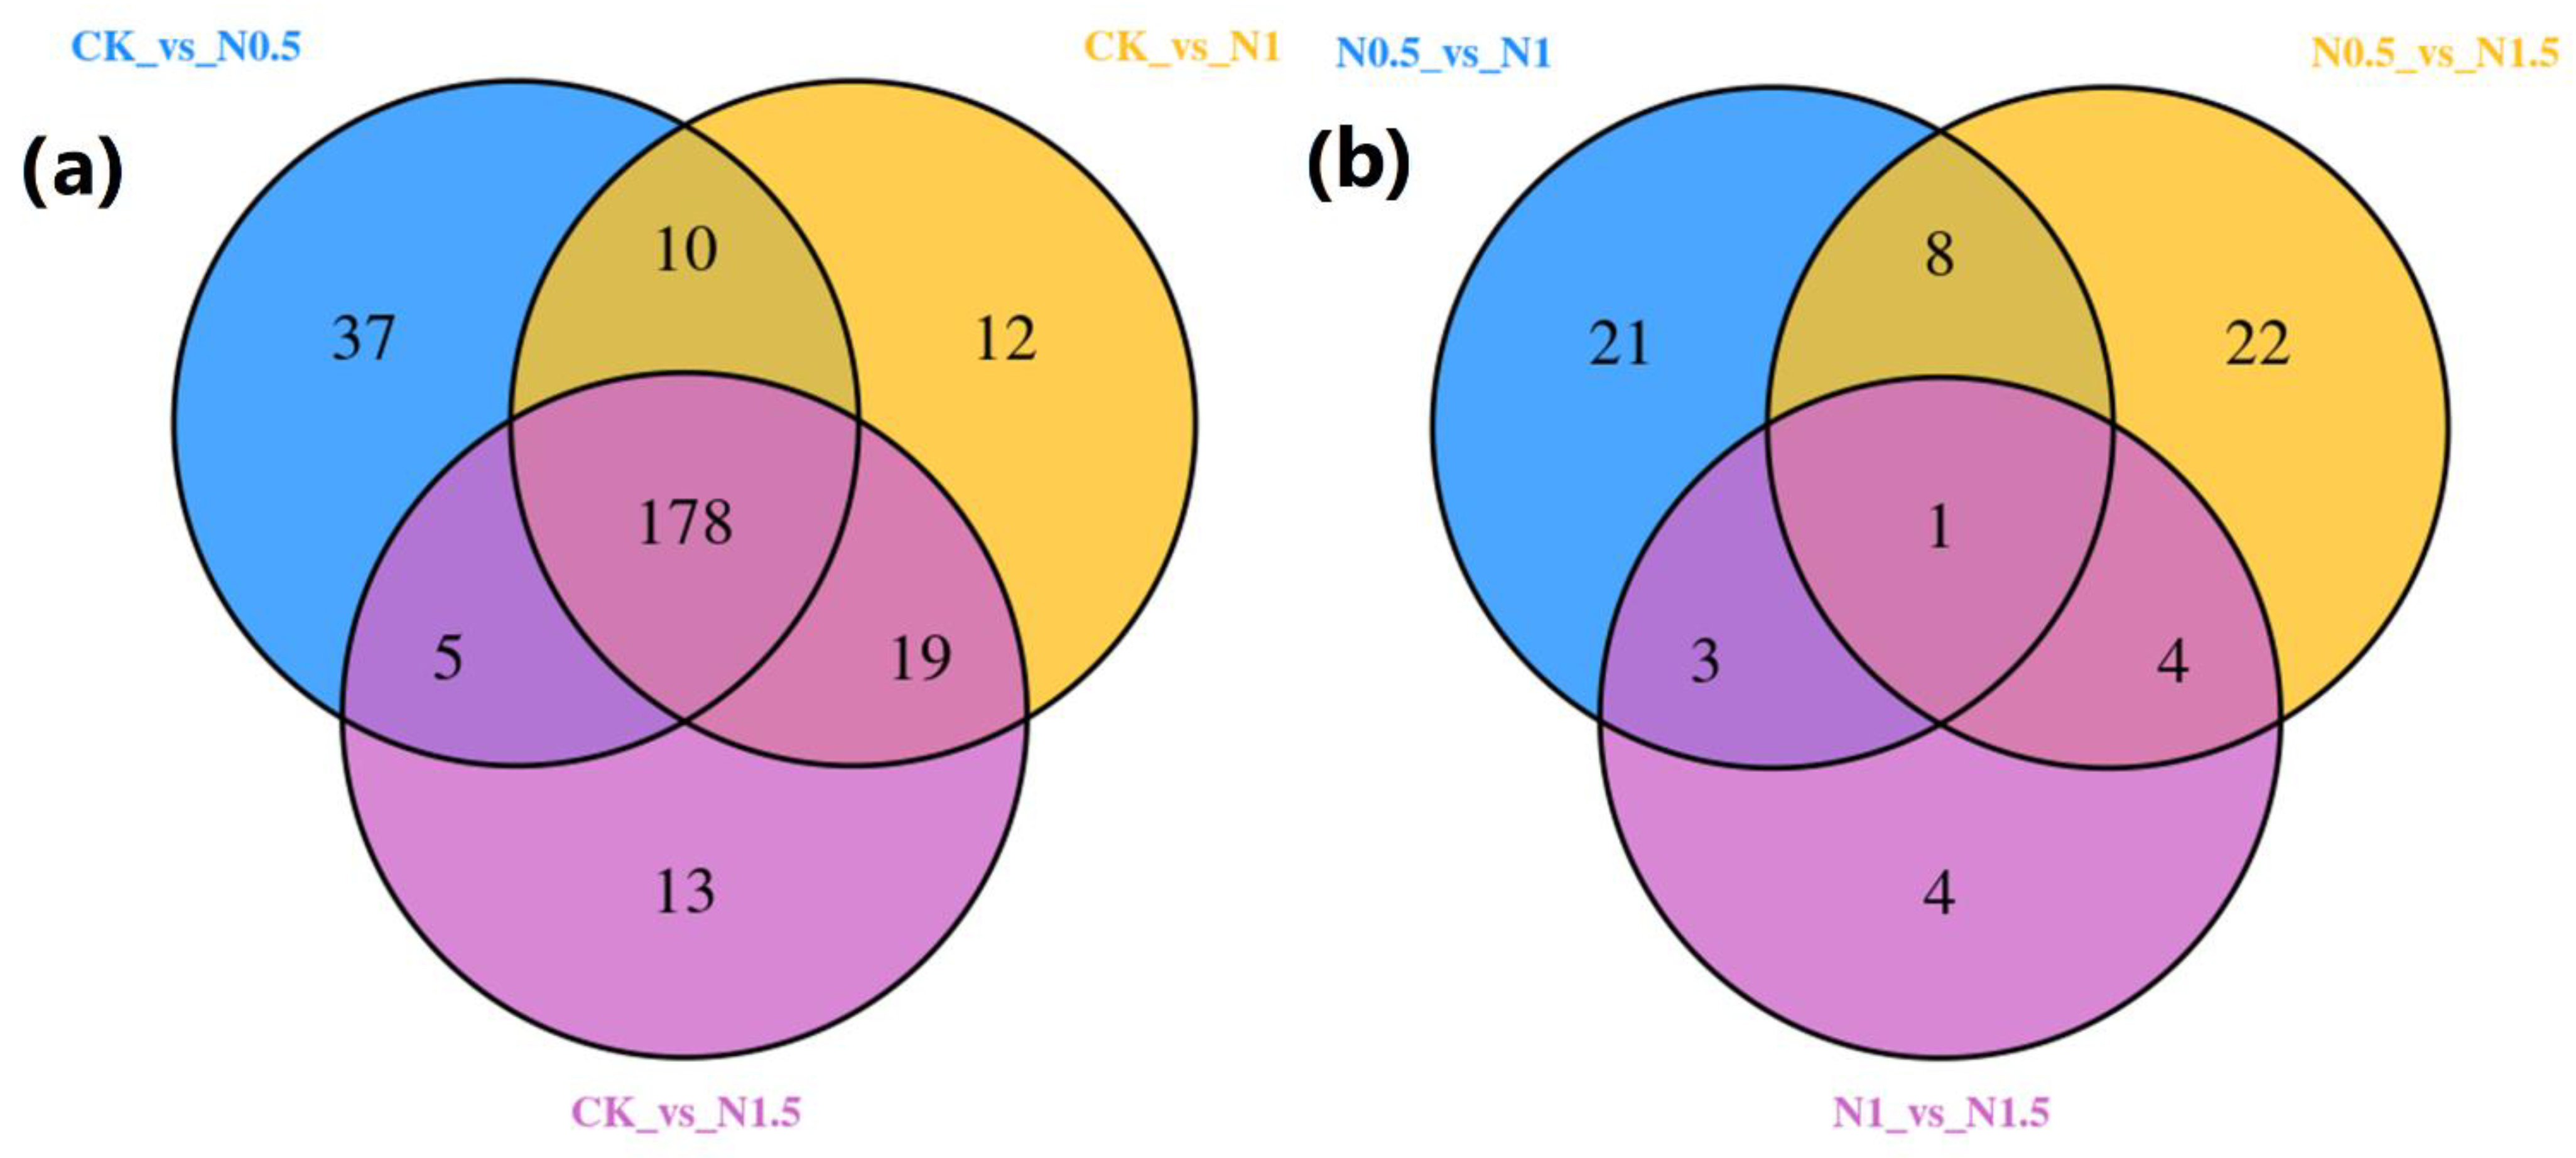
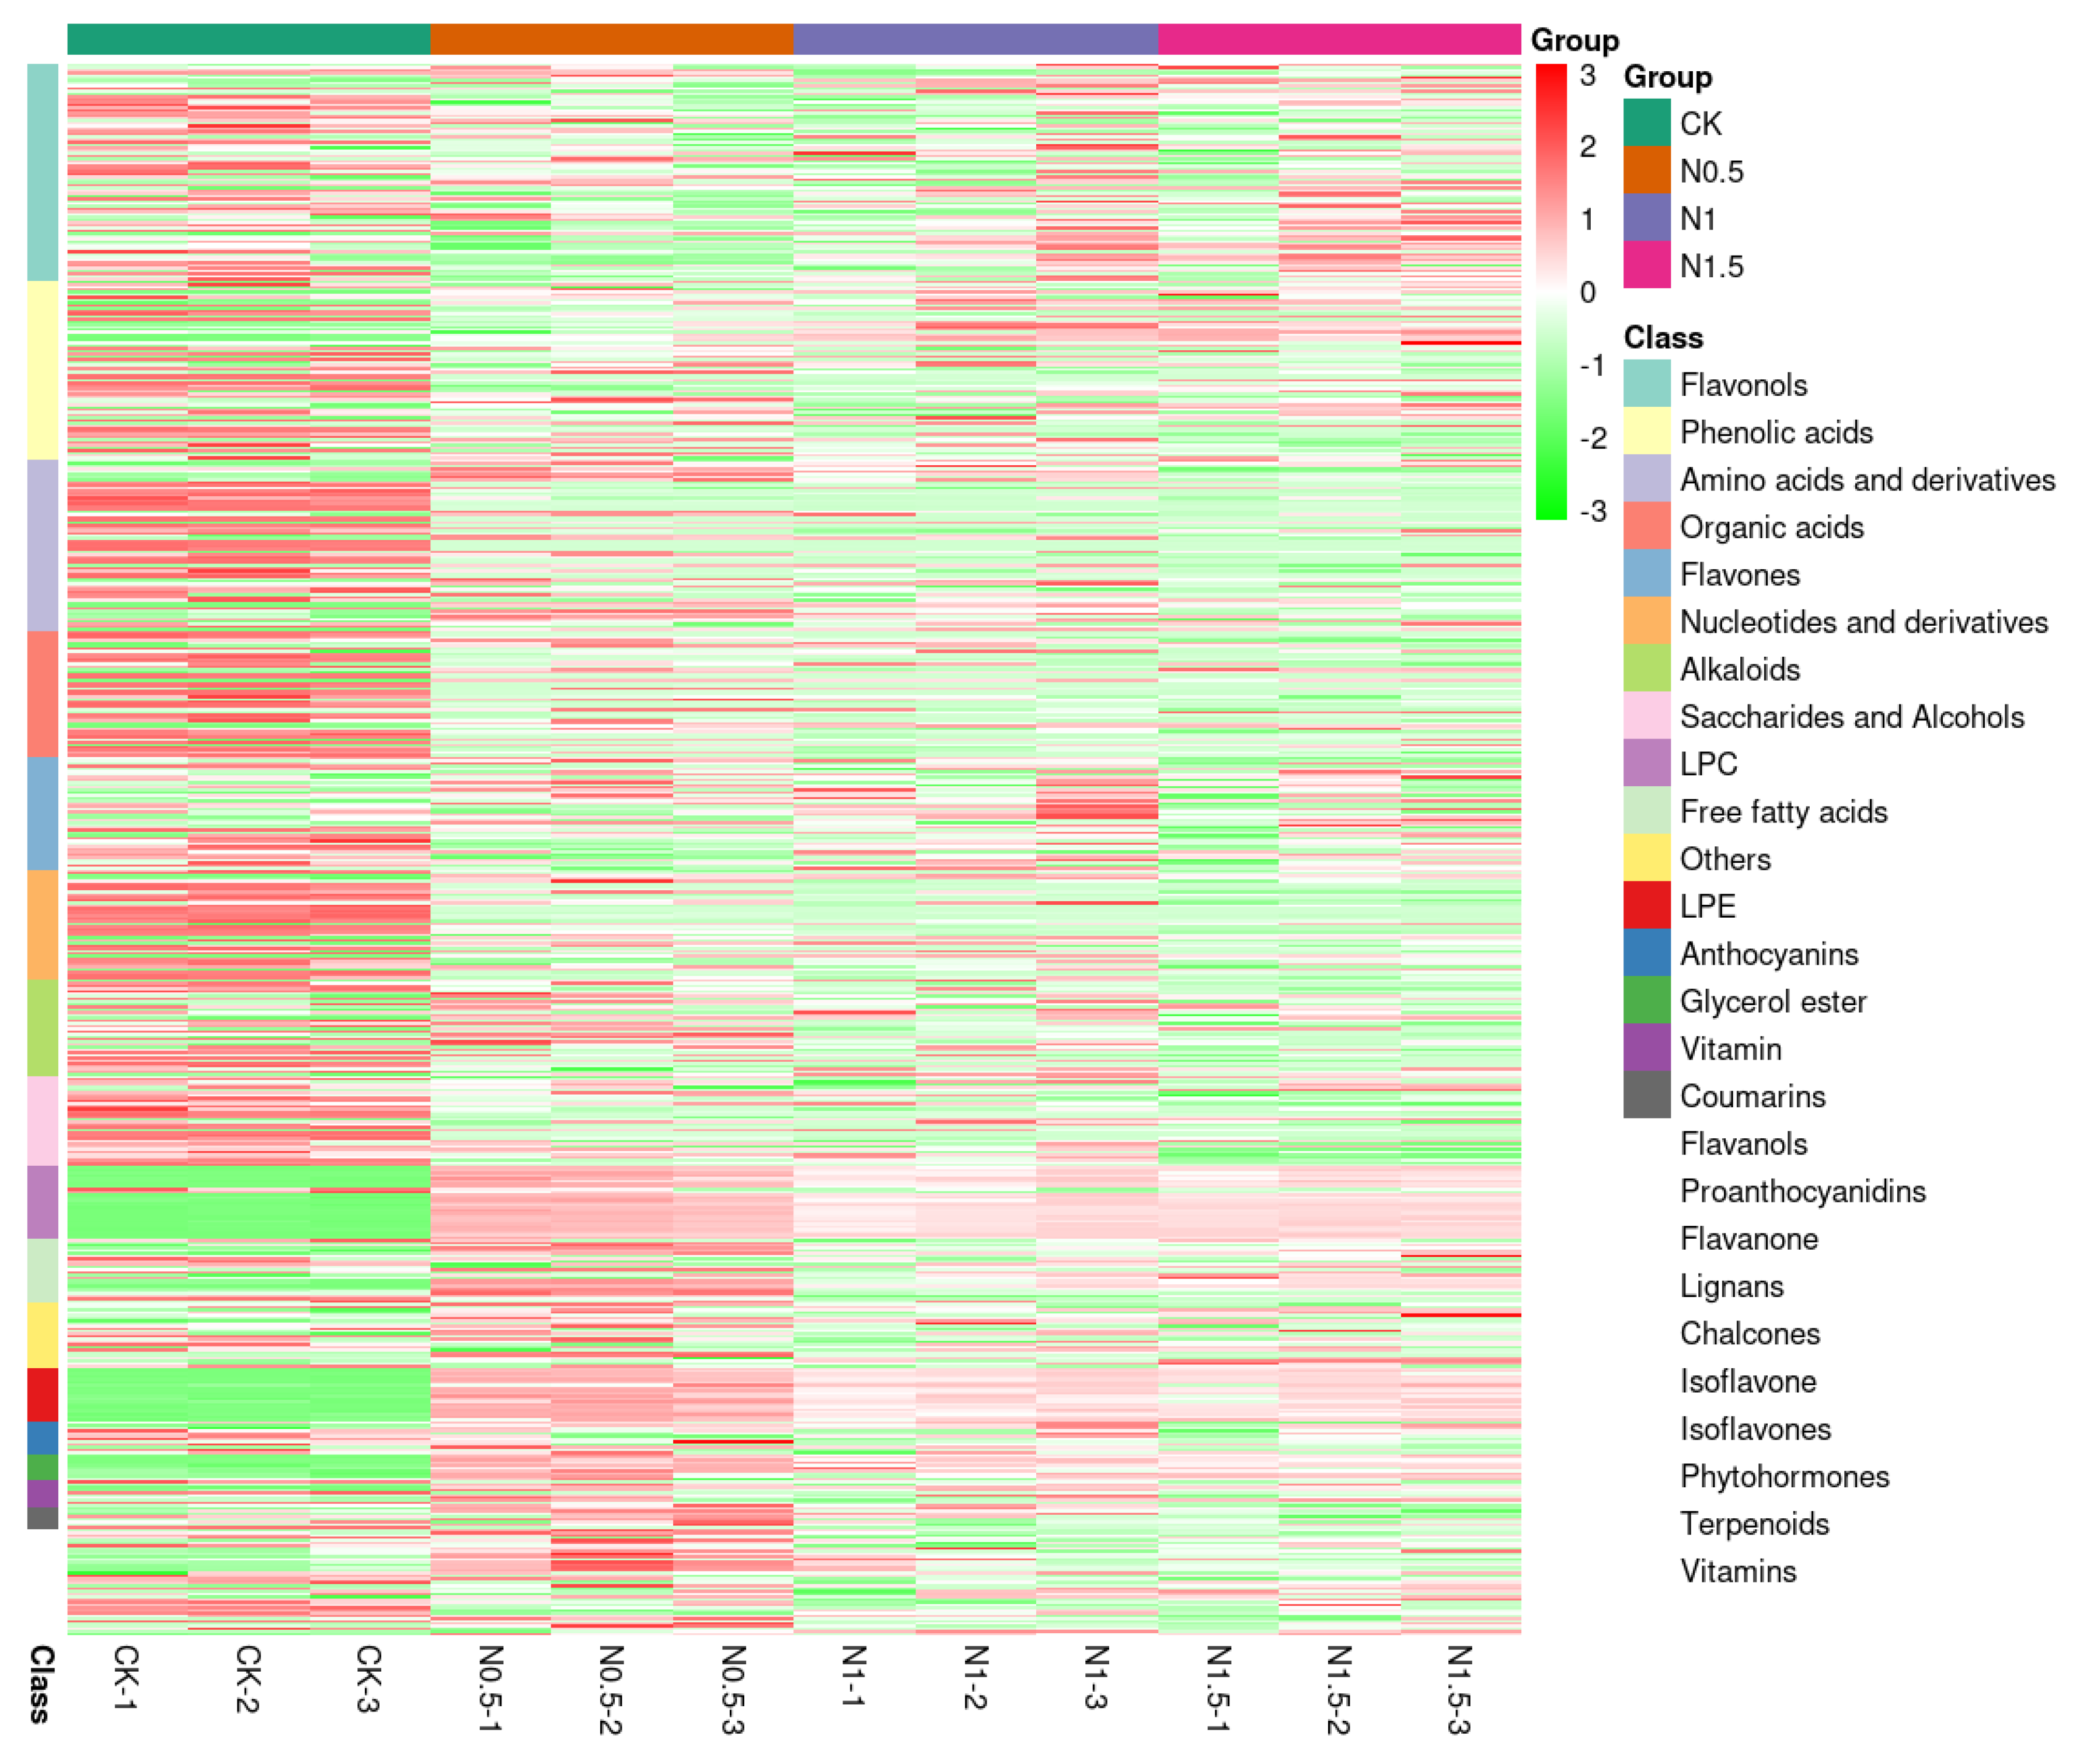
3.5. Metabolome Profiling

To better explore pathways underlying salt stress tolerance, the seedling samples were grouped into four treatments, each having three biological replicates, for a series of qualitative and quantitative metabolites analyses. The correlation coefficients were determined and PCA was undertaken to understand the differences between samples of treated groups, quality control (QC), and their variability size. These sample groups displayed a trend of clear separation between them in score plots that revealed differences in their metabolomes (Figure 6a,b). The k-means clustering detected the metabolites from nine clusters to examine their relative content change in sample group comparisons. The metabolites belonging to sub-classes 1, 2, 4, 5, and 8 displayed maximum accumulations, viz, 21, 16, 9, 65, and 8 metabolites, in sample groups treated with NaCl for 0.5 h. Almost every sub-class demonstrated a standard intensity above one for metabolite accumulation (Figure 6c).
Further, the differentially accumulated metabolites (DAMs) were envisioned regarding their changes between comparison groups through the OPLS-DA model, where the R2X, R2Y, and Q2 values for comparisons between treatments were around 0.683, 1, and 0.925, respectively, signifying the reliability and stability of the model utilized. Metabolites with a variable importance in projection (VIP) value ≥ 1, as well as a top fold-change (FC) of ≤0.005 or ≥2 as the settled criteria were taken as differential metabolites for NaCl-treated group discrimination from the CK group (Figure S1). A total of 285 metabolites were detected and divided into six groups of comparisons based on the ultra-performance liquid chromatography–tandem mass spectroscopy (UPLC-MS/MS) detection platforms and a self-built database (Table S9).
Under different treatment conditions, the metabolites accumulated in seedling samples during salt stress were illustrated through a heatmap in the cluster analysis. The DAMs co-expression found between the control (CK) and three treatment comparison groups were 178 DAMs for the CK-vs.-N0.5, CK-vs.-N1, and CK-vs.-1.5 comparisons, and 1 DAM for the N0.1-vs.-N1, N0.5-vs.-N1.5, and N1-vs.-N1.5 comparisons. Totals of 37, 22, and 21 core conserved DAMs were differentially accumulated in the CK-vs.-N0.5, N0.5-vs.-N1.5 and N0.5-vs.-N1 comparison groups, respectively (Figure 6). These three comparison groups demonstrated a maximum number of DAMs due to having seed treatment of NaCl for 0.5 h common between them, illustrating the 0.5 h pre-soaking seed treatment time as best for enhancing salt tolerance in cotton (Figure 7, Table S10).
These 178 DAMs from four cotton seedling sample groups were divided into more than 16 groups of flavonols, phenolic acids, organic acids, amino acids and derivatives, flavones, saccharides and alcohols, nucleotides and derivatives, alkaloids, LPC, LPE, free fatty acids, anthocyanins, glycerol ester, vitamins, coumarins, and traces of others (Figure 8).
The KEGG enrichment terms related to DAMs were determined regarding the comparison groups of CK and NaCl 0.5 h, 1 h, and1.5 h. The KEGG classification based on significant metabolites with significant differences showed higher proportions of metabolites, viz, flavonols, phenolic acids, and amino acids and derivatives, annotated as ‘metabolic pathways’ (66.07–89.01%) and ‘biosynthesis of secondary metabolites’ (33.33–67.66%) classes in all comparison groups, viz, CK and NaCl for 0.5 h, 1 h and 1.5 h (Figure S2a–f).

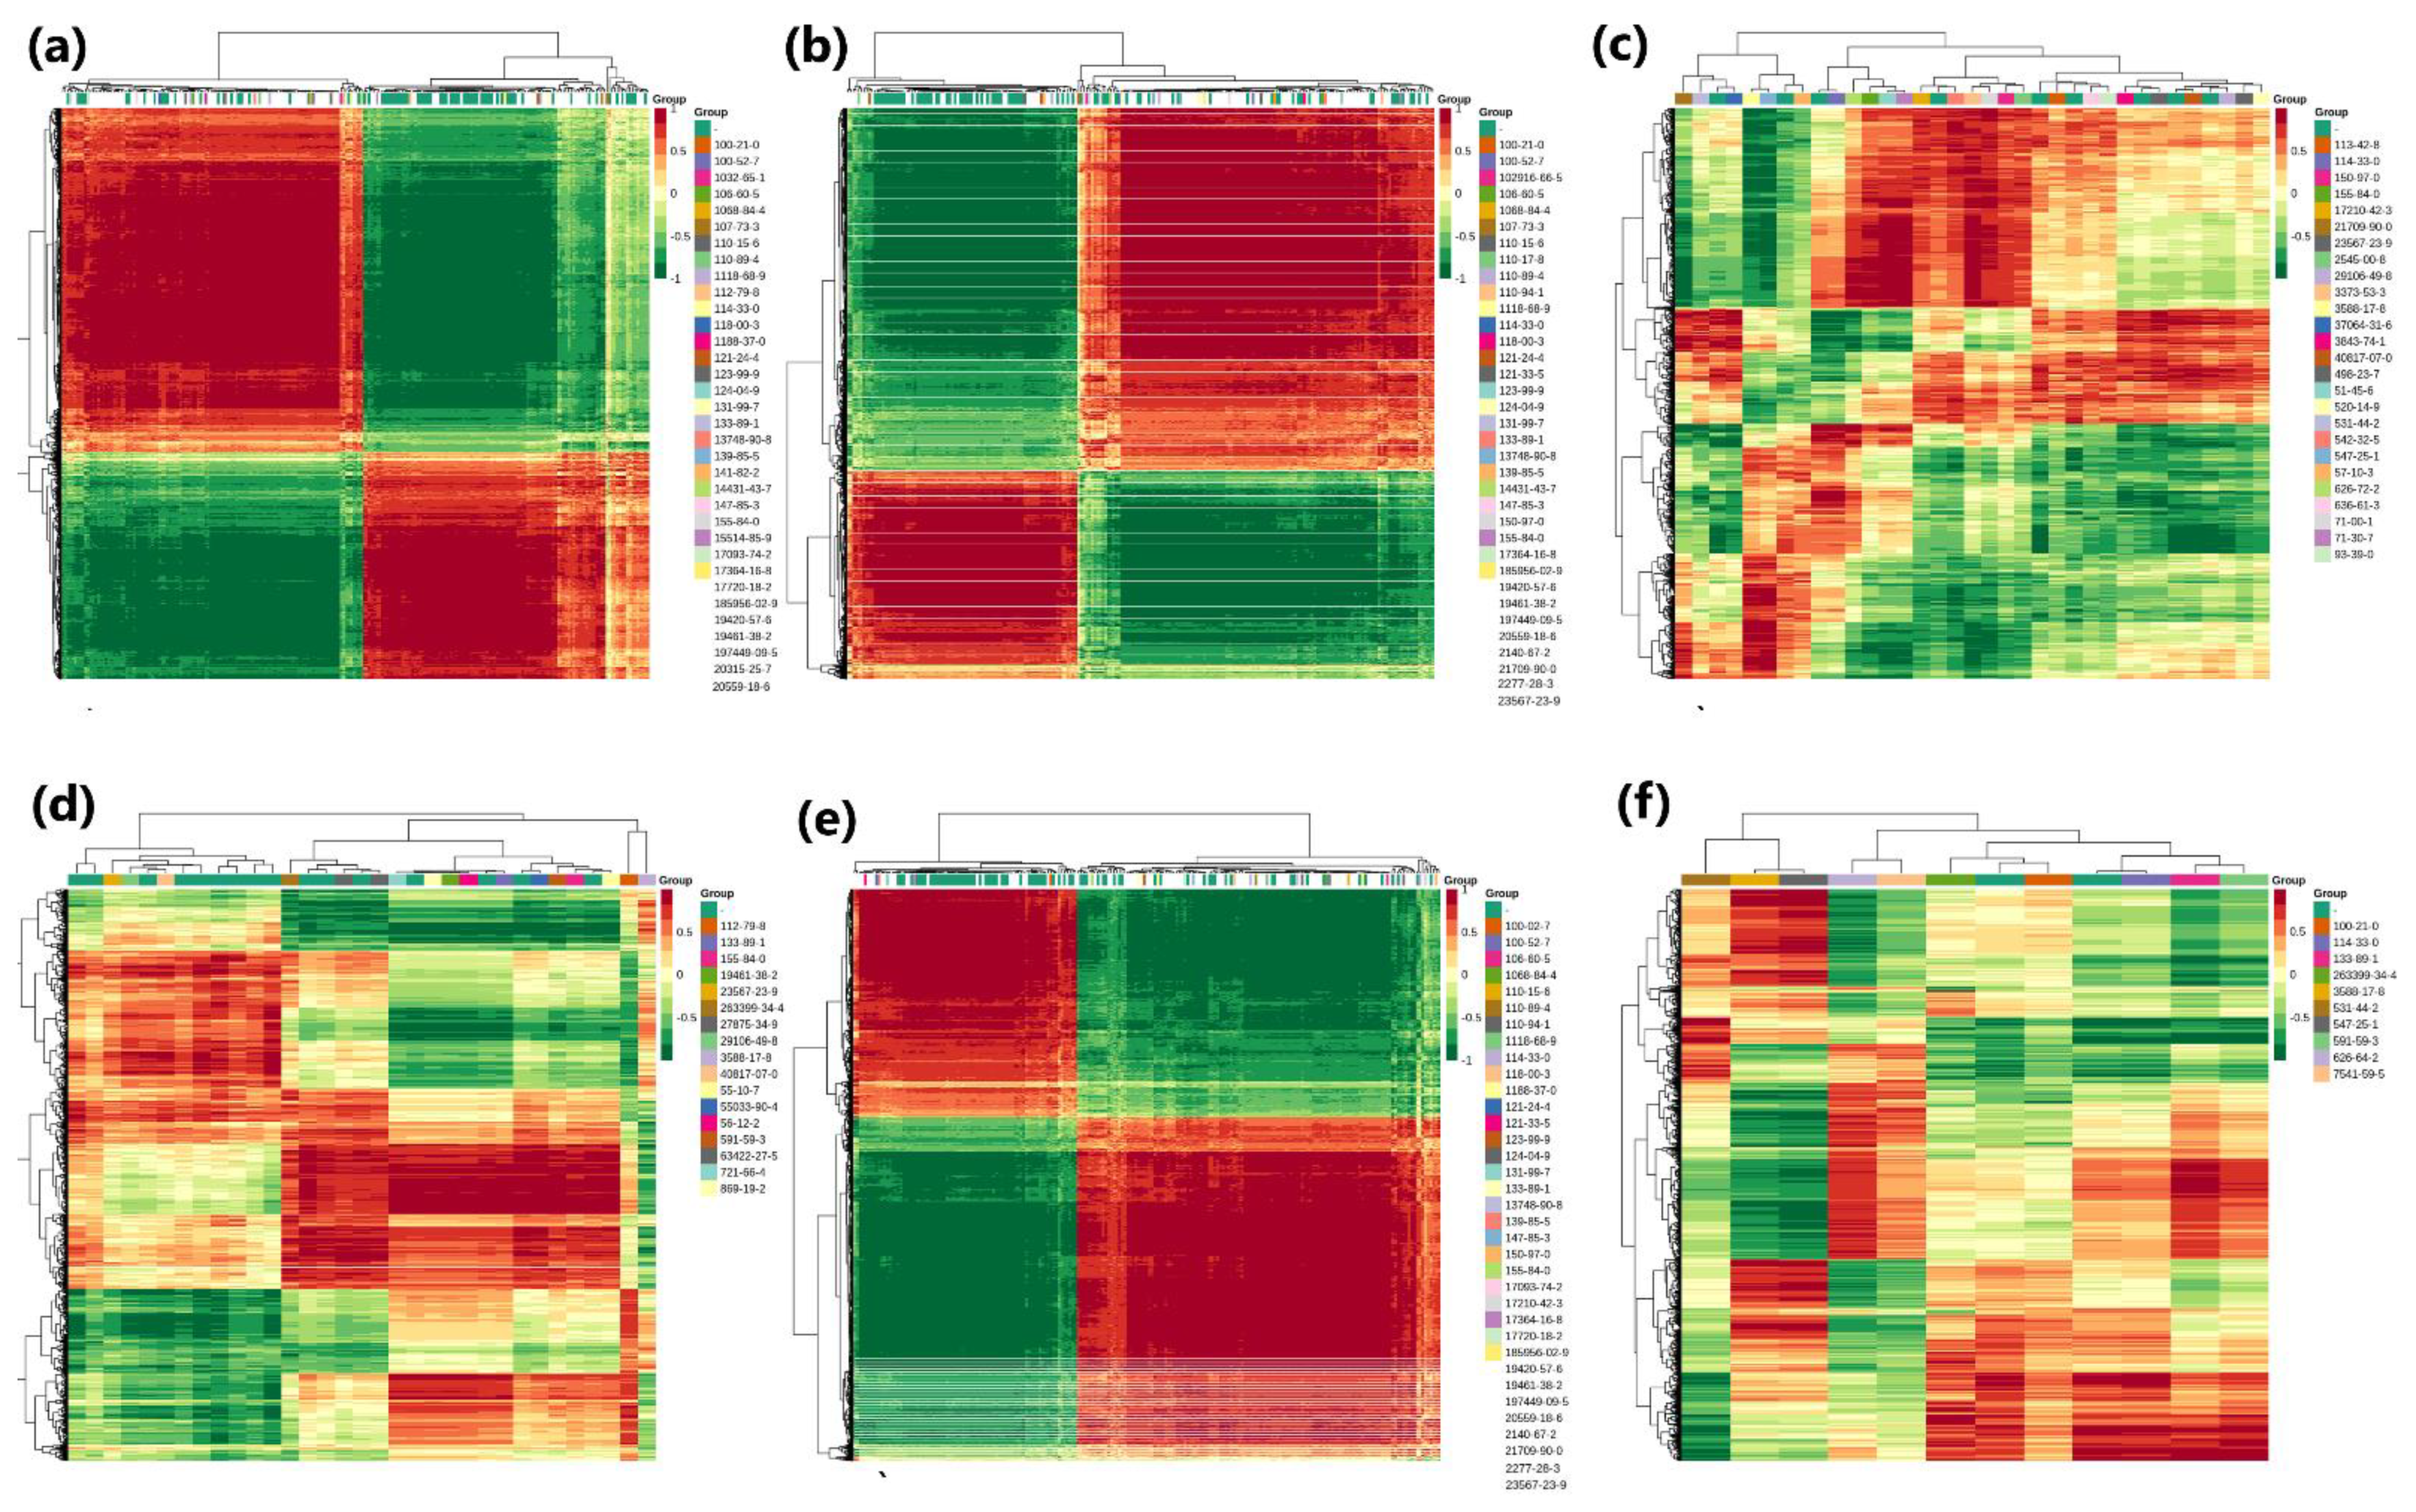
3.6. Combined Analysis of Transcriptome and Metabolome

Both transcriptome and metabolome data were combined and statistically analyzed to examine the relationships between genes and metabolites at different levels simultaneously, coupled with other analyses, such as PCA, correlation analysis, functional analysis, and metabolic pathways enrichment to scrutinize the metabolic pathways associated with key genes. The PCA scatterplots illustrated the separation of triplicated sample groups, with the samples from treatment N0.5 found at a different place from the other treatment samples, both in terms of metabolites and the transcriptome (Figure S3). Based on the current experiment, the differential metabolite analysis results in conjunction with the transcriptome differential gene analysis results, the differentially expressed genes and differential metabolites present in the same group were mapped simultaneously to the KEGG pathway diagram for a better understanding of the relationships between genes with metabolites (Figure 9). A total of 8268 DEGs were discovered in association (Pearson’s correlation coefficient > 0.8) with 285 metabolites, with most of them jointly controlling the regulation of single or multiple metabolites (Figure 10). Most of the DEGs and associated metabolites in the interactive networks (Figure 11) showed involvement in the production and regulation of glucose-1-phosphate (G1P), uridine 5′-diphospho-D-glucose (UDP-G1c), and 2-deoxyribose 1-phosphate (dR-1-P) under salt stress situations.

4. Discussion

Though G. hirsutum is categorized under the tolerant category, variations exist among its cultivars’ tolerance levels [1,23,63]. Salt is a substantial growth-limiting factor for reducing yield and inducing considerable production losses [5,16,22]. The stress that is induced by different salts, especially Na+ and Cl ions existing across the growing medium of the crops, impose other secondary stresses on the plant, including ionic, oxidative, and osmotic stresses [2,64,65]. Specific sensors in the plasma membrane perceive the stress information and, consequently, many signal molecules are usually produced and transduced through the nucleus to activate stress-responsive TFs for the initiation of transcriptional reprogramming [14,66,67]. Higher concentrations of Na+ ions induce membrane disintegration, reduced growth and cell division, osmotic imbalance, less photosynthesis, and the production of ROS [6,68,69]. The current study investigated fresh root and shoot weights, as well as emergence percentages, all of which displayed significant differences between the samples treated with 3% NaCl for 0.5, 1, and 1.5 h. The analysis of variance, PCA, and correlation analyses of the phenotypic, transcriptomic, and metabolomic data exposed significant differences between the treatments and control, which lay the foundation for further study.
Germination is critical due to its higher sensitivity to water molecules and salt ion imbalance, temperature fluctuation, and O2 concentrations, which are regulated by crucial phytohormones, such as abscisic acid (ABA), ethylene, gibberellic acid (GA), indoleacetic acid (IAA), brassinosteroids, and cytokinins (CYT). The antagonistic roles of two highly significant phytohormones, i.e., GAs and ABA, influence seed germination or dormancy [70,71,72]. Furthermore, there are some signal molecules, such as nitric oxide (NO), as well as ROS (reactive oxygen species) and external factors that affect germination significantly, such as salts, drought, temperature, light, moisture, acidity, and nutrients [73]. Some phenylpropanoids, such as phenolic acids, flavonoids, coumarins, and monolignols [74], serve as defense agents for plants to combat abiotic and biotic stresses. ABA, jasmonic acid (JA), and salicylic acid (SA) are well-known phenolic phytohormones that play their roles in plants as signaling molecules in response to various types of abiotic stresses [74].
The salt tolerance mechanism is complex and controlled by several genes. Multiple studies on cotton regarding salt tolerance via a QTL mapping approach and genome-wide association studies (GWAS) have been undertaken [22,75,76]. The transcriptome and metabolome profiles of cotton plants have not been explored much for the salt tolerance mechanism. In Xinjiang, the area of salinized cultivated land accounts for 32.07% of the cultivated land area [77,78], and the annual loss of grain and cotton due to salinity and drought in the entire arid area would exceed hundreds of billions of yuan. If some efforts are put into understanding the response of cotton plants with adaptation mechanisms due to elevated salinity stress, such as from sodium reported in the current study, it would be helpful to improve cash crops to serve bio-saline agriculture [79].
The genes from the transcription category include those related to both the transcription factors and other factors that regulate the activity of these transcription factors. For example, the transcription factor family of WRKY is prominent, as well as being the largest member of the gene family involved in the modulation of different network pathways related to stresses [80,81,82].
The stress created by salts evokes osmotic pressure, as well as toxicity in the environment of plants. The findings in the current study illustrated various changes in the genes, ultimate proteins, and metabolites after treatment with 3% NaCl for different durations. When Na+ reaches the cytosol, it might be pushed back into the soil through Na+/H+ efflux across the plasma membrane or might be sequestered to a vacuole through a specific protein (NHX) can be found across the tonoplast [83,84]. Previous reports on cotton seedlings showed that the phytohormone, i.e., ABA, is associated with signal transduction under salt stress conditions, ultimately leading to the closure of stomata and ion channel activation [25,85]. Here, it was inferred that the treated cotton plants utilized the ABA-receptor PYL/PYR under stress conditions. The seedlings from the 0.5 h treatment seemed to negatively regulate the ABA signaling pathway to control the osmotic stress via up-regulation of the protein-phosphatase (PP2C) [86]. This indicated that the seed treatment with 3% NaCl for 0.5 h was the ideal time to enhance the germination and growth of the seedling, as energy is saved from wastage/consumption via the timely inhibition of the signaling transduction pathway. Similarly, JA and SA played considerable roles against salt stress damage by working synergistically. The production of JA is negatively regulated by jasmonate-associated ZIM domains (JAZ) proteins [87] and positive regulation of MYC2 protein saves energy [88]. Our conjoint analysis of DAMs and DEGs revealed a higher expression of ‘plant hormones signals transduction’ for the 0.5 h treatment time duration and a higher expression of JAZ proteins, demonstrating that 0.5 h is the critical time point for enhancing the salt tolerance mechanism in cotton seedlings. These findings are consistent with earlier findings in salt stress studies on different crop plants [86,89]. Several TFs from different classes, such as WRKY, bHLH, MYB, ERF, NAC, GATA, and MADs-box, were described as engaging in IAA, ABA, and JA mediated gene expressions. The current findings may help to reveal the antagonizing effect of abscisic acid and indole acetic acid in the salt stress response of cotton.
The conversion of galactose to a metabolically useful form is accomplished by four enzymes, which mainly follow a well-known pathway, i.e., the Leloir pathway. Both in prokaryotes and eukaryotes, glycoprotein glucosyltransferase (UDP-G1c) has significant a role in the utilization of galactose [90], synthesis of proteoglycans, glycoproteins [91], carbohydrates, and glycolipids [92]. However, the amino acid sequence and protein structures of UGPase are different in prokaryotes and eukaryotes, but they can catalyze the same reaction [93]. The formation of cotton fiber is actually a process of cellulose synthesis, which is aided by several enzymes [94]. UDP-glucose is required as a substrate in fiber synthesis, which is provided by sucrose synthase after the degradation of sucrose into UDP-glucose [95]. Soil salinity inversely affects the sucrose synthase and sucrose metabolism and ultimately cotton growth, development, and fiber quality [96]. Thus, enhancing the salt tolerance in the seeds before sowing to overcome salinity adverse effects can be a useful tactic in future cotton breeding improvement programs.

5. Conclusions

In this study, 3% NaCl was applied to cotton seeds for 0.5, 1, and 1.5 h to investigate the effect of seed treatment on enhancing salt tolerance. The study was carried out with the assumption of the potential reduction in cotton seedling germination and growth as effects of salt stress, but positive effects of NaCl with 0.5 h treatment were observed on seedling growth. It revealed that NaCl impacted growth and germination by activating certain growth-regulating phytohormones and certain TFs, including AtCCC1, EP1, NHE, AtpOMT, GAST1, CLC-c, ARP, AtKIN14, AtC3H2, COP9, AtHK-2, EID1, bHLH, ZF-domains, bHLH, MYB, NAC, GATA, MADs-box, bZIP, and HHO. Certain metabolites, such as flavonols, phenolic acid, and amino acids and derivatives, were highly accumulated in 0.5 h NaCl-treated samples to enhance growth and development. These observations were also validated by transcriptome and metabolome profiling that illustrated the regulation of different growth-promoting hormone signaling pathways. These resultant findings revealed a 0.5 h NaCl treatment as beneficial for alleviating the adverse effects of salt stress in cotton. NaCl pre-treatment on cotton seeds can be used in future breeding programs to enhance cotton growth and development. In summary, the current study provided new insights into the transcriptional and metabolic changes that occur in response to salt stress in seeds pretreated with NaCl. The results showed an enhanced germination rate and healthy crop establishment, which can translate to improved productivity under salt stress conditions.

Supplementary Materials

The following supporting information can be downloaded from https://www.mdpi.com/article/10.3390/agronomy12081849/s1. Figure S1: OPLS-DA of significant metabolites in the pericarp of Litchi is associated with CK and treatment groups with corresponding R2X, R2Y, and Q2 to check the stability and reliability of the model. Figure S2: KEGG functional annotation classification panel of significant DAMs associated with CK and treatment groups, including (a–f) the list of involved metabolic pathways related to significant DAMs presented on the Y-axis and the percentage of metabolites annotated under those pathways presented on the X-axis. Figure S3: Comparison of PCAs related to (a) DAMs and (b) DEGs in cotton seedlings in the combined analysis based on the CK group and seeds pretreated with NaCl for 0.5, 1, and 1.5 h. Table S1: Summary of raw and clean reads from the transcriptome profiling of cotton seedlings of NaCl treatments. Table S2: Summary of RNA-Seq data obtained from the transcriptome profiling of cotton seedlings of NaCl-treated seeds. Table S3: List of expressed genes with FPKM values for individual replicates at different time points. Table S4: GO annotation of expressed genes from cotton seedling samples of control and NaCl-treated seeds. Table S5. KEGG enrichment for expressed genes from cotton seedling samples of control and NaCl-treated seeds. Table S6a: List of differentially expressed genes (DEGs) in cotton seedlings samples of control and NaCl-treated seeds. Table S6b: Summary of differentially expressed genes (DEGs) in cotton seedlings samples of control and NaCl-treated seeds. Table S7: List of selected DEGs with functional annotation based on GO classification from cotton seedling samples of control and NaCl-treated seeds. Table S8: List of genes with the sequence used for validation via qRT-PCR. Table S9: Summary of significant differentially accumulated metabolites (DAMs) detected across the CK and NaCl treatment (0.5, 1, and 1.5 h) comparison groups of cotton seedling samples. Table S10: Details of identified differentially expressed metabolites, sub-classes, and related compounds from comparison groups of control and NaCl-treated cotton seedling samples.

Author Contributions

Conceptualization, W.R. and L.C.; methodology, W.R., L.C., Q.W., and Y.R.; software, W.R., and L.C.; validation, Q.W. and Y.R.; formal analysis, W.R., L.C., and Q.W.; investigation, W.R., Q.W., and Y.R.; resources, L.C. and Q.W.; data curation, W.R., L.C., and Y.R.; writing—original draft preparation, W.R.; writing—review and editing, L.C., Q.W., and Y.R.; visualization, W.R. and Q.W.; supervision, W.R.; project administration, W.R.; funding acquisition, W.R. All authors have read and agreed to the published version of the manuscript.

Funding

This work was funded by the National Key Research and Development Program of China (grant no. 2018YFD1000903).

Institutional Review Board Statement

Not applicable.

Informed Consent Statement

Not applicable.

Data Availability Statement

The sequence data are available online in the NCBI database with reference no. PRJNA852506. The other supporting data related to the reported results are available as supplementary files, and the protocols, R scripts, and/or anything else will be provided at a reasonable request without undue delay.

Acknowledgments

We thank the staff of Norminkoda Biotechnology Co., Ltd., Wuhan, China, for the Metabolome profiling and the staff of Qinghai Keju Biotechnology Co., Ltd., for the transcriptome sequencing.

Conflicts of Interest

The authors declare no conflict of interest.

References

  1. Zhan, J.; Diao, Y.; Yin, G.; Sajjad, M.; Wei, X.; Lu, Z.; Wang, Y. Integration of mRNA and miRNA Analysis Reveals the Molecular Mechanism of Cotton Response to Salt Stress. Front. Plant Sci. 2021, 12, 767984. [Google Scholar] [CrossRef] [PubMed]
  2. Liu, W.; Feng, J.; Ma, W.; Zhou, Y.; Ma, Z. GhCLCg-1, a vacuolar chloride channel, contributes to salt tolerance by regulating ion accumulation in upland cotton. Front. Plant Sci. 2021, 12, 765173. [Google Scholar] [CrossRef]
  3. Iqbal, M.M.; Khan, T.M.; Iqbal, M.S.; Khan, A.H. Estimation of genetic potential for salt tolerance in Gossypium hirsutum L. J. Agric. Res. 2013, 51, 03681157. [Google Scholar]
  4. Munns, R.; Tester, M. Mechanisms of salinity tolerance. Annu. Rev. Plant Biol. 2008, 59, 651–681. [Google Scholar] [CrossRef] [PubMed] [Green Version]
  5. Hajihashemi, S.; Skalicky, M.; Brestic, M.; Pavla, V. Effect of sodium nitroprusside on physiological and anatomical features of salt-stressed Raphanus sativus. Plant Physiol. Biochem. 2021, 169, 160–170. [Google Scholar] [CrossRef]
  6. Wang, X.; An, M.; Wang, K.; Fan, H.; Shi, J.; Chen, K. Effects of Organic Polymer Compound Material on K+ and Na+ Distribution and Physiological Characteristics of Cotton under Saline and Alkaline Stresses. Front. Plant Sci. 2021, 12, 636536. [Google Scholar] [CrossRef]
  7. Ali, B.; Iqbal, M.S.; Shah, M.K.N.; Shabbir, G.; Cheema, N.M. Genetic analysis for various traits in Gossypium hirsutum L. Pak. J. Agric. Res. 2011, 24. [Google Scholar]
  8. Gupta, B.; Huang, B. Mechanism of salinity tolerance in plants: Physiological, biochemical, and molecular characterization. Int. J. Genom. 2014, 2014, 701596. [Google Scholar] [CrossRef]
  9. Hasanuzzaman, M.; Nahar, K.; Fujita, M. Plant Response to Salt Stress and Role of Exogenous Protectants to Mitigate Salt-Induced Damages. In Ecophysiology and Responses of Plants under Salt Stress; Ahmad, P., Azooz, M.M., Prasad, M.N.V., Eds.; Springer: New York, NY, USA, 2013; pp. 25–87. [Google Scholar]
  10. Nahar, K.; Hasanuzzaman, M.; Fujita, M. Roles of Osmolytes in Plant Adaptation to Drought and Salinity. In Osmolytes and Plants Acclimation to Changing Environment: Emerging Omics Technologies; Iqbal, N., Nazar, R., Khan, N.A., Eds.; Springer: New Delhi, India, 2016; pp. 37–68. [Google Scholar]
  11. Khajeh-Hosseini, M.; Powell, A.A.; Bingham, I.J. The interaction between salinity stress and seed vigour during germination of soyabean seeds. Seed Sci. Technol. 2003, 31, 715–725. [Google Scholar] [CrossRef]
  12. Adams, E.; Shin, R. Transport, signaling, and homeostasis of potassium and sodium in plants. J. Integr. Plant Biol. 2014, 56, 231–249. [Google Scholar] [CrossRef]
  13. Kronzucker, H.J.; Britto, D.T. Sodium transport in plants: A critical review. New Phytol. 2011, 189, 54–81. [Google Scholar] [CrossRef] [PubMed]
  14. Chen, G.; Liu, Z.; Li, S.; Qanmber, G.; Liu, L.; Guo, M.; Lu, L.; Ma, S.; Li, F.; Yang, Z. Genome-wide analysis of ZAT gene family revealed GhZAT6 regulates salt stress tolerance in G. hirsutum. Plant Sci. 2021, 312, 111055. [Google Scholar] [CrossRef] [PubMed]
  15. Sarfraz, Z.; Shah, M.M.; Iqbal, M.S. Genetic variability, heritability and genetic advance for agronomic traits among A-genome donor wheat genotypes. J. Agric. Res. 2016, 54, 15–20. [Google Scholar]
  16. Deng, F.; Zhang, X.; Wang, W.; Yuan, R.; Shen, F. Identification of Gossypium hirsutum long non-coding RNAs (lncRNAs) under salt stress. BMC Plant Biol. 2018, 18, 23. [Google Scholar] [CrossRef]
  17. Xu, P.; Guo, Q.; Meng, S.; Zhang, X.; Xu, Z.; Guo, W.; Shen, X. Genome-wide association analysis reveals genetic variations and candidate genes associated with salt tolerance related traits in Gossypium hirsutum. BMC Genom. 2021, 22, 26. [Google Scholar] [CrossRef]
  18. Liu, B.; Wang, X.; Li, K.; Cai, Z. Spatially Resolved Metabolomics and Lipidomics Reveal Salinity and Drought-Tolerant Mechanisms of Cottonseeds. J. Agric. Food Chem. 2021, 69, 8028–8037. [Google Scholar] [CrossRef] [PubMed]
  19. Iqbal, M.S.; Tang, S.; Sarfraz, Z.; Iqbal, M.S.; Li, H.; He, S.; Jia, Y.; Sun, G.; Pan, Z.; Xiaoli, G. Genetic Factors Underlying Single Fiber Quality in A-Genome Donor Asian Cotton (Gossypium arboreum). Front. Genet. 2021, 12, 758665. [Google Scholar] [CrossRef]
  20. Sarfraz, Z.; Iqbal, M.S.; Geng, X.; Iqbal, M.S.; Nazir, M.F.; Ahmed, H.; He, S.; Jia, Y.; Pan, Z.; Sun, G. GWAS Mediated Elucidation of Heterosis for Metric Traits in Cotton (Gossypium hirsutum L.) Across Multiple Environments. Front. Plant Sci. 2021, 12, 566. [Google Scholar] [CrossRef]
  21. Uçarlı, C. Effects of salinity on seed germination and early seedling stage. Abiotic Stress Plants 2020, 211. [Google Scholar]
  22. Shen, J.; Chen, D.; Zhang, X.; Song, L.; Dong, J.; Xu, Q.; Hu, M.; Cheng, Y.; Shen, F.; Wang, W. Mitigation of salt stress response in upland cotton (Gossypium hirsutum) by exogenous melatonin. J. Plant Res. 2021, 134, 857–871. [Google Scholar] [CrossRef]
  23. Fan, R.; Su, X.; Guo, Y.; Sun, F.; Qu, Y.; Chen, Q. Cotton seedling drought tolerance is improved via salt preconditioning. Protoplasma 2021, 258, 263–277. [Google Scholar] [CrossRef] [PubMed]
  24. Doğan, İ.; Özyiğit, İ.İ.; Demir, G. Mineral element distribution of cotton (Gossypium hirsutum L.) seedlings under different salinity levels. Pak. J. Bot. 2012, 44, 15–20. [Google Scholar]
  25. Liu, L.; Wang, B.; Liu, D.; Zou, C.; Wu, P.; Wang, Z.; Wang, Y.; Li, C. Transcriptomic and metabolomic analyses reveal mechanisms of adaptation to salinity in which carbon and nitrogen metabolism is altered in sugar beet roots. BMC Plant Biol. 2020, 20, 138. [Google Scholar] [CrossRef] [PubMed] [Green Version]
  26. Rahman, S.A.; Iqbal, M.S.; Riaz, M.; Mahmood, A.; Shahid, M.R.; Abbas, G.; Farooq, J. Cause and effect estimates for yield contributing and morphological traits in upland cotton (Gossypium hirsutum L.). J. Agric. Res. 2013, 51, 393–398. [Google Scholar]
  27. Wang, W.; Li, W.; Cheng, Z.; Sun, J.; Gao, J.; Li, J.; Niu, X.; Amjid, M.W.; Yang, H.; Zhu, G.; et al. Transcriptome-wide N6-methyladenosine profiling of cotton root provides insights for salt stress tolerance. Environ. Exp. Bot. 2022, 194, 104729. [Google Scholar] [CrossRef]
  28. Xue, T.; Li, X.; Zhu, W.; Wu, C.; Yang, G.; Zheng, C. Cotton metallothionein GhMT3a, a reactive oxygen species scavenger, increased tolerance against abiotic stress in transgenic tobacco and yeast. J. Exp. Bot. 2009, 60, 339–349. [Google Scholar] [CrossRef]
  29. Guo, Y.H.; Yu, Y.P.; Wang, D.; Wu, C.A.; Yang, G.D.; Huang, J.G.; Zheng, C.C. GhZFP1, a novel CCCH-type zinc finger protein from cotton, enhances salt stress tolerance and fungal disease resistance in transgenic tobacco by interacting with GZIRD21A and GZIPR5. New Phytol. 2009, 183, 62–75. [Google Scholar] [CrossRef]
  30. Zhao, J.; Gao, Y.; Zhang, Z.; Chen, T.; Guo, W.; Zhang, T. A receptor-like kinase gene (GbRLK) from Gossypium barbadense enhances salinity and drought-stress tolerance in Arabidopsis. BMC Plant Biol. 2013, 13, 110. [Google Scholar] [CrossRef] [Green Version]
  31. Gao, S.-Q.; Chen, M.; Xia, L.-Q.; Xiu, H.-J.; Xu, Z.-S.; Li, L.-C.; Zhao, C.-P.; Cheng, X.-G.; Ma, Y.-Z. A cotton (Gossypium hirsutum) DRE-binding transcription factor gene, GhDREB, confers enhanced tolerance to drought, high salt, and freezing stresses in transgenic wheat. Plant Cell Rep. 2009, 28, 301–311. [Google Scholar] [CrossRef]
  32. Chu, X.; Wang, C.; Chen, X.; Lu, W.; Li, H.; Wang, X.; Hao, L.; Guo, X. The Cotton WRKY Gene GhWRKY41 Positively Regulates Salt and Drought Stress Tolerance in Transgenic Nicotiana benthamiana. PLoS ONE 2015, 10, e0143022. [Google Scholar] [CrossRef]
  33. Yan, H.; Jia, H.; Chen, X.; Hao, L.; An, H.; Guo, X. The cotton WRKY transcription factor GhWRKY17 functions in drought and salt stress in transgenic Nicotiana benthamiana through ABA signaling and the modulation of reactive oxygen species production. Plant Cell Physiol. 2014, 55, 2060–2076. [Google Scholar] [CrossRef] [PubMed] [Green Version]
  34. Huang, G.-Q.; Li, W.; Zhou, W.; Zhang, J.-M.; Li, D.-D.; Gong, S.-Y.; Li, X.-B. Seven cotton genes encoding putative NAC domain proteins are preferentially expressed in roots and in responses to abiotic stress during root development. Plant Growth Regul. 2013, 71, 101–112. [Google Scholar] [CrossRef]
  35. Meng, C.; Cai, C.; Zhang, T.; Guo, W. Characterization of six novel NAC genes and their responses to abiotic stresses in Gossypium hirsutum L. Plant Sci. 2009, 176, 352–359. [Google Scholar] [CrossRef]
  36. Yasir, M.; He, S.; Sun, G.; Geng, X.; Pan, Z.; Gong, W.; Jia, Y.; Du, X. A Genome-Wide Association Study Revealed Key SNPs/Genes Associated with Salinity Stress Tolerance In Upland Cotton. Genes 2019, 10, 829. [Google Scholar] [CrossRef] [Green Version]
  37. Yuan, Y.; Xing, H.; Zeng, W.; Xu, J.; Mao, L.; Wang, L.; Feng, W.; Tao, J.; Wang, H.; Zhang, H.; et al. Genome-wide association and differential expression analysis of salt tolerance in Gossypium hirsutum L. at the germination stage. BMC Plant Biol. 2019, 19, 394. [Google Scholar] [CrossRef] [PubMed]
  38. Xu, Y.; Magwanga, R.O.; Yang, X.; Jin, D.; Cai, X.; Hou, Y.; Wei, Y.; Zhou, Z.; Wang, K.; Liu, F. Genetic regulatory networks for salt-alkali stress in Gossypium hirsutum with differing morphological characteristics. BMC Genom. 2020, 21, 15. [Google Scholar] [CrossRef] [PubMed] [Green Version]
  39. Guo, J.; Shi, G.; Guo, X.; Zhang, L.; Xu, W.; Wang, Y.; Su, Z.; Hua, J. Transcriptome analysis reveals that distinct metabolic pathways operate in salt-tolerant and salt-sensitive upland cotton varieties subjected to salinity stress. Plant Sci. 2015, 238, 33–45. [Google Scholar] [CrossRef]
  40. Zhang, L.; Xi, D.; Li, S.; Gao, Z.; Zhao, S.; Shi, J.; Wu, C.; Guo, X. A cotton group C MAP kinase gene, GhMPK2, positively regulates salt and drought tolerance in tobacco. Plant Mol. Biol. 2011, 77, 17–31. [Google Scholar] [CrossRef]
  41. Slonim, D.K.; Yanai, I. Getting started in gene expression microarray analysis. PLoS Comput. Biol. 2009, 5, e1000543. [Google Scholar] [CrossRef]
  42. Ari, Ş.; Arikan, M. Next-Generation Sequencing: Advantages, Disadvantages, and Future. In Plant Omics: Trends and Applications; Hakeem, K.R., Tombuloğlu, H., Tombuloğlu, G., Eds.; Springer International Publishing: Cham, Switzerland, 2016; pp. 109–135. [Google Scholar]
  43. Peng, W.; Song, N.; Li, W.; Yan, M.; Huang, C.; Yang, Y.; Duan, K.; Dai, L.; Wang, B. Integrated Analysis of MicroRNA and Target Genes in Brachypodium distachyon Infected by Magnaporthe oryzae by Small RNA and Degradome Sequencing. Front. Plant Sci. 2021, 12, 742347. [Google Scholar] [CrossRef]
  44. Singh, R.; Kumar, K.; Bharadwaj, C.; Verma, P.K. Broadening the horizon of crop research: A decade of advancements in plant molecular genetics to divulge phenotype governing genes. Planta 2022, 255, 46. [Google Scholar] [CrossRef] [PubMed]
  45. Kowal, E.; Llamas, B. Race in a genome: Long read sequencing, ethnicity-specific reference genomes and the shifting horizon of race. J. Anthropol. Sci. 2019, 97, 91–106. [Google Scholar] [CrossRef]
  46. Li, F.; Fan, G.; Lu, C.; Xiao, G.; Zou, C.; Kohel, R.J.; Ma, Z.; Shang, H.; Ma, X.; Wu, J.; et al. Genome sequence of cultivated Upland cotton (Gossypium hirsutum TM-1) provides insights into genome evolution. Nat. Biotechnol. 2015, 33, 524–530. [Google Scholar] [CrossRef] [PubMed] [Green Version]
  47. Chen, S.; Zhou, Y.; Chen, Y.; Gu, J. fastp: An ultra-fast all-in-one FASTQ preprocessor. Bioinformatics 2018, 34, i884–i890. [Google Scholar] [CrossRef]
  48. Langmead, B.; Salzberg, S.L. Fast gapped-read alignment with Bowtie 2. Nat. Methods 2012, 9, 357–359. [Google Scholar] [CrossRef] [PubMed] [Green Version]
  49. Kim, D.; Langmead, B.; Salzberg, S.L. HISAT: A fast spliced aligner with low memory requirements. Nat. Methods 2015, 12, 357–360. [Google Scholar] [CrossRef] [Green Version]
  50. Pertea, M.; Pertea, G.M.; Antonescu, C.M.; Chang, T.-C.; Mendell, J.T.; Salzberg, S.L. StringTie enables improved reconstruction of a transcriptome from RNA-seq reads. Nat. Biotechnol. 2015, 33, 290–295. [Google Scholar] [CrossRef] [Green Version]
  51. Pertea, M.; Kim, D.; Pertea, G.M.; Leek, J.T.; Salzberg, S.L. Transcript-level expression analysis of RNA-seq experiments with HISAT, StringTie and Ballgown. Nat. Protoc. 2016, 11, 1650–1667. [Google Scholar] [CrossRef]
  52. Love, M.I.; Huber, W.; Anders, S. Moderated estimation of fold change and dispersion for RNA-seq data with DESeq2. Genome Biol. 2014, 15, 1–21. [Google Scholar] [CrossRef] [Green Version]
  53. Robinson, M.D.; McCarthy, D.J.; Smyth, G.K. edgeR: A Bioconductor package for differential expression analysis of digital gene expression data. Bioinformatics 2010, 26, 139–140. [Google Scholar] [CrossRef] [Green Version]
  54. Ashburner, M.; Ball, C.A.; Blake, J.A.; Botstein, D.; Butler, H.; Cherry, J.M.; Davis, A.P.; Dolinski, K.; Dwight, S.S.; Eppig, J.T. Gene ontology: Tool for the unification of biology. Nat. Genet. 2000, 25, 25–29. [Google Scholar] [CrossRef] [PubMed] [Green Version]
  55. Kanehisa, M.; Goto, S. KEGG: Kyoto encyclopedia of genes and genomes. Nucleic Acids Res. 2000, 28, 27–30. [Google Scholar] [CrossRef] [PubMed]
  56. Subramanian, A.; Tamayo, P.; Mootha, V.K.; Mukherjee, S.; Ebert, B.L.; Gillette, M.A.; Paulovich, A.; Pomeroy, S.L.; Golub, T.R.; Lander, E.S. Gene set enrichment analysis: A knowledge-based approach for interpreting genome-wide expression profiles. Proc. Natl. Acad. Sci. USA 2005, 102, 15545–15550. [Google Scholar] [CrossRef] [PubMed] [Green Version]
  57. Van der Auwera, G.A.; Carneiro, M.O.; Hartl, C.; Poplin, R.; Del Angel, G.; Levy-Moonshine, A.; Jordan, T.; Shakir, K.; Roazen, D.; Thibault, J. From FastQ data to high-confidence variant calls: The genome analysis toolkit best practices pipeline. Curr. Protoc. Bioinform. 2013, 43, 11.10.1–11.10.33. [Google Scholar]
  58. Szklarczyk, D.; Franceschini, A.; Wyder, S.; Forslund, K.; Heller, D.; Huerta-Cepas, J.; Simonovic, M.; Roth, A.; Santos, A.; Tsafou, K.P. STRING v10: Protein—Protein interaction networks, integrated over the tree of life. Nucleic Acids Res. 2015, 43, D447–D452. [Google Scholar] [CrossRef]
  59. Chen, W.; Gong, L.; Guo, Z.; Wang, W.; Zhang, H.; Liu, X.; Yu, S.; Xiong, L.; Luo, J. A novel integrated method for large-scale detection, identification, and quantification of widely targeted metabolites: Application in the study of rice metabolomics. Mol. Plant 2013, 6, 1769–1780. [Google Scholar] [CrossRef] [Green Version]
  60. Chong, J.; Xia, J. MetaboAnalystR: An R package for flexible and reproducible analysis of metabolomics data. Bioinformatics 2018, 34, 4313–4314. [Google Scholar] [CrossRef] [Green Version]
  61. Thévenot, E.A.; Roux, A.; Xu, Y.; Ezan, E.; Junot, C. Analysis of the human adult urinary metabolome variations with age, body mass index, and gender by implementing a comprehensive workflow for univariate and OPLS statistical analyses. J. Proteome Res. 2015, 14, 3322–3335. [Google Scholar] [CrossRef]
  62. Zhang, T.; Hu, Y.; Jiang, W.; Fang, L.; Guan, X.; Chen, J.; Zhang, J.; Saski, C.A.; Scheffler, B.E.; Stelly, D.M.; et al. Sequencing of allotetraploid cotton (Gossypium hirsutum L. acc. TM-1) provides a resource for fiber improvement. Nat. Biotechnol. 2015, 33, 531–537. [Google Scholar] [CrossRef] [Green Version]
  63. Hejnák, V.; Tatar, Ö.; Atasoy, G.D.; Martinková, J.; Çelen, A.E.; Hnilička, F.; Skalický, M. Growth and photosynthesis of Upland and Pima cotton: Response to drought and heat stress. Plant Soil Environ. 2015, 61, 507–514. [Google Scholar] [CrossRef] [Green Version]
  64. Yang, Y.; Guo, Y. Unraveling salt stress signaling in plants. J. Integr. Plant Biol. 2018, 60, 796–804. [Google Scholar] [CrossRef] [PubMed] [Green Version]
  65. Liang, W.; Ma, X.; Wan, P.; Liu, L. Plant salt-tolerance mechanism: A review. Biochem. Biophys. Res. Commun. 2018, 495, 286–291. [Google Scholar] [CrossRef] [PubMed]
  66. Atkinson, N.J.; Urwin, P.E. The interaction of plant biotic and abiotic stresses: From genes to the field. J. Exp. Bot. 2012, 63, 3523–3543. [Google Scholar] [CrossRef] [PubMed] [Green Version]
  67. Huang, G.T.; Ma, S.L.; Bai, L.P.; Zhang, L.; Ma, H.; Jia, P.; Liu, J.; Zhong, M.; Guo, Z.F. Signal transduction during cold, salt, and drought stresses in plants. Mol. Biol. Rep. 2012, 39, 969–987. [Google Scholar] [CrossRef] [PubMed]
  68. Niu, X.; Bressan, R.A.; Hasegawa, P.M.; Pardo, J.M. Ion Homeostasis in NaCl Stress Environments. Plant Physiol. 1995, 109, 735–742. [Google Scholar] [CrossRef] [Green Version]
  69. Parida, A.K.; Das, A.B. Salt tolerance and salinity effects on plants: A review. Ecotoxicol. Environ. Saf. 2005, 60, 324–349. [Google Scholar] [CrossRef]
  70. Bewley, J.D. Seed germination and dormancy. Plant Cell 1997, 9, 1055. [Google Scholar] [CrossRef] [Green Version]
  71. Koornneef, M.; Bentsink, L.; Hilhorst, H. Seed dormancy and germination. Curr. Opin. Plant Biol. 2002, 5, 33–36. [Google Scholar] [CrossRef] [Green Version]
  72. Nonogaki, H.; Bassel, G.W.; Bewley, J.D. Germination—Still a mystery. Plant Sci. 2010, 179, 574–581. [Google Scholar] [CrossRef]
  73. An, Y.-Q.; Lin, L. Transcriptional regulatory programs underlying barley germination and regulatory functions of gibberellin and abscisic acid. BMC Plant Biol. 2011, 11, 1–24. [Google Scholar] [CrossRef] [Green Version]
  74. Deng, Y.; Lu, S. Biosynthesis and regulation of phenylpropanoids in plants. Crit. Rev. Plant Sci. 2017, 36, 257–290. [Google Scholar] [CrossRef]
  75. Khan, M.S.; Khan, M.N. Understanding Plant Responses to Drought and Salt Stresses: Advances and Challenges in “Omics” Approaches. In Transgenic Crops-Emerging Trends and Future Perspectives; IntechOpen: London, UK, 2019. [Google Scholar]
  76. Wang, Y.; Huang, L.; Du, F.; Wang, J.; Zhao, X.; Li, Z.; Wang, W.; Xu, J.; Fu, B. Comparative transcriptome and metabolome profiling reveal molecular mechanisms underlying OsDRAP1-mediated salt tolerance in rice. Sci. Rep. 2021, 11, 1–11. [Google Scholar] [CrossRef] [PubMed]
  77. Fang, S.; Tu, W.; Mu, L.; Sun, Z.; Hu, Q.; Yang, Y. Saline alkali water desalination project in Southern Xinjiang of China: A review of desalination planning, desalination schemes and economic analysis. Renew. Sustain. Energy Rev. 2019, 113, 109268. [Google Scholar] [CrossRef]
  78. Liang, J.; Li, Y.; Si, B.; Wang, Y.; Chen, X.; Wang, X.; Chen, H.; Wang, H.; Zhang, F.; Bai, Y. Optimizing biochar application to improve soil physical and hydraulic properties in saline-alkali soils. Sci. Total Environ. 2021, 771, 144802. [Google Scholar] [CrossRef]
  79. Ashapkin, V.V.; Kutueva, L.I.; Aleksandrushkina, N.I.; Vanyushin, B.F. Epigenetic Mechanisms of Plant Adaptation to Biotic and Abiotic Stresses. Int. J. Mol. Sci. 2020, 21, 7457. [Google Scholar] [CrossRef]
  80. Yang, Y.; Huang, Q.; Wang, X.; Mei, J.; Sharma, A.; Tripathi, D.K.; Yuan, H.; Zheng, B. Genome-wide identification and expression profiles of ABCB gene family in Chinese hickory (Carya cathayensis Sarg.) during grafting. Plant Physiol. Biochem. 2021, 168, 477–487. [Google Scholar] [CrossRef]
  81. Rushton, P.J.; Somssich, I.E.; Ringler, P.; Shen, Q.J. WRKY transcription factors. Trends Plant Sci. 2010, 15, 247–258. [Google Scholar] [CrossRef] [PubMed]
  82. Chen, L.; Song, Y.; Li, S.; Zhang, L.; Zou, C.; Yu, D. The role of WRKY transcription factors in plant abiotic stresses. Biochim. Biophys. Acta 2012, 1819, 120–128. [Google Scholar] [CrossRef]
  83. Yokoi, S.; Quintero, F.J.; Cubero, B.; Ruiz, M.T.; Bressan, R.A.; Hasegawa, P.M.; Pardo, J.M. Differential expression and function of Arabidopsis thaliana NHX Na+/H+ antiporters in the salt stress response. Plant J. 2002, 30, 529–539. [Google Scholar] [CrossRef] [Green Version]
  84. Apse, M.P.; Aharon, G.S.; Snedden, W.A.; Blumwald, E. Salt tolerance conferred by overexpression of a vacuolar Na+/H+ antiport in Arabidopsis. Science 1999, 285, 1256–1258. [Google Scholar] [CrossRef]
  85. Cutler, S.R.; Rodriguez, P.L.; Finkelstein, R.R.; Abrams, S.R. Abscisic acid: Emergence of a core signaling network. Annu. Rev. Plant Biol. 2010, 61, 651–679. [Google Scholar] [CrossRef] [Green Version]
  86. Zirek, N.S.; Ozlem, U. The developmental and metabolic effects of different magnesium dozes in pepper plants under salt stress. Not. Bot. Horti Agrobot. Cluj-Napoca 2020, 48, 967–977. [Google Scholar] [CrossRef]
  87. Chini, A.; Fonseca, S.; Fernández, G.; Adie, B.; Chico, J.M.; Lorenzo, O.; García-Casado, G.; López-Vidriero, I.; Lozano, F.M.; Ponce, M.R.; et al. The JAZ family of repressors is the missing link in jasmonate signalling. Nature 2007, 448, 666–671. [Google Scholar] [CrossRef]
  88. Figueroa, P.; Browse, J. The Arabidopsis JAZ2 promoter contains a G-Box and thymidine-rich module that are necessary and sufficient for jasmonate-dependent activation by MYC transcription factors and repression by JAZ proteins. Plant Cell Physiol. 2012, 53, 330–343. [Google Scholar] [CrossRef] [Green Version]
  89. Shu, J.; Ma, X.; Ma, H.; Huang, Q.; Zhang, Y.; Guan, M.; Guan, C. Transcriptomic, proteomic, metabolomic, and functional genomic approaches of Brassica napus L. during salt stress. PLoS ONE 2022, 17, e0262587. [Google Scholar] [CrossRef]
  90. Holden, H.M.; Rayment, I.; Thoden, J.B. Structure and function of enzymes of the Leloir pathway for galactose metabolism. J. Biol. Chem. 2003, 278, 43885–43888. [Google Scholar] [CrossRef] [Green Version]
  91. Verbert, A. Biosynthesis 2b. from Glc3Man9GlcNAc2-protein to Man5GlcNAc2-protein: Transfer ‘en bloc’and processing. In New Comprehensive Biochemistry; Elsevier: Amsterdam, The Netherlands, 1995; Volume 29, pp. 145–152. [Google Scholar]
  92. Sandhoff, K.; Van Echten, G.; Schröder, M.; Schnabel, D.; Suzuki, K. Metabolism of glycolipids: The role of glycolipid-binding proteins in the function and pathobiochemistry of lysosomes. Biochem. Soc. Trans. 1992, 20, 695–699. [Google Scholar] [CrossRef]
  93. Mollerach, M.; García, E. The galU gene of Streptococcus pneumoniae that codes for a UDP–glucose pyrophosphorylase is highly polymorphic and suitable for molecular typing and phylogenetic studies. Gene 2000, 260, 77–86. [Google Scholar] [CrossRef]
  94. Ma, Y.; Wang, Y.; Liu, J.; Lv, F.; Chen, J.; Zhou, Z. The effects of fruiting positions on cellulose synthesis and sucrose metabolism during cotton (Gossypium hirsutum L.) fiber development. PLoS ONE 2014, 9, e89476. [Google Scholar] [CrossRef]
  95. Delmer, D.P.; Haigler, C.H. The regulation of metabolic flux to cellulose, a major sink for carbon in plants. Metab. Eng. 2002, 4, 22–28. [Google Scholar] [CrossRef]
  96. Peng, J.; Zhang, L.; Liu, J.; Luo, J.; Zhao, X.; Dong, H.; Ma, Y.; Sui, N.; Zhou, Z.; Meng, Y. Effects of Soil Salinity on Sucrose Metabolism in Cotton Fiber. PLoS ONE 2016, 11, e0156398. [Google Scholar] [CrossRef] [PubMed] [Green Version]
Figure 1. Mean comparisons of phenotypic traits after different NaCl treatments on the cotton seed under study: (a) germination percentage at 10 days after planting, (b) germination percentage at 25 days after planting, (c) root fresh weight at 25 days after planting, and (d) shoot fresh weight at 25 days after planting. Plots show statistical differences between treated samples. Bar plots with overlapping error bars are statistically insignificant; similarly, letters show statistical significance if samples do not share letters. CK: control: 0 h seed pretreatment NaCl, N0.5: 0.5 h seed pretreatment NaCl., N1: 1 h seed pretreatment NaCl, M12: 1.5 h seed pretreatment NaCl.
Agronomy 12 01849 g001
Figure 2. Quality control of transcript data demonstrated as violin plots (a) and a correlation matrix (b) of control (CK) and different NaCl (3%) treatments for 0.5, 1, and 1.5 h on triplicated cotton seedling samples. CK: no treatment; N0.5: NaCl treatment for 0.5 h, N1: NaCl treatment for 1 h, and N1.5: NaCl treatment for 1.5 h; -1,2,3 representing replications.
Agronomy 12 01849 g002
Figure 3. Summary of differentially expressed genes (DEGs) up-regulated and down-regulated in the control and 3% NaCl treated seedling samples comparison groups; X-axis depicts all possible comparisons for NaCl treatments in differential expression patterns. Y-axis displays the number of DEGs as blue bars showing total DEGs; orange reveals up-regulated and gray depicts down-regulated DEGs. CK: no treatment; N0.5: NaCl treatment for 0.5 h, N1: NaCl treatment for 1 h, and N1.5: NaCl treatment for 1.5 h.
Agronomy 12 01849 g003
Figure 4. Venn diagrams illustrating the differentially expressed genes. The sum of the numbers in each circle represents the total number of expressed genes within a comparison. In contrast, the numbers in the overlapping areas represent the number of expressed genes shared (a) between the CK and treatment comparison groups and (b) between different treatment comparison groups of cotton seedlings. CK: no treatment; N0.5: NaCl treatment for 0.5 h, N1: NaCl treatment for 1 h, and N1.5: NaCl treatment for 1.5 h.
Agronomy 12 01849 g004
Figure 5. Correlation between gene expression patterns based on qRT-PCR and RNA-seq from randomly selected differentially expressed genes related to salt stress tolerance. The equation shows the regression line. The intercept of 0.1655 is the value of y when x = 0. The slope of 1.1238 measures the change in y for a one-unit increase in x. R2 is the coefficient of correlation between qRT-PCR and RNA-seq expression values.
Agronomy 12 01849 g005
Figure 6. Quality control of metabolites identified in the experimental seedling sample extracts. (a) Pearson’s correlation coefficients and (b) principal component analysis (PCA) of metabolites extracted from cotton seedlings in the CK and treated groups after 0.5, 1, and 1.5 h treatments with NaCl; each sample was analyzed in triplicate and a quality control mix for metabolomics. (c) The k-means clustering of the differentially accumulated metabolites between the CK group and three treated seedling sample groups (CK: no treatment; N0.5: NaCl treatment for 0.5 h, N1: NaCl treatment for 1 h, and N1.5: NaCl treatment for 1.5 h; -1,2,3 represent replications). The X-axis represents the sample groups, and the Y-axis demonstrates the relative content of the standardized metabolites. Sub-class represents the number of the metabolite categories with the same changing trend, and the metabolite illustrates the number of metabolites in the category (metabolites within each sub-class are given in Table S9).
Agronomy 12 01849 g006
Figure 7. Venn diagrams representing the consensus results of DAMs for the classification of the samples via metabolites accumulation in treated samples, which were created with the statistical package edgeR using three biological replicates for comparing CK and NaCl-treated seedling sample comparison groups (CK: no treatment; N0.5: NaCl treatment for 0.5 h; N1: NaCl treatment for 1 h; and N1.5: NaCl treatment for 1.5 h. (a) CK-vs.-N0.5; CK-vs.-N1; CK-vs.-1.5; (b) N0.1-vs.-N1, N0.5-vs.-N1.5, and N1-vs.-N1.5).
Agronomy 12 01849 g007
Figure 8. Heat map analysis of DAMs exhibiting fold changes of highly significant (p < 0.05) DAMs grouped into more than 16 classes related to different treatment groups and CK. The four columns represent the treatment groups and CK samples (green: control, brown: N0.5 h, indigo: N1 h, magenta: N1.5 h; −1, −2, −3 represent replications), with three further sub-divisions, one for each biological replicate in every sampled group. The correlation coefficients were utilized to classify different features determined by the Pearson correlation based on the averages/means as a clustering algorithm. The color gradient from red (3) to green (−3) depicts the number of compounds, presented as a relative fold change.
Agronomy 12 01849 g008
Figure 9. Conjoint analysis of the transcriptome and metabolome for the abundance of DEGs and DAMs involved in the production and regulation of glucose-1-phosphate (G1P), uridine 5′-diphospho-D-glucose (UDP-G1c), and 2-deoxyribose 1-phosphate (dR-1-P) in the CK and seedling samples that were NaCl-pre-treated for 0.5, 1, and 1.5 h in cotton seedlings, illustrating the KEGG pathway enrichment of DEGs and DAMs. (a) CK-vs.-N0.5, (b) CK-vs.-N1, (c) CK-vs.-1.5, (d) N0.1-vs.-N1, (e) N0.5-vs.-N1.5, and (f) N1-vs.-N1.5.
Agronomy 12 01849 g009
Figure 10. Heat maps of correlation coefficient matrices between DAMs and DEGs with the Pearson correlation coefficient above 0.8, which resulted from the combined analysis of transcriptome and metabolome metabolites in comparison groups of seedling samples of cotton seeds pre-treated with NaCl for 0.5, 1, and 1.5 h, as well as the CK group. The color gradient from red to green demonstrates a positive to a negative correlation between seedling comparison groups: (a) CK-vs.-N0.5, (b) CK-vs.-N1, (c) CK-vs.-1.5, (d) N0.1-vs.-N1, (e) N0.5-vs.-N1.5, and (f) N1-vs.-N1.5.
Agronomy 12 01849 g010
Figure 11. Correlation network diagram of DEGs and DAMs involved in the production and regulation of glucose-1-phosphate (G1P), uridine 5′-diphospho-D-glucose (UDP-G1c), and 2-deoxyribose 1-phosphate (dR-1-P) of cotton seedlings in the CK group and seedling samples that were NaCl-pre-treated for 0.5, 1, and 1.5 h, illustrating the KEGG pathway enrichment of DEGs and DAMs viz. (a) CK-vs.-N0.5, (b) CK-vs.-N1, (c) CK-vs.-1.5, (d) N0.1-vs.-N1, (e) N0.5-vs.-N1.5, and (f) N1-vs.-N1.5. Green circles represent DAMs. In contrast, s represents DEGs, while the connecting lines represent their correlations, with solid ones for positive correlations and dotted ones for negative correlations.
Agronomy 12 01849 g011
Publisher’s Note: MDPI stays neutral with regard to jurisdictional claims in published maps and institutional affiliations.

