Abstract
The tea root system plays a key role in the uptake of nutrients and water from the soil. The effect of integrated fertilizers (Control (CK) (no fertilizers), 100% NPK, 100% NPK withbiochar (NPK + B), 50% NPK with 50% rapeseed cake (NPK + RC), and 100% rapeseed cake (RC))on alterations in root growth characteristics and soil physical properties, nutrient uptake, NUE, and biomass production of tea (Longjing 43) was studied in an Alfisol at the greenhouse of the China Tea Research Institute, Chinese Academy of Agricultural Sciences, Hangzhou, during 2020–2021. The results showed that the conjunctive application of mineral fertilizers with rapeseed cake (NPK + RC) resulted in significant (p < 0.05) reductions in soil penetration resistance (14.8%) and bulk density (8.7%) and improvement in porosity (9.9%) compared to the control. NPK + RC recorded significantly higher (p < 0.05) root surface area, root volume, root tips, root length, and root CEC of tea than NPK (15%, 20%, 27%, 6%, and 11%) and control (40%, 165%, 49%, 68%, and 12%). The combinedapplication of RC and NPK fertilizer significantly decreased the specific root surface area (137%) and specific root length (66.8%) compared to the control. Root, stem, leaves, and total biomass were improved by integrated fertilization compared to the control and mineral fertilization. The nutrient content (N,P,K), nutrient uptake, NUE, nutrient uptake per root length, volume, and surface area of tea plants under NPK + RC and NPK + B were significantly (p < 0.05) higher than RC and CK. Therefore, the integrated use of rapeseed cake with mineral fertilization in Alfisol should be practiced in tea plantations to improve soil physical environment, root proliferation and root CEC, nutrient uptake, and NUE and achieve higher tea biomass production through the efficient exploitation of nutrients.
1. Introduction
Sustainable tea planting requires the rational handling of nutrient resources and maintaining the fertility of soil. However, the diminution of soil fertility is amajor problem for maintaining agricultural production and productivity in many countries. One of the most significant sources of nutrient input is soil fertilizer [1,2]. Fertilizers which can be inorganic or organic, provide essential nutrients that enhance plant growth and maximize yield. Chemical fertilizers have been used since 1800, mineral fertilizers are regarded as the main source of plant nutrients. However, using inorganic fertilizers alone cannot solve the problem of low soil fertility. It is well known that many manufactured inorganic fertilizers do not contain micronutrients that are essential for plant growth and development. Since it has been reported that these elements are lacking in tea garden soil, it is necessary to apply nutrient sources to reduce or eliminate these elements [3,4,5].
Organic fertilizers directly affect the yield and growth of tea by providing nutrients, and indirectly by changing physical properties of soil, thus ameliorate the root environment and promoting plant growth [4]. It has been shown that the soil structure is improved though the addition of organic matter in the form of farmyard manure or crop residue increases permeability. However, neither organic nor inorganic fertilizers alone can maintain plant productivity [6,7]. Therefore, judicious exploit of inorganic and organic fertilizers is vital to maintain soil health and increase input use efficiency and productivity.
Plants growth depends on the interaction of plant roots and soil properties. Soil is the medium for the growth of plant roots. The root absorbs water and nutrients from the soil and acts as anchor to prop up shoots [4]. The maximum growth of plants depends on whether the soil has the appropriate physical, chemical and biological conditions required by the root system to amplify the uptake of nutrients and water. The rate of nutrient uptake is related to the processes occurring in the roots of plants and in the soil. Each of these processes plays a significant role in providing essential nutrients to the shoot [6,7,8]. The knowledge related to root growth and absorption provides the possibility of manipulating root morphology to improve the plant’s macro- and micronutrients capture and biomass production. Fertilization is an effective way to alter rhizosphere process and root growth to ameliorate plant growth and nutrients utilization in the farming system [9]. The research on the root system of tea plants is one of the most auspiciousbut least explored areas of investigation related to mineral nutrition. There is little research on roots, mainly due to their growth habits and physical location (underground). Understanding the nutrient absorption of the roots is significant to improve the tea leaves’ productivity [10].
There is very little information on the comprehensive study of the integrated use of chemical fertilizers, biochar, and rapeseed cake on tea growth, nutrient uptake, NUE, root proliferation, and biomass production. It is hypothesized that due to the application of biochar and rapeseed cake with mineral fertilizers, the physical properties of the soil improve, which results in the improvement inplant growth characteristics, such as root growth characteristics, root CEC, biomass production, and partitioning, and eventually affects the input use efficiency and productivity of tea. In this context, the objectives of this study were to investigate the effect of the application of chemical fertilizers alone or in combination with rapeseed cake and biochar on changes in the physical properties of soil, viz., soil penetration resistance, bulk density, soil total porosity, and the plant growth parameters, viz., root growth and CEC, shoot growth, nutrient use efficiency, nutrients uptake, and biomass production and partitioning. We also investigated the effect of the physical properties of soil on root growth, nutrient uptake, NUE, and biomass production of tea at the Tea Research Institute, Chinese Academy of Agricultural Sciences, Hangzhou, China.
2. Materials and Methods
The pot experiment was conducted in the greenhouse of the Tea Research Institute, Chinese Academy of Agricultural Sciences, Hangzhou city (120°05′ E, 30°10′ N, 22 m above mean sea level), during 2020–2021, located in the primary green tea growing region of China.
2.1. Climate and Soil
The experimental site has a subtropical humid climate with average relative humidity was about 70%. The average minimum temperature is 13.5 °C (56.3 °F), and the average maximum temperature is 22.8 °C (73 °F) (Figure 1). According to the Genetic Soil Classification of China (GSCC) the experimental soil was classified as red-Yellow Soil, which was equivalent to Alfisol in the World soil Resources Reference Base [11,12], and was collected from Royal Tea Village Co., Ltd. Garden (Shaoxing, China), at a depth of 20 cm. According to Bao [13], prior to the commencement of the experiment the basic properties of the soil were determined (Table 1). These properties were: pH 4.35, EC 108 μS cm−1, soil organic carbon (C) 17.8 g kg−1, soil total nitrogen (TN) 2.6 g kg−1, soil total phosphorus (TP) 0.74 g kg−1, soil total potassium (TK) 12.1 g kg−1, soil available phosphorus (AP) 30.2 mg kg−1, soil available potassium (AK) 113.5 mg kg−1, soil Ammonium 32.4 mg kg−1, and Nitrate 15.71 mg kg−1.
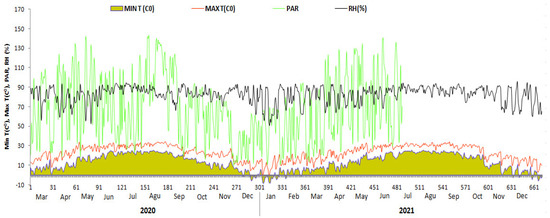
Figure 1.
Weather data of the Tea Research Institute, Chinese Academy of Agricultural Sciences, Hangzhou city, during entire experiment duration (2020–2021). Min T(Co) = Minimum temperature; Max T(Co) = Maximum temperature; PAR = Photosynthetic Active Radiation (mol m−2 d−1); RH(%) = Relative humidity.

Table 1.
Main soil characteristics at 0–20 cm soil depth.
2.2. Seedling Establishment and Treatments
Tea seedlings were germinated from seeds of cultivar ‘Longjing 43′ [14]. The field soil was first air-dried, sieved through a 2 mm size fraction, and then mixed well and loaded into the pots with 3 cm perlite at the bottom. Three tea seedlings were planted in small pots (14 cm in inside diameter, 24 cm in depth) loaded with 4.6 kg soil in March 2020. After 1 month, the healthy seedling was left, and the remaining seedlings were discarded. Seven months later (Oct 2020), the tea plants were transplanted into big pots.
We weighed eight (8) kg of soil into individual pots with dimensions of 25 × 25 cm (internal diameter × depth). The experimental treatments consisted of: control (CK) (no fertilizers), 100% NPK, 100% NPK+ biochar (NPK + B), 50% NPK + 50% Rapeseed cake (NPK + RC), 100% Rapeseed cake (RC).
NPK was used at a rate of 75:10:25 mg kg−1 soil. The application rates of biochar and Rapeseed cake were 1.25 and 1.26 g kg−1 soil. Urea (46% N) was used as nitrogen fertilizer, KH2PO4 (30.97% P2O5 and 39.09% K2O) was used as compound fertilizer for phosphorus and potassiumfertilizer, and potassium chloride (KCl) (60% K2O) was used as potassium fertilizer. The biochar used in this study was made from rice straw heated at 500 °C for approximately 120 min under oxygen-limited conditions. The rapeseed cake contained approximately 5.98%, 3.42%, and 1.96% N, P, and K, respectively. The rapeseed cake and biochar were mixed with soil and then loaded into the pots, while a solution of urea, KH2PO4, and KCl were prepared and applied in 3 split doses at two-week intervals in July to August 2020 and after transplanting in Dec 2020 to Jan 2021. The soil moisture was maintained at about 30% (w/w) by weighting. Random complete block design (RCBD) with four replications was used for the arrangement of treatments. The soil, root, and plant samples were taken in Oct 2021.The duration of the experiment was 20 months (600 days).
2.3. Soil Physical Properties
With the help of a piece of wood and a small hammer, an undisturbed soil core was collected in a cylinder of galvanized iron (metal) with an inner diameter of 5 cm, a height of 5 cm and sharp edges. During soil sampling with a moisture content of 10 to 12 percent, precautions were taken to avoid soil disturbances inside the metal cylinder, and they werestored carefully in polyethylene bags. To obtain the dry weight of the soil, the soil core was dried in an oven at 105.8 °C for 24 h. The ratio of soil dry weight to the inner volume of the metal core is expressed as bulk density in g cm−3. The BD of uninterrupted soil samples was calculated using the following equation:
where “BD” is the bulk density (g cm−3) of soil, “Ws” is the dry weight (g) of soil, and “Vs” is the volume (cm3) of soil sample.
The total porosity (P) of soil was calculated based on the bulk density and particle density. When the soil profile was close to the field capacity moisture content, soil strength (cone penetration resistance) was measured using a handheld recording penetrometer (Bush soil penetrometer, Eijkelkamp Agriresearch equipment, Geisbeck, Netherlands), which had a cone angle of 300 with 12.8 mm diameter, which recorded aresistance of soil penetration at 3.5 cm intervals up to the soil depth of 25 cm [15]. Four random pots were taken for average penetration resistance, which was expressed as MPa.
2.4. Biomass Production
For all plants per each treatmentunit, the shoot was cut at the crown level (the separation point of stem and the root system), all the leaves were plucked, and the plant was separated into leaves, stem, and root. The stems (cut into 8–10 cm long pieces) and leaves were dried to constant weight in an oven at 65 °C, and the dry biomass weights were recorded. The dried stem and leaves samples were ground, passed through a 0.7–1.0 mm mesh sieve, and stored in a zip lock bag before analysis.
2.5. Root Studies
The tea roots were immersed in a bucket of water for 10 min to soak. The soaked roots were placed on a polythene mat, which was spread on flat surface and washed slowly underrunning water. When most of the soil was removed, the roots were placed in a 2 mm mesh grid, and the water pressure was increased to remove soil particles attached to roots. Care was taken to retain all roots including tiny feeders. After washing, the mixture of live roots (white color) organic debris and dead roots (dark color) was carefully separated on the sieve [16]. An Epson scanner V700 (B11B178011, EPSON, Long Beach, CA, USA) was used to obtain root images of each pot. Root images were analyzed with the help of [17] WinRHIZO (Pro2004b) software (Instrument Regency, Quebec City, QC, Canada) to measure the average root diameter (ARD), total number of root tips, root volume (RV), root surface area (RSA), and the total root length (TRL). According to Mosaddeghi et al. and Li et al. [18,19], roots dry weight measurement were measured by drying roots samples at 105 °C for 20 min and then dried to constant weight for 48 h at 75 °C. The samples were groundand passed through a 0.7–1.0 mm sieve.
Determination of specific root length (SRL, m g−1), specific root surface area (SRS, m2 g−1), and root–shoot ratiowas performed as follows:
Determination of the root volume of 10 diameter classes (from 0 mm to 2 mm, with a class width of 0.2 mm) with WinRHIZO software for root tissue density (RTD IA) was calculated as follows:
where J represents the number of diameter classes. The number and width of the diameter classes do not influence VIA (data not shown) because VIAi measurements at each pixel were independent of the diameter classes:
Determination of Root Cation Exchange Capacity
After thorough mixing, 100 mg of sub samples were withdrawn for CEC measurement. The milled roots were placed in a 400 mL beaker, moistened with a few drops of distilled water, and were allowed to become thoroughly wet. This prevented root material from floating tothe surface during the next stage. 200 mL 0.01 N HC1 was added and stirred intermittently for 5 min. The root material was allowed to settle out, then bulk of acid was quickly decanted through a filter funnel (18.5 cm Whatman No. 1). Roots and funnel were washed using a jet of distilled water, and the washing was continued until washings were free of chloride (300 mL was generally adequate). The filter paper was pierced, and root material was washed in a 250 mL beaker using a total of 200 mL M KC1 (adjusted to pH 7.0). The pH of the root KCl suspension was measured using a glass electrode, adding adequate 0.01 N KOH to restore the pH to 7.0 with sporadically stirring, and the pH was maintainedat 7.0 throughout 5 min of arbitrary titration. The cation exchange capacity of roots was expressed as c mol (p+) kg−1 dry root [20].
2.6. Nutrients Uptake
An aliquot of 100 mg from each dry sample was used to determine total N in roots, stems, and leaves. The measurement was performedautomatically in the element analyzer (Vario Max CN Analyzer, Elementar Analyzes Systeme GmbH, Langenselbold, Germany). Nutrient content in roots, stems, and shoots was determined by inductively coupled plasma atomic emission spectrometry (ICP-AES, Thermo Jarrell-Ash Co., Ltd., Franklin, MA, USA). After determining the concentration of N, p, and K in the root, stem, and young shoot, the nutrient uptake by tea root, stem, and young shoot wascalculated using the equation described by [21]:
Nutrient (N, P, and K) uptakes per root morphology (length, volume, and surface area) were calculated as follows:
Nutrients use efficiency
Nutrients use efficiency was estimated as mg leaves produced per mg nutrients (N, P, K) applied. It was calculated using the formula below [22]:
where, LDWf = Leaves dry weight of fertilized treatment; LDWc = Leaves dry weight of control treatment; Ns = Nutrient supplied
2.7. Statistical Analysis
Data on plant and soil properties were analyzed by analysis of variance (ANOVA). The F test was used to determine the significance of the treatments, and the least significant differences (LSD) and Duncan’s new multiple range test (MRT) were used to determine the significance of the difference between the two treatment means. All of the above statistical analyses (ANOVA, F-test, LSD, MRT) were carried out by ‘Statistix8′ and [23] for data analysis. For Pearson’s correlation analysis, IBM SPSS Statistics 20 was used. Principal component analysis (PCA) was carried out in the R platform with the ‘factoextra’ and ‘FactoMineR’ packages (version 3.5.1).
3. Results
3.1. Soil Bulk Density, Porosity, and Penetration Resistance
The soil bulk density under rapeseed cake (RC) and integrated fertilizers, NPK + RC and NPK + B, was significantly 12.4%, 8.7%, and 7.8% lower than the control (CK) and 11.3%, 7.5%, and 6.6% lower than the NPK treatment, respectively (Figure 2a). The lowest bulk density was recorded in the RC treatment, followed by the NPK + RC and NPK + B treatments. However, the differences between the soil bulk density of the CK and NPK treatments was statistically not significant.
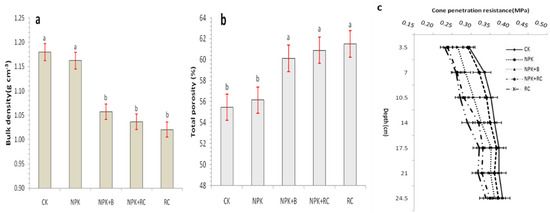
Figure 2.
Effect of integrated fertilizers management on (a) Bulk density (g cm−3), (b) Total porosity (%), and (c) Penetration resistance (MPa) of soil. CK = Control; NPK = Mineral fertilizers; NPK + B = Mineral fertilizer + Biochar; NPK + RC = Mineral fertilizer + Rapeseed cake; RC = Rapeseed cake; different lowercase letters indicate significant differences at p < 0.05, and the vertical bars represent the standard error of the mean (n = 4).
The results in Figure 2b show that different fertilization treatments had significant effects on soil porosity (p ≤ 0.05). The control treatment (CK) had the lowest soil porosity of 55.46%, which was significantly different from other treatments, except NPK fertilizer (56.13%). Meanwhile, the highest soil porosity was recorded in rapeseed cake (RC) (61.50%), followed by chemical fertilizer with rapeseed cake (NPK + RC) (60.89%) and chemical fertilizer with biochar (NPK + B) (60.12%), and was significantly different from other treatments (Figure 2b).
The penetration resistance curves determined for a 0–25 cm soil depth was shown in Figure 2c. The applications of organic fertilizer (RC) and integrated fertilizer (NPK + RC and NPK + B) had an important (p <0.05) and significant impact on soil penetration resistance. The highest average penetration resistance value was recorded in the control (CK) pots (0.35 MPa), followed by mineral fertilizer (NPK) (0.34 MPa). The lowest average penetration resistance values were obtained with rapeseed cake (RC) (0.29 MPa), mineral fertilizer with rapeseed cake (NPK + RC) (0.30 MPa), and mineral fertilizer with biochar (NPK + B) (0.32 MPa) applications (Figure 2c). In all treatments, the soil penetration resistances (PR) increase with depth. Although PR values were different for depths, there was no significant difference in soil penetration resistance (PR) between NPK and control treatments, the impact on Penetration resistances (PR) was relatively similar for NPK and control.
3.2. Root Morphology
Root length (RL), root volume (RV), and root surface area (RSA) were significantly influenced by NPK + RC and NPK + B (Figure 3a–c). Incorporating organic sources into the soil will reduce the soil bulk density and increase the porosity, which helps the root system to grow, penetrate deeply, and absorb nutrients. The higher RL, RV, and RSA were recorded in the pots receiving rapeseed cake (RC) along with mineral fertilizers (NPK), followed by the NPK + B-treated pots. The RL, RV, and RSA for NPK + RC and NPK + B treatments increased by 67.83%, 164.53%, and 39.70% and 69.19%, 159.56%, and 38.92% as compared to the control (CK) treatment. There were no statistically significant differences in root surface area between control and rapeseed cake treatments (Figure 3b).
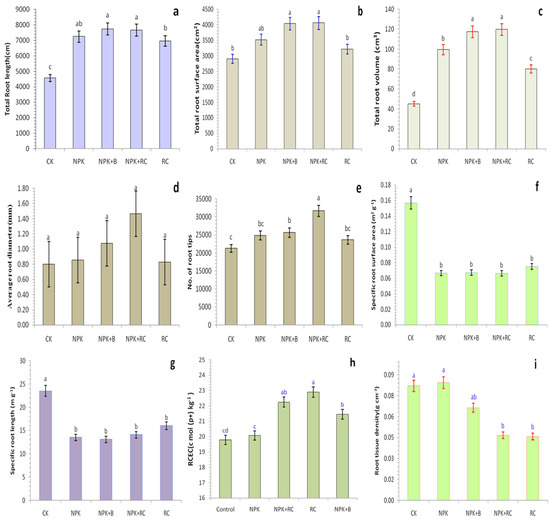
Figure 3.
(a) Total root length, (b) Total root surface area, (c) Total root volume, (d) Average root diameter, (e) No. of root tips, (f) Specific root surface area (SRS), (g) Specific root length (SRL), (h) Root cation exchange capacity (RCEC), and (i) Root tissue density (RTD) as influenced by integrated fertilizers management. CK = Control; NPK = Mineral fertilizers; NPK + B = Mineral fertilizer + Biochar; NPK + RC = Mineral fertilizer + Rapeseed cake; RC = Rapeseed cake; different lowercase letters indicate significant differences at p < 0.05, and the vertical bars represent the standard error of the mean (n = 4). ns = non-significant, sig = significant.
3.3. Average Root Diameter, Root Tissue Density, and Number of Root Tips
The average root diameter (ARD) of tea plants were not significantly affected by different fertilization treatments, but the total number of root tips and root tissue density (RTD) were significantly affected by different integrated fertilizers treatments (Figure 3d,e,i). Integrated Fertilizers increased the total numbers of root tips but decreased the root tissue density (RTD) of tea plants. The RTD values ranged from 0.046 to 0.084 g cm−3, with a mean value of 0.065 g cm−3 (Figure 3i). The highest root tissue density was observed in the roots treated with mineral fertilizer (NPK) (0.084 g cm−3) and the control (CK) (0.082 g cm−3). In all other treatments, the RTD was below 0.07 g cm−3. The lowest RTD was obtained in RC (0.047 g cm-3), NPK + RC (0.047 g cm−3), and NPK + B (0.066 g cm−3) treatments. The difference between NPK + RC and RC treatments and CK and NPK treatments were not statistically significant.
The integrated use of RC and the recommended dose of chemical fertilizer (NPK) significantly increased the total number of tea plant root tips by 27.4% over NPK, 34% over RC, and 48.8% over the control treatment (Figure 3e). The NPK + B treatment compared with CK increased the total number of tea plant root tips by 20.5% and 8.5% compared with RC treatment. The difference between the RC and NPK treatments was not significant.
3.4. Specific Root Length and Specific Root Surface Area
The specific root length (SRL) and specific root surface area (SRS) of tea in the control treatment were significantly higher (p ≤ 0.05) than the remaining fertilizer treatments (RC, NPK + RC, NPK + B, and NPK), but there were no significant differences among the NPK, RC, NPK + B, and NPK + RC treatments (Figure 3f,g). The highest SRL and SRS were recorded in CK (23.51 m g−1 and 0.157 m2 g−1), while the lowest SRS was recorded in NPK + RC (0.066 m2 g−1) fellow by NPK + B (0.067 m2 g−1) and NPK (0.067 m2 g−1) treatments. The lowest SRL was noted in NPK + B (13.12 m g−1), followed by the NPK (13.51 m g−1) treatments (Figure 3f,g). The SRL and SRS in NPK + RC and NPK + B treatments arelow due to the higher root biomass as compared to CK and RC treatments, which had lower root weight.
3.5. Root Cation Exchange Capacity (RCEC)
The data presented (Figure 3h) show that the cation exchange capacity of roots ranged from 19.79 to 22.90 c mol (p+) kg−1 in the CK and combined fertilizer (NPK + RC) treated pots, respectively. Integrated fertilizer management had a significant effect on the cation exchange capacity of tea roots. The highest RCEC was recorded in the rapeseed cake (RC) pots (22.90 c mol (p+) kg−1), followed by mineral fertilizer along with rapeseed cake (NPK + RC) (22.25 c mol (p+) kg−1) and mineral fertilizer in combination with biochar (NPK + B) (21.45 c mol (p+) kg−1) as compared with CK. The RCEC of tea had a non-significant difference under the mineral fertilizer (NPK) (20.07 c mol (p+) kg−1) and CK (19.79 c mol (p+) kg−1) treatments (Figure 3h).
3.6. Root-Shoot Dry Mass Ratio (RSDM) andBiomass Production and Partitioning
The integrated fertilizer treatments had significant effects on the root-to-shoot ratio (RSDM) of tea (Figure 4a). The RSDM ratio was highest in the pots with mineral fertilizer (NPK) (1.11) and mineral fertilizers with biochar (NPK + B) (1.03) and was significantly higher than the control (CK) (0.82) and NPK + RC (0.76) treatments (Figure 4a or Figure 5b). In the NPK + RC treatment, the RSDM ratio was low because the shoot biomass were higher than root biomass, while in NPK and NPK + B the RSDM is higher due to higher root biomass as compared to shoot biomass.
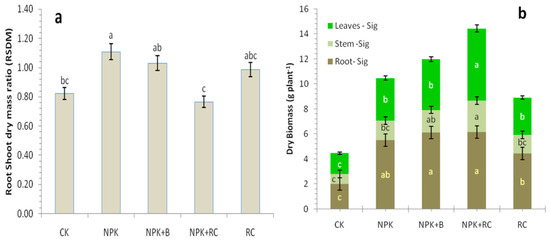
Figure 4.
Effect of integrated fertilizers management on (a) root–shoot dry mass ratio (RSDM) and (b) Biomass production and partitioning in to root, stem, and leaves of tea. CK = Control; NPK = Mineral fertilizers; NPK + B = Mineral fertilizer + Biochar; NPK + RC = Mineral fertilizer + Rapeseed cake; RC = Rapeseed cake; different lowercase letters indicate significant differences at p < 0.05, and the vertical bars represent the standard error of the mean (n = 4). ns = non-significant, sig = significant.
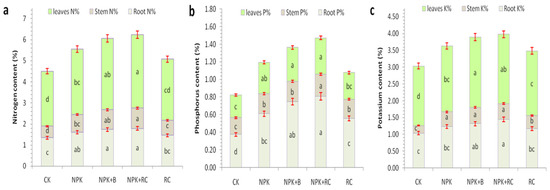
Figure 5.
(a) Nitrogen content, (b) Phosphorus content, (c) Potassium content as influenced by integrated fertilizers management. CK = Control; NPK = Mineral fertilizers; NPK + B = Mineral fertilizer + Biochar; NPK + RC = Mineral fertilizer + Rapeseed cake; RC = Rapeseed cake; different lowercase letters indicate significant differences at p < 0.05, and the vertical bars represent the standard error of the mean (n = 4). Ns = non-significant, sig = significant.
Figure 4b showed the biomass accumulation in different components of tea plants grown under different nutrient management. It illustrated that tea plants receiving NPK + RC and NPK + B produced significantly more leaves, stem, and root biomass than those receiving the NPK and control (CK) treatments. In NPK + RC- and NPK + B-treated tea, the maximum leaves biomass was 5.8 and 4.1 g plant−1, stem biomass was 2.5 and 1.8 g plant−1, and root biomass was 6.2 and 6.1 g plant−1, respectively.
It is obvious from the data that the percentage of contribution of plant parts to the total biomass were significantly affected by the treatment. The total biomass production under NPK + RC and NPK + B were 224% and 169%higher than the control (CK) treatment and 62% and 34% higher than the rapeseed cake (RC) treatment, respectively (Figure 4b). The total biomass of plants consisted of 39.95% and 33.91% leaves, 17.52% and 15.16% stem, and 42.54% and 50.93% root in plants receiving the NPK + RC and NPK + B treatments (Figure 4b). The biomass partitioning indicated that roots were the major sink of photosynthetic with the proportion varying from 42.5% in NPK + RC, 50.9% in NPK + B, 52.5% in NPK, and 44.8% in CK; plant leaves became the second major sink of photosynthetic after roots (Figure 4b). The biomass of roots, leaves, and stems ranged from 1.99, 1.66, and 0.81 g plant−1 in the control to 6.15, 5.77, and 2.53 g plant−1 in the NPK + RC treatment. The partitioning of biomass towards roots were more in the CK and NPK treatments then NPK + RC and NPK + B treatments. Therefore, the root-to-shoot dry mass ratio was high in the control and NPK treatments. The root biomass of the NPK + RC treatment was higher than the control and NPK treatments.
3.7. Nutrients Contents in Root, Stem, and Leaves of Tea
In this study, we found that the use of integrated fertilization significantly improved the nutrients (N, P, and K) content in the root, stem, and leaves of tea (Figure 5a–c). The highest N content in the root (1.79%), stem (0.97%), and leaves (3.49%) were recorded in combine fertilizer (NPK + RC), while the lowest N contentswere in the control (CK) recorded (1.35%, 0.55%, and 2.60%) and the rapeseed cake (RC) (1.46%, 0.72%, and 2.90%) treatments. Compared with the control, the NPK + RC and NPK + B treatments increased the root N content by 32.4% and 29.1%, the stem N content by 76.8% and 69.7%, and the leaves N content by 33.8% and 30%, respectively (p < 0.05) (Figure 5a). The analysis of variance results showed that the P and K content in the root (0.81% and 1.45%), stem (0.25% and 0.46%), and leaves (0.41% and 2.06%) were highest in the NPK + RC treatment followed by the NPK + B treatment, while the lowest P and K content were observed in the CK and RC treatments (Figure 5b,c). The NPK + RC treatment had 116%, 32% and 58% higher P contents and 40%, 106%, and 16% higher K contents in the root, stem, and leavesas compared to the control (CK). There were no significant differences between the NPK + RC and NPK + B treatments in leaves P content and among the NPK + RC, NPK + B, and NPK treatments in the stem’s K content.
3.8. Nutrients Uptake by Tea Plant
The integrated use of fertilizers significantly improved the nutrients uptake by tea root, stem, and leaves (Figure 6a–c). The nutrients (N, P, and K) uptake in the root, stem, and leaves for the NPK + RC treatments were respectively higher by 299% N, 543% P, and 333% K for root; 468% N, 322% P, and 555% K for stem; and 368% N, 454% P, and 303% K for leaves than the control. Similarly, the use of the recommended dose of NPK with biochar (NPK + B) increased the N, P, and K uptakes by tea root (285%, 492%, and 299%), stem (297%, 173%, and 373%), and leaves (220%, 253%, and 189%), respectively, over the control. There were no significant differences between NPK and RC treatments for stem K uptake, between NPK and NPK + B treatment for stem P uptake. In addition, no significant differences were noted for root N, P, and K uptake between NPK + RC and NPK + B treatments. The highest nutrient uptake was recorded in the NPK + RC treatment, followed by NPK + B, while the lowest nutrients uptake was recorded in the control (CK) and rapeseed cake (RC) treatments (Figure 6a–c). The majority of the N uptake was allocated to leaves, followed by the root and stem organs of the tea plant (Figure 6(a1)), while more P uptake in tea plant was recorded in root, followed by the leaves and stem (Figure 6(b1)). In tea plants, the highest K uptake was observed in the leaves and roots, while the lowest uptake was noted in the stem (Figure 6)c1)).
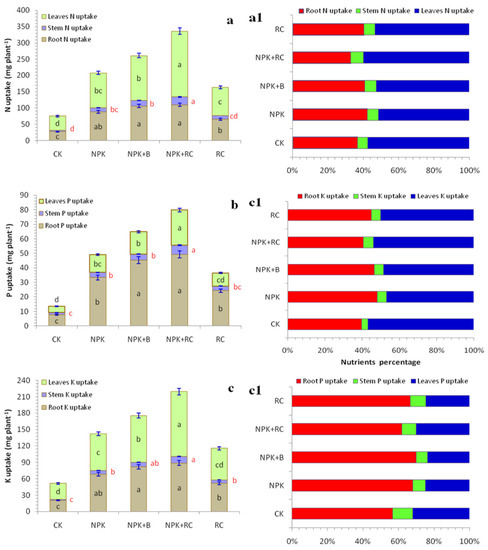
Figure 6.
(a,a1) N uptake, (b,b1) P uptake, and (c,c1) K uptake of tea plant as influenced by integrated fertilizers management. CK = Control; NPK = Mineral fertilizers; NPK + B = Mineral fertilizer + Biochar; NPK + RC = Mineral fertilizer + Rapeseed cake; RC = Rapeseed cake; different lowercase letters indicate significant differences at p < 0.05, and the vertical bars represent the standard error of the mean (n = 4).
3.9. Nutrients Use Efficiency of Tea
In this study, we found that the use of integrated fertilizer significantly increased the nutrients use efficiency of tea. Compared to organic or chemical fertilizer alone, combined applications of organic and synthetic fertilizers improved the nutrients use efficiency in tea plant (Figure 7). The highest nitrogen use efficiency (NUE), phosphorus use efficiency (PUE), and potassium use efficiency (KUE) were observed in rapeseed cake with NPK fertilizer (NPK + RC) (54.65, 410.27, and 178.91 mg mg−1) and biochar with NPK fertilizer (NPK + B) (32.01, 240.28, and 104.78 mg mg−1), while the lowest NUE, PUE, and KUE were recorded in RC treatment (17.70, 132.85, and 57.93 mg mg−1), followed by chemical fertilizer (NPK) (23.24, 174.48, and 76.09 mg mg−1) (Figure 7). There was small difference in the NUE and KUE between the NPK and RC treatments. Integration fertilization (NPK + RC and NPK + B) improved the nutrients use efficiency in tea plant as compared with the application of organic and chemical fertilizers alone.
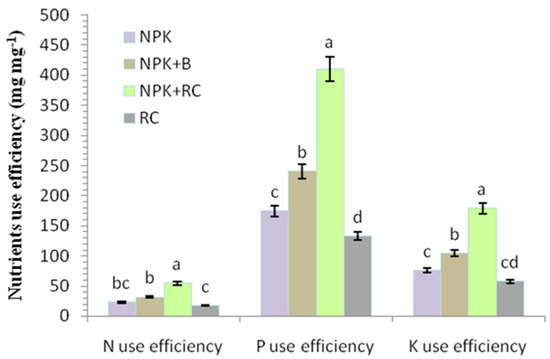
Figure 7.
Effects of integrated fertilizers management on nutrients use efficiency leaves of tea. CK = Control; NPK = Mineral fertilizers; NPK + B = Mineral fertilizer + Biochar; NPK + RC = Mineral fertilizer + Rapeseed cake; RC = Rapeseed cake; different lowercase letters indicate significant differences at p < 0.05, and the vertical bars represent the standard error of the mean (n = 4).
3.10. Nutrients Uptake per Root Length, Volume, and Surface Area of Tea Plant
The results showed that organic and chemical fertilizers had a significant effect on the nutrient (N, P, and K) uptake per root volume, length, and surface area in tea plants. The uptake of N, P, and Kper root length were increased up to 144%, 300%, and 163% in NPK + RC and 136%, 260%, and 138% in NPK + B over the control (CK), respectively. Compared to the NPK treatment, the nutrients (N, P, and K) uptake per root length was improved by 18%, 43%, and25% in NPK + RC treatments and 14%, 28%, and 13% in NPK + B treatment (Figure 8a–c). Similar results were found for nutrients uptake (N, P, and K) per root volume. The uptake of nutrients (N, P, and K) per root volume increased by approximately 52%, 147%, and 59% in the NPK + RC treatment and 50%, 130%, and 49% in the NPK + B treatment over the control (CK), respectively. There was no statistically significant difference between the NPK + RC and NPK + B treatments. There was a significant increased (13.57%, 33.87%, and 14.92%) in the NPK + RC treatment as compared to rapeseed cake (RC) (Figure 8d–f). Integrated fertilization also significantly affected nutrients (N, P, and K) uptake per root surface area, and there was no significant difference between the NPK + RC and NPK + B treatments. The integrated fertilization (NPK + RC and NPK + B) significantly increased the nutrients (N, P, and K) uptake per root surface area by (173%, 341%, and 197%) and (164%, 307%, and 170%) over the control (CK) treatment, respectively. As compared to mineral fertilizer (NPK), integrated fertilizer (NPK + RC) improved nutrients (N, P, and K) uptake per root surface area by 6, 24, and 10% (Figure 8g–i). The combined application of organic and inorganic fertilizers (NPK + RC and NPK + B) enhances the nutrients (N, P, and K) uptake per root length, volume, and surface area as compared to the sole application of RC and NPK fertilization.
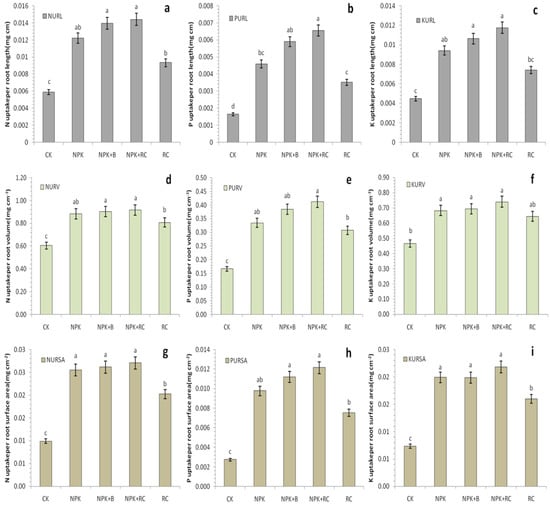
Figure 8.
(a) N uptake per root length(NURL), (b) P uptake per root length(PURL), (c) K uptake per root length(KURL), (d) N uptake per root volume(NURV), (e) P uptake per root volume(PURV), (f) K uptake per root volume(KURV), (g) N uptake per root surface area(NURSA), (h) P uptake per root surface area(PURSA), and (i) K uptake per root surface area(KURSA) as influenced by integrated fertilizers management. CK = Control; NPK = Mineral fertilizers; NPK + B = Mineral fertilizer + Biochar; NPK + RC = Mineral fertilizer + Rapeseed cake; RC = Rapeseed cake; different lowercase letters indicate significant differences at p < 0.05, and the vertical bars represent the standard error of the mean (n = 4).
3.11. Principal Component Analysis (PCA) and Pearson’s Correlation Analysis
Principal component analysis (PCA) was carried out to study the relationship among soil physical properties, root growth parameters, biomass, and nutrients content and uptake. The first two PCs (PC1 and PC2) explained 60% of the total variation in thedata (Figure 9b). There were three groupings of the treatments: group1 (Control), group2 (NPK), and group3 (NPK + B, NPK + RC and RC) (Figure 9a). The bulk density and penetration resistance of soil were negatively correlated with biomass production, plants nutrients contents, nutrients uptake, and root growth parameters (RL, RV, RSA, and RT) of tea, while soil porosity showeda positive correlation with biomass, nutrients contents and uptake, root morphology, and RCEC. The soil porosity is very strongly negative correlated with BD and PR of soil, while BD and PR were very strongly positive correlated with each other. Figure 9b showed strong positive correlations among biomass production, nutrients contents and uptake, root morphology, and RCEC.
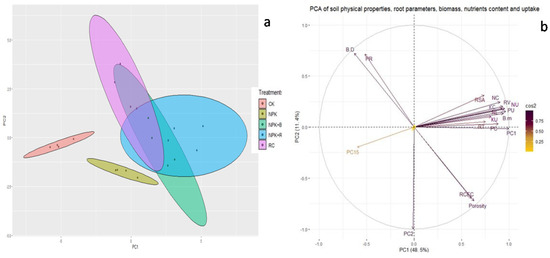
Figure 9.
(a,b) PCA of soil physical properties, root parameters, biomass, nutrients content and nutrients uptake of tea. BD = Bulk density; PR = Penetration resistance; RL = Root length; RV = Root volume; RSA = Root surface area; RT = Root tips; RCEC = Root cation exchange capacity; NC = Nitrogen content; PC = Phosphorus content; KC = Potassium content; NU = Nitrogen uptake; PU = Phosphorus uptake; and KU = Potassium uptake.
A Pearson’s correlation matrix for relations of soil physical properties (BD, PR, and soil porosity) with root growth parameters (RL, RV, RSA, and RT) and root cation exchange capacity, biomass (root, stem, and leaves), nutrients contents, and nutrients uptake in the root, stem, and leaves of tea were presented in Table 2. The soil BD and PR were negatively correlated and porosity was positive correlated with biomass, root growth parameters, and nutrients contents and uptake of tea. The root length, root volume, RCEC, stem and leaves biomass, root and stem phosphorus content, stem potassium content, and nutrients uptake in different parts of tea were significantly negatively correlated with the bulk density of soil, while significantly positive correlated with soil porosity. Other parameters had non-significant negative and positive correlation with bulk density and porosity of soil (Table 2). Soil penetration resistance had non-significant negative correlation with root growth parameters (RL, RV, RSA, and RT), biomass (RB, SB, and LB), nutrients content (RNC, RPC, RKC, SNC, SPC, SKC, LNC, LPC, and LKC), and nutrients uptake (RNU, RPU, RKU, SNU, SPU, SKU, LNU, LPU, and LKU) of tea except root cation exchange capacity (RCEC), which had a highly significantly strong negative correlation with soil penetration resistance.
Table 2.
Correlation coefficient of soil physical properties with root parameters, biomass, nutrients (N, P, and K) content, and nutrients (N, P, and K) uptake in root, stem, and leaves of tea plant.
4. Discussion
4.1. Effect of Integrated Fertilizer on Soil Physical Properties
Integrated fertilization and organic fertilization significantly improved the soil physical properties as compared to mineral fertilization and control, decreases BD and PR, and increased the total porosity of soil. Schjonning et al. [24] also accounted for the decrease in soil BD because of the addition of cow manure in an integrated fertilizer’s management study. The decline in soil BD may be because of higher soil organic carbon (SOC) content in the soil [25,26], improved aggregation, and augmented root growth and biopoes in manure- and fertilizer-treated plots. There may be several reasons for the observed decline in bulk density; this may be associated with the characteristics of biochar, such as active surface area, porosity, particle size, and soil properties. In addition, the ability of biochar to bind soil particles to form soil aggregates may also play a role in a decline in bulk density. Šimanský’s [27] study confirmed this finding. He found that the soil structure improved significantly after applying a 20 t ha−1 dose of biochar compared to the control. Biochar can enhance the physical properties of soils [28,29,30] by providing organic substances [31]. Oxidized biochar particles may contain carboxyl and hydroxyl groups on the surface, which can combine with minerals and other organic soil particles to form soil aggregates [32,33].
Due to its inertness, biochar was often used in combination with chemical and organic fertilizers to improve its role in the soil [34,35]. Fertilization, particularly N, P, and K, are important factors affecting BD. The chemical fertilizer added to the soil can work as an accelerator to increase the rate of mineralization of soil organic matter [31], which can lead to an increase in soil BD. However, the integrated application of mineral fertilizers and biochar had a significant positive effect on the incorporationof biochar into the soil, especially in sizeable aggregates [31], which assists inimprovingthe soil structure [36] and, finally, reduces the BD of the soil [35]. In our case, we observed a significant reduction in BD when biochar 1.26 g kg−1 soil was used in combination with chemical fertilizers (NPK) 75:10:25 mg kg−1 soil (Figure 2a). The explanation for these observations may be a specific amalgamation of chemical fertilization and biochar. The microbial activity of the soilimproved with the addition of chemical fertilizers [37], which in return enhanced the mineralization process of biochar in the soil, resulting in a subsequent improvement in the cation exchange capacity and active surface area of biochar [38], ensuing in an increase in soil aggregation capacity.
Adding manure with chemical fertilizers to the soil may have a real impact on soil porosity [39,40]. An increase in soil porosity may occur because organic matter may stimulate the formation of soil aggregates, as showed by a decline in soil bulk density. Due to the incorporation of organic fertilizers in the soil, the increase in soil aggregate stability leads to an increase in soil porosity [41]. Mandal et al. [42] pointed out that organic materials can be used as a binding agent between soil particles, which can improve the stability of soil aggregates, thereby improving the soil porosity. Furthermore, organic fertilizers had higher porosity and lower BD when added to the soil, resulting in a significant increase in soil porosity [43]. In addition, Al-Mohammedi [44] reported that organic materials affect microbial activity because they provide soil with carbon and nutrients necessary for microbial growth. Microbes bind soil particles together through hyphens and different exudates, thereby increasing soil porosity.
The application of organic fertilizer (RC) and integrated fertilizer (NPK + RC and NPK + B) significantly decreased soil penetration resistance. The binding effect of organic manure enhances soil porosity and aggregation, thus reducing soil PR [45,46]. This finding is consistent with many prior studies that have shown that applyingorganic fertilizers can reduce soil PR [11,47,48]. Similarly, Celik et al. [49] noted that compared with the application of mineral fertilizer alone and the control, the application of manure significantly reduced soil penetration resistance by 17.83 and 29.80%. BD and PR are used to characterize soil compaction, which affects soil functions and structural characteristics [50,51]. The highest PR and BD values were obtained in the control and chemical fertilizers, whereas the lowest values were founded in the application of organic fertilizers and integrated fertilizers. Maintaining a sufficient amount of organic matter can form stable soil aggregates, reduce BD, increase aggregation index, and reduce PR, which are useful indicators of soil compaction.
Our results clearly showed that the application of organic fertilizer is very important to stop the occurrence of soil compaction, which restricts aeration, hydraulic conductivity, mineralization and biological activity, root growth, and penetration. Organic fertilizer application is predominantly important in ecological or sustainable agricultural management. MacRae and Mehuys [52] also pointed out that the content of soil organic matterwas increased with the application of several organic amendments, thusreducing soil BD and compaction.
4.2. Effect of Integrated Fertilization on Root Morphology and CEC
The combined application of chemical and organic fertilizers (NPK + RC and NPK + B) significantly increased the volume of tea roots, root surface area, and root length. Previous studies have shown that organic modifiers have the potential to encourage root growth.It may be related to the fact that certain physiologically active substances and amino acids in organic fertilizers increase the biological activity of the plant rhizosphere [7,53]. In addition, the soil environment had a significant impact on plant root growth.The incorporation of organic fertilizers into the soil can have a beneficial effect on plant root growth by improving the physical and chemical environment of rhizospheric soils [54]. Mandal et al. and Rakesh et al. [55,56] reported that the combined use of chemical fertilizer and green manure or farmyard manure significantly increased root penetration depth, root volume, and root length density.
The biochar added to the soil forms an organic mineral complex that improves the nutrients status and availability of the soil; it can also improve the composition of the microbial community, strengthen the systemic plant defense, and reduce the load of soil pathogens, latterly improving the health of the plants and minimizing the harm to the environment [57]. Changxun [58] reported that biochar improved the root length, surface area, and volume of Poncirus trifoliata (L.) Raf. Seedling in Gannan acid red. Our results also showed that the application of biochar improved the root’s morphology of tea seedlings (i.e., RL, RSA, and RV). The current research results are consistent with the finding of Yang et al. [59], who concluded that the application of biochar can improve the root morphology of sugarcane varieties at the seedling stage.
Root tissue density (RTD) and root tips were significantly affected by integrating fertilizer treatments as compared to control and solo application of inorganic and organic fertilizer treatments. According to Olmo et al. [60], the addition of biochar enhanced wheat root length and reduced root diameter and RTD, which was attributed to a better resource acquisition. Biochar acts as a nutrient source and controls the acquisition of plant root nutrients by altering the soil’s macro- and micronutrient contents. Prendergast-Miller et al. [61] noted that the roots were attracted towards biochar. Głąb et al. [62] also recorded that the number of root tips was increased, and RTD was decreased with integrated fertilization.
The control treatment (CK) had higher specific root surface area (SRS) and specific root length (SRL) of tea than other fertilizer treatments (RC, NPK + RC, NPK + B, and NPK). If the supply of the soil macronutrients cannot meet the requirements of the plant, fertilization is necessary. However, with the application of different fertilizers, there are major differences in the amount and type of nutrients in the soil. By activating a developmental program that modifies root architecture to adapt to the changes in soil nutrients, plants can improve their nutrient’s uptake [63]. A higher SRL usually specifies a thinner root system, a smaller root diameter, a higher total RL, or less root dry weight [64]. After transplantation, fertilization significantly reduced SRL. This is consistent with the results of Xie et al. [64], who founded that the SRL of Vallisneria natans (Lour.) Hara grown in 3 different types of sediments with no fertilizers ranged from 306 to 339 m g−1, and with addition of nutrients it ranged from 258 to 281 m g−1. Compared to the control treatment, fertilizer applied to strawberries significantly reduced SRL [65]. This shows that the application of mineral nitrogen fertilizers and ammonium chloride (OIF) promoted root growths. Mandal et al. and Raksh et al. [55,56] reportedthat the use of inorganic fertilizers in combination with green manure or farmyard manure can significantly increase the plant root length, root dry weight, and root surface area. Changxun et al. [58] also stated that biochar can enhance the root surface area, volume, and length of Poncirus trifoliata (L.) Raf. Seedlings.
Integrated fertilizer management had a significant impact on the tea root CEC. The highest RCEC was noted in the RC treatment, followed by NPK + RC and NPK + B treatments as compared with the control (CK). Shenggang et al. and Bandopadhyay et al. [66,67] noted that the highest RCEC in farmyard manure amended soil can be attributed to organic matter that helps to make the soil more porous and pulverized, which ensures better root growth and thereby increases roots CEC. The improvement inroot CEC due to the addition of biochar can be ascribed to its influence on soil properties, which become more conducive to the development and growth of root, leading to an improvement in roots’ CEC [68,69]. Singh and Ram [70] recorded that the addition of animal manure to the soil significantly augmented the roots’ CEC of crops in the past two years. Therefore, its addition may prove useful to crop nutrition and yield. The obvious signs of cation exchange on the plant roots [71], lead to the hypothesis that differences in the number of cations removed from the plant were mainly controlled by the CEC of the plant’s root system, the valence of cations [72] and Donnan distribution laws [73]. This is in contrast to the results of Mouat [74], which illustrated that roots CEC was genetically controlled, while Chiranjeevi Rao et al. [75] discovered that different sugarcane variety had different roots CEC value. The CEC of the root seems to be a clonal characteristic that is not affected by changes in the ecological conditions.
4.3. Effect of Integrated Fertilization on Root–Shoot Dry Mass Ratio (RSDM), Biomass Production and Partitioning
The root-to-shoot ratio was higher with mineral fertilizer (NPK) and lower with integrated fertilizer (NPK + RC). Głąb et al. [62] reported that the root–shoot ratio was significantly higherin the control and straw treatments than in the biochar treatment, which could be due to the higher availability of nutrients and water after the use of biochar. This phenomenon can be explained by the theory of optimal partitioning. Plants assign their biomass to the organs with the most limited resources [76]. This optimized expression is a change in the allocation between roots and shoot biomass in response to nutrient availability. When nutrient availability or water supply increases, plant mass allocated to roots decreases because a minimum effort is required to obtain these resources [77,78].
Fertilizers increase leaf fraction and shoot–root ratio (SRR). In our study, the response of the unfertilized tea is consistent with the “functional balance” theory, which explain the response of the plant to the complexity of assimilate distribution. In this case, the deficiency of essential resources forces plants to invest in the structure responsible for the acquisition of theselimited resources [79]. The distribution of dry matter in plants is associated with the ratio of total dry matter to roots and shoots, which are the two main sinks in the plant. Shoots provide carbohydrates to roots and roots provide minerals and water to shoots. Therefore, the shoot-to-root ratio (SRR) is adjusted to theresponse index of the plant to factors affecting nutrient uptake and carbon synthesis [80]. The nutrients absorbed through the roots are then assimilated and incorporated into structural molecules such as chlorophyll, proteins, and enzymes. The carbon skeleton is mainly synthesized by the leaves in the presence of carbon dioxide (CO2) and 450, 550, and 200 photosynthetically active radiations (PAR) and then transferred to various sinks in the plant. Plants that receive sufficient nutrient supply without being restricted by water, assimilation in shoots increases to promote structural growths. As a result, the shoot-to-root ratioincreases [81,82]. This could explain why fertilizers increaseSRR.
Combined fertilization (NPK + RC and NPK + B) significantly increased biomass production of tea compared to CK and separate application of organic and mineral fertilizers. This verdict is consistent with the views of [83,84,85,86], who found that application of biochar + NPK increasedthe biomass yield of cowpea by 4–5 times compared to CK and by 70% compared to NPK treatment. Yang et al. and Saha et al. [87,88] illustrate the synergistic effect of mineral fertilizer and biochar on biomass. Soil properties, such as microbial activity, CEC, and pH, were improved by biochar [84,86,89]. The increase in tea biomass parameters of tea could be related to the improvement of soil microbial (soil fungal and bacterial diversity index), physical (soil bulk density, penetration resistance, and soil aggregate), and chemical properties (CEC, pH, OM, and nutrient content) of soil after the application of integrated fertilizer.
In this study, there was no significant effect of organic fertilizer application alone on tea biomass. These results are consistent with previous studies [11,90,91] and may indicate that pure organic fertilizer cannot meet the nutrient requirements of tea during the growth process. Biochar-based fertilizers use biochar as a soil conditioner and fertilizer as a source of macronutrients [89]. In addition, many researchers have indicated that the application of biochar improves the efficiency of mineral fertilizers [88,92]. We think this may be due to the adsorption of nutrients by biochar, which lead to sustained nutrient release and provide extra nutrients for tea growth. Biochar can play an important role in maintaining soil nutrients and pH, reducing nutrient leaching, and reducing nutrient loss during mineral fertilization, especially in subtropical tea growing areas with low pH and high rainfall [62,93].
4.4. Effect of Integrated Fertilizers on Nutrients Contents, Nutrients Uptake, and Nutrients Use Efficiency
Studies have shown that integrated fertilization (mineral and organic fertilizers) significantly increases the nutrient content in tea, as the maximum nutrient contents were obtained in NPK + RC and NPK + B potsdue to less nutrient loss. This outcome is consistent with the formerly reported low nutrient content of mineral fertilizers due to large losses [94]. Organic fertilizer incorporation not only increases the nutrient content through mineralization but also reduces soil nitrogen losses [95].
The higher nutrient uptake of tea trees can be attributed to the ability of organic fertilizers to provide nutrients throughout the mineralization process and to improve the chemical and physical properties of the soil, as well as the ability of organic fertilizers to release macro- and micronutrients gradually throughout the growing period. Yang et al., Ouda and Mahadeen, Bandyopadhyay et al., and Backer et al. [11,69,96,97] also obtained similar results and found that nutrient uptake was higher when organic and inorganic fertilizers were used in combination.
Plant nutrient uptake is controlled by the nutrients available in the soil, root morphology, and plant activities. Plants can use three strategies to increase nutrient uptake: (1) increase root biomass allocation, (2) modify root morphology, and (3) improve nutrient absorption efficiency at the root surface [98,99,100,101]. The outcome of this experiment showed that tea plants distributed more biomass to the roots and produced more fine roots in response to organic soil amendments. Nutrient uptake was higher in NPK + RC and NPK + B treatments than in the control (CK), which was due to the higher biomass yields and higher nutrient concentrations in the plant fraction. In NPK + RC and NPK + B treatments, improved soil physical environment, improved root architecture, and higher nutrient availability may lead to higher nutrient uptake in these treatments. Bhattacharyya et al. [102] also reported a significant increased in nutrient uptake of soybean under an integrated nutrient management system when growing soybean and wheat.
The solo use of mineral fertilizers in large quantities leads to low nutrient recovery and high nutrient losses. These high nutrient losses not only lead to low nutrient use efficiency but also lead to environmental pollution and high farmer costs [103]. Mineral fertilizers improve soil organic matter decomposition, which leads to soil structure degradation and reduced soil aggregation, resulting in nutrients being easily lost from the soil through gas emission, leaching, fixation, and may lead to reduced fertilizer use efficiency [1,104]. Organic fertilizers, on the other hand, release nutrients slowly and have low nutrient use efficiency [105]. Our study illustrated that the integrated application of minerals and fertilizers effectively improved the NUE of tea, as the higher NUE was achieved in NPK + RC and NPK + B treatments. The higher NUE achieved with integrated fertilizers resulted in higher biomass production, presumably due to less nutrients losses through gas emission and leaching, higher nutrient availability, and major nutrient content in the integrated fertilizer.
4.5. Effect of Integrated Fertilizers on Nutrients (N, P, and K) Uptake per Root Length, Volume and Surface Area
The results of this study showed that the nutrient uptake of tea per unit root length, volume, and surface was higher in the NPK + RC and NPK + B treatmentsthan in all other treatments, indicating that integrated fertilizers improved the nutrient uptake capacity of roots. Improved nutrient absorption was associated with greater total root absorption area, root active absorption area, and root oxidation activity [106,107]. Therefore, the higher nutrient uptake (N, P, and K) per unit root volume, length, and surface area in NPK + RC and NPK + B treatments could be due to improved soil physical properties and root activity (Figure 2 and Figure 3). The improvement in root size and increase in root activity from combined fertilization may be a win-win because the increase in root biomass, length, volume, surface area, and root number increases soil volume exploration to increase nutrient uptake. Therefore, an increase in root size and activity may be a part of the reason for improving nutrient (N, P, and K) uptake through integrated fertilization with organic and inorganic fertilizers. Another reason for the enhancement of total nutrient absorption in tea may be higher aboveground biomass in the NPK + RC and NPK + B treatments (Figure 4b). The faster plant growth and large aboveground biomass increase the demand for nutrients in the plants, thus improving nutrient uptake by the plants [105,108]. The results of the current study show that integrated fertilization improves root characteristics associated with nutrients uptake, which enables an increase in the nutrient use efficiency and biomass production. Therefore, we concluded that combined application of mineral and organic fertilizers based on local soil fertility can improved root growth, which in turn leads to an increase inbiomass production and nutrient use efficiencyin tea. The current findings contribute to our understanding of the physiological importance of integrated fertilization for increasing biomass production and NUE and provide valuable information for optimizing fertilizer management based on root growth response to nutrient supply.
5. Conclusions
Therefore, from the current investigation, it can be concluded that the combined application of rapeseed cake and chemical fertilizers in tea plantations leads to a significant improvement in the physical properties of Alfisol, i.e., reducing the soil PR, BD and increasing the soil porosity compared to the control and the sole application of chemical fertilizers. It was also noted that the integrated use of rapeseed cake and recommended dosage of mineral fertilizers resulted in the improvement of tea growth parameters, viz., root CEC, root tips, root surface area, root volume, root length, nutrient uptake per root volume, length and surface area, and biomass production and partitioning towards root, stem, and leaves, resulting in higher nutrient uptake and NUE by tea plants than that of control (CK), rapeseed cake (RC), and mineral fertilizer (NPK). The integrated fertilizer biochar at 1.25 g kg−1 soil with chemical fertilizers (NPK + B) also performed best in the improvement insoil physical properties, root proliferation, biomass production, and nutrient uptake after NPK + RC treatment. Thus, in Alfisol, the combined use of rapeseed cake with mineral fertilizers in tea plantations can be practiced to improve soil physical environment, enhance the root proliferation of tea, and improve nutrients uptake, NUE, and maximize biomass production through the efficient utilization of macro- and micronutrients in tea.
Author Contributions
Conceptualization, M. and J.R.; methodology, K.N., L.M. and M.; investigation, M.; resources, K.N.; data curation, M.; writing—original draft preparation, M.; writing—review and editing, J.R. and K.N.; visualization, M.; supervision, J.R.; project administration, J.R.; funding acquisition J.R. All authors have read and agreed to the published version of the manuscript.
Funding
This study was financially supported by the National Key Research and Development Project (2021YFD1601100), the Earmarked Fund for China Agriculture Research System (CARS 19), the Agricultural Science and Technology Innovation Program of the Chinese Academy of Agricultural Sciences (CAAS-ASTIP-TRICAAS), and the Agricultural Department of Zhejiang Province through the contract (No. 2021SNLF032).
Acknowledgments
I would like to thank Jianyun Ruan, Kang Ni and Lifeng Ma for their valuable advice and technical expertise. This study will never be carried out without their personal interests and consistent advice and support.
Conflicts of Interest
The authors declare no conflict of interest.
References
- Alimi, T.; Ajewole, O.C.; Awosola, O.; Idowu, E.O. Organic and inorganic fertilizer for vegetable production under tropical conditions. J. Agric. Rural Devel. 2007, 11, 120–136. [Google Scholar]
- NAFCON. Field Notes; National Fertilizer Company of Nigeria: Port Harcourt, Nigeria, 1995; p. 12. [Google Scholar]
- Makoto, K.; Tamai, Y.; Kim, Y.S.; Koike, T. Buried charcoal layer and ectomycorrhizae cooperatively promote the growth of Larixgmelinii seedlings. Plant Soil. 2010, 327, 143–152. [Google Scholar] [CrossRef]
- Chan, K.Y.; Van Zwieten, L.; Meszaros, I.; Downie, A.; Joseph, S. Agronomic values of greenwaste biochar as a soil amendment. Soil Res. 2007, 45, 629–634. [Google Scholar] [CrossRef]
- Sohi, S.P.; Krull, E.; Lopez-Capel, E.; Bol, R. A review of biochar and its use and function in soil. Adv. Agron. 2010, 105, 47–82. [Google Scholar]
- Noguera, D.; Rondón, M.; Laossi, K.-R.; Hoyos, V.; Lavelle, P.; de Carvalho, M.H.C.; Barot, S. Contrasted effect of biochar and earthworms on rice growth and resource allocation in different soils. Soil Boil. Biochem. 2010, 42, 1017–1027. [Google Scholar] [CrossRef]
- Prasad, R. Cropping systems and sustainability of agriculture. Indian Farming-Delhi-Us Jain 1996, 46, 39–48. [Google Scholar]
- Van Zwieten, L.; Kimber, S.; Morris, S.; Chan, K.; Downie, A.; Rust, J.; Joseph, S.; Cowie, A. Effects of biochar from slow pyrolysis of papermill waste on agronomic performance and soil fertility. Plant Soil. 2010, 327, 235–246. [Google Scholar] [CrossRef]
- Bandyopadhyay, K.K.; Misra, A.K.; Ghosh, P.K.; Hati, K.M. Effect of integrated use of farmyard manure and chemical fertilizers on soil physical properties and productivity of soybean. Soil Tillage Res. 2010, 110, 115–125. [Google Scholar] [CrossRef]
- Sainju, U.M.; Singh, B.P.; Whitehead, W.F. Tillage, cover crops, and nitrogen fertilization effects on cotton and sorghum root biomass, carbon, and nitrogen. Agron. J. 2005, 97, 1279–1290. [Google Scholar] [CrossRef]
- Shi, X.Z.; Yu, D.S.; Xu, S.X.; Warner, E.D.; Wang, H.J.; Sun, W.X.; Zhao, Y.C.; Gong, Z.T. Cross-reference for relating Genetic Soil Classification of China with WRB at different scales. Geoderma 2010, 155, 344–350. [Google Scholar] [CrossRef]
- Soil Survey Staff. Keys to Soil Taxonomy, 12th ed.; USDA-Natural Resources Conservation Service: Washington, DC, USA, 2014. Available online: https://www.nrcs.usda.gov/wps/portal/nrcs/detail/soils/survey/class/taxonomy/?cid=nrcs142p2_053580 (accessed on 15 June 2022).
- Bao, S.D. Soil Analysis in Agricultural Chemistry, 3rd ed.; China Agricultural Press: Beijing, China, 2005; pp. 263–271. (In Chinese) [Google Scholar]
- Grant, A. Growing Tea From Seed–Tips For Germinating Tea Seeds. Gardening Know How. 2019. Available online: https://www.gardeningknowhow.com/edible/herbs/tea-plant/growing-tea-from-seed.htm (accessed on 28 September 2021).
- Anderson, G.; Pidgeon, J.D.; Spencer, H.B.; Parks, R. A new hand-held recording penetrometer for soil studies. J. Soil Sci. 1980, 31, 279–296. [Google Scholar] [CrossRef]
- Gregory, P.J. Root growth and activity. In Physiology and Determination of Crop Yield; Boote, K.J., Bennett, J.M., Sinclair, T.R., Paulsen, G.M., Eds.; American Society of Agronomy: Madison, WI, USA, 1994; Volume 7, pp. 65–93. [Google Scholar]
- Régent Instruments Inc. WinRHIZO 2004b Basic, Reg & Pro for Washed Root Measurement; Régent Instruments Inc.: Hong Kong, China, 2004; Volume 94. [Google Scholar]
- Mosaddeghi, M.R.; Mahboubi, A.A.; Safadoust, A. Short-term effects of tillage and manure on some soil physical properties and maize root growth in a sandy loam soil in western Iran. Soil Tillage Res. 2009, 104, 173–179. [Google Scholar] [CrossRef]
- Li, Q.Q.; Dong, B.D.; Qiao, Y.Z.; Liu, M.Y.; Zhang, J.W. Root growth, available soil water, and water-use efficiency of winter wheat under different irrigation regimes applied at different growth stages in North China. Agric. Water Manag. 2010, 97, 1676–1682. [Google Scholar] [CrossRef]
- Crooke, W.M. The measurement of the cation-exchange capacity of plant roots. Plant Soil. 1964, 21, 43–49. [Google Scholar] [CrossRef]
- Sharma, N.K.; Singh, R.J.; Kumar, K. Dry matter accumulation and nutrient uptake by Wheat (Triticum aestivum L.) under Poplar (Populusdeltoides) based agroforestry system. Int. Sch. Res. Netw. 2012, 2012, 359673. [Google Scholar] [CrossRef]
- Salvagiotti, F.; Castellarin, J.M.; Miralles, D.J.; Pedrol, H.M. Sulfur fertilization improves nitrogen use efficiency in wheat by increasing nitrogen uptake. Field Crops Res. 2009, 113, 170–177. [Google Scholar] [CrossRef]
- MS Excel, Microsoft Excel; Denver, CO, USA, 2019; Available online: https://www.microsoft.com (accessed on 15 June 2022).
- Schjønning, P.; Christensen, B.T.; Carstensen, B. Physical and chemical properties of a sandy loam receiving animal manure, mineral fertilizer or no fertilizer for 90 years. Eur. J. Soil Sci. 1994, 45, 257–268. [Google Scholar] [CrossRef]
- Sattelmacher, B.; Gerendas, J.; Thoms, K.; Brück, H.; Bagdady, N.H. Interaction between root growth and mineral nutrition. Environ. Exp. Bot. 1993, 33, 63–73. [Google Scholar] [CrossRef]
- Tiarks, A.E.; Mazurak, A.P.; Chesnin, L. Physical and chemical properties of soil associated with heavy applications of manure from cattle feedlots. Soc. Am. J. 1974, 38, 826–830. [Google Scholar] [CrossRef]
- Šimanský, V. Effects of biochar and biochar with nitrogen on soil organic matter and soil structure in Haplic Luvisol. Acta Fytotech. Et Zootech. 2016, 19, 129–138. [Google Scholar] [CrossRef]
- Igaz, D.; Šimanský, V.; Horák, J.; Kondrlová, E.; Domanová, J.; Rodný, M.; Buchkina, N.P. Can a single dose of biochar affect selected soil physical and chemical characteristics. J. Hydrol. Hydromech. 2018, 66, 421–428. [Google Scholar] [CrossRef]
- Šimanský, V.; Šrank, D.; Jonczak, J.; Juriga, M. Fertilization and application of different biochar types and their mutual interactions influencing changes of soil characteristics in soils of different textures. J. Ecol. Eng. 2019, 20, 149–164. [Google Scholar] [CrossRef]
- Obia, A.; Mulder, J.; Martinsen, V.; Cornelissen, G.; Børresen, T. In situ effects of biochar on aggregation, water retention and porosity in light-textured tropical soils. Soil Tillage Res. 2016, 155, 35–44. [Google Scholar] [CrossRef]
- Šimanský, V.; Horák, J.; Igaz, D.; Jonczak, J.; Markiewicz, M.; Felber, R.; Rizhiya, E.Y.; Lukac, M. How dose of biochar and biochar with nitrogen can improve the parameters of soil organic matter and soil structure? Biologia 2016, 71, 989–995. [Google Scholar] [CrossRef]
- Jien, S.-H.; Wang, C.-S. Effects of biochar on soil properties and erosion potential in a highly weathered soil. Catena 2013, 110, 225–233. [Google Scholar] [CrossRef]
- Šimanský, V.; Šrank, D.; Juriga, M. Differences in soil properties and crop yields after application of biochar blended with farmyard manure in sandy and loamy soils. Acta Fytotech. Et Zootech. 2019, 22, 21–25. [Google Scholar] [CrossRef]
- Fischer, D.; Glaser, B. Synergisms between compost and biochar for sustainable soil amelioration. In Management of Organic Waste; Kumar, S., Ed.; Tech Europe: Rijeka, Croatia, 2012; pp. 167–198. [Google Scholar]
- Šrank, D.; Šimanský, V. Physical Properties of Texturally Different Soils After Application of Biochar Substrates. Agriculture 2020, 66, 45–55. [Google Scholar] [CrossRef]
- Brodowski, S.; John, B.; Flessa, H.; Amelung, W. Aggregate-occluded black carbon in soil. Eur. J. Soil Sci. 2006, 57, 539–546. [Google Scholar] [CrossRef]
- Lehmann, J.; Rillig, M.C.; Thies, J.; Masiello, C.A.; Hockaday, W.C.; Crowley, D. Biochar effects on soil biota–a review. Soil Biol. Biochem. 2011, 43, 1812–1836. [Google Scholar] [CrossRef]
- Yeboah, E.; Ofori, P.; Quansah, G.W.; Sohi, S.P. Improving soil productivity through biochar amendments to soils. African J. of Environ. Sci. Tech. 2009, 3, 34–41. [Google Scholar]
- Javed, H.M.R.; Zamir, M.S.I.; Tanveer, A.; Yaseen, M. Soil physical properties and spring maize yield as influenced by different tillage practices and integrated use of poultry manure with synthetic fertilizers. J. Agric. Res. 2013, 51, 277–287. [Google Scholar]
- Agbede, T.M.; Ojeniyi, S.O.; Adeyemo, A.J. Effect of poultry manure on soil physical and chemical properties, growth and grain yield of sorghum in southwest, Nigeria. Am.-Eurasian J. Sustain. Agric. 2008, 2, 72–77. [Google Scholar]
- Rasoulzadeh, A.; Yaghoubi, A. Effect of cattle manure on soil physical properties on a sandy clay loam soil in North-West Iran. J. Food Agric. Environ. 2010, 8, 976–979. [Google Scholar]
- Mandal, M.; Chandran, R.S.; Sencindiver, J.C. Amending subsoil with composted poultry litter-I: Effects on soil physical and chemical properties. Agronomy 2013, 3, 657–669. [Google Scholar] [CrossRef]
- Shirani, H.; Hajabbasi, M.A.; Afyuni, M.; Hemmat, A. Effects of farmyard manure and tillage systems on soil physical properties and corn yield in central Iran. Soil Tillage Res. 2002, 68, 101–108. [Google Scholar] [CrossRef]
- Al-Mohammedi, O.H.M. Use of Manure and Whey as a Way of Organic Agriculture and Their Impact in Growth and Production of Potatoes. Ph.D. Thesis, College of Agriculture University, Baghdad, Iraq, 2009; p. 182. (In Arabic). [Google Scholar]
- Bearden, B.N.; Petersen, L. Influence of arbuscular mycorrhizal fungi on soil structure and aggregate stability of a vertisol. Plant Soil. 2000, 218, 173–183. [Google Scholar] [CrossRef]
- Tisdall, J.M.; Oades, J.M. Organic matter and water-stable aggregates in soils. J. Soil Sci. 1982, 33, 141–163. [Google Scholar] [CrossRef]
- Xin, X.; Zhang, J.; Zhu, A.; Zhang, C. Effects of long-term (23 years) mineral fertilizer and compost application on physical properties of fluvo-aquic soil in the North China Plain. Soil Tillage Res. 2016, 156, 166–172. [Google Scholar] [CrossRef]
- Stock, O.; Downes, N.K. Effects of additions of organic matter on the penetration resistance of glacial till for the entire water tension range. Soil Tillage Res. 2008, 99, 191–201. [Google Scholar] [CrossRef]
- Celik, I.; Gunal, H.; Budak, M.; Akpinar, C. Effects of long-term organic and mineral fertilizers on bulk density and penetration resistance in semi-arid Mediterranean soil conditions. Geoderma 2010, 160, 236–243. [Google Scholar] [CrossRef]
- Abu-Hamdeh, N.H. Effect of soil manipulation and other field parameters on soil physical properties. In Proceedings of the 12th ISCO Conference, Beijing, China, 26–31 May 2002. [Google Scholar]
- Håkansson, I.; Lipiec, J. A review of the usefulness of relative bulk density values in studies of soil structure and compaction. Soil Tillage Res. 2000, 53, 71–85. [Google Scholar] [CrossRef]
- MacRae, R.J.; Mehuys, G.R. The effect of green manuring on the physical properties of temperate-area soils. Adv. Soil Sci. 1985, 3, 71–94. [Google Scholar]
- Zhou, Y.; Luo, A.C. Effect of organic manure on phosphorus absorption and root activity of wheat. Plant Nutr. Fertil. Sci. 1997, 3, 243–248. [Google Scholar]
- Sidiras, N.; Bilalis, D.; Vavoulidou, E. Effects of tillage and fertilization on some selected physical properties of soil (0–30 cm depth) and on the root growth dynamic of winter barley (Hordeum vulgare cv. Niki). J. Agron. Crop Sci. 2001, 187, 167–176. [Google Scholar] [CrossRef]
- Mandal, U.K.; Singh, G.; Victor, U.S.; Sharma, K.L. Green manuring: Its effect on soil properties and crop growth under rice–wheat cropping system. Eur. J. Agron. 2003, 19, 225–237. [Google Scholar] [CrossRef]
- Rakesh, B.; Bajpai, R.K.; Banwasi, R. Effect of integrated nutrient management on root growth of wheat in a rice–wheat cropping system. Agric. Sci. Digest. 2001, 21, 1–4. [Google Scholar]
- Elad, Y.; David, D.R.; Harel, Y.M.; Borenshtein, M.; Kalifa, H.B.; Silber, A.; Graber, E.R. Induction of systemic resistance in plants by biochar, a soil-applied carbon sequestering agent. Phytopathology 2010, 100, 913–921. [Google Scholar] [CrossRef]
- Changxun, G.; Zhiyong, P.; Shu’ang, P. Effect of biochar on the growth of Poncirus trifoliata (L.) Raf. seedlings in Gannan acidic red soil. Soil Sci. Plant Nutr. 2016, 62, 194–200. [Google Scholar] [CrossRef]
- Yang, L.; Liao, F.; Huang, M.; Yang, L.; Li, Y. Biochar improves sugarcane seedling root and soil properties under a pot experiment. Sugar Tech. 2015, 17, 36–40. [Google Scholar] [CrossRef]
- Olmo, M.; Lozano, A.M.; Barrón, V.; Villar, R. Spatial heterogeneity of soil biochar content affects soil quality and wheat growth and yield. Sci. Total Environ. 2016, 562, 690–700. [Google Scholar] [CrossRef]
- Prendergast-Miller, M.T.; Duvall, M.; Sohi, S.P. Biochar–root interactions are mediated by biochar nutrient content and impacts on soil nutrient availability. Eur. J. Soil Sci. 2014, 65, 173–185. [Google Scholar] [CrossRef]
- Głąb, T.; Gondek, K.; Mierzwa-Hersztek, M. Pyrolysis improves the effect of straw amendment on the productivity of perennial ryegrass (Lolium perenne L.). Agronomy 2020, 10, 1455. [Google Scholar] [CrossRef]
- Jos’e, L.B.; Alfredo, C.R.; Luis, H.E. The role of nutrient availability in regulating root architecture. Curr. Opin. Plant Biol. 2003, 6, 280–287. [Google Scholar]
- Xie, Y.H.; An, S.Q.; Yao, X.; Xiao, K.Y.; Zhang, C. Short-time response in root morphology of Vallisnerianatans to sediment type and water-column nutrient. Aquat. Bot. 2005, 81, 85–96. [Google Scholar] [CrossRef]
- Wang, B.; Lai, T.; Huang, Q.-W.; Yang, X.-M.; Shen, Q.-R. Effect of N fertilizers on root growth and endogenous hormones in strawberry. Pedosphere 2009, 19, 86–95. [Google Scholar] [CrossRef]
- Shenggang, P.; Haidong, L.; Zhaowen, M.; Bob, P.; Meiyang, D.; Hua, T.; Shuijin, H.; Xiangru, T. Effects of Nitrogen and Shading on Root Morphologies, Nutrient Accumulation, and Photosynthetic Parameters in Different Rice Genotypes. Sci. Rep. 2016, 6, 32148. [Google Scholar] [CrossRef]
- Bandopadhyay, K.K.; Misra, A.K.; Ghosh, P.K.; Hati, K.M.; Mandal, K.O. Effect of integrated use of farmyard manure and inorganic fertilizers on soil water dynamics, root growth, crop yield and water expense efficiency of rainfed soybean in a Vertisol. J. Agric. Phys. 2003, 3, 95–100. [Google Scholar]
- Sharma, P.K.; Verma, T.S.; Gupta, J.P. Ameliorating effects of phosphorus, lime and animal manure on wheat yield and root cation exchange capacity in degraded Alfisols of North-West Himalayas. Fertil. Res. 1990, 23, 7–13. [Google Scholar] [CrossRef]
- Yang, C.; Yang, L.; Yang, Y.; Ouyang, Z. Rice root growth and nutrient uptake as influenced by organic manure in continuously and alternately flooded paddy soils. Agric. Water Manag. 2004, 70, 67–81. [Google Scholar] [CrossRef]
- Singh, S.; Ram, L.C. Cation exchange capacity of roots of different varieties of wheat crop and its relation to available nutrients, pH and electrical conductivity. J. Indian Soc. Soil Sci. 1973, 21, 367–371. [Google Scholar]
- Williams, D.E.; Coleman, N.T. Cation exchange properties of plant root surfaces. Plant Soil. 1950, 2, 243–256. [Google Scholar] [CrossRef]
- Drake, M.; Vengris, J.; Colby, W.G. Cation-exchange capacity of plant roots. Soil Sci. 1951, 72, 139–148. [Google Scholar] [CrossRef]
- Elgabaly, M.M.; Wiklander, L. Effect of exchange capacity of clay minerals and acidoid content of plant on uptake of sodium and calcium by excised barley and pea roots. Soil Sci. 1949, 67, 419–424. [Google Scholar] [CrossRef]
- Mouat, M.C.H. Genetic variation in root cation-exchange capacity of ryegrass. Plant Soil. 1962, 1, 263–265. [Google Scholar] [CrossRef]
- Chiranjeevi Rao, K.; Krishnamurthy, T.N.; Tuljaram Rao, J. Cation-exchange capacity of roots and yield potential in sugarcane. Plant Soil. 1967, 27, 314–318. [Google Scholar] [CrossRef]
- McCarthy, M.C.; Enquist, B.J. Consistency between an allometric approach and optimal partitioning theory in global patterns of plant biomass allocation. Funct. Ecol. 2007, 21, 713–720. [Google Scholar] [CrossRef]
- Agren, G.I.; Franklin, O. Root: Shoot ratios, optimization and nitrogen productivity. Ann. Bot. 2003, 92, 795–800. [Google Scholar] [CrossRef] [PubMed]
- Bonifas, K.D.; Walters, D.T.; Cassman, K.G.; Lindquist, J.L. Nitrogen supply affects root: Shoot ratio in corn and velvetleaf (Abutilon theophrasti). Weed Sci. 2005, 53, 670–675. [Google Scholar] [CrossRef]
- Dewar, R.C. A root-shoot partitioning model based on carbon-nitrogen-water interactions and Munch phloem flow. Funct. Ecol. 1993, 7, 356–368. [Google Scholar] [CrossRef]
- Linker, R.; Johnson-Rutzke, C. Modeling the effect of abrupt changes in nitrogen availability on lettuce growth, root–shoot partitioning and nitrate concentration. Agric. Syst. 2005, 86, 166–189. [Google Scholar] [CrossRef]
- Grechi, I.; Vivin, P.; Hilbert, G.; Milin, S.; Robert, T.; Gaudillère, J.-P. Effect of light and nitrogen supply on internal C: N balance and control of root-to-shoot biomass allocation in grapevine. Environ. Exp. Bot. 2007, 59, 139–149. [Google Scholar] [CrossRef]
- Andrews, M.; Sprent, J.I.; Raven, J.A.; Eady, P.E. Relationships between shoot to root ratio, growth and leaf soluble protein concentration of Pisum sativum, Phaseolus vulgaris and Triticum aestivum under different nutrient deficiencies. Plant Cell Environ. 1999, 22, 949–958. [Google Scholar] [CrossRef]
- Ji, L.; Wu, Z.; You, Z.; Yi, X.; Ni, K.; Guo, S.; Ruan, J. Effects of organic substitution for synthetic N fertilizer on soil bacterial diversity and community composition: A 10-year field trial in a tea plantation. Agric. Ecosyst. Environ. 2018, 268, 124–132. [Google Scholar] [CrossRef]
- Shambhavi, S.; Kumar, R.; Sharma, S.P.; Verma, G.; Sharma, R.P.; Sharma, S.K. Long-term effect of inorganic fertilizers and amendments on productivity and root dynamics under maize-wheat intensive cropping in an acid Alfisol. J. Appl. Nat. Sci. 2017, 9, 2004–2012. [Google Scholar] [CrossRef]
- Mandal, K.G.; Hati, K.M.; Misra, A.K. Biomass yield and energy analysis of soybean production in relation to fertilizer-NPK and organic manure. Biomass Bioenergy 2009, 33, 1670–1679. [Google Scholar] [CrossRef]
- Rafael, R.B.A.; Fern’andez-Marcos, M.L.; Cocco, S.; Ruello, M.L.; Fornasier, F.; Corti, G. Benefits of biochars and NPK fertilizers for soil quality and growth of cowpea (Vigna unguiculata L. Walp.) in an acid arenosol. Pedosphere 2019, 29, 311–333. [Google Scholar] [CrossRef]
- Yang, W.; Li, C.; Wang, S.; Zhou, B.; Mao, Y.; Rensing, C.; Xing, S. Influence of biochar and biochar-based fertilizer on yield, quality of tea and microbial community in an acid tea orchard soil. Appl. Soil Ecol. 2021, 166, 104005. [Google Scholar] [CrossRef]
- Saha, A.; Basak, B.B.; Gajbhiye, N.A.; Kalariya, K.A.; Manivel, P. Sustainable fertilization through co-application of biochar and chemical fertilizers improves yield, quality of Andrographis paniculata and soil health. Ind. Crop. Prod. 2019, 140, 111607. [Google Scholar] [CrossRef]
- Oladele, S.O.; Adeyemo, A.J.; Awodun, M.A. Influence of rice husk biochar and inorganic fertilizer on soil nutrients availability and rain-fed rice yield in two contrasting soils. Geoderma 2019, 336, 1–11. [Google Scholar] [CrossRef]
- Bass, A.M.; Bird, M.I.; Kay, G.; Muirhead, B. Soil properties, greenhouse gas emissions and crop yield under compost, biochar and co-composted biochar in two tropical agronomic systems. Sci. Total Environ. 2016, 550, 459–470. [Google Scholar] [CrossRef]
- Tripatmasari, M.; Nihayati, E.; Agil, M. Application of Organic and Inorganic Fertilizers Affects the Growth and Biomass Semanggi (Marsilea crenata Presl.). Int. J. Biol. Biomed. 2021, 15, 1998–4510. [Google Scholar]
- Kamau, S.; Karanja, N.K.; Ayuke, F.O.; Lehmann, J.L. Short-term influence of biochar and fertilizer-biochar blends on soil nutrients, fauna and maize growth. Biol. Fertil. Soils 2019, 55, 661–673. [Google Scholar] [CrossRef]
- Haider, G.; Steffens, D.; Moser, G.; Müller, C.; Kammann, C.I. Biochar reduced nitrate leaching and improved soil moisture content without yield improvements in a four-year field study. Agric. Ecosyst. Environ. 2017, 237, 80–94. [Google Scholar] [CrossRef]
- Duan, Y.; Xu, M.; Gao, S.; Liu, H.; Huang, S.; Wang, B. Long-term incorporation of manure with chemical fertilizers reduced total nitrogen loss in rain-fed cropping systems. Sci. Rep. 2016, 6. [Google Scholar] [CrossRef]
- Yaduvanshi, N.P.S. Substitution of inorganic fertilizers by organic manures and the effect on soil fertility in rice–wheat rotation on reclaimed sodic soil in India. J. Agric. Sci. 2003, 140, 161–168. [Google Scholar] [CrossRef]
- Ouda, B.A.; Mahadeen, A.Y. Effect of fertilizers on growth, yield, yield components, quality and certain nutrient contents in broccoli (Brassica oleracea). Int. J. Agri. Biol. 2008, 10, 627–632. [Google Scholar]
- Backer, R.G.M.; Saeed, W.; Seguin, P.; Smith, D.L. Root traits and nitrogen fertilizer recovery efficiency of corn grown in biochar-amended soil under greenhouse conditions. Plant Soil. 2017, 415, 465–477. [Google Scholar] [CrossRef]
- Bonifas, K.D.; Lindquist, J.L. Effects of nitrogen supply on the root morphology of corn and velvetleaf. J. Plant Nutr. 2009, 32, 1371–1382. [Google Scholar] [CrossRef]
- Berntson, G.M.; Farnsworth, E.J.; Bazzaz, F.A. Allocation, within and between organs, and the dynamics of root length changes in two birch species. Oecologia 1995, 101, 439–447. [Google Scholar] [CrossRef]
- Thivierge, M.N.; Angers, D.A.; Chantigny, M.H.; Seguin, P.; Vanasse, A. Root Traits and Carbon Input in Field-Grown Sweet Pearl Millet, Sweet Sorghum, and Grain Corn. Agron. J. 2016, 108, 459–471. [Google Scholar] [CrossRef]
- Lemaire, G.; Charrier, X.; Hébert, Y. Nitrogen uptake capacities of maize and sorghum crops in different nitrogen and water supply conditions. Agronomie 1996, 16, 231–246. [Google Scholar] [CrossRef]
- Bhattacharyya, R.; Kundu, S.; Prakash, V.; Gupta, H.S. Sustainability under combined application of mineral and organic fertilizers in a rainfed soybean–wheat system of the Indian Himalayas. Eur. J. Agron. 2008, 28, 33–46. [Google Scholar] [CrossRef]
- Liu, X.; Wang, H.; Zhou, J.; Hu, F.; Zhu, D.; Chen, Z.; Liu, Y. Effect of N Fertilization Pattern on Rice Yield, N Use Efficiency and Fertilizer-N Fate in the Yangtze River Basin, China. PLoS ONE 2016, 11, e0166002. [Google Scholar] [CrossRef]
- Adediran, J.A.; Taiwa, L.B.; Akande, M.O.; Sobulo, R.A.; Idown, O.J. Application of Organic and Inorganic Fertilizer for Sustainable Maize and Cowpea Yield in Nigeria. J. Plant Nutr. 2004, 27, 1163–1181. [Google Scholar] [CrossRef]
- Chen, J.H. The Combined Use of Chemical and Organic Fertilizers and/or Biofertilizer for Crop Growth and Soil Fertility. In Proceedings of the International Workshop on Sustained Management of the Soil-Rhizosphere System for Efficient Crop Production and Fertilizer Use, Bangkok, Thailand, 16–20 October 2006. [Google Scholar]
- Wei, H.; Hu, L.; Zhu, Y.; Xu, D.; Zheng, L.; Chen, Z.; Hu, Y.; Cui, P.; Guo, B.; Dai, Q.; et al. Different characteristics of nutrient absorption and utilization between inbred japonica super rice and inter-sub-specific hybrid super rice. Field Crops Res. 2018, 218, 88–96. [Google Scholar] [CrossRef]
- Xin, W.; Liu, H.; Zhao, H.; Wang, J.; Zheng, H.; Jia, Y.; Yang, L.; Wang, X.; Li, J.; Li, X. The response of grain yield and root morphological and physiological traits to nitrogen levels in paddy rice. Front Plant Sci. 2021, 12, 1–15. [Google Scholar] [CrossRef] [PubMed]
- Duncan, E.G.; O’Sullivan, C.A.; Roper, M.M.; Palta, J.; Whisson, K.; Peoples, M.B. Yield and Nitrogen Use Efficiency of Wheat Increased with Root Length and Biomass Due to Nitrogen, Phosphorus, and Potassium Interactions. J. Plant Nutr. Soil Sci. 2018, 181, 364–373. [Google Scholar] [CrossRef]
Publisher’s Note: MDPI stays neutral with regard to jurisdictional claims in published maps and institutional affiliations. |
© 2022 by the authors. Licensee MDPI, Basel, Switzerland. This article is an open access article distributed under the terms and conditions of the Creative Commons Attribution (CC BY) license (https://creativecommons.org/licenses/by/4.0/).