Abstract
Crop rotation is known as an eco-friendlier approach, as provides diversification in crop management systems, modifies intensive pressure on the agricultural ecosystem, utilizes various soil horizons, and prevents the establishment of specific pests and weeds. We set out here a study on the farms that have been managed over 50 years of specific continuous crop management programs. The experimental treatments were in a different management system: monoculture of maize, winter wheat, and soybean, 2-year crop rotation (winter wheat–maize) with and without chemical fertilizer, and 3-year crop rotation (winter wheat–soybean–maize) with and without chemical fertilizer and manure. We took soil samples six times from 2014 to 2017 prior to sowing and after harvesting each year. Weed seeds were extracted from soils and identified and counted by species. We, upon the data of a long term experiment of crop rotation, could conclude that crop rotations with more crops in the sequence are significantly effective in maintaining weed populations, a low-input crop production could reach a constant low population below an important damaging density, and therefore will be a more sustainable crop production while chemical fertilizers would change the soil’s chemical and structure and imbalance the plant population diversity and manures with high weed seed infestations have the potential to totally eradicate crop rotation effects, Therefore, clean manures or compost are highly recommended.
1. Introduction
Food security necessitates intensive crop production with high demands for chemical inputs that inevitably have been continued in agricultural production for decades. Farmers become specialists in producing a crop and prepare specific machinery for crop sowing, growing, harvesting and, after harvesting, processing. This may provide larger economic output and higher crop yield in a short- or mid-term vision, however, more serious problems of environmental side effects such as soil and water loss and pollution, biodiversity loss and herbicide-resistant weeds emerge. Crop rotation is known as an eco-friendlier approach, as it provides diversification in crop management systems, modifies intensive pressure on the agricultural ecosystem, utilizes various soil horizons, and prevents the establishment of specific pests and weeds. Prior research has shown the potential of crop rotations for more bio-diversified farming systems to provide substantial environmental benefits [1].
Experimental observations, survey data and simulation models warn of the destructive impacts of monoculture. Crop rotation can replace monoculture, and while alleviating these impacts, produces the same or higher yield. Hunt et al. (2017) [2] suggested that corn and soybean yield and net returns were as high or higher for the three- and four-year rotations managed with the low-herbicide regime as for the conventional-herbicide two-year rotation. The simulation predicts that certain forms of cropping system diversification and alternative weed management strategies can maintain yield, profit, and ensure weed suppression while delivering enhanced environmental performance. MacLaren et al. (2021) [3] used data across a whole four-year rotation period and showed that crop rotation of wheat–alfalfa–wheat–alfalfa and wheat–canola–wheat–lupine provided a better no-tillage system than the wheat monoculture, therefore, a high advantage for soil management was obtained.
Diversifying cropping systems improves environmental performance and has also the potential to reduce risk from climate change-related threats. Crop yield remains higher during adverse weather, including droughts, when more diverse crop rotation is used [1]. Crop rotation creates a specific biome of plant–soil relations that leads to higher plant and soil organism diversity [2]. Feledyn-Szewczyk et al. (2020) [4] showed that it is possible to control weeds in a no-till system and at the same time decrease the threat of perennial and alien invasive weeds by herbicide diversification throughout crop rotations. To conclude, crop rotation has benefits to crop yield [5], biodiversity [6,7,8], soil safety [7,8,9], alleviating environmental impacts [7,10] and more sustainable weed control [7]. However, all these results are suggested through modelling and simulation approach or from the two- to ten-year experimental studies.
We set out here a study on the farms that have been managed over fifty years of specific continuous crop management programs. We found this study opportunity in the Institute of Field and Vegetable Crops, Rimski Šančevi, Novi Sad, the Republic of Serbia, where they have established three monocultures of maize, wheat, and soybean, and two- and three-year crop rotations of these crops combined with varying fertilizers. These data provide valuable real information about how the crop rotations or monocultures change weed populations indices after about fifty years of practice. Through this, we specifically ask: (1) how do crops differ in forming weed populations through really long-term practices; (2) do the crop rotations produce a bio-diversified and sustainable weed management after 50 years of applying; (3) how do chemical fertilizers and manures determine the stream of weed populations over years; and (4) how does weed population change if no additional fertilizers are imported into the crop management system?
2. Materials and Methods
2.1. Experimental Design, Seedbank Sampling and Analysis
This study was conducted in the experimental site of the Institute of Field and Vegetable Crops of Plodoredi, Rimski Šančevi (45°19′ N, 19°50′ E), Novi Sad, the Republic of Serbia. The climate at the study was characterized as continental with average annual precipitation of 625 mm and an average annual temperature of 12.8 °C (Figure 1). The soil at the experimental site was Calcareous Chernozem (Aric, Loamic, Pachic) (CH-cc-ai.lo.ph) [11]. The humus content, soil pH, CaCO3, P2O5 and K2O contents were measured at 5-to-10-year intervals and the data were used for analysis.

Figure 1.
Monthly average temperature and precipitation in the study location from 2014 to 2017.
The experimental treatments were in different management systems: monoculture of maize, winter wheat, and soybean, 2-year crop rotation (winter wheat–maize) with and without chemical fertilizer and 3-year crop rotation (winter wheat–soybean–maize) with and without chemical fertilizer and manure (Table 1; Figure 2).

Table 1.
Description of the experimental treatments over 2014 to 2017 and the history of the crop management programs (maize (M), winter wheat (W), soybean (S)).
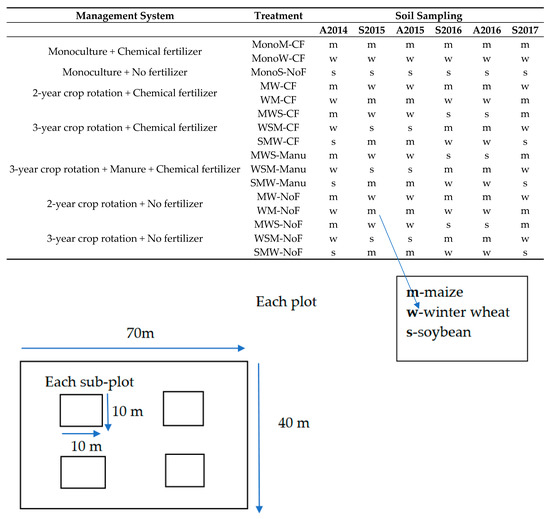
Figure 2.
Schematic view of the experimental plots, plot size, and sub-plots used for sampling.
The study plots measured 40 × 70 m, and within each plot, we chose 4 squares (10 × 10 m) as replication (REP) for each treatment assessment. Soil samples were taken two times per year in autumn (after crop harvesting) and spring (before sowing time) for the seed bank assessment from 2014 to 2017 from each REP. Ten samples were randomly taken from each REP using a soil auger over three soil layers of 0–15 cm, 15–30 cm, and 30–40 cm. At each soil sampling stage, a total of 1920 soil samples and a sum of 11520 samples were taken over the three years of the study.
For the extraction of the seed, we washed the soil samples through four sieves of 2 mm, 200 μm, 500 μm, and 800 μm [12]. The residual content of the sieves was blown out by the compressor air and seeds separated from the soil under the magnifying glass “LUXO” and binoculars “Bio-Optica” and IND-CIZ (45× magnification). The extracted seeds were identified by species using the collection of seeds [12,13,14] in the Biological Laboratory of the Faculty of Agriculture, University of Belgrade.
2.2. Statistical Analysis
To estimate the seed abundance in soil for an area of m−2 at three different depths, we used the Vipper formula (1989) [15] that was later modified by Kuht et al. (2016) [16]:
where N is the number of viable seeds (n m−2); h is the depth of soil layer (cm); Db is the soil bulk density (g cm−3); n denotes the counted number of seeds in the soil sample; and Sp represents the weight of dry soil sample (g). Data of weed species seeds was used for calculating the Equitability Index, Simpson Diversity [17], Dominance Index [17], Shannon–Wiener Diversity Index [18]. Mixed model analysis was used to determine the effect of the crop sequence and fertilizers on weed seed bank with JMP (v. 14.) software. To compare the strength of the treatment, we calculated the log-worth with their p-values. Principal Component Analysis (PCA) was used to explore the correlations among dominant weed species and crop management practices.
3. Results
3.1. Crop Sequence and Fertilizer Effect on Weed Seed Bank
Mixed model analysis suggests that over 50 years of the management practices, the interactions between crop sequence × fertilizer, the interactions between crop sequence × fertilizer × soil depth, and the interaction between crop sequence × soil depth were the significant factors in determining the soil seed bank populations (p < 0.0001, Figure 3).

Figure 3.
Experimental treatments effects on the total population of weed seeds in soil estimated using mixed model analysis. Log-worth and p-values are shown.
Log-worth values showed that crop sequence × fertilizer interaction had the highest effect (log-worth = 64.7), followed by the triple interactions between crop sequence × fertilizer × soil depth (log-worth = 30.5). Thus, the long-term practices of crop sequence and fertilizers caused a pattern of seed distribution over the layers of the soil seed bank (Figure 3). Crop sequence × soil depth with a log-worth of 5 had a significant effect, while the crop sequence as an individual factor had the least influence (log-worth = 0.4) on the total weed seed bank population. On the other hand, the individual effect of soil depth and fertilization, as well as their interaction, did not have a significant effect. In total, these three factors’ combinations predicted the soil seed bank with an adjusted R2 of 0.9 and RMSE of 1104 seeds m−2 (Figure 4).
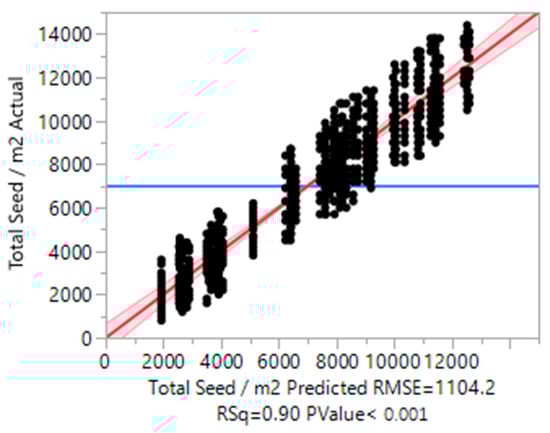
Figure 4.
Actual and predicted values of the total seed population in soil obtained by the mixed model. R2 and RMSE are shown.
The seed abundance in all 16 long term treatments within soil depth are presented in Figure 5.
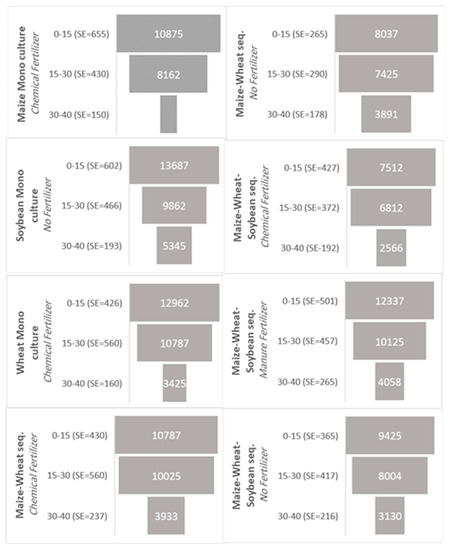
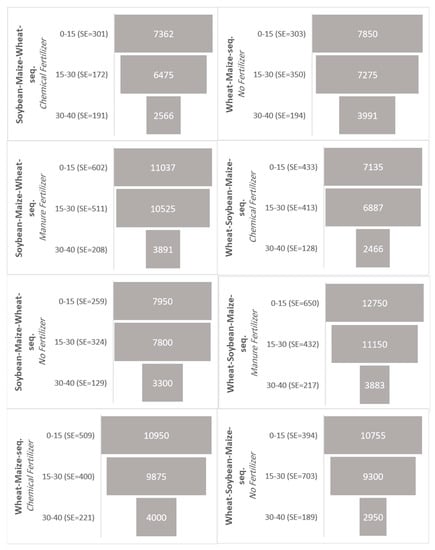
Figure 5.
Funnel graphs are used to display seed population distribution over the soil layers as affected by crop rotations and fertilizers. The standard error of means for each layer is shown.
The number of seeds in soil significantly decreased from surface layer to deep soil (Figure 5). In the topsoil, soybean monoculture with no fertilizer (MonoS-NoF) had the largest weed seed populations. It was followed by wheat monoculture + CF, WSM + manure, and MWS + manure. In contrast, WSM, SMW, and MWS all with CF had the least weed seeds in the topsoil. At a soil depth of 15–30 cm, SMW, WSM, and MWS with CF had the least weeds seed populations, while WSM + manure, wheat monoculture + CF, and SMW + manure showed the largest seed populations. In general, monocultures, especially the soybean monoculture which is a less competitive crop against weeds than maize and wheat, were more infested by weed seeds. The crop sequence efficiency in decreasing weed seed bank was highly dependent on the fertilizer management, as with CF, the three-year crop rotations had significantly lower seed bank, while with manure, the effect of crop rotations was eliminated.
3.2. Correlation among Weed Species and Crop Managements
The biplot based on PCA shows correlations among dominant weed species (density > 50 seeds/m2) and crop sequence or fertilizers. The soybean monoculture was more correlated with AMARE (Amaranthus retroflexus L.), CHAAL (Chenopodium album L.), and CHEHY (Chenopodium hybridum L.). Species STAAN (Stachys annua L.) and ANGAR (Anagallis arvensis L.) were more abundant in no-fertilizer systems, and POLCO (Bilderdykia convolvulus L.) and VERHE (Veronica hederifolia L.) were found more frequently in wheat monoculture and CF systems. However, PCA was able to explain 55% of the correlations (Figure 6).
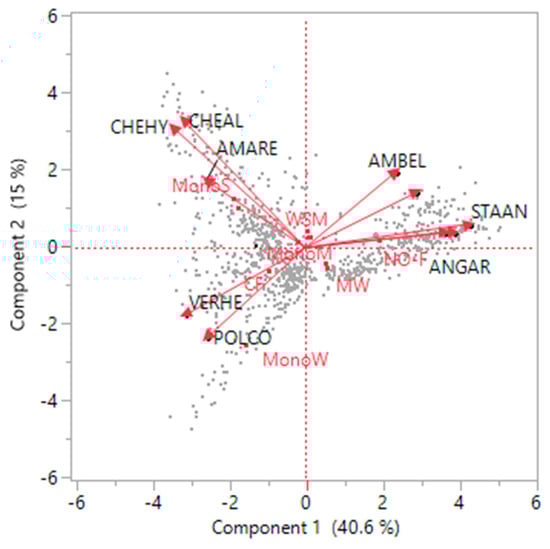
Figure 6.
Biplot form PCA analysis shows the correlation among dominant weed species with crop rotations.
3.3. Population Indices with Crop Management
Generally, in monocultures, the Shannon–Weiner Diversity, Equitability, and Dominance Indices were lower and the Simpson Index was higher (Figure 7). Between monocultures, wheat monoculture had the largest Simpson Index, and the lowest dominance, equitability, and Shannon Diversity Indices. Comparing all crop sequences × fertilizer, wherever CF was applied, equitability, Shannon–Weiner and Dominance Indices were higher and Simpson Index was lower than other crop sequence and fertilizers combinations (Figure 7).
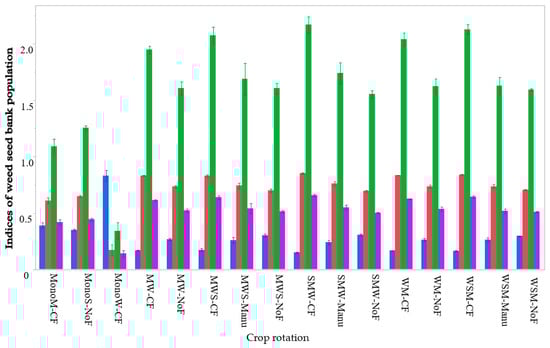
Figure 7.
Indices of dominance (red bars), Simpson (blue bars), Shannon–Weiner (green bars), and Equitability (violet bars) as affected by the experimental treatments. Means and the standard error values are shown.
3.4. Changes over the Sampling Time
The interactions between management systems (combination of crop sequences and fertilizer) and sampling time were also significant in weed seed bank populations (p < 0.0001, Table 2). Comparing monocultures, soybean monoculture had a higher weed seed bank population followed by wheat monoculture. Wherever manures had been applied seed bank population was higher, and conversely in NoF and CF, the seed bank populations were lower (Figure 8).
Table 2.
Experimental treatments effects including sampling time effect (six times over 2014–2017) on the total population of weed seeds in soil estimated using mixed model analysis. Log-worth and p-values are shown.
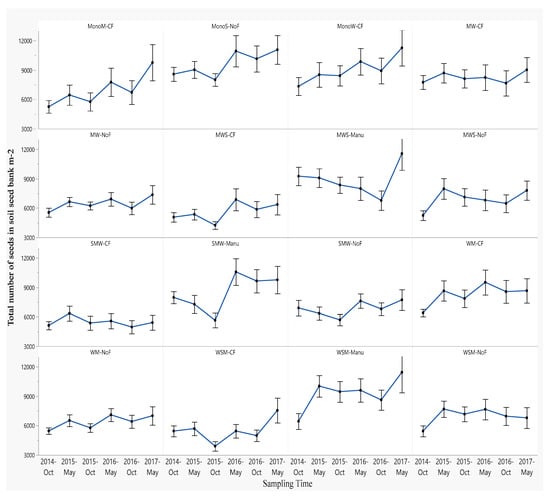
Figure 8.
Seed population changes from 2014 to 2017 in different crop rotation systems. Means and the standard error values are shown.
Additionally, monocultures and plots with manures had increasing weed seed bank populations over years of samplings, while in CF and NoF, the seed bank populations did not significantly change over the years.
3.5. Soil Properties as Affected by the Crop Rotation Systems
Figure 9 depicts the correlations among soil properties and crop rotation systems. Chemical fertilizers are on the opposite side of soil pH indicating that CF applications decreased soil pH. Manures are correlated to P2O5, K2O, and humus percentage, irrespective of crop rotations, while maize monoculture + CF shows no correlation with the respective components. However, soybean monoculture with NoF was found to be rich in P2O5, K2O, and humus percentage, which indicates its ability to enrich soil even with no fertilizers.
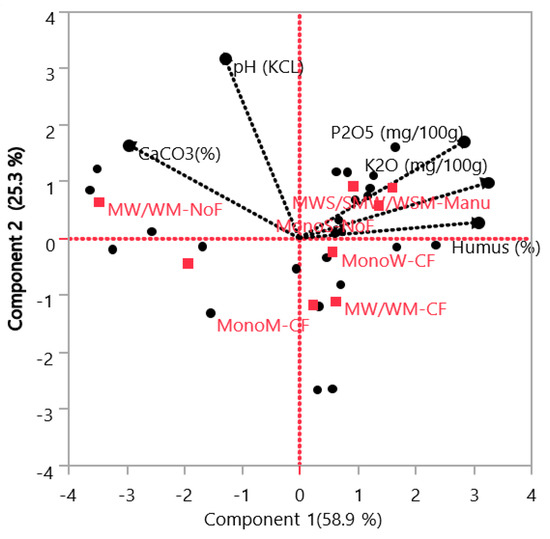
Figure 9.
Biplot form PCA analysis shows the correlation among soil properties with crop rotations and fertilizers.
4. Discussion
Our results showed that weed seed bank was highly affected by the interaction of crop-sequence and fertilizer/nutrients used. Generally, crop rotation had a positive impact in decreasing weed seed bank over the years, although it was highly dependent on the nutrient source. Manures were found to be the main sources of increasing weed seed bank, and with any crop rotation, manure treatments had the largest weed seed populations. Application of manures must follow some technical instructions to avoid weed infestations. Oveisi et al. (2021) [19] showed that many alive and germinable seeds were present in sheep and goats’ gut that have serious potential for weed infestation via manures. In each kg of manures from calves, 133 thousand seeds were shown to exist [20]. Therefore, if weed seeds ingested through feed by animals through their diets, or natural grazing, compost manures are recommended instead of fresh manures [21]. As highly-infested manure can neutralize any effort for weed management including crop rotations. If no fertilizer was applied or chemicals were used, then crop rotations had a significant effect on decreasing weed seeds in the soil. Monoculture provides some empty space and untouched resources for weeds [3]. Weeds are adapted for these conditions and will use the resources to grow and produce seeds [22]. Crop rotation disturbs these niches and prevents weeds from finding their place for establishing, thus breaking their cycle [23]. Therefore, when wheat, maize, and soybean were grown in sequence, the seed bank populations were lowest. In monocultures, there was also variability in weed infestations. Soybean is a less competitive crop than wheat or maize, and its slow early growth allows weeds to overtop the canopy and produce a large number of seeds [24]. Therefore, a monoculture of soybean is expected to be more infested by weeds.
The soil in soybean monoculture was significantly rich in P2O5, K2O, and humus percentage, and have more resources for weed growth. Soil contains frequent variable microorganisms, including bacteria [25]. Rhizobia in the nodules of soybean roots fix atmospheric nitrogen for use by their host, while the host supplies the rhizobia with carbon from photosynthesis [26]. This symbiosis between rhizobia and legumes is an example of plant-microbe mutualism, and it is beneficial for plants grown in the field [27]. Soybean reportedly plays a crucial role in the establishment of bacterial assemblages in the rhizosphere or root, and the symbiosis between rhizobia and legumes is directly affected by the structure of the microbiota in these two compartments [28]. Conversely, wheat and maize are more competitive and had a greater growth rate at early growth stages [29]. Wheat is also a strong allelopathic crop that enhances its advantage over weeds [30].
Crop rotations with no fertilizers had fewer weed seeds in the soil. It was formerly shown that low input cropping systems suffer less from weeds [22] and provide more sustainable weed management in the long-term [31]. High input agriculture especially those with a high amount of fertilizers favor weeds over crops [32]. Weeds used to uptake more fertilizers and their luxury consumption allows them to take advantage of crops, gain larger canopies, and produce more seeds [33].
Crop rotation can affect the weed community and soil seed bank, thus reducing the density of weeds and the number of weed seeds in the soil seed bank [34]. The results showed that compared with continuous maize cropping, the introduction of winter wheat could effectively reduce weed density. Our long-term experiment shows that a low-fertilizer system can have fewer weed populations over years. The site of Plodoredi provided an opportunity to explore the impact of crop rotations on weed seed banks over a long-term 50-year period. Our results showed that crop rotations with more variable crops in sequence are effective in maintaining low weed populations; however, they are highly dependent on the source of nutrients or fertilizer management. We conclude that: (1) crop rotations with more crops in the sequence are significantly effective in maintaining low weed populations; (2) including legume crops such as soybean in the rotations would improve soil structure, soil biome, and soil nutrient contents; (3) a low input (chemical fertilizer) crop production can keep the weed population below the damaging density; (4) chemical fertilizers would change the soil chemical and structure and imbalance the plant population diversity; and (5) manures with high weed seed infestations can override the beneficial effects of crop rotation effects; therefore, clean manures or compost must be used.
The choice and sequence of crops are determined by a combination of agronomic and techno-economic factors. Economic assessment crop rotations help farmers determine those most appropriate for their farms. Although more diverse crop rotations provide weed control benefits and reduce the risk of developing herbicide-resistant weeds, the crop rotation used in a given field is often dictated by profit potential rather than the ease of herbicide-resistant weed management [35]. Herbicide-resistant weeds increase the cost of crop production due to specialized management and therefore have the potential to alter the economic net return associated with particular crops and crop rotations.
5. Conclusions
Our study suggests that the ANN model could predict with high certainty the number and composition of weed seed bank in different management systems. Most affected by the interaction of crop rotation + fertilization (64%), followed by the interaction of crop rotation + fertilization + depth (30.52%), while crop rotation as a single factor has the least importance (0.42%). Based on the calculated α index diversity, it was determined that the diversity of the weed community differs in management systems, so in wheat monoculture with CF is the lowest diversity and uniformity of the weed community and the highest diversity and the greatest uniformity was confirmed in the crop rotation with CF. While it will never be possible to eliminate all noxious weed populations, or all invasive weeds, models can be very useful in future for predicting the appearance of weeds in the coming seasons and more precisely determining weed control strategy.
Author Contributions
Conceptualization, S.V., I.D. and M.S.; methodology, M.S.; software, M.O.; validation, S.V., I.D. and D.B.; formal analysis, M.S., M.O. and A.P.; investigation, M.S. and A.S.; resources, M.S., S.V. and I.D.; data curation, M.S.; writing—original draft preparation, M.S., S.V., I.D., M.O. and P.V.P.; writing—review and editing, M.S., S.V., I.D., M.O. and P.V.P.; supervision, S.V. and I.D.; project administration, S.V.; funding acquisition, M.S. All authors have read and agreed to the published version of the manuscript.
Funding
The research in this paper is part of the projects of NIO in 2022: 451-03-68/2022-14/200032 (to I.D.), 451-03-68/2022-14/200116 (to V.S. and B.D.) and 451-03-68/2022-14/200010 (to A.S.) which are financed by the Ministry of Education, Science and Technological Development of the Republic of Serbia.
Data Availability Statement
Not applicable.
Acknowledgments
This work was carried out as a part of the activities Department for Maize, Institute of Field and Vegetable Crops, Novi Sad, Serbia, National Institute of the Republic of Serbia.
Conflicts of Interest
The authors declare no conflict of interest.
References
- Bowles, T.M.; Mooshammer, M.; Socolar, Y.; Calderón, F.; Cavigelli, M.A.; Culman, S.W.; Deen, W.; Drury, C.F.; Garcia, A.G.Y.; Gaudin, A.C.M.; et al. Long-term evidence shows that crop-rotation diversification increases agricultural resilience to adverse growing conditions in North America. One Earth 2020, 2, 284–293. [Google Scholar] [CrossRef]
- Hunt, N.D.; Hill, J.D.; Liebman, M. Reducing freshwater toxicity while maintaining weed control, profits, and productivity: Effects of increased crop rotation diversity and reduced herbicide usage. Environ. Sci. Technol. 2017, 51, 1707–1717. [Google Scholar] [CrossRef]
- MacLaren, C.; Labuschagne, J.; Swanepoel, P.A. Tillage practices affect weeds differently in monoculture vs. crop rotation. Soil Tillage Res. 2021, 205, 104795. [Google Scholar] [CrossRef]
- Feledyn-Szewczyk, B.; Smagacz, J.; Kwiatkowski, C.A.; Harasim, E.; Woźniak, A. Weed flora and soil seed bank composition as affected by tillage system in three-year crop rotation. Agriculture 2020, 10, 186. [Google Scholar] [CrossRef]
- Zhao, J.; Yang, Y.; Zhang, K.; Jeong, J.; Zeng, Z.; Zang, H. Does crop rotation yield more in China? A meta-analysis. Field Crops Res. 2020, 245, 107659. [Google Scholar] [CrossRef]
- Venter, Z.S.; Jacobs, K.; Hawkins, H.-J. The impact of crop rotation on soil microbial diversity: A meta-analysis. Pedobiologia 2016, 59, 215–223. [Google Scholar] [CrossRef]
- German, R.N.; Thompson, C.E.; Benton, T.G. Relationships among multiple aspects of agriculture’s environmental impact and productivity: A meta-analysis to guide sustainable agriculture. Biol. Rev. Camb. Philos. Soc. 2017, 92, 716–738. [Google Scholar] [CrossRef] [PubMed]
- King, A.E.; Blesh, J. Crop rotations for increased soil carbon: Perenniality as a guiding principle. Ecol. Appl. 2018, 28, 249–261. [Google Scholar] [CrossRef]
- Franke, A.C.; van den Brand, G.J.; Vanlauwe, B.; Giller, K.E. Sustainable intensification through rotations with grain legumes in Sub-Saharan Africa: A review. Agric. Ecosyst. Environ. 2018, 261, 172–185. [Google Scholar] [CrossRef]
- MacWilliam, S.; Parker, D.; Marinangeli, C.P.F.; Trémorin, D. A meta-analysis approach to examining the greenhouse gas implications of including dry peas (Pisum sativum L.) and lentils (Lens culinaris M.) in crop rotations in western Canada. Agric. Syst. 2018, 166, 101–110. [Google Scholar] [CrossRef]
- IUSS Working Group WRB. International soil classification system for naming soils and creating legends for soil maps. In Proceedings of the World Reference Base for Soil Resources 2014, Rome, Italy, September 2014; Volume 106. [Google Scholar]
- Reinhardt, T.; Leon, R.G. Extractable and germinable seedbank methods provide different quantifications of weed communities. Weed Sci. 2018, 66, 715–720. [Google Scholar] [CrossRef]
- Дoбрoхoтoв, В.Н. Семена сoрных растения. Издателствo Сельскoхoзяй-ственoй литератури, Журналoв и плакатoв. Мoсква 1961, 1, 1–460. [Google Scholar]
- Skender, A.; Knežević, M.; Đurkić, M.; Martinčić, J.; Guberac, V.; Kristek, A.; Stjepanović, M.; Bukvić, G.; Matotan, Z.; Šilješ, I. Sjemenje i plodovi poljoprivrednih kultura i korova na području Hrvatske. Sveučilište Josipa Jurija Strossmayera in Osijeku Poljopr. Fak. Osijek 1998, 1, 10–21. [Google Scholar]
- Vipper, H. Umbrohuseemnete varu mullas. In Maaviljeluse Praktikum; Estonian University of Life Sciences: Tartu, Estonia, 1989; pp. 221–226. (In Estonian) [Google Scholar]
- Kuht, J.; Eremeev, V.; Talgre, L.; Madsen, H.; Toom, M.; Maeorg, E.; Luik, A. Soil weed seed bank and factors influencing the number of weeds at the end of conversion period to organic production. Agron. Res. 2016, 14, 1372–1379. [Google Scholar]
- Simpson, E.H. Measurement of diversity. Nature 1949, 163, 668. [Google Scholar] [CrossRef]
- Zhao, F.; Kang, D.; Han, X.; Yang, G.; Feng, Y.; Ren, G. Soil stoichiometry and carbon storage in long-term afforestation soil affected by understory vegetation diversity. Ecol. Eng. 2015, 74, 415–422. [Google Scholar] [CrossRef]
- Oveisi, M.; Ojaghi, A.; Rahimian Mashhadi, H.; Müller-Schärer, H.; Reza Yazdi, K.; Pourmorad Kaleibar, B.; Soltani, E. Potential for endozoochorous seed dispersal by sheep and goats: Risk of weed seed transport via animal faeces. Weed Res. 2021, 61, 1–12. [Google Scholar] [CrossRef]
- Pleasant, J.M.; Schlather, K.J. Incidence of weed seed in cow (Bos sp.) manure and its importance as a weed source for cropland. Weed Technol. 1994, 8, 304–310. [Google Scholar] [CrossRef]
- Major, J.; Steiner, C.; Ditommaso, A.; Falcão, N.P.; Lehmann, J. Weed composition and cover after three years of soil fertility management in the central Brazilian Amazon: Compost, fertilizer, manure and charcoal applications. Weed Biol. Manag. 2005, 5, 69–76. [Google Scholar] [CrossRef]
- Butkevičienė, L.M.; Skinulienė, L.; Auželienė, I.; Bogužas, V.; Pupalienė, R.; Steponavičienė, V. The influence of long-term different crop rotations and monoculture on weed prevalence and weed seed content in the soil. Agronomy 2021, 11, 1367. [Google Scholar] [CrossRef]
- Satorre, E.H.; Elba, B.; Mas, M.T.; Suárez, S.A.; Kruk, B.C.; Guglielmini, A.C.; Verdú, A.M. Crop rotation effects on weed communities of soybean (Glycine max L. Merr.) agricultural fields of the Flat Inland Pampa. Crop Prot. 2020, 130, 105068. [Google Scholar] [CrossRef]
- Goplen, J.J.; Sheaffer, C.C.; Becker, R.L.; Coulter, J.A.; Breitenbach, F.R.; Behnken, L.M.; Johnson, G.A.; Gunsolus, J.L. Seedbank depletion and emergence patterns of giant ragweed (Ambrosia trifida) in Minnesota cropping systems. Weed Sci. 2017, 65, 52–60. [Google Scholar] [CrossRef][Green Version]
- Gawęda, D.; Haliniarz, M.; Bronowicka-Mielniczuk, U.; Łukasz, J. Weed infestation and health of the soybean crop depending on cropping system and tillage system. Agriculture 2020, 10, 208. [Google Scholar] [CrossRef]
- Liu, A.; Contador, C.A.; Fan, K.; Lam, H.M. Interaction and regulation of carbon, nitrogen, and phosphorus metabolisms in root nodules of legumes. Front. Plant Sci. 2018, 9, 1860. [Google Scholar] [CrossRef] [PubMed]
- Han, Q.; Ma, Q.; Chen, Y.; Tian, B.; Xu, L.; Bai, Y.; Chen, W.; Li, X. Variation in rhizosphere microbial communities and its association with the symbiotic efficiency of rhizobia in soybean. ISME J. 2020, 14, 1915–1928. [Google Scholar] [CrossRef] [PubMed]
- Orchard, D.J. The role of helper bacteria in facilitating mycorrhization of Biserrula pelecinus L., a pasture legume new to Australia. Ph.D. Thesis, Charles Sturt University, Bathurst, Australia, 2020. [Google Scholar]
- Zhang, J.; Wu, L.-F. Impact of tillage and crop residue management on the weed community and wheat yield in a wheat–maize double cropping system. Agriculture 2021, 11, 265. [Google Scholar] [CrossRef]
- Jabran, K. Manipulation of Allelopathic Crops for Weed Control, 1st ed.; Springer International Publishing: Berlin/Heidelberg, Germany, 2017. [Google Scholar]
- Weisberger, D.; Nichols, V.; Liebman, M. Does diversifying crop rotations suppress weeds? A meta-analysis. PLoS ONE 2019, 14, e0219847. [Google Scholar] [CrossRef]
- Kaur, S.; Kaur, R.; Chauhan, B.S. Understanding crop-weed-fertilizer-water interactions and their implications for weed management in agricultural systems. Crop Prot. 2018, 103, 65–72. [Google Scholar] [CrossRef]
- Ghosh, D.; Brahmachari, K.; Brestic, M.; Ondrisik, P.; Hossain, A.; Skalicky, M.; Sarkar, S.; Moulick, D.; Dinda, N.K.; Das, A.; et al. Integrated weed and nutrient management improve yield, nutrient uptake and economics of maize in the rice-maize cropping system of Eastern India. Agronomy 2020, 10, 1906. [Google Scholar] [CrossRef]
- Cheng, C.; Pan, J.; Wan, K. Research advances in the effects of rotation on cropland weeds. Chin. Agric. Sci. Bull. 2013, 29, 1–9. [Google Scholar]
- Beckie, H.J. Herbicide-resistant weeds: Management tactics and practices 1. Weed Technol. 2006, 20, 793–814. [Google Scholar] [CrossRef]


Publisher’s Note: MDPI stays neutral with regard to jurisdictional claims in published maps and institutional affiliations. |
© 2022 by the authors. Licensee MDPI, Basel, Switzerland. This article is an open access article distributed under the terms and conditions of the Creative Commons Attribution (CC BY) license (https://creativecommons.org/licenses/by/4.0/).