Article

What Factors Control the Crude Protein Content Variation of a Basaltic “Campos” Native Grassland of South America?

1
Instituto Nacional de Investigación Agropecuaria (INIA), Programa Pasturas y Forrajes, Estación Experimental INIA Tacuarembó, Tacuarembó 45000, Uruguay
2
Instituto Nacional de Investigación Agropecuaria (INIA), Programa Forestal, Estación Experimental INIA Tacuarembó, Tacuarembó 45000, Uruguay
3
Instituto Nacional de Tecnología Agropecuaria (INTA), Estación Experimental Agropecuaria (EEA) Concepción del Uruguay, Entre Ríos 3260, Argentina
4
Instituto Nacional de Investigación Agropecuaria (INIA), Programa Pasturas y Forrajes, Estación Experimental INIA La Estanzuela, Colonia 39173, Uruguay
5
Programa de Pós-Graduação em Zootecnia, Departamento de Plantas Forrageiras e Agrometeorologia, Faculdade de Agronomia, Universidade Federal de Rio Grande do Sul, Porto Alegre 91540-000, Brazil
*
Author to whom correspondence should be addressed.
Agronomy 2022, 12(8), 1756; https://doi.org/10.3390/agronomy12081756
Submission received: 23 June 2022 / Revised: 14 July 2022 / Accepted: 19 July 2022 / Published: 26 July 2022

Abstract

:
Native grasslands are the main source of food for livestock in the Campos region of South America. These forage resources are heterogeneous in species composition, grazing management, and soil fertility within a context of variable climate, all of which are factors that affect forage crude protein content over time and space. Despite the importance of protein in livestock nutrition, there is a gap in the knowledge of how fertilisation, sward height, and soil water availability influence the crude protein content of these grasslands. We used data from a long-term fertilisation experiment to construct a structural model aiming to identify the main factors influencing forage crude protein content of a basaltic native grassland in northern Uruguay. The structural model revealed that both fertilisation and the increase in soil water availability (through the improvement of the nitrogen content of green leaves) are the main pathways by which forage crude protein content increases. This new approach (which identifies and quantifies the main factors that drive forage crude protein content of native grasslands) could be used to support prediction models for forage protein content in order to improve grazing livestock nutrition of Campos native grasslands.

1. Introduction

Pastures and especially native grasslands are the most inexpensive way to feed ruminants due to their ability to digest fibrous feeds. In the Campos region of southern South America, livestock production is based on the use of species-rich native grasslands (NG), which has a high potential for productivity improvement [1,2] and ecosystem services provision [3,4]. Forage quality is a key factor in determining livestock productivity in NG-based production systems, mainly when the forage allowance does not limit livestock intakes [5]. Several studies have reported that the forage crude protein content (FCPC) of NG can be a limiting resource for livestock production [6,7,8,9]. Due to the lack of information on the factors influencing FCPC of beef cattle grazing systems, it has not yet been possible to carry out precision management of livestock nutrition under grazing conditions.
Most NGs are composed of a spatial mosaic of patches that temporally varies in species composition [10,11] as well as the relative abundance of C3 and C4 functional types [12,13]. Grass species of C4 functional types are the main component of NGs [14], which have greater content of vascular bundles in their leaves compared to C3 grasses, which makes them of lower quality [15]. In addition, the plant composition of this NG can also spatially vary as a function of a gradient of soil water availability (SWA) determined by soil type and rooting depth [14] and also due to the canopy’s height [16]. Thus, this spatio-temporal heterogeneity in the species composition can lead to significant variations in the quality of forage, particularly in FCPC [17].
On the other hand, the occurrence of temporal variations in forage quality is associated with climatic conditions. Under drought conditions, the reduction in nitrogen absorption capacity may be greater than the decrease in plant growth, thus decreasing FCPC [18]. Within this context, SWA restrictions cause a dilution of FCPC by limiting the nitrogen absorption capacity as well as by the increase in the proportion of senescent material [18]. On the contrary, a meta-analysis study of climate change effects on forage quality in NG of Dumont et al. [19] detected an opposite trend, showing that a SWA restriction led to an increase of 5% in FCPC. Specifically, in NGs there is a knowledge gap on how SWA restrictions may influence FCPC in different contexts of soil fertility, sward heterogeneity, and species diversity.
The structural arrangement of the sward can also influence their FCPC [17]. Sward structure is defined as the spatial arrangement of the plant species, the standing biomass, and its morphological components (green leaves, stems, and senescent material) in the vertical and horizontal planes [20]. Moreover, the different species and plant functional types may have different capacities to accumulate biomass and nitrogen in their leaves [21,22]. There is evidence from studies carried out on cultivated pastures that as forage plants develop and grow over time, they dilute their FCPC [23]. However, more research based on an integrative approach is needed to refine the knowledge of the effect of species composition and sward structure of FCPC of NG.
Previous studies in long-term experiments have found changes in species composition and plant functional types frequencies in response to nitrogen and phosphate fertilisation [24,25]. In this sense, Rodríguez and Rodríguez [24] demonstrated that fertilisation decreased the frequency of summer perennial grasses and increased nitrophilic species, mainly winter annual grasses. These changes in botanical composition favour fast growing C3 photosynthetic pathway species with a greater capacity to capture nitrogen [24], which could be also associated with an increase in FCPC of NG. Thus, understanding the dynamics of species and functional type responses to NG fertilisation within a context of variable SWA is essential to predict the FCPC of NG.
To our knowledge, there is no scientific evidence of the mechanisms explaining how fertilisation, SWA, and sward height influence the FCPC through a variation in nitrogen content of green leaves with respect to the components of the sward structure and plant functional type frequencies. This study aimed to explore the main drivers that influence FCPC in a basaltic NG sward of Uruguay and to determine the intermediate pathways operating at different scales through a structural model.

2. Materials and Methods

2.1. Site Description and Experimental Design

The research was conducted over a period of two years in two cycles, each cycle being a spring-summer growing season (first cycle 2017/2018, second cycle 2018/2019). During the two years, several pasture and climatic variables were registered. The study was conducted using the experimental units of an ongoing long-term experiment established in 1995 at Glencoe experimental station of the National Agricultural Research Institute (INIA), located north-west Uruguay (Latitude: 32°09′ S; Longitude: 57°81′ W). The experimental long-term treatments consisted of two management schemes: (i) an unfertilised native grassland (UNG) as a control treatment, and (ii) an annually fertilised native grassland (FNG) with 100 kg N/ha and 40 kg P2O5/ha. Each year, phosphorus (as superphosphate) was applied to the FNG at the beginning of autumn, while nitrogen (as urea) was applied in two fractions of 50 kg/ha of N each at the beginning of autumn and spring. The experimental units were four paddocks of two ha randomly allocated in two blocks. The soil of the research station has a basaltic origin, with high clay content and medium-high potential rooting depth (Hapludolls). The sward was continuously grazed by livestock, with monthly stocking rate adjustments when necessary, aiming to maintain the sward height between 6 and 10 cm using the “put and take” method [26]. In practice, when the average pasture height deviated above or below the target range of 6 to 10 cm, 100 kg of livestock liveweight per ha were put on or taken off for each cm below or above the target range, respectively. To that end, three tester calves and a variable number of put-and-take calves were used to maintain the target sward height. The animals of the first cycle entered with an average liveweight of 163 ± 10 kg, while animals of the second cycle entered with 184 ± 6 kg. Before the beginning of each annual evaluation cycle (autumn), a forage deferment (stockpiling) was carried out until a target overall average sward height of 10 cm was reached. Despite 10 cm being the target average sward height, the sward´s heterogeneity still made it possible to find other heights within the same pasture (e.g., patches of 4, 8, 12, 16 cm). The stockpiling period of standing forage for the first and second cycle was 50 and 90 days, respectively.

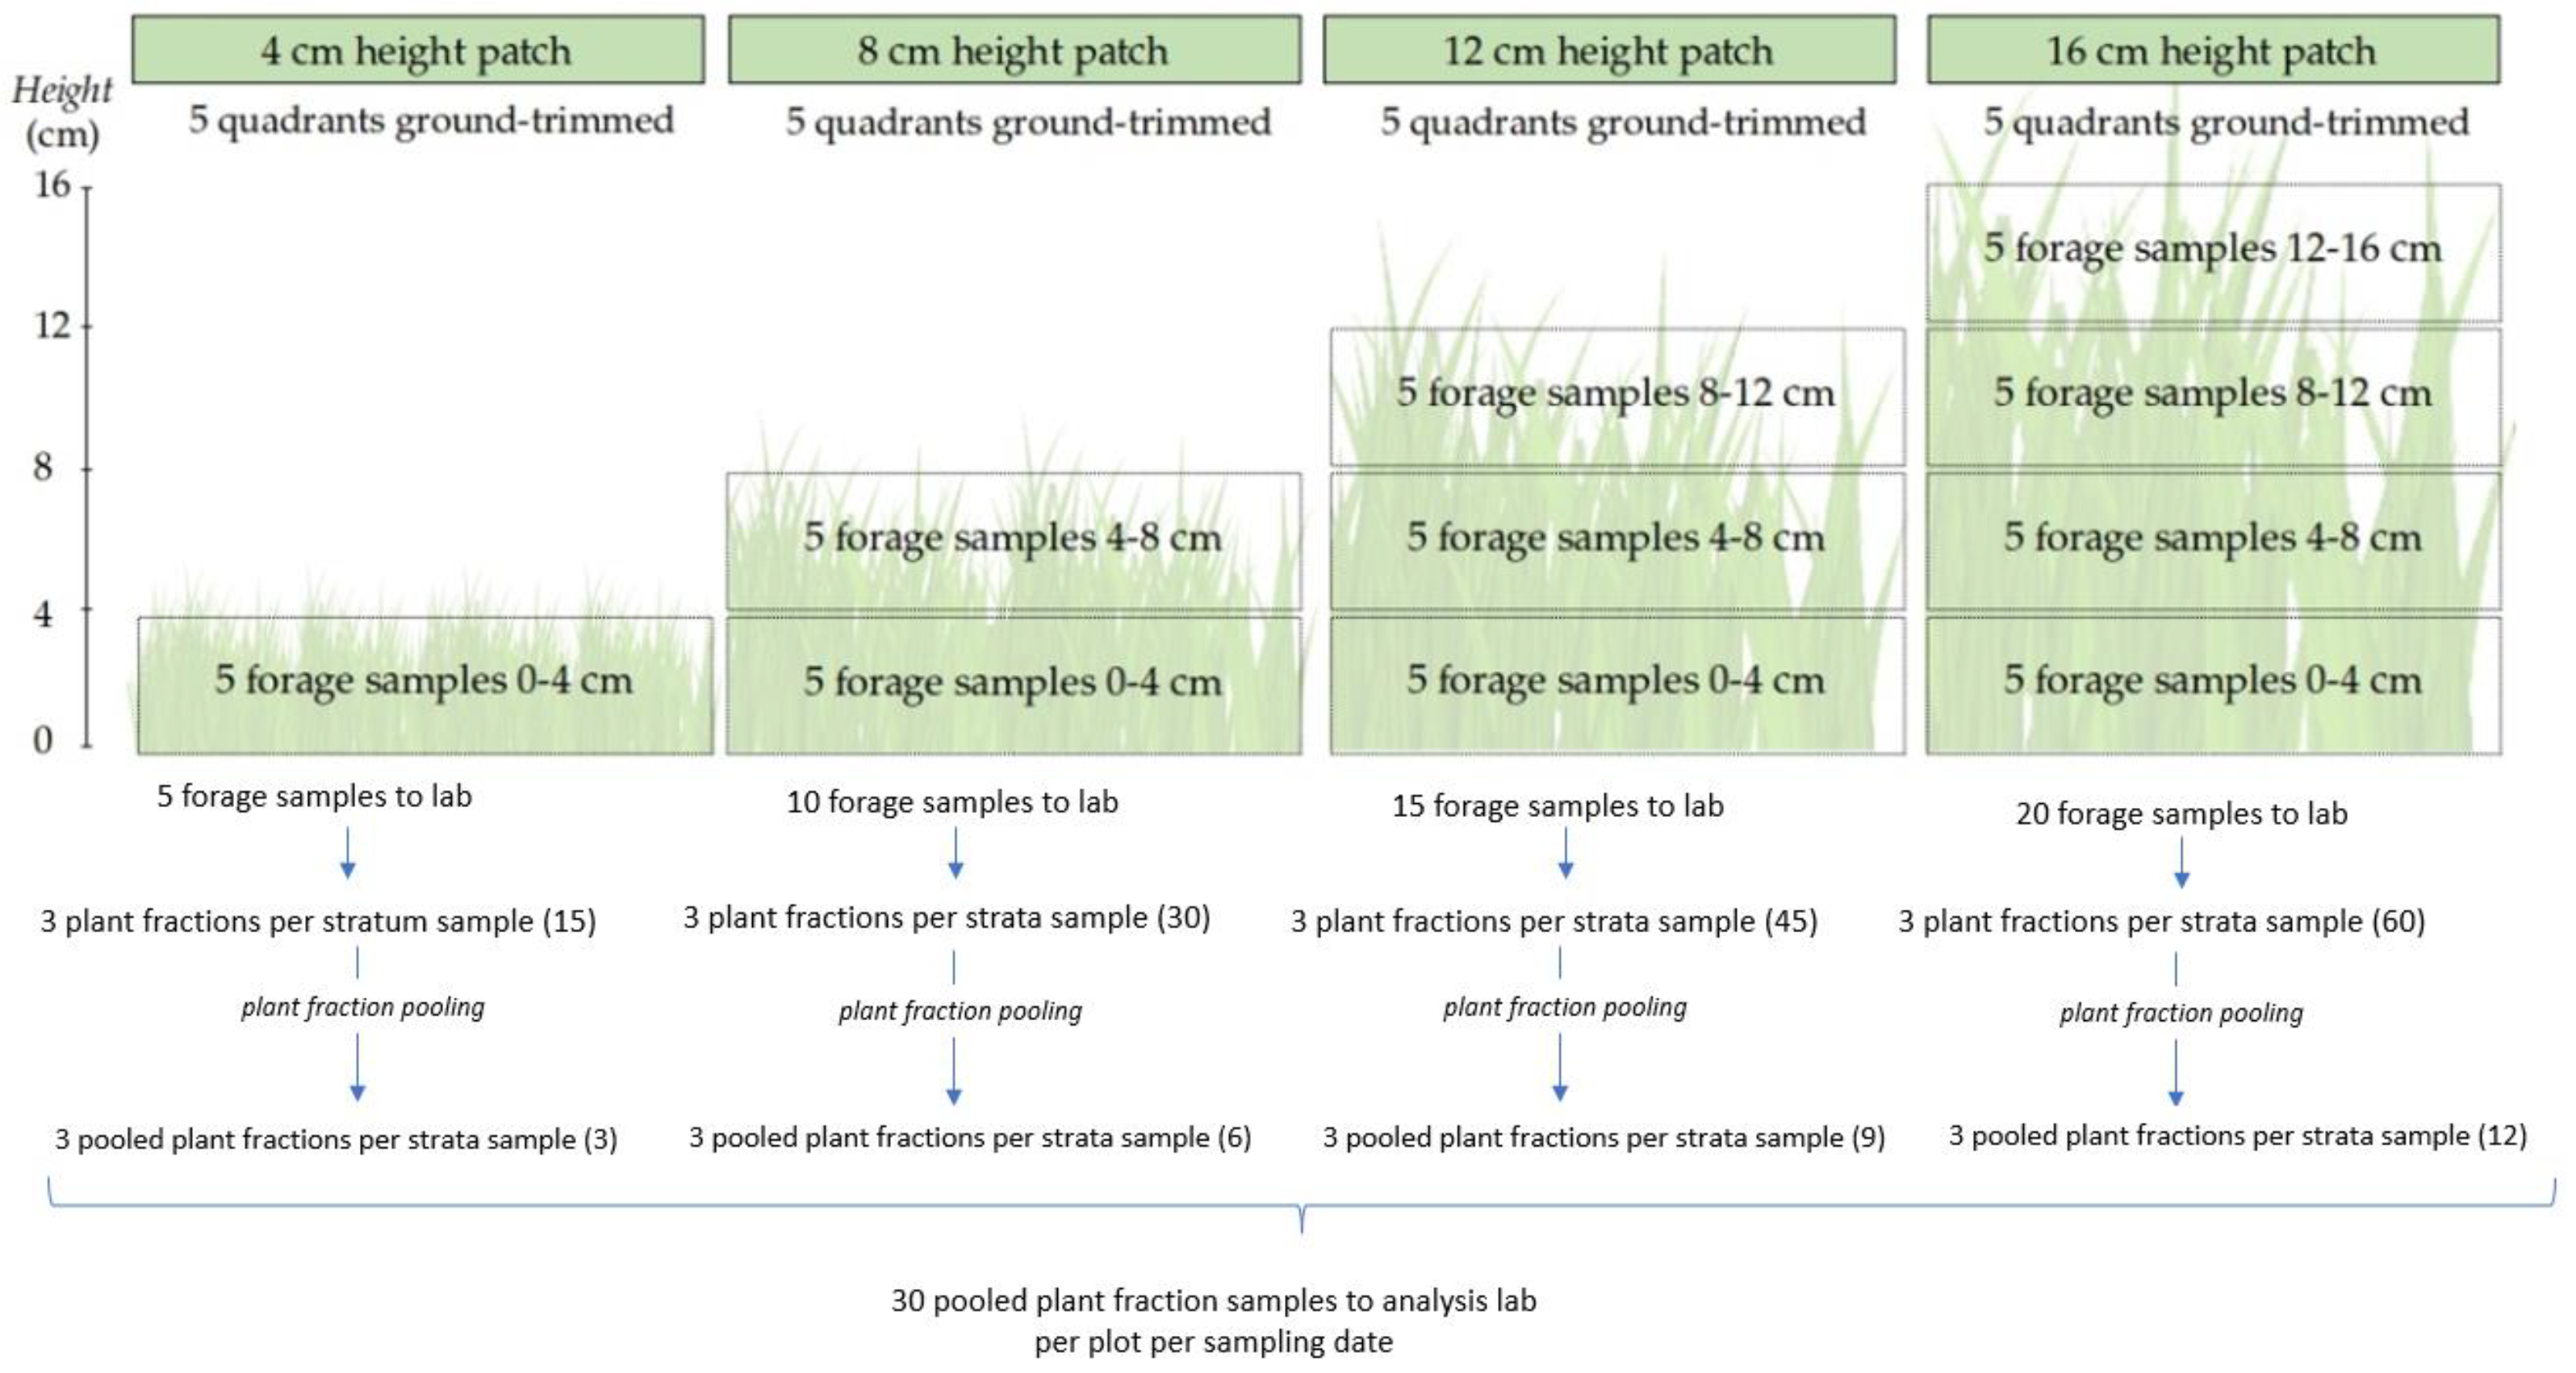
2.2. Grasslands Measurements and Forage Sampling

The forage sampling procedure was carried out according to Figure 1. On each sampling date (springs of 2017 and 2018 and summers of 2018 and 2019), four different “patches” were identified on each plot according to their height into: 4, 8, 12 or 16 cm. To determine these heights, five random measurements were taken within a 0.5 × 0.2 m quadrat placed on each patch. Above ground clippings were performed on each quadrat, into 4 cm thick strata. Thus, 4 cm patches were trimmed into one forage sample (0–4 cm), 8 cm patches were trimmed into two forage samples (0–4 and 4–8 cm), 12 cm patches were trimmed into three forage samples (0–4, 4–8 and 8–12 cm), and 16 cm patches were trimmed into four forage samples (0–4, 4–8, 8–12 and 12–16 cm). Five samples per patch per stratum were harvested and then taken to the lab, where each of them was fresh weighted and separated into three sub-sample plant fractions: green leaves, green stems and inflorescences, and dead material. Once this procedure was over, all similar fractions of the same paddock, patch and stratum were pooled into a simple sample, thus generating three subsamples of each plant fraction per sampling date. In this way, 30 pooled plant fraction samples were oven-dried at 60 °C until constant weight and finally dry weighed. These samples were later analysed to estimate CP content, as will be explained in the following section.
The coverage proportions of all vascular plants were visually recorded in the field using the Braun-Blanquet scale modified by Ellemberg and Mueller–Dombois [27] recording the five most dominant species in five places of 0.1 m2 squares prior to the biomass sample clippings. Also, to maintain the target average sward height, during each experimental cycle, sward height measurements were carried out twice a month on six fixed transects per plot using a graduated ruler. These evaluations were performed by measuring the upper canopy layer where the highest number of green leaves apices were concentrated [28].

2.3. Forage Crude Protein Analysis

The dried samples of green leaves, green stems and inflorescences, and dead material of each patch were pooled into upper stratum (the top 4 cm) and the rest of the strata underneath it (the bottom strata), and subsequently milled through a 1 mm screen in a Thomas-Wiley mill (Thomas Scientific, Swedesboro, NY, USA). Total N concentration was determined according to the Dumas method (procedure 968.06 of the Association of Official Analytical Chemists (AOAC) [29]) using a Leco LECO CHN 628 nitrogen analyser (Leco Corporation, St. Joseph, MI, USA) and expressed as FCPC (total N × 6.25) concentration. (Appendix B).

2.4. Data Analysis

Soil water availability was estimated using a daily water balance. This balance considered an available water storage capacity of 80 mm and used the daily rainfall data obtained from the automatic weather station located at Glencoe experimental station, as well as the potential evapotranspiration, which was calculated using the FAO Penman Monteith equation. Data of summer samplings were separated into dry and wet periods. Three samplings coincided with periods of normal rains with respect to those expected for the season, while the remaining period was below the average rainfall (Appendix A). The data was analysed using generalized and mixed linear models of the Infostat statistical package [30]. The statistical models included “treatment”, “patch height”, “sampling period” and their interactions as fixed factors, and “block” as a random factor. Normality of the residuals was evaluated by the Shapiro–Wilk test (p > 0.05) and the QQ-plot visual assessment. The residuals of FCPC did not meet normality criteria; therefore, it was necessary to apply a natural-log transformation. Means for significant fixed effects were compared using Fisher’s LSD test (p < 0.05). The species indicator value (IndVal) described by Dufrene and Legendre [31] was used as the measurement index that associates species and environments. This method is based on the degree of specificity (exclusivity to a particular environment) and the degree of fidelity (frequency of occurrence within the same environment). The R package “indicspecies”, was used to identify indicator species, selecting species with an IndVal greater than 60. We used linear regressions to verify the relationships among FCPC components’, comparing upper vs. bottom strata, and comparing the two contrasting summers. If the 95% confidence interval of the slopes of the regressions overlapped between fertilisation treatments, they were grouped in the analysis. These regression analyses were performed using InfoStat software [30]. In addition, we used a partial least squares structural equation modelling (PLS-SEM) to estimate how fertilisation, forage patch height and SWA affected FCPC, either directly or indirectly through intermediate variables. An a priori model with all potential causal relationships was specified and estimated. A bootstrap analysis of 5000 replications was carried out to test path significance. Subsequently, the model was simplified, excluding 10 of 18 paths between fertilisation, forage patch height and intermediate variables and 3 of the 6 paths between intermediate variables and FCPC which displayed higher bootstrapped values than the significance level of 0.05. The final model quality evaluation was performed following Hair et al. [32]. All the quality measures of the variables selected in the final model were significant (composite reliability coefficients > 0.7 and average variances extracted (AVE) > 0.5). We used the Smart PLS 3.3.5 software to perform the structural model estimation. This software uses the PLS-SEM algorithm and a graphical user interface for testing causal models that include multiple factors [32].

3. Results

A total of 40 plant species were registered from UNG and FNG. Fertilisation, patch sward height, season of the year, and SWA of the soil modified the species composition. In spring, the winter annual grass Lolium multiflorum Lam. was an indicator of all the patch sward heights in the fertilised plots. In the UNG treatment, two summer perennial grasses were found to be an indicator species: Paspalum notatum Flüggé was an indicator species in all classes of sward heights while Paspalum plicatulum Michx. was an indicator species of patch sward height of 8 cm or greater. On the other hand, no indicator species were found in summer for any of the sward heights.
During summer, the summer perennial grass Sporobolus indicus (L.) R. Br. was an indicator species (only during the dry summer) of patch sward heights of 4, 12, and 16 cm in the fertilised plots, and Panicum sp. was an indicator species of patch sward heights of above 8 cm. In the UNG treatment, two summer perennial grasses were found to be an indicator species, Paspalum plicatulum Michx. was an indicator species of patch sward height of 12 cm or greater, and Andropogon ternatus (Spreng.) Nees (only during the dry summer) was an indicator species of patches sward height of 8 cm or greater (Figure 2).
The effect of fertilisation on the components of the sward structure varied according to the sampling period. The proportion of green leaves showed no significant differences (p > 0.05) between FNG and UNG neither in spring 2017, nor in summer 2019. Nonetheless, during the summer and spring 2018 UNG showed a greater proportion of green leaves than FNG. The proportion of stems was similar (p > 0.05) between treatments in the two summers, while during both springs it was greater for FGN. The proportion of dead tissue was greatest in the dry summer of 2018 compared with the rest of the evaluations. The proportion of dead tissue presented differences only during a severe drought occurred on summer 2018, when FNG presented a greater proportion of dead tissue than UNG (Figure 3).
During spring, significant differences (p < 0.05) were detected in the proportion of the biomass components between the forage patches of different heights. The shortest forage patches (4 cm and 8 cm in spring 2017 and 4 cm in spring 2018) presented a greater proportion of green leaves than the rest of the patches, in both treatments. The reduction in the proportion of green leaves was compensated by the increase of stems and dead tissue in spring 2017 and only by the increase of stems in spring 2018. In contrast, in the summer samplings no differences were detected in the proportion of the biomass components between patches of different heights (Figure 4).
The relationship between the protein content of different components of the structure or periods with contrasting SWA was maintained beyond the variations between fertilisation treatments. The FCPC of green leaves was always above the FCPC of both dead tissue and stems, regardless of the fertilisation treatment. The FCPC of green leaves was 2.7% and 3.9% greater on average than in stems and dead tissue, respectively. On the other hand, FCPC of the upper stratum was 1% greater than that of the bottom stratum located underneath. During the wet summer, FCPC was 2.5% greater compared to the dry summer (Figure 5).

4. Discussion

Our results revealed that NG fertilisation led to strong changes in species composition. Thus, fertilisation decreased the frequency of the dominant functional group of summer perennial C4 grasses at the expense of increasing winter annual C3 grasses, mainly Lolium multiflorum, at all sward heights, which are similar results to those from previous studies [24,33,34,35]. During winter, annual C3 grasses flower and stem production is concentrated at the end of the spring while the same production of perennial C4 grasses occurs throughout the summer. However, these changes in species composition and plant functional type frequency, which imply differences in the phenology as well as light and nutrient-capture strategies [12], did not lead to significant variations in FCPC.
The present study identified a structural model that quantified the direct and indirect effects of sward height and SWA on FCPC. Three groups of intermediate variables that mediate the path between primary variables (fertilisation, sward height and soil available water) and FCPC were identified: (i) total nitrogen concentration in green leaves; (ii) forage canopy structure (proportion of: green leaves, stems, and dead tissue); and (iii) plant functional type composition (proportion of annual C3 grasses, perennial C3 grasses, perennial C4 grasses and dicots herbs). The final structural model revealed that the effects of fertilisation and SWA, through an increase of nitrogen content in green leaves, were the main pathways that influence FCPC on a basaltic NG (Figure 6).
As expected, when nitrogen is no longer limiting, fertilisation had a strong positive effect on %N in green leaves, which was the intermediate variable more related to FCPC. However, correlation analyses showed that the greatest difference in the %N between components occurred between green leaves and dead tissue evidencing that nitrogen was remobilised from senescent to young green leaves as described by Gastal and Lemaire [36]. A consistent difference of 3.9% FCPC between green leaves and dead tissue was observed for all treatments, regardless of whether they were fertilised or not, showing that nitrogen continued to be a limiting factor of forage production [37]. In contrast, our data also revealed slight variations of FCPC of the upper vs. the bottom stratum evidencing that: (i) green leaves were distributed in all sward heights patches; and (ii) the density of leaves in the upper stratum did not cause excessive shading of the lower leaves to prevent light reaching prostrate species.
In line with Lemaire and Belanger [23], we found an inverse relationship between green leaves proportion and sward height, yet this finding was only observed during spring evaluations. Although sward height patches were characterised by very different species composition, the lack of a relationship between the proportion of green leaves and sward height during both summers prevented us from detecting a general response pattern. The increase of sward height only modified the components of its structure by increasing stem proportion and reducing dead tissue proportion. Nonetheless, these pathways did not affect the overall protein content of the forage. There is strong evidence of the decline of FCPC as forage plants grow, which implies a clear trade-off between forage biomass and its nutritional value [23,38,39,40]. However, unlike what was found by Lemaire and Belanger [23] mainly from studies with pure tall fescue pastures, we did not find evidence of sward patch height having any effect on the forage protein content. This difference could be explained by the highly diverse grassland patches of the present study, which were probably grazed at different intensities throughout the grazing cycles.
The SWA was the only factor that significantly influenced the forage protein content throughout all the groups of intermediate variables of the structural model. This emphasises what Knapp et al. [41] state regarding SWA as one of the main drivers of forage production of NG. A greater SWA increased total nitrogen concentration in green leaves, green leaves proportion and C4 perennial grasses proportion, while decreasing at the same time dead tissue proportion in the forage biomass as well as the frequency of winter annual grasses. Despite all these changes, the effect of SWA on both green leaves’ nitrogen content and green leaves proportion were key factors in explaining the variations in the FCPC. The decline in SWA reduced the green leaves´ nitrogen content and accelerated leaf senescence [18], hence diluting the metabolic component (green leaves) as forage biomass increased, as was postulated by Lemaire and Belanger [23]. The drought effect was in line with the response described by He and Dijkstra [18], in which the reduction in the nitrogen absorption capacity was greater than the decline in plant growth and contrary to what was reported by Dumont et al. [19] (an increase in FCPC). This controversial effect of droughts on the nitrogen content of plants has been clarified in the review of Deng et al. [42], postulating that drought effects on soil nitrogen are mediated by drought duration and intensity. In our study the drought was not extreme, which means that the effect of a drought-induced limitation of nitrogen supply by water shortage would have been greater than the restricted growth of the pasture, thus decreasing FCPC.
Our study identified both the main drivers and the intermediate pathways that influence FCPC of a basaltic native grassland of Uruguay. We hope that the results of this study will contribute to the development of prediction models for forage protein content to improve the livestock nutrition of grazing ruminants of Campos native grasslands. Nevertheless, we must highlight that the experiment was carried out on a site that accumulates more than 20 years of fertilisation, in which changes in species composition are not recent. This situation allowed us to identify a long-term change in functional type frequencies and to include this effect in the structural model. However, a major limitation of the study is that it is difficult to extrapolate our results to short-term effects in the early years of a fertilisation scheme or other types of grassland communities. Hence, for future studies, it would be advisable to take a larger sample size of sward patches of more contrasting NG communities to capture, to a greater extent, the existing variability.

5. Conclusions

The greatest forage crude protein content occurs in the upper strata of green leaves during seasons without the occurrence of droughts in fertilised native grasslands. The effects of fertilisation and soil water availability on the green leaves’ nitrogen content, and to a lesser extent by influencing the proportion of green leaves) were the main pathways explaining the variation in the grassland forage crude protein content.

Author Contributions

M.J. conceived the topic and the initial conceptualization. L.N., M.J., J.M.A., A.H., M.D. and C.B. analysed and interpreted the information and wrote the first draft of the manuscript. L.N., M.J., C.B., J.M.A., A.H., F.C. and M.D. contributed with local information and critically discussed the new paradigm. L.N., M.J., J.M.A., C.B., J.M.A., A.H., F.C. and M.D. rewrote it. All authors have read and agreed to the published version of the manuscript.

Funding

This study was financially supported by the project Decision Support System for Native Grasslands Management of INIA-Uruguay (PA_23); and this research was funded by INIA Uruguay and ANII through a Master of Science scholarship POS_NAC_2017_1_141614 awarded to Laura Núñez.

Data Availability Statement

The datasets presented in this article are not readily available since the data are private. Requests to access the datasets should be directed to Martín Jaurena, [email protected].

Acknowledgments

The authors gratefully acknowledge the forage staff of INIA Tacuarembó, specially Saulo Díaz and Mauricio Silveira.

Conflicts of Interest

The authors declare no conflict of interest.

Appendix A

Figure A1. Soil water availability (%) during the experimental period. Note: Red symbols correspond to sampling periods.
Agronomy 12 01756 g0a1

Appendix B

Forage sample analyses were performed immediately after the samples arrived in the laboratory. After that, a 0.1 g subsample of ground material was heated up to 60 °C for at least 2 h until a stabilised weight was reached. For every 50 analysed samples an alfalfa sample (LECO reference material) was used to ensure the precision of the results of the prior 50 samples in terms of outlier identification. We used Tukey’s test based on statistical methods to identify outliers. This process uses quartiles to identify possible outliers. It can calculate the upper limit UF and lower limit LF in the data. Outliers may be out of this range. LF = Q2 − (Q3 − Q1), UF = Q2 + (Q3 − Q1). Values outside the range (<LF or >UF) were considered as outliers and so these samples were reanalysed. Reanalysis values still outside the above-mentioned threshold, were eliminated.

References

  1. Jaurena, M.; Durante, M.; Devincenzi, T.; Savian, J.V.; Bendersky, D.; Moojen, F.G.; Pereira, M.; Soca, P.; Quadros, F.L.F.; Pizzio, R.; et al. Native Grasslands at the Core: A New Paradigm of Intensification for the Campos of Southern South America to Increase Economic and Environmental Sustainability. Front. Sustain. Food. Syst. 2021, 1–11. [Google Scholar] [CrossRef]
  2. Carvalho, P.C.; Batello, C. Access to Land, Livestock Production and Ecosystem Conservation in the Brazilian Campos Biome: The Natural Grasslands Dilemma. Livest. Sci. 2009, 120, 158–162. [Google Scholar] [CrossRef]
  3. Viglizzo, E.F.; Frank, F.C. Land-Use Options for Del Plata Basin in South America: Tradeoffs Analysis Based on Ecosystem Service Provision. Ecol. Econ. 2006, 57, 140–151. [Google Scholar] [CrossRef]
  4. Weyland, F.; Barral, M.P.; Laterra, P. Assessing the Relationship between Ecosystem Functions and Services: Importance of Local Ecological Conditions. Ecol. Indic. 2017, 81, 201–213. [Google Scholar] [CrossRef]
  5. Da Trindade, J.K.; Neves, F.P.; Pinto, C.E.; Bremm, C.; Mezzalira, J.C.; Nadin, L.B.; Genro, T.C.; Gonda, H.L.; Carvalho, P.C. Daily Forage Intake by Cattle on Natural Grassland: Response to Forage Allowance and Sward Structure. Rangel. Ecol. Manag. 2016, 69, 59–67. [Google Scholar] [CrossRef]
  6. Moore, J.E.; Brant, M.H.; Kunkle, W.E.; Hopkins, D.I. Forage Supplementation and Grazing-Effects of Supplementation on Voluntary Forage Intake. J. Anim. Sci. 1999, 77 (Suppl. 2), 122–135. [Google Scholar] [CrossRef] [Green Version]
  7. Poppi, D.P.; Quigley, S.P.; da Silva, T.A.C.C.; McLennan, S.R. Challenges of Beef Cattle Production from Tropical Pastures. Rev. Bras. Zootec. 2018, 47, 1–9. [Google Scholar] [CrossRef] [Green Version]
  8. Ramos, Z.; De Barbieri, I.; van Lier, E.; Montossi, F. Body and Wool Growth of Lambs Grazing on Native Pastures Can Be Improved with Energy and Protein Supplementation. Small Rumin. Res. 2019, 171, 92–98. [Google Scholar] [CrossRef]
  9. Soussana, J.-F.; Lüscher, A. Temperate Grasslands and Global Atmospheric Change: A Review. Grass Forage Sci. 2007, 62, 127–134. [Google Scholar] [CrossRef]
  10. Chaneton, E.J. Factores que determinan la heterogeneidad de la comunidad vegetal en diferentes escalas espaciales. In La Heterogeneidad de la Vegetación de los Agroecosistemas; Oesterheld, M., Aguiar, M.R., Ghersa, C.M., Paruelo, J.M., Eds.; Facultad de Agronomía, Universidad de Buenos Aires: Buenos Aires, Argentina, 2005; pp. 19–42. [Google Scholar]
  11. Tonn, B.; Densing, E.M.; Gabler, J.; Isselstein, J. Grazing-Induced Patchiness, Not Grazing Intensity, Drives Plant Diversity in European Low-Input Pastures. J. Appl. Ecol. 2019, 56, 1624–1636. [Google Scholar] [CrossRef]
  12. Cruz, P.; Lezana, L.; Durante, M.; Jaurena, M.; Figari, M.; Bittencourt, L.; Theau, J.-P.; Massa, E.; Viegas, J.; Ferreira de Quadros, F.L. Una Clasificación Funcional de 63 Poáceas Comunes de Los Pastizales Naturales de Sudamérica. Ecol. Austral. 2019, 29, 239–248. [Google Scholar] [CrossRef]
  13. Jaurena, M.; Lezama, F.; Cruz, P. Perennial Grasses Traits as Functional Markers of Grazing Intensity in Basaltic Grasslands of Uruguay. Chil. J. Agric. Res. 2012, 72, 541–549. [Google Scholar] [CrossRef] [Green Version]
  14. Lezama, F.; Altesor, A.; León, R.J.; Paruelo, J.M. Heterogeneidad de La Vegetación En Pastizales Naturales de La Región Basáltica de Uruguay. Ecol. Austral. 2006, 16, 167–182. [Google Scholar]
  15. Wilson, J.R.; Minson, D.J. Prospects for Improving the Digestibility and Intake of Tropical Grasses. Trop. Grassl. 1980, 14, 253–259. [Google Scholar]
  16. Herrera, L.P.; Laterra, P. Relative Influence of Size, Connectivity and Disturbance History on Plant Species Richness and Assemblages in Fragmented Grasslands. Appl. Veg. Sci. 2011, 14, 181–188. [Google Scholar] [CrossRef]
  17. Azambuja Filho, J.C.R.; de Faccio Carvalho, P.C.; Bonnet, O.J.F.; Bastianelli, D.; Jouven, M. Functional Classification of Feed Items in Pampa Grassland, Based on Their Near-Infrared Spectrum. Rangel. Ecol. Manag. 2020, 73, 358–367. [Google Scholar] [CrossRef]
  18. He, M.; Dijkstra, F.A. Drought Effect on Plant Nitrogen and Phosphorus: A Meta-Analysis. New Phytol. 2014, 204, 924–931. [Google Scholar] [CrossRef]
  19. Dumont, B.; Andueza, D.; Niderkorn, V.; Lüscher, A.; Porqueddu, C.; Picon-Cochard, C. A Meta-Analysis of Climate Change Effects on Forage Quality in Grasslands: Specificities of Mountain and Mediterranean Areas. Grass. Forage Sci. 2015, 70, 239–254. [Google Scholar] [CrossRef]
  20. Marriott, C.A.; Carrère, P. Structure and Dynamics of Grazed Vegetation. Ann. Zootech. 1998, 47, 359–369. [Google Scholar] [CrossRef] [Green Version]
  21. Dos Santos, A.B.; de Quadros, F.L.F.; Rossi, G.E.; de Pereira, L.P.; Kuinchtner, B.C.; de Carvalho, R.M.R. Valor Nutritivo de Gramíneas Nativas Do Rio Grande Do Sul/Brasil, Classificadas segundo uma tipologia funcional, sob queima e pastejo. Cienc. Rural. 2013, 43, 342–347. [Google Scholar] [CrossRef] [Green Version]
  22. Díaz, S.; Kattge, J.; Cornelissen, J.H.C.; Wright, I.J.; Lavorel, S.; Dray, S.; Reu, B.; Kleyer, M.; Wirth, C.; Colin Prentice, I.; et al. The Global Spectrum of Plant Form and Function. Nature 2016, 529, 167–171. [Google Scholar] [CrossRef] [PubMed]
  23. Lemaire, G.; Belanger, G. Allometries in Plants as Drivers of Forage Nutritive Value: A Review. Agriculture 2019, 10, 5. [Google Scholar] [CrossRef] [Green Version]
  24. Rodríguez Palma, R.; Rodríguez, T. Campo Natural de Basalto: Cuánto Responde En Producción de Forraje? In Proceedings of the XXIV Reunión del Grupo Técnico en Forrajeras del Cono Sur, Tacuarembó, Uruguay, 13–14 July 2017; Ayala, W., Boggiano, P., Alvarez, O., Eds.; Instituto Nacional de Investigación Agropecuaria: Tacuarembó, Uruguay, 2017; pp. 57–59. [Google Scholar]
  25. Ávila, M.R.D.; Nabinger, C.; Brambilla, D.M.; Carassai, I.J.; Kunrath, T.R. The Effects of Nitrogen Enrichment on Tiller Population Density and Demographics of Annual Ryegrass Overseeded on Natural Pastures South of Brazil. Afr. J. Agric. Res. 2013, 8, 3013–3018. [Google Scholar] [CrossRef]
  26. Mott, G.O.; Lucas, H.L. The Design, Conduct and Interpretation of Grazing Trials on Cultivated and Improved Pastures. In Proceedings of the International Grassland Congress, State College, PA, USA, 17–23 August 1952; pp. 1380–1395. [Google Scholar]
  27. Ellenberg, D.; Mueller-Dombois, D. Aims and Methods of Vegetation Ecology; Wiley: New York, NY, USA, 1974. [Google Scholar]
  28. Hodgson, J. Grazing Management: Science into Practice; Longman Handbooks in Agriculture; Longman Scientific and Technical and John Wiley: New York, NY, USA, 1990; 203p. [Google Scholar]
  29. AOAC International. AOAC Official Methods of Analysis, 17th ed.; Association of Official Analytical Chemists: Washington, DC, USA, 2000. [Google Scholar]
  30. Di Rienzo, J.; Casanoves, F.; Balzarini, M.; Gonzalez, L.; Tablada, M.; Robledo, C. InfoStat Statistical software2011. Available online: https://www.infostat.com.ar/index.php (accessed on 30 May 2022).
  31. Dufrêne, M.; Legendre, P. Species Assemblages and Indicator Species: The Need for a Flexible Asymmetrical Approach. Ecol. Monogr. 1997, 67, 345–366. [Google Scholar] [CrossRef]
  32. Hair, J.F.; Ringle, C.M.; Sarstedt, M. PLS-SEM: Indeed a Silver Bullet. J. Mark. Theory Pract. 2011, 19, 139–152. [Google Scholar] [CrossRef]
  33. Zanoniani, R.; Boggiano, P.; Cadenazzi, M. Respuesta Invernal de Un Campo Natural a Fertilización Nitrogenada y Ofertas de Forraje. Agrocienc. Urug. 2011, 15, 115–124. [Google Scholar] [CrossRef]
  34. Jaurena, M.; Lezama, F.; Salvo, L.; Cardozo, G.; Ayala, W.; Terra, J.; Nabinger, C. The dilemma of improving native grasslands by overseeding legumes: Production intensification or diversity conservation. Rangel. Ecol. Manag. 2016, 69, 35–42. [Google Scholar] [CrossRef]
  35. Berendse, F.; Elberse, W.T.; Geerts, R.H.M.E. Competition and Nitrogen Loss from Plants in Grassland Ecosystems. Ecology 1992, 73, 46–53. [Google Scholar] [CrossRef]
  36. Gastal, F.; Lemaire, G. N Uptake and Distribution in Crops: An Agronomical and Ecophysiological Perspective. J. Exp. Bot. 2002, 53, 789–799. [Google Scholar] [CrossRef] [Green Version]
  37. Madeira, W. Efectos de La Fertilización Primavero-Estival Nitrogeno Fosfatada y Del Riego Suplementario En La Productividad y Eficiencia de Uso de Nutrientes Del Campo Natural. Master’s Thesis, UdelaR, Montevideo, Uruguay, 2019. [Google Scholar]
  38. Duru, M.; Lemaire, G.; Cruz, P. Grasslands. In Diagnosis of the Nitrogen Status in Crops; Lemaire, G., Ed.; Crops; Lemaire; Springer: Berlin/Heidelberg, Germany, 1997; p. 239. ISBN 978-3-642-64506-8. [Google Scholar]
  39. Hejcman, M.; Szaková, J.; Schellberg, J.; Tlustoš, P. The Rengen Grassland Experiment: Relationship between Soil and Biomass Chemical Properties, Amount of Elements Applied, and Their Uptake. Plant Soil 2010, 333, 163–179. [Google Scholar] [CrossRef]
  40. Lemaire, G.; Ciampitti, I. Nitrogen Use Efficiency across Genotype-by-Environment-by-Management Scenarios: A Review. Plants 2020, 9, 1309. [Google Scholar] [CrossRef] [PubMed]
  41. Knapp, A.K.; Briggs, J.M.; Koelliker, J.K. Frequency and Extent of Water Limitation to Primary Production in a Mesic Temperate Grassland. Ecosystems 2001, 4, 19–28. [Google Scholar] [CrossRef]
  42. Deng, L.; Peng, C.; Kim, D.-G.; Li, J.; Liu, Y.; Hai, X.; Liu, Q.; Huang, C.; Shangguan, Z.; Kuzyakov, Y. Drought Effects on Soil Carbon and Nitrogen Dynamics in Global Natural Ecosystems. Earth-Sci. Rev. 2021, 214, 103501. [Google Scholar] [CrossRef]
Figure 1. Sampling procedures diagram.
Agronomy 12 01756 g001
Figure 2. Indicator species (IndVaL > 60, and p < 0.05) of patch sward heights (4, 8, 12 and 16 cm) of an unfertilised native grassland (UNG) and a fertilised native grassland (FNG) registered both in spring and summer (wet and dry periods). Note: Lolium multiflorum Lam., Paspalum notatum Flüggé, Paspalum plicatulum Michx., Sporobolus indicus (L.) R. Br., Andropogon ternatus (Spreng.) Nees.
Agronomy 12 01756 g002
Figure 3. Proportion of green leaves, stems, and dead tissue (average percentage ± standard error) of an unfertilised native grassland (UNG) and fertilised native grassland (FNG) during spring 2017, summer 2018, spring 2018 and summer 2019.
Agronomy 12 01756 g003
Figure 4. Proportions of green leaves, stems and dead tissue (average percentage ± standard error) of patches with 4, 8, 12, and 16 cm during spring 2017, summer 2018, spring 2018 and summer 2019 of an unfertilised native grassland (UNG) and a fertilised native grassland (FNG).
Agronomy 12 01756 g004
Figure 5. Relationship between forage crude protein content (FCPC) of (a) green leaves vs. green stems, (b) green leaves vs. dead tissue, (c) all forage from the illuminated upper sward stratum (top 4 cm) vs. all forage from the shaded sward strata (forage below the top 4 cm), (d) all forage in the rainy summer vs. all forage in the dry summer. Patch height: 4 cm (green), 8 cm (blue), 12 cm (yellow) and 16 cm (red). Point symbols indicate unfertilised native grasslands (UNG) and cross symbols indicate fertilised native grasslands (FNG). Note: Diagonal grey lines indicate the 1:1 regression line. R2 represents the coefficient of determination and p value indicates the significance of this coefficient. The slopes of the regressions of each fertilisation treatment were not different when compared using a 95% confidence interval.
Agronomy 12 01756 g005
Figure 6. Structural equation model illustrating the direct and indirect effects of fertilisation, sward height and soil water availability (SWA) on a basaltic native grassland (NG) forage crude protein content (FCPC). The arrows represent significant positive (green) and negative (red) pathways, and the arrow width is proportional to the strength of the relationship. The grey numbers indicate the standard path coefficients (the strength of a relationship between variables), and the black numbers represent the coefficient of determination R2 of intermediate and final variables.
Agronomy 12 01756 g006
Publisher’s Note: MDPI stays neutral with regard to jurisdictional claims in published maps and institutional affiliations.

