
Sustainable Agriculture through Reduced Emission and Energy Efficiency: Estimation of Input–Output Energy and GHG Emission under Tunnel Cultivation of Tomato

 , , , and
Abstract
:1. Introduction
2. Literature Review
3. Methodology
4. Results and Discussion
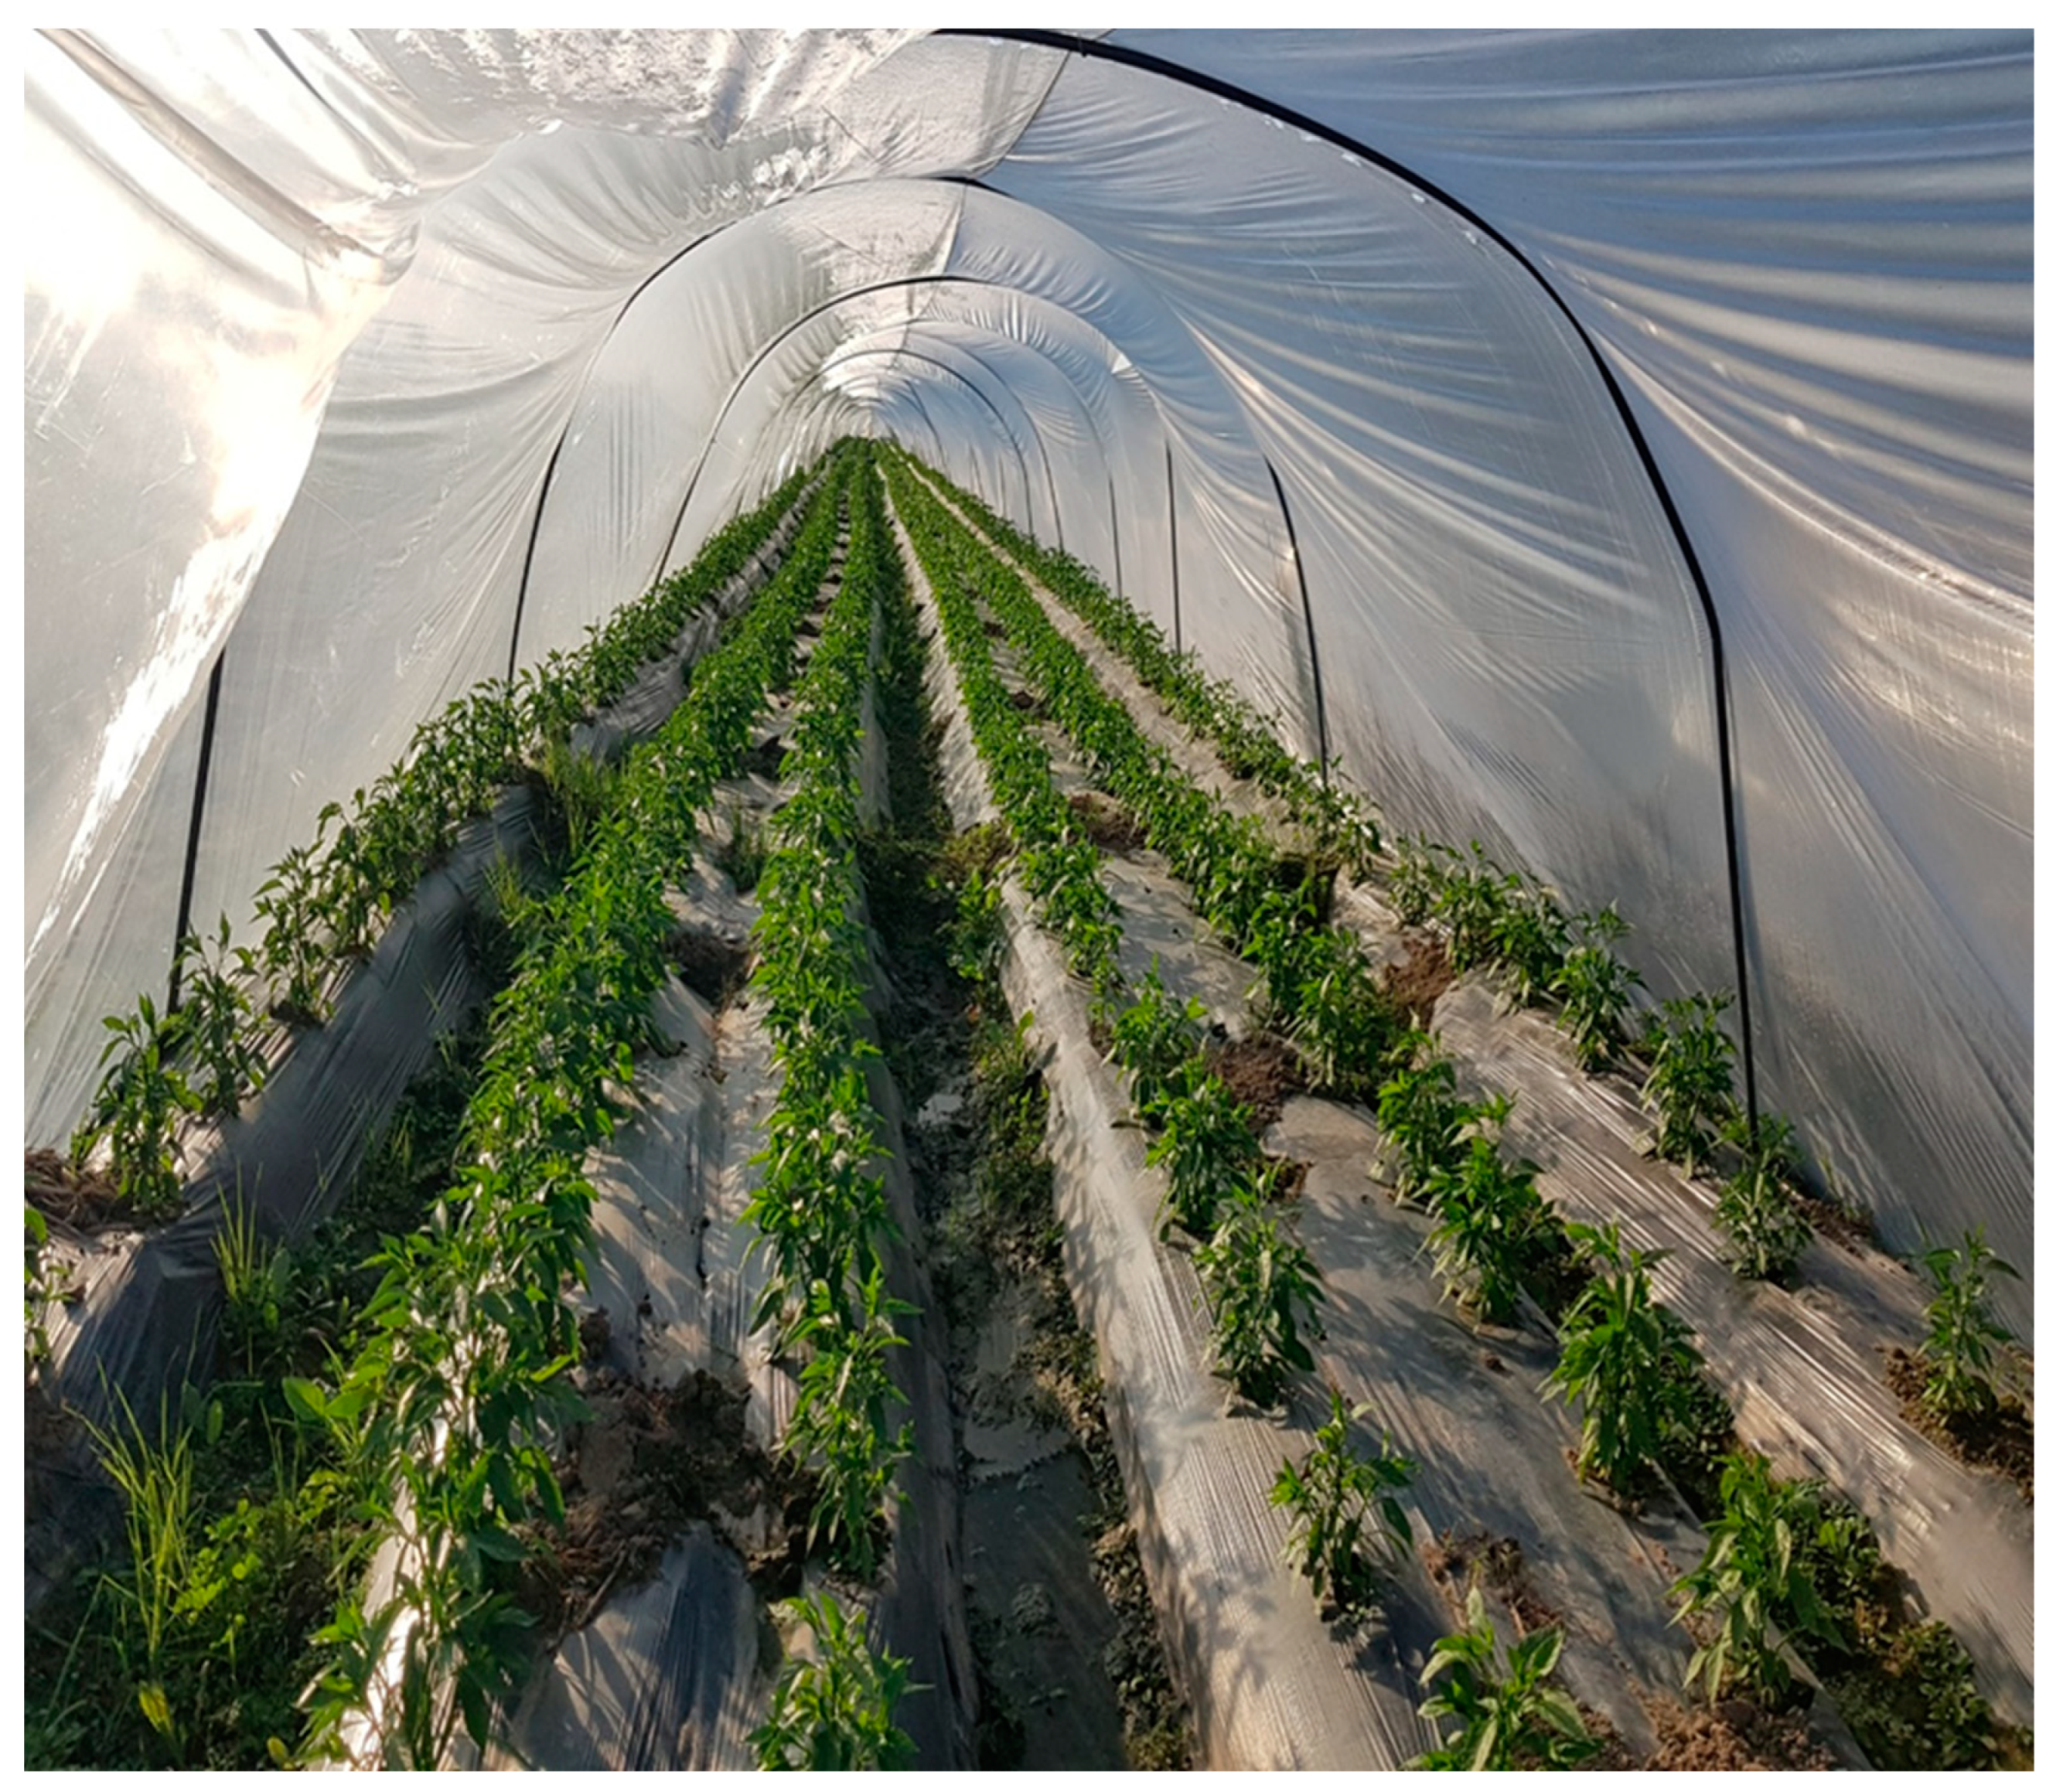
4.1. Agronomic Practices in Off-Season Tomato Production
4.2. Input–Output Energy in Off-Season Tomato
4.3. Greenhouse Emission in Off-Season Tomato
5. Conclusions and Policy Implications
Author Contributions
Funding
Institutional Review Board Statement
Informed Consent Statement
Data Availability Statement
Conflicts of Interest
References
- Laso, J.; Hoehn, D.; Margallo, M.; García-Herrero, I.; Batlle-Bayer, L.; Bala, A.; Fullana-i-Palmer, P.; Vázquez-Rowe, I.; Irabien, A.; Aldaco, R. Assessing energy and environmental efficiency of the Spanish agri-food system using the LCA/DEA methodology. Energies 2018, 11, 3395. [Google Scholar] [CrossRef] [Green Version]
- Nisar, S.; Benbi, D.K.; Toor, A.S. Energy budgeting and carbon footprints of three tillage systems in maize-wheat sequence of north-western Indo-Gangetic Plains. Energy 2021, 229, 120661. [Google Scholar] [CrossRef]
- Khan, M.T.I.; Yaseen, M.R.; Ali, Q. Nexus between financial development, tourism, renewable energy, and greenhouse gas emission in high-income countries: A continent-wise analysis. Energy Econ. 2019, 83, 293–310. [Google Scholar] [CrossRef]
- Khanali, M.; Movahedi, M.; Yousefi, M.; Jahangiri, S.; Khoshnevisan, B. Investigating energy balance and carbon footprint in saffron cultivation—A case study in Iran. J. Clean. Prod. 2016, 115, 162–171. [Google Scholar] [CrossRef]
- Pishgar-Komleh, S.H.; Ghahderijani, M.; Sefeedpari, P. Energy consumption and CO2 emissions analysis of potato production based on different farm size levels in Iran. J. Clean. Prod. 2012, 33, 183–191. [Google Scholar] [CrossRef]
- Phani, V.; Khan, M.R.; Dutta, T.K. Plant-parasitic nematodes as a potential threat to protected agriculture: Current status and management options. Crop Prot. 2021, 144, 105573. [Google Scholar] [CrossRef]
- He, X.; Qiao, Y.; Liu, Y.; Dendler, L.; Yin, C.; Martin, F. Environmental impact assessment of organic and conventional tomato production in urban greenhouses of Beijing city, China. J. Clean. Prod. 2016, 134, 251–258. [Google Scholar] [CrossRef]
- Kizilaslan, H. Input–output energy analysis of cherries production in Tokat Province of Turkey. Appl. Energy 2009, 86, 1354–1358. [Google Scholar] [CrossRef]
- Imran, M.; Ozcatalbas, O. Optimization of energy consumption and its effect on the energy use efficiency and greenhouse gas emissions of wheat production in Turkey. Discov. Sustain. 2021, 2, 28. [Google Scholar] [CrossRef]
- Cetin, B.; Vardar, A. An economic analysis of energy requirements and input costs for tomato production in Turkey. Renew. Energy 2008, 33, 428–433. [Google Scholar] [CrossRef]
- Khoshnevisan, B.; Shariati, H.M.; Rafiee, S.; Mousazadeh, H. Comparison of energy consumption and GHG emissions of open field and greenhouse strawberry production. Renew. Sustain. Energy Rev. 2014, 29, 316–324. [Google Scholar] [CrossRef]
- Yano, A.; Cossu, M. Energy sustainable greenhouse crop cultivation using photovoltaic technologies. Renew. Sustain. Energy Rev. 2019, 109, 116–137. [Google Scholar] [CrossRef]
- Ali, Q.; Yaseen, M.R.; Khan, M.T.I. Energy budgeting and greenhouse gas emission in cucumber under tunnel farming in Punjab, Pakistan. Sci. Hortic. 2019, 250, 168–173. [Google Scholar] [CrossRef]
- Ali, Q.; Khan, M.T.I.; Khan, M.N.I. Impact of energy efficiency improvement on greenhouse gas in off-season tomato farming: Evidence from Punjab, Pakistan. Adv. Energy Res. 2017, 5, 207–217. [Google Scholar]
- Farooqi, A.; Masuda, H.; Firdous, N. Toxic fluoride and arsenic contaminated groundwater in the Lahore and Kasur districts, Punjab, Pakistan and possible contaminant sources. Environ. Pollut. 2007, 145, 839–849. [Google Scholar] [CrossRef]
- Ozkan, B.; Kurklu, A.; Akcaoz, H. An input-output energy analysis in greenhouse vegetable production: A case study for Antalya region of Turkey. Biomass Bioenergy 2004, 26, 89–95. [Google Scholar] [CrossRef]
- Canakci, M.; Topakci, M.; Akinci, I.; Ozmerzi, A. Energy use pattern of some field crops and vegetable production: Case study for Antalya Region, Turkey. Energy Convers. Manag. 2005, 46, 655–666. [Google Scholar] [CrossRef]
- Yilmaz, I.; Akcaoz, H.; Ozkan, B. An analysis of energy use and input costs for cotton production in Turkey. Renew. Energy 2005, 30, 145–155. [Google Scholar] [CrossRef]
- Hatirli, S.A.; Ozkan, B.; Fert, C. Energy inputs and crop yield relationship in greenhouse tomato production. Renew. Energy 2006, 31, 427–438. [Google Scholar] [CrossRef]
- Ozkan, B.; Ceylan, R.F.; Kizilay, H. Comparison of energy inputs in glasshouse double crop (fall and summer crops) tomato production. Renew. Energy 2011, 36, 1639–1644. [Google Scholar] [CrossRef]
- Shahan, S.; Jafari, A.; Mobli, H.; Rafiee, S.; Karimi, M. Energy use and economical analysis of wheat production in Iran: A case study from Ardabil province. J. Agric. Technol. 2008, 4, 77–88. [Google Scholar]
- Banaeian, N.; Omid, M.; Ahmadi, H. Energy and economic analysis of greenhouse strawberry production in Tehran province of Iran. Energy Convers. Manag. 2011, 52, 1020–1025. [Google Scholar] [CrossRef]
- Heidari, M.; Omid, M. Energy use patterns and econometric models of major greenhouse vegetable productions in Iran. Energy 2011, 36, 220–225. [Google Scholar] [CrossRef]
- Samavatean, N.; Rafiee, S.; Mobli, H.; Mohammadi, A. An analysis of energy use and relation between energy inputs and yield, costs and income of garlic production in Iran. Renew. Energy 2011, 36, 1808–1813. [Google Scholar] [CrossRef]
- Tsatsarelis, C. Energy requirements for cotton production in central Greece. J. Agric. Eng. Res. 1991, 50, 239–246. [Google Scholar] [CrossRef]
- Bojaca, C.; Schrevens, E. Energy assessment of peri-urban horticulture and its uncertainty: Case study for Bogota, Colombia. Energy 2010, 35, 2109–2118. [Google Scholar] [CrossRef]
- Ibrahim, H.Y. Energy use pattern in vegetable production under fadama in north central Nigeria. Trop. Subtrop. Agroecosystems 2011, 14, 1019–1024. [Google Scholar]
- Djevic, M.; Dimitrijevic, A. Energy consumption for different greenhouse constructions. Energy 2009, 34, 1325–1331. [Google Scholar] [CrossRef]
- Nabavi-Pelesaraei, A.; Sadeghzadeh, A.; Payman, M.H.; Mobtaker, H.G. An analysis of energy use, CO2 emissions and relation between energy inputs and yield of hazelnut production in Guilan province of Iran. Int. J. Adv. Biol. Biomed. Res. 2013, 1, 1601–1613. [Google Scholar]
- Pishgar-Komleh, S.H.; Omid, M.; Heidari, M.D. On the study of energy use and GHG (greenhouse gas) emissions in greenhouse cucumber production in Yazd province. Energy 2013, 59, 63–71. [Google Scholar] [CrossRef]
- Esengun, K.; Erdal, G.; Gunduz, O.; Erdal, H. An economic analysis and energy use in stake-tomato production in Tokat province of Turkey. Renew. Energy 2007, 32, 1873–1881. [Google Scholar] [CrossRef]
- Jat, H.S.; Jat, R.D.; Nanwal, R.K.; Lohan, S.K.; Yadav, A.K.; Poonia, T.; Sharma, P.C.; Jat, M.L. Energy use efficiency of crop residue management for sustainable energy and agriculture conservation in NW India. Renew. Energy 2020, 155, 1372–1382. [Google Scholar] [CrossRef]
- Bórawski, P.; Bełdycka-Bórawska, A.; Szymańska, E.J.; Jankowski, K.J.; Dubis, B.; Dunn, J.W. Development of renewable energy sources market and biofuels in the European Union. J. Clean. Prod. 2019, 228, 467–484. [Google Scholar] [CrossRef]
- Nalley, L.; Popp, M.; Fortin, C. The impact of reducing greenhouse gas emissions in crop agriculture: A spatial-and production-level analysis. Agric. Resour. Econ. Rev. 2011, 40, 63–80. [Google Scholar] [CrossRef]
- de Villiers, D.S.; Wien, H.C.; Reid, J.E.; Albright, L.D. Energy use and yields in tomato production: Field, high tunnel and greenhouse compared for the northern tier of the USA (upstate New York). Acta Hortic. 2011, 893, 373–380. [Google Scholar] [CrossRef]
- Rogers, M.A.; Wszela, A.L. Influence of High Tunnel Production and Planting Date on Yield, Growth, and Early Blight Development on Organically Grown Heirloom and Hybrid Tomato. HortTechnology 2012, 22, 452–462. [Google Scholar] [CrossRef] [Green Version]

| Type | Source | GHG Emission Coefficient (kg CO2 eq. Unit−1) | |||||
|---|---|---|---|---|---|---|---|
| Unit | Energy eq. | Reference | Unit | GHG Coef. | Reference | ||
| 1—Plastic (polyethylene and mulch) | kg | 158 | [32] | - | |||
| Inputs | 2—Chemicals | kg | 101.2 | [20] | kg | 2.47 | [34] |
| 3—Labor | h | 1.96 | [23] | - | |||
| 4—Machinery | h | 62.7 | MJ | 0.071 | [11] | ||
| 5-Fertilizer | |||||||
| Nitrogen | kg | 66.14 | [23] | kg | 1.3 | [11] | |
| Phosphorus | kg | 12.44 | kg | 0.2 | |||
| Potassium | kg | 11.15 | kg | 0.2 | |||
| Farmyard manure | kg | 0.3 | [31] | kg | 0.126 | [30] | |
| 6—Seeds | kg | 1 | - | ||||
| 7—Irrigation water | m3 | 0.63 | [20] | - | |||
| 8—Diesel | L | 56.31 | l | 2.76 | [11] | ||
| Output | Tomato | kg | 0.8 | - | |||
| Name of the Agronomic Application | Off-Season Tomato |
|---|---|
| Names of varieties | Dollar, Fantom, Sahel |
| Number of seedlings (ha−1) | 32,526.08 |
| The tractor used for the preparation of land: 240 MF 47 hp and Fiat NH−480 55 hp | Disc plough, disc harrow, cultivator, rotavator, ridger, land leveler |
| Land preparation period/nursery sowing | September–October |
| Average ploughing number | 6 |
| Planting/transplanting period | October–November |
| The average number of tunnels (ha−1) | 35 |
| The average number of ridges (ha−1) | 86.66 |
| Fertilization period | October–March |
| Average fertilization (No.) | 23.62 |
| Hoeing period | January–March |
| Average hoeing (No.) | 3.42 |
| Irrigation period | November–May |
| Average irrigation (No.) | 29.11 |
| Spraying period | December–May |
| Average spraying (No.) | 24.99 |
| Picking period | March–May |
| Average picking (No.) | 32.19 |
| Inputs | Input–Output Quantities (ha−1) | Input–Output Energy (MJ ha−1) | |||||||
|---|---|---|---|---|---|---|---|---|---|
| Farm Size Groups (ha) | Weighted Average | Farm Size Groups (ha) | Weighted Average | ||||||
| 0.1–5.0 | 5.1–12.0 | 12.1+ | 0.1–5.0 | 5.1–12.0 | 12.1+ | Quantity | % | ||
| Plastic (polyethylene and mulch) (kg ha−1) | 519.54 | 499.10 | 568.29 | 529.82 | 82,087.05 | 78,857.16 | 89,789.83 | 83,712.89 | 47.81 |
| Seed (kg ha−1) | 0.25 | 0.28 | 0.24 | 0.26 | 0.25 | 0.28 | 0.24 | 0.26 | 0 |
| Labor (hours ha−1) | 2960.17 | 3058.39 | 3101.26 | 3039.41 | 5801.94 | 5994.44 | 6078.47 | 5957.25 | 3.4 |
| Fertilizer (kg ha−1) | 12,861.87 | 13,059.56 | 8870.35 | 11,555.48 | 53,207.17 | 48,810.75 | 64,048.04 | 55,542.31 | 31.72 |
| Nitrogen | 665.95 | 601.87 | 815.63 | 697.13 | 44,045.8 | 39,807.63 | 53,945.55 | 46,108 | 26.33 |
| Phosphorus | 409.78 | 386.33 | 562.04 | 454.61 | 5097.69 | 4805.9 | 6991.72 | 5655.37 | 3.23 |
| Potassium | 48.65 | 53.07 | 79.54 | 60.63 | 542.43 | 591.74 | 886.83 | 676.01 | 0.39 |
| Farmyard Manure (tonne ha−1) | 11.737 | 12.018 | 7.413 | 10.343 | 3521.25 | 3605.49 | 2223.95 | 3102.93 | 1.77 |
| Chemicals (kg ha−1) | 83.75 | 76.96 | 83.43 | 81.51 | 8475.82 | 7788.55 | 8443 | 8248.57 | 4.71 |
| Machinery (h ha−1) | 54.81 | 68.65 | 57.14 | 59.96 | 3436.65 | 4304.09 | 3582.48 | 3759.27 | 2.15 |
| Diesel (L ha−1) | 213.45 | 268.87 | 222.63 | 234.02 | 12,019.22 | 15,140.29 | 12,536.31 | 13,177.41 | 7.53 |
| Water (m3 ha−1) | 7257.32 | 8321.01 | 6834.15 | 7446.54 | 4572.11 | 5242.24 | 4305.51 | 4691.32 | 2.68 |
| Total input energy (MJ ha−1) | - | 169,600.2 | 166,137.8 | 188,783.9 | 175,089.3 | 100 | |||
| Off-season tomato yield (kg ha−1) | 68,013.59 | 72,453.29 | 72,525.32 | 70,955.8 | - | ||||
| Total output energy (MJ ha−1) | - | 54,410.87 | 57,962.63 | 58,020.25 | 56,764.64 | - | |||
| Inputs | Farm Size Groups (ha) | Weighted Average | |||
|---|---|---|---|---|---|
| 0.1–5.0 | 5.1–12.0 | 12.1+ | Quantity | % | |
| Energy ratios | |||||
| Energy use efficiency | 0.334 | 0.356 | 0.309 | 0.332 | - |
| Energy productivity (Kg MJ−1) | 0.418 | 0.445 | 0.387 | 0.416 | - |
| Specific energy (MJ Kg−1) | 2.584 | 2.394 | 2.738 | 2.577 | - |
| Net energy MJ ha−1 | −115,189.326 | −108,175.158 | −130,763.626 | −118,324.633 | - |
| Energy forms (MJ ha−1) | |||||
| Direct energy | 22,393.26 | 26,376.96 | 22,920.29 | 23,825.98 | 13.61 |
| Indirect energy | 147,206.94 | 139,760.83 | 165,863.59 | 151,263.29 | 86.39 |
| Renewable energy | 13,895.55 | 14,842.44 | 12,608.17 | 13,751.75 | 7.85 |
| Non-renewable energy | 155,704.65 | 151,295.35 | 176,175.72 | 161,337.52 | 92.15 |
| Commercial energy | 160,277.01 | 156,537.87 | 180,481.47 | 166,029.1 | 94.83 |
| Non-commercial energy | 9323.18 | 9599.93 | 8302.41 | 9060.18 | 5.17 |
| Inputs | Farm Size Groups (ha) | Weighted Average | |||
|---|---|---|---|---|---|
| 0.1–5.0 | 5.1–12.0 | 12.1+ | Quantity | % | |
| 1—Chemicals (kg) | 206.87 | 190.09 | 206.07 | 201.32 | 5.88 |
| 2—Machinery (MJ) | 244 | 305.59 | 254.36 | 266.91 | 7.79 |
| 3—Fertilizer | |||||
| Nitrogen (kg) | 865.73 | 782.43 | 1060.32 | 906.27 | 26.45 |
| Phosphorus (kg) | 81.96 | 77.26 | 112.41 | 90.92 | 2.65 |
| Potassium (kg) | 9.73 | 10.62 | 15.91 | 12.13 | 0.35 |
| Farmyard Manure (kg) | 1478.92 | 1514.3 | 934.05 | 1303.23 | 38.03 |
| 4—Diesel (L) | 589.11 | 742.09 | 614.46 | 645.88 | 18.85 |
| Total GHG emission (kg CO2 eq.ha−1) | 3476.33 | 3622.39 | 3197.57 | 3426.66 | - |
| GHG ratio (kg CO2 eq.t−1) | 67.5 | 65.72 | 60.26 | 64.46 | - |
| Exogenous Variables | Cobb-Douglas Model | Pairwise Correlation | ||
|---|---|---|---|---|
| Coefficient | t-Value | Prob. | ||
| Model 1: lnYi = a1lnX1 + a1lnX2 + a3lnX3 + a4lnX4 + a5lnX5 + a6lnX6 + a7lnX7 + a8lnX8 + ei | ||||
| 1. Energy Imbalance (MJ ha−1) | 0.092 ** | 2.387 | 0.020 | 0.515 |
| 2. Farmyard manure (kg ha−1) | 0.09 *** | 7.3 | 0.000 | 0.721 |
| 3. Nitrogen (kg ha−1) | 0.01 | 0.089 | 0.929 | 0.140 |
| 4. Phosphorus (kg ha−1) | −0.097 | −1.068 | 0.290 | −0.052 |
| 5. Potassium (kg ha−1) | −0.014 | −0.666 | 0.508 | −0.196 |
| 6. Chemicals (kg ha−1) | −0.162 ** | −2.28 | 0.026 | 0.041 |
| 7. Machinery (h ha−1) | −4.97 *** | −10.201 | 0.000 | 0.478 |
| 8. Diesel (L ha−1) | 5.129 *** | 11.935 | 0.000 | 0.48 |
| R2 | 0.756 | |||
| Adjusted-R2 | 0.728 | |||
| F-stat | 22.94 *** | |||
Publisher’s Note: MDPI stays neutral with regard to jurisdictional claims in published maps and institutional affiliations. |
© 2022 by the authors. Licensee MDPI, Basel, Switzerland. This article is an open access article distributed under the terms and conditions of the Creative Commons Attribution (CC BY) license (https://creativecommons.org/licenses/by/4.0/).
Share and Cite
Ali, Q.; Abbas, A.; Khan, M.T.I.; Bagadeem, S.; Alotaibi, B.A.; Tariq, M.; Traore, A. Sustainable Agriculture through Reduced Emission and Energy Efficiency: Estimation of Input–Output Energy and GHG Emission under Tunnel Cultivation of Tomato. Agronomy 2022, 12, 1730. https://doi.org/10.3390/agronomy12081730
Ali Q, Abbas A, Khan MTI, Bagadeem S, Alotaibi BA, Tariq M, Traore A. Sustainable Agriculture through Reduced Emission and Energy Efficiency: Estimation of Input–Output Energy and GHG Emission under Tunnel Cultivation of Tomato. Agronomy. 2022; 12(8):1730. https://doi.org/10.3390/agronomy12081730
Chicago/Turabian StyleAli, Qamar, Azhar Abbas, Muhammad Tariq Iqbal Khan, Salim Bagadeem, Bader Alhafi Alotaibi, Muhammad Tariq, and Abou Traore. 2022. "Sustainable Agriculture through Reduced Emission and Energy Efficiency: Estimation of Input–Output Energy and GHG Emission under Tunnel Cultivation of Tomato" Agronomy 12, no. 8: 1730. https://doi.org/10.3390/agronomy12081730
APA StyleAli, Q., Abbas, A., Khan, M. T. I., Bagadeem, S., Alotaibi, B. A., Tariq, M., & Traore, A. (2022). Sustainable Agriculture through Reduced Emission and Energy Efficiency: Estimation of Input–Output Energy and GHG Emission under Tunnel Cultivation of Tomato. Agronomy, 12(8), 1730. https://doi.org/10.3390/agronomy12081730