Article

Functional Analysis and Precise Location of m-1a in Rice

Anhui Academy of Agricultural Science, Hefei 230031, China
*
Authors to whom correspondence should be addressed.
Agronomy 2022, 12(7), 1706; https://doi.org/10.3390/agronomy12071706
Submission received: 31 May 2022 / Revised: 15 July 2022 / Accepted: 15 July 2022 / Published: 19 July 2022
(This article belongs to the Special Issue Environmental Ecological Remediation and Farming Sustainability)

Abstract

:
The T-DNA insertion technique is widely used in molecular breeding for its stable inheritance and low copy number in the plant genome. In our experiment, a transfer DNA (T-DNA) insertion grain of m-1a in rice was identified. Phenotypic analysis revealed that the grains appeared chalky and became extensive. The epidermis was shrinking. Meanwhile, the amylose contents of the seeds decreased significantly, and the expression of the most starch synthesis genes was obviously downregulated. Using the whole-genome sequencing and chromosome step method, the insertion position was uncovered and only located in Chr11 between 23266185 and 23266186 bp. These results may provide material for opening up new T-DNA insertion position points and a theoretical basis for rice molecular breeding.

1. Introduction

The study of gene function covers two aspects: the first is to build a gene expression profile based on the temporal and spatial expression pattern, and the other is to create mutant genes and explain their functions through phenotypic changes. The second method is widely used because mutants can directly explain the gene’s function. Generally, methods of building mutant libraries include physical and chemical mutagenesis and transposon tagging. [1,2,3]. However, the application of chemical reagents, including Diepoxybutane (Deb) or Ethyl Methane Sulfonate (EMS), or physical radiation processing of plant seeds causing a lack of plant genome DNA fragments, shifting or the site of single base mutations resulting in a mutation are the main ways to obtain the physical and chemical mutagenesis of a plant [4]. The T-DNA labeling method has been widely applied to plant mutant library building and functional genomics research for its random integration, low copying, genetic stability, large scale and high flux.
In the Arabidopsis genome, coding genes account for 85% of the entire genome, and T-DNA insertion is distributed throughout the genome similar to random insertion [5,6]. In the rice genome, coding genes account for 25% of the entire genome. The T-DNA insert priority may be related to the structure feature of gene transcription [7]. Other studies have confirmed that T-DNA insertion is located in the hot spot, generally in the genome with potential transcriptional activity areas. Due to the random integration or preference of coding sequence features, T-DNA was demonstrated to be the ideal genetic marker tool [8]. Since the T-DNA sequence was known, it was equivalent to attaching a tag to the insertion site after inserting it into the genome. The T-DNA tag’s flanking sequence tag (FST) can be easily separated by TAIL-PCR, split-PCR, plasma-saving reverse PCR and other methods to quickly determine the mutation site. The tedious process of map cloning is avoided, and the speed of gene cloning is greatly accelerated [9].
Chalkiness is one of the most important traits for evaluating the appearance quality [10,11]. An optical property is caused by air between the amyloplast and proteosome in the endosperm. Rice endosperm is formed by a flat cell population arranged in the direction of the dorsal and abdominal diameter, and generally, rice forms a well-developed flat cell population after flowering for 10 days. At this time, the cellular starch of the abdomen is not enriched to create abdominal white. The cellular starch of the back is not full enough to produce back white, and the central cell is not full enough to make the core white [12,13]. The chalkiness belongs to the complex quantitative traits, controlled by multiple genes and vulnerable to environmental impact [14]. Large and wide grains often form as abdominal white or cardiac white because the dorsal vascular bundle or aleurone layer of endosperm cells in the abdomen or middle is not fully enriched. There is a significant positive correlation, and the grain weight increases with the increase in the chalky grain rate. For example, regarding the GW2 gene (encoding E3 ubiquitin ligase), while controlling the grain width and weight, the chalky grain rate, and the control glume shell after cell division GW2 gene mutation increased the grain, all can lead to the appearance of chalkiness [15], SSIIIa starch synthesis gene mutations affect starch synthesis [16], OsPPDKB gene mutations can lead to a change in the starch synthesis route [17], and OsbZIP60-mediated unfolded protein response regulates the grain chalkiness in rice [18]. In our study, the m-1a T-DNA insertion mutant of rice was identified. The mutant glumes are more extensive, the grains are chalky, the amylose contents are decreased significantly, and most starch synthase genes are obviously downregulated.
Our experiment uses the genome walking principle for exogenous gene insertion site analysis. According to the known information, to obtain the sequence of the rice genome analysis, clearing foreign genes in the rice chromosome sequence information and the insertional chromosome locus, as well as the study of genetically modified (GM) insert events, designed to provide T-DNA insertion mutant detection method, at the same time can help us by improving the genetic traits of the seed to improve crop yield and quality.

2. Materials and Methods

2.1. Plant Material and Growth Conditions

Rice seedlings were grown at 30 °C under a 16/8-h light/dark cycle in controlled environment chambers. They were then transferred to the field and grown under normal rice-growing conditions at the Experimental Station of Anhui Academy of Agricultural Sciences in Hefei, China. The rice was the cultivar ‘Zhonghua 11’ (Oryza sativa L. subsp. japonica).

2.2. Genetic Transformation of Exogenous Genes

The coding region of the ZmbZIP22 (GRMZM2G043600_T01, https://www.maizegdb.org/gene_center/gene/GRMZM2G043600, accessed on 10 July 2020) cDNA from the maize B73 inbred line was digested with KpnI and PstI (primers: m-F and m-R, Table S1) and then inserted into the p1 vector, which is a modified version of pCAMBIA1301 (Key Lab of Biomass Improvement and Conversion of Anhui Agricultural University, China), resulting in a vector called p1. These two clones were digested with EcoRI and SacI, inserted into the binary vector pCAMBIA1301 under the control of the Cauliflower mosaic virus 35S (CaMV-35S) promoter, and inserted the NOS terminator with SphI and HindIII. The p1 vector was introduced into the Agrobacterium strain EHA105 and transformed into rice. Using hygromycin selection, 10 independent T0 transgenic lines were obtained.

2.3. DNA Southern Blot Analysis

The genomic DNA of a leaf was isolated using the improved cetyl trimethylammonium bromide (CTAB) method (CTAB extraction buffer: 2% (w/v) CTAB, 0.1 M Tris-Cl (pH 8.0), 20 mM ethylenediamine tetraacetic acid (EDTA, pH 8.0), 1.4 M NaCl, 2% β-mercaptoethanol). The PCR product of the GUS (β-glucuronidase) gene was amplified using DIG-labeled GUS probe primers (rGUSp-F and rGUSp-R, Table S1), and HindIII-digested rice DNA (100–150 μg) was immobilized on a positively charged nylon membrane [19]. The DNA concentration was determined with a microultraviolet spectrophotometer One Drop OD-1000 (Thermo Fisher, Waltham, MA, USA). The membrane was a Hybond-N+ positively charged nylon membrane (Amersham, code PRN303B).

2.4. Insertion Site Analysis

Based on the known DNA sequence, three synthetic and higher annealing temperatures (60–65 °C) of specific primers were designed separately. With a genome walking kit (Takara, Japan, code D316) providing four random primers (AP1, AP2, AP3 and AP4) as the upstream primer, AP3 in the four AP primers had the best amplification effect in this experiment. The m-1a genome was extracted by CTAB as a template based on the known sequence information to specific primers as downstream primers (primer sequence shown in Table S1) for the nested PCR. After three rounds of nested PCR, the gene insertion site’s left border of the sequence was amplified and then would be bright with the third round of PCR reaction concentrate with SP3 for a primer for DNA sequencing. The sequencing was performed by Genomics Company for further analysis.

2.5. Grain Trait Measurements

More than three randomly chosen filled grains from each line or strain were aligned lengthwise along a vernier caliper to measure the seed length and then rearranged to measure the grain width and thickness [20]. The 1000-grain weight was determined by weighing 10 replicates of 100-grain samples independently on an electronic balance. The seed length was measured by vernier calipers (SANLIANG, Japan, code 111-101). The seeds were weighed using an electronic balance (Sartorius, Germany Gottingen, code BS210S).

2.6. Analysis of Starch Properties

The harvested paddy seeds were air-dried and stored at room temperature. The embryos and pericarps were removed before the experiment, and the endosperms were ground to a powder using a grinding mill. The starch and amylose contents were measured using starch assay kits by following the manufacturer’s instructions (K-TSTA and K-AMYL; Megazyme). To determine the amylose content, the powder was soaked for 48 h in 0.4% NaOH (powder:NaOH = 1:3) at room temperature, washed with distilled water until no slimy liquid remained and drained [21].

2.7. Observation of Endosperm Starch Granules

The seeds were entirely dried under low pressure and cut across the short axis, and the surface was sputter-coated with gold before observation via scanning electron microscopy [22].

2.8. Gene Expression Analyses

To analyze the expression patterns of the starch synthesis genes in the seeds of the transgenic and wild-type plants, developing seeds were harvested from rice (3 DAP, 6 DAP, 10 DAP, 15 DAP and 20 DAP). All samples were frozen in liquid nitrogen and stored at −80 °C immediately. The total RNA was isolated using the E.Z.N.A. MagSi Plant RNA Kit (Omega Biotek) and was treated with DNaseI to remove contaminating genomic DNA. All PCR primers used in this study are given in Table S2. The cDNAs were synthesized using the PrimeScript™ RT Reagent Kit with gDNA Eraser (Perfect Real Time; Takara). The expression levels were calculated using the 2−ΔΔCT method. A gene amplification PCR instrument (BIO-RAD, America) and a real-time PCR instrument (ABI 7500, America) were applied.

2.9. Statistical Approach

The experimental data were processed and analyzed using Excel (Microsoft) and sigmaPlot 10.0 software. Excel software was used for the data statistics, mean and standard deviation calculation, while sigmaPlot 10.0 software was used for column and line chart plotting and significance analysis.

3. Results

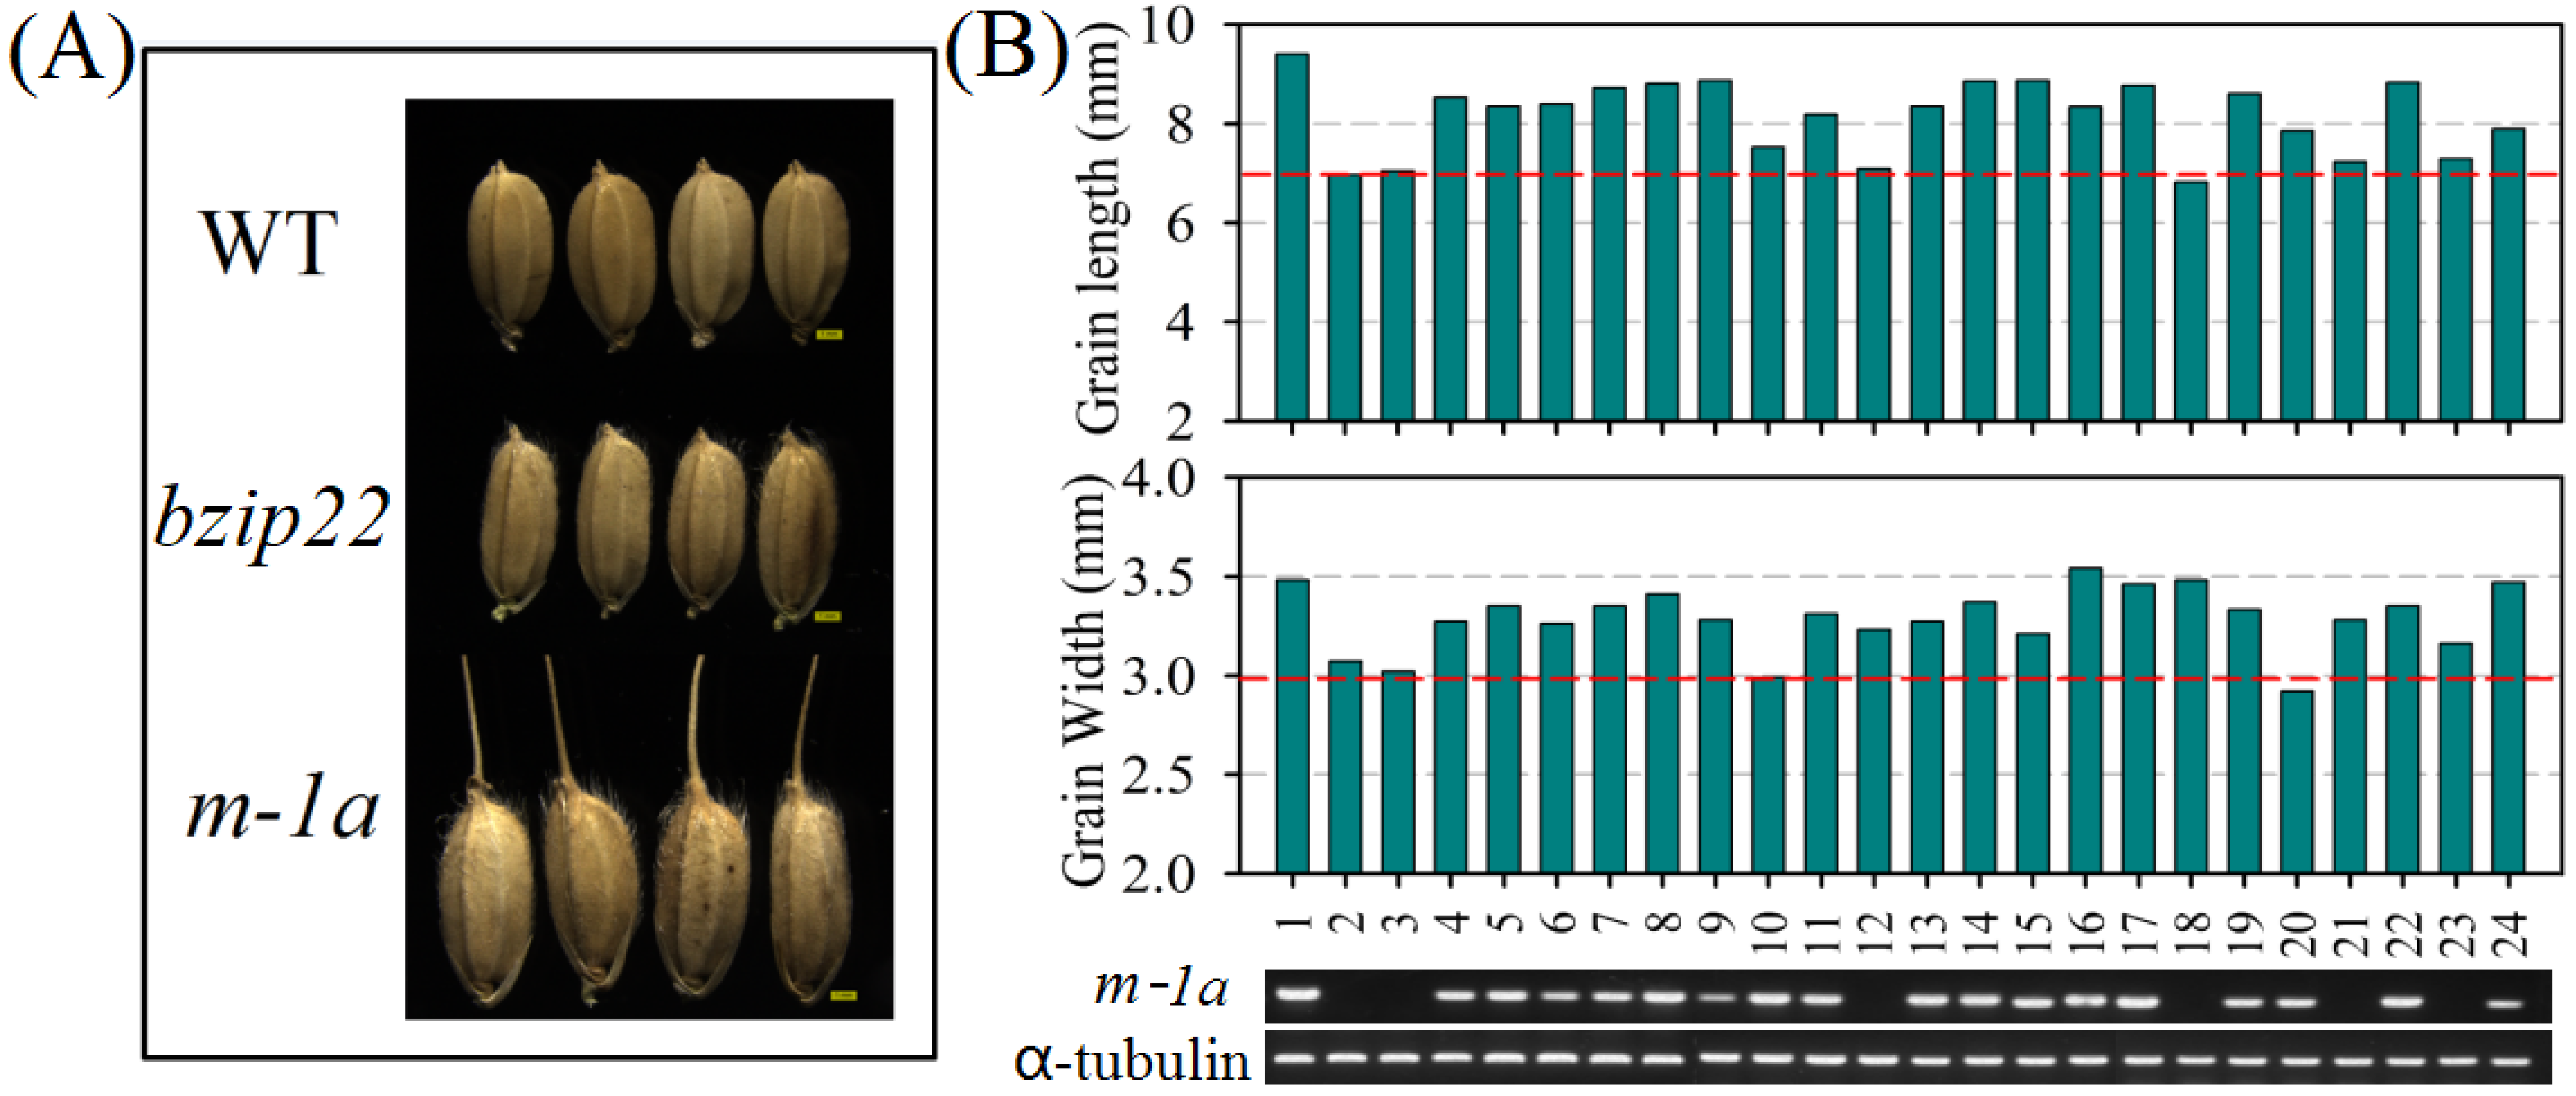
3.1. Analysing of m-1a Grain Characteristics

The ZmbZIP22 transgenic T1 generation seed analysis found that a transgenic strain differed from the others. This strain was named m-1a separately. It can be seen that, compared with the wild-type and ZmbZIP22 transgenic strain, m-1a has a large grain, long palea tip and long glume hair (Figure 1A). We selected 24 seeds from T2 of m-1a for the separation experiment. PCR detection of seeds of false positives was conducted with primer m-F and the m-R testing purpose gene, with α-tubulin as an internal gene (primer sequences are shown in Table S1). From the results of Figure 1B, we know that a positive seed’s length and width are greater than the wild type.
The T3 of the m-1a strains were analyzed for the single-ear plant type, glume size, phenotype, the internal structure of the flower and seed growth at different stages. The results indicated that for the m-1a strains, the ear length (Figure 2(Ia)), glume (Figure 2(Ib)), anther (Figure 2(Ic)), ovary (Figure 2(Id)), glume hair (Figure 2(Ie)) and seed (Figure 2(If)) were significantly greater than the wild type, particularly apiculus. After the T3 generation of seeds matured, the phenotype and internal structure of the seeds were taken for further analysis. We selected 100 grains for the apiculus length, each chosen randomly with the 100 grains measured. The analysis results showed that the mean sizes of the three apiculus strains were 6.871 mm, 7.042 mm and 6.941 mm, but the wild type’s was 2.632 mm, and the average increased by 45.07%. Therefore, the strain length was significantly greater than in the wild type (Figure 3II). From the three m-1a strains, the plants and wild-type strains had 1000 grains randomly selected for measuring the length and width. The results show that the m-1a grain length was significantly higher than that of the wild type, with a width slightly larger than the wild type and increased by 9.91% and 2.90%, respectively (Figure 3I). The grain analysis found that the m-1a seeds, compared with the wild type, had a higher average, increasing by 10.31%, and the 1000-seed weight also obviously increased in the m-1a strains (Figure 3III).
We analyzed the starch granules of the m-1a seed endosperm to investigate the internal structure further. Figure 4, showing the stereoscopic microscope observation, reveals that the skin of the m-1a seeds was wrinkled and separated from the endosperm, a chalk-white phenomenon occurring near the center (Figure 4a–d). Scanning electron microscopy (SEM) of the seed transverse sections was performed, and the abdomen and back phenotype and starch structure had no obvious change compared with the wild-type seeds. However, the seed starch grains near the center of the polyhedron, most of the starch grains and the protein bodies were loosely arranged, and a small amount of starch grains remained to form a complex spherical mosaic in the loose starch grains and protein in the body and was loosely arranged between the starch grains. The gap was bigger, showing formation of white chalk (Figure 4I,II). The phenotypic and starch granule structure of the m-1a strains had obvious changes to the physiological and biochemical properties, and we determined the total starch and amylose content the of m-1a seeds. The amylose content of the m-1a seeds, compared with the wild type, was reduced by 13.81% (Figure 5I), and the total starch content changed by only 1.49% (Figure 5II).

3.2. Analysis of m-1a Insertion Site

Whole-genome sequencing of m-1a strain and wild type, each sample depth information acquisition was 5 X, and the total amount of information acquisition was ≥2 G or would provide the data for bioinformatics analysis. As shown in Figure 6, the gene was inserted into a Chr11 between 23265341 and 23267002 bp (Figure 6I). To further confirm the specific location, we used the chromosome walking technologies (Takara Genome-Walking Kit, Japan) according to the known DNA sequences and three synthetic and annealing temperature high-specificity primers to amplify the gene insertion site on the left border of the sequence. It would be bright with the third round of PCR reaction concentrate, and with SP3 for a primer for DNA sequencing, the sequencing results were compared with the library’s published rice genome sequence analysis. It was found that the gene insertion position was located in Chr11 between 23266185 and 23266186 bp and only this one location (Figure 6II). To confirm that there was only one insertion site, at the same time, the m-1a strain underwent a Southern blot analysis, and as can be seen from the graph, there was only one copy number, thus proving the gene had only one insertion site (Figure S1), which is consistent with the results of the previous analysis.

3.3. Insertion Position and Phenotypic Relationship Analysis

For the ZmbZIP22 gene inserted in the location of 23266185–23266186 (Chr11), the genetic distance was 2421 bp upstream of the recent gene (LOC_Os11g39090, 23263045–23263602 bp) and 5921 bp downstream of the current gene (LOC_Os11g39100, 23272107–23271505 bp). The gene was not inserted into the functional genes, and the downstream gene promoter was likely located in the unknown area of the functional genes and non-coding regions. Nevertheless, the insertion triggered the changes in the internal structure, contents of grains, grain size and glume hair length. As is shown in Figure 2, the insertion caused the low rate of pollen vitality (no data shown), most of the grains could not pollinate after flowering, and only a small number were successful. Further analysis of the biological process for the functional annotation genes on Chr11 revealed that all gene functioning was mainly focused on being annotated as cell death, a response to stimulus, response to stress, defense response, phosphorus metabolism, apoptosis and so on, and for the cell death and response to stimulus especially, the number of features was far greater than the reference number in the background (Figures S2–S4).

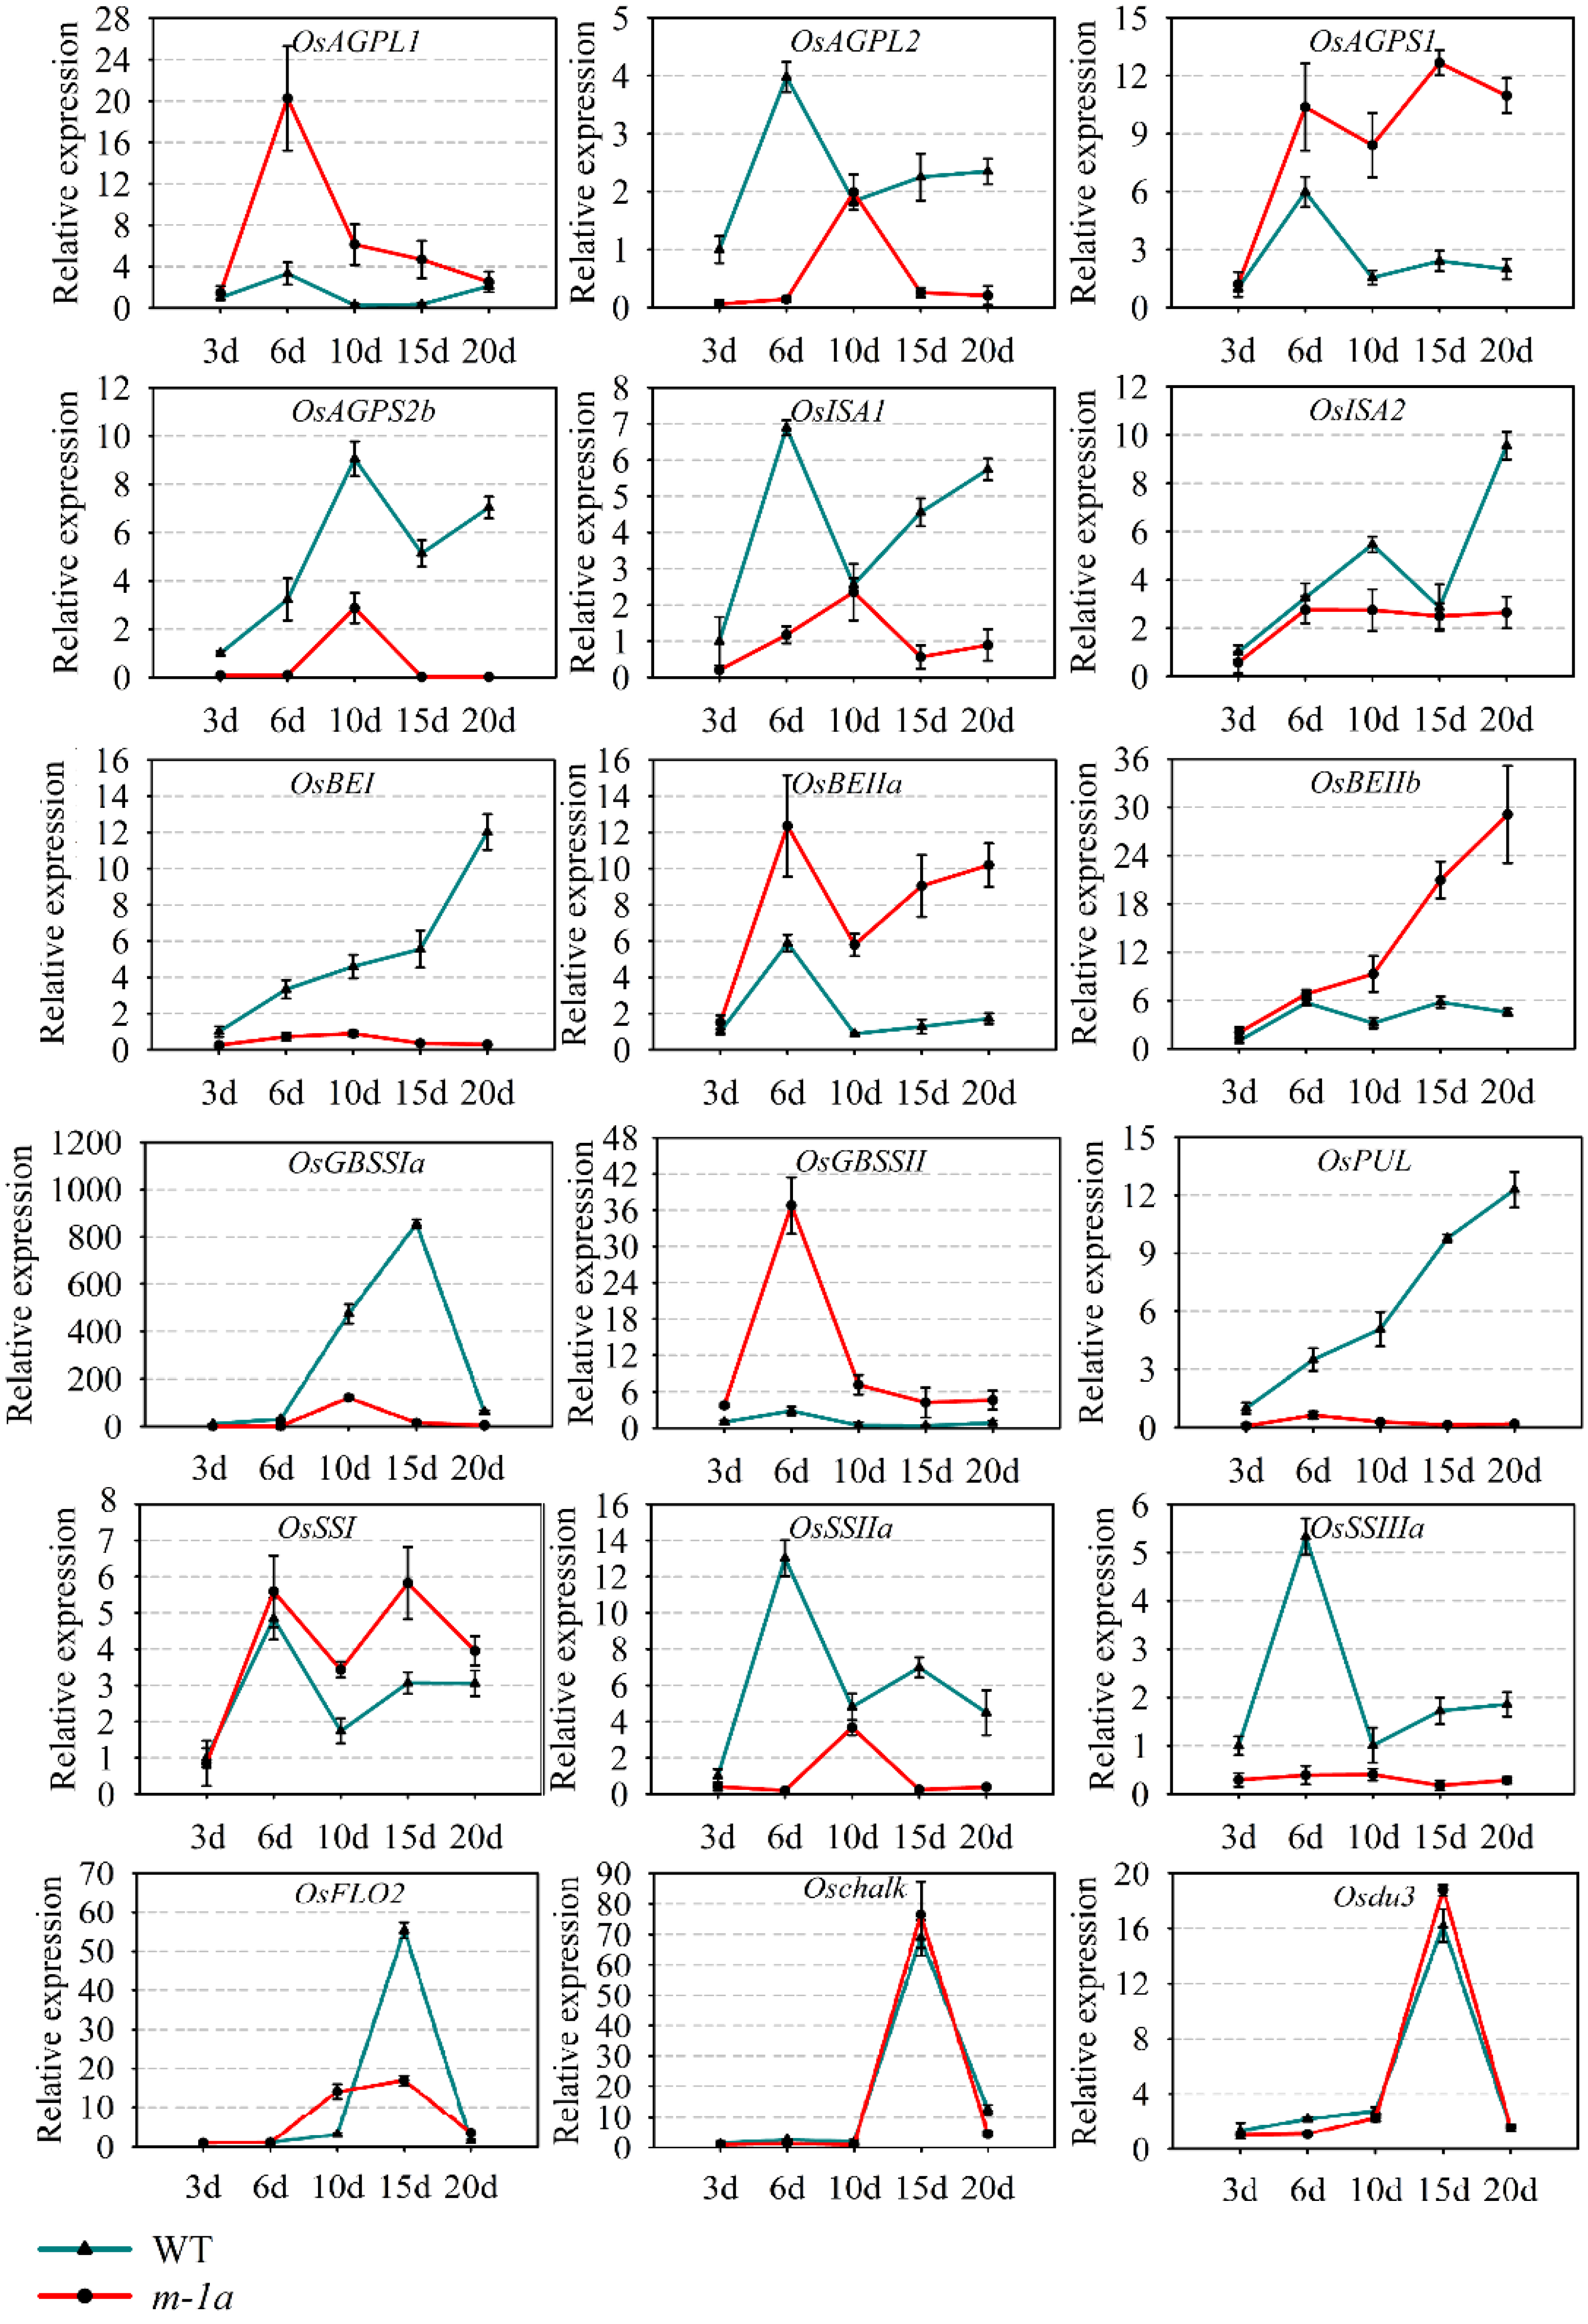
3.4. Expression Levels of Related Genes in Rice Starch Synthesis

The phenotypic analysis found that the m-1a strains for the grain displayed a central chalk and contained a lower amylose content. The gene insertion affected the rice starch synthesis. Therefore, we selected the reported 18 representatives of the rice starch synthesis genes and determined the expression levels of the seeds at 3 d, 6 d, 10 d, 15 d and 20 d after pollination (Figure 7). At the same time, for the downstream genes of the insertion site in the region of the 5 Kb, seven genes were identified.
The gene expression analysis indicated that the expression levels of OsAGPL1, OsAGPS1, OsBEIIa, OsGBSSII and SSI were significantly upregulated. The expression levels of OsAGPL2, OsAGPS2b, OsISA1, OsISA2, OsSSIIa, OsSSIIIa, OsBEI, OsBEIIa, OsBEIIb, OsPUL, Osflo2, Ostdcp and OsNBS-LRR were significantly downregulated if compared with that of the control (Figure 8). The SEM images of the endosperm revealed that the WT was composed of large, densely packed polyhedral starch granules. The floury endosperm consisted of small, loosely packed spherical starch granules (Figure 4). Because the inside of a seed is formed after the outside, m-1a appears to function in starch accumulation during the late stage of endosperm development.

4. Discussion

The grain size of rice is the main breeding target. Many genes that control grain size have been identified in rice, such as GS2, GS3, GW5, DEP1, PPKL1, TGW6 and CLG1 [20,23,24,25,26,27,28]. However, these genes were inserted into functional genes, and we know that when T-DNA is inserted into the gene coding region, it will cause partial inactivation of gene function [5]. In the m-1a material, the gene of ZmbZIP22 was inserted into the Chr11 23266185–23266186 bp position, which was a non-coding region. T-DNA insertion into the promoter or 3’-terminal untranslated regions may cause downregulation of gene expression [5]. Moreover, we performed a biological process analysis of all genes downstream of the insertion site for the m-1a insertion sites located on rice Chr11. The results showed that most of the genes were involved in cell death and programmed the cell death response to stress and apoptosis as well as the defense response (Figures S2 and S3). We selected downstream gene analysis and found that the expression level of tdcp9 (thioredoxin domain-containing protein) and the NBS-LRR gene decreased, especially in the case of NBS-LRR (Figure 8). Thioredoxin tdcp9 was reported to be mainly involved in many physiological processes in humans and animals, including the regulation of stress resistance, apoptosis and regulation of the transcription factors’ DNA binding activity [29,30]. NBS-LRR resistance proteins play an important role in plant defense against microbial invasion [31,32]. The decrease in the gene expression level of the NBS-LRR protein reduces the function of m-1a in resisting external microbial invasion.
A phenotypic analysis of m-1a showed that although the grains were enlarged, the epidermis was crumpled, and the central part of the endosperm was chalky. Multiple genes coordinate the development of rice grains. Through quantitative analysis of the genes related to starch synthesis, the results showed that the expression of most genes decreased significantly (Figure 3 and Figure 4). ADPG focal phosphorylase (ADPG-ppase) is the first key rate-limiting enzyme in the metabolic pathway of starch synthesis, being directly involved in the synthesis of amylose and amylopectin. The peak activity of ADPG-ppase is positively correlated with the content of the total starch, amylose and amylopectin (A and B chains) [33,34]. Several subunits of AGPase were found to be distributed in different positions and expressed in different tissues with distinct stages of endosperm development. OsAGPS1, OsAGPL1, OsAGPS2b and OsAGPL2 are mainly expressed in endosperm [35]. OsAGPS2b and OsAGPL2 are expressed in the middle and late stages of grain development. Mutations of AGPase can lead to crumpled phenotypes in seed grains [36]. In our paper, the expression of the OsAGPS2b and OsAGPL2 genes was significantly lower than that in the wild type during the whole growth cycle, and grain shrinkage was observed at the later stage of development (Figure 4 and Figure 7). We know that mutations and deletions of SSIIa and SSIIIa genes are the key reason for chalkiness forming in rice grains and that their expression levels are significantly downregulated [16] and significantly lower than those of the wild type throughout the growth cycle (Figure 7). Oschalk, annotated as the vacuolar membrane proton transport pyrophosphatase gene, may be achieved by interfering with the homeostasis pH of the intimal transport system of developing seeds. This process affects proteome formation and is coupled with a significant increase in vesicle-like structures, which results in the formation of a gas space in the endosperm storage materials [37]. The expression of the Oschalk gene in m-1a grains was slightly higher than that in the wild type (Figure 7). A change in this gene is not a direct reason to form chalkiness.
Analysis of the starch content and starch granules in the endosperm of the m-1a seeds showed that the content of total starch and amylose decreased, especially in the case of the amylose content (Figure 5). For the flo2 gene loci, controlling the amylose content in rice, alleles from EM317 flo2 decreased the amylose content in the rice endosperm [38] and significantly lowered the gene expression in m-1a compared with the wild type (Figure 7). Especially after 10 days of pollination, the change in this gene was also the direct cause of the decrease in amylose content. The key gene GBSSIa, which controls the amylose content, is the direct cause of the amylose content decreasing. Deletion of the GBSSI protein directly causes the loss of amylose in plants [39,40]. In our study, the GBSSIa gene expression was significantly downregulated in the m-1a strains (Figure 7). Scanning electron microscopy analysis showed that the starch grains in the center of the seed were polyhedrons. Most of the starch grains and protein bodies were loosely arranged, and a small amount of a starch granule formation complex was spherically inlaid in the loose starch granules and protein bodies. SA1 is necessary for normal starch biosynthesis in cereal endosperm, and it can function independently in cereal endosperm, but for an unknown reason, it requires ISA2 as a partner in other plant tissues [41,42]. The expression level of ISA2 was decreased (Figure 7), resulting in changes in the starch granule structure in potatoes and Arabidopsis mutants [43]. ISA1 and ISA2 expressions were downregulated (Figure 7). Changes in the expression levels of these three genes can partly account for the reduction in size of the starch granules in the transgenic lines (Figure 4(IIb)). The m-1a seeds were affected by starch synthesis genes throughout the growth cycle, which had an important effect on their development and severe grain defects.

5. Conclusions

In this study, rice of the m-1a grain was obtained by Agrobacterium-mediated genetic transformation. The phenotype changed greatly, the grain produced chalk, the starch particles were loosely arranged, the proteosomes were reduced, and the amylose was significantly reduced. Genome sequencing and chromosome walking technologies identified that the gene was inserted in Chr11 between 23266185 and 23266186 bp, a non-coding sequence region. Functional analysis revealed that the expression level of genes related to starch synthesis was affected such that the relevant genes in the starch synthesis pathway could not usually be allowed, especially the expression level of genes related to amylose synthesis, which seriously inhibited the expression of genes. This insertion area will give new understanding to the study of gene function and provides further theoretical support to creating seed resources.

Supplementary Materials

The following supporting information can be downloaded at https://www.mdpi.com/article/10.3390/agronomy12071706/s1. Figure S1: Southern blot analysis of m-1a strain. Figure S2: Functional annotation gene GO annotation in Chr 11. Figure S3: Biological process analysis of downstream genes of m-1a insertion site. Figure S4: Mollecular function analysis of downstream genes of m-1a insertion site. Table S1: Oligonucleotide primers used in this study. Table S2: Rice genes used in endogenous gene expression assays.

Author Contributions

Writing—original draft preparation, Q.D.; methodology, J.S.; data curation, F.W.; validation, Y.Q. and C.J.; conceptualization, C.Z.; writing—editing, T.L. All authors have read and agreed to the published version of the manuscript.

Funding

This work was supported by the Key Research and Development Plan of Anhui Province (202104a06020019) and the Academy of Agricultural Sciences (2021YL084).

Institutional Review Board Statement

Not applicable.

Informed Consent Statement

Not applicable.

Data Availability Statement

Not applicable.

Conflicts of Interest

The authors declare no conflict of interest.

References

  1. Agrawal, G.K.; Yamazaki, M.; Kobayashi, M.; Hirochika, R.; Miyao, A.; Hirochika, H. Screening of the rice viviparous mutants generated by endogenous retrotransposon Tos17 insertion. Tagging of a zeaxanthin epoxidase gene and a novel ostatc gene. Plant Physiol. 2001, 125, 1248–1257. [Google Scholar] [CrossRef] [Green Version]
  2. Marcon, C.; Altrogge, L.; Win, Y.N.; Stöcker, T.; Gardiner, J.M.; Portwood, J.L.; Opitz, N.; Kortz, A.; Baldauf, J.A.; Hunter, C.T.; et al. BonnMu: A Sequence-indexed resource of transposon-induced maize mutations for functional genomics studies. Plant Physiol. 2020, 184, 620–631. [Google Scholar] [CrossRef]
  3. Kim, E.Y.; Fan, W.; Cho, J. Determination of TE insertion positions using transposon display. Methods Mol. Biol. 2021, 2250, 115–121. [Google Scholar]
  4. Settles, A.M. EMS mutagenesis of maize pollen. Methods Mol. Biol. 2020, 2122, 25–33. [Google Scholar]
  5. Krysan, P.J.; Young, J.C.; Sussman, M.R. T-DNA as an insertional mutagen in Arabidopsis. Plant Cell 1999, 11, 2283–2290. [Google Scholar] [CrossRef] [Green Version]
  6. Pucker, B.; Kleinboelting, N.; Weisshaar, B. Large scale genomic rearrangements in selected Arabidopsis thaliana T-DNA lines are caused by T-DNA insertion mutagenesis. BMC Genom. 2021, 22, 599. [Google Scholar] [CrossRef]
  7. Nakano, A.; Suzuki, G.; Yamamoto, M.; Turnbull, K.; Rahman, S.; Mukai, Y. Rearrangements of large-insert T-DNAs in transgenic rice. Mol. Genet. Genom. 2005, 273, 123–129. [Google Scholar] [CrossRef]
  8. Gong, W.K.; Zhou, Y.; Wang, R.; Wei, X.L.; Zhang, L.; Dai, Y.; Zhu, Z. Analysis of T-DNA integration events in transgenic rice. J. Plant Physiol. 2021, 266, 153527. [Google Scholar] [CrossRef]
  9. Liu, Y.G.; Chen, Y. High-efficiency thermal asymmetric interlaced PCR for amplification of unknown flanking sequences. Biotechniques 2007, 43, 649–650. [Google Scholar] [CrossRef]
  10. Cheng, F.M.; Zhong, L.J.; Wang, F.; Zhang, G.P. Differences in cooking and eating properties between chalky and translucent parts in rice grains. Food Chem. 2005, 90, 39–46. [Google Scholar] [CrossRef]
  11. Xi, M.; Wu, W.; Xu, Y.; Zhou, Y.J.; Chen, G.; Ji, Y.L.; Sun, X.Y. Grain chalkiness traits is affected by the synthesis and dynamic accumulation of the storage protein in rice. J. Sci. Food Agric. 2021, 101, 6125–6133. [Google Scholar] [CrossRef]
  12. Deng, F.; Li, Q.; Chen, H.; Zeng, Y.L.; Li, B.; Zhong, X.Y.; Wang, L. Relationship between chalkiness and the structural and thermal properties of rice starch after shading during grain-filling stage. Carbohydr. Polym. 2021, 252, 117212. [Google Scholar] [CrossRef]
  13. Yamakawa, H.; Hirose, T.; Kuroda, M.; Yamaguchi, T. Comprehensive expression profiling of rice grain filling related genes under high temperature using DNA microarray. Plant Physiol. 2007, 144, 258–277. [Google Scholar] [CrossRef] [Green Version]
  14. Guo, T.; Liu, X.L.; Wan, X.Y.; Weng, J.F.; Liu, S.J.; Liu, X.; Chen, M.J.; Li, J.J.; Su, N.; Wu, F.Q.; et al. Identification of a stable quantitative trait locus for percentage grains with white chalkiness in rice (Oryza sativa). J. Integr. Plant Biol. 2011, 53, 598–607. [Google Scholar] [CrossRef]
  15. Song, X.J.; Huang, W.; Shi, M.; Zhu, M.Z.; Lin, H.X. A QTL for rice grain width and weight encodes a previously unknown RING-type E3 ubiquitin ligase. Nat. Genet. 2007, 39, 623–630. [Google Scholar] [CrossRef]
  16. Fujita, N.; Yoshida, M.; Kondo, T.; Saito, K.; Utsumi, Y.; Tokunaga, T.; Nishi, A.; Satoh, H.; Park, J.H.; Jane, J.L.; et al. Characterization of SSllla-deficient mutants of rice: The function of SSIIIa and pleiotropic effects by SSIIIa deficiency in the rice endosperm. Plant Physiol. 2007, 144, 2009–2023. [Google Scholar] [CrossRef] [Green Version]
  17. Kang, H.G.; Park, S.; Matsuoka, M.; An, G. White-core endosperm floury endosperm-4 in rice is generated by knockout mutations in the C-type pyruvate orthophosphate dikinase gene (OsPPDKB). Plant J. 2005, 42, 901–911. [Google Scholar] [CrossRef] [Green Version]
  18. Yang, W.P.; Xu, P.K.; Zhang, J.C.; Zhang, S.; Li, Z.W.; Yang, K.; Chang, X.Y.; Li, Y.B. OsbZIP60-mediated unfolded protein response regulates grain chalkiness in rice. J. Genet. Genom. 2022, 49, 414–426. [Google Scholar] [CrossRef]
  19. Southern, E. Southern blotting. Nat. Protoc. 2006, 1, 518–525. [Google Scholar] [CrossRef]
  20. Mao, H.L.; Sun, S.Y.; Yao, J.L.; Wang, C.G.; Yu, S.B.; Xu, C.G.; Li, X.H.; Zhang, Q.F. Linking differential domain functions of the gs3 protein to natural variation of grain size in rice. Proc. Natl. Acad. Sci. USA 2010, 107, 19579–19584. [Google Scholar] [CrossRef] [Green Version]
  21. Wang, J.C.; Xu, H.; Zhu, Y.; Liu, Q.Q.; Cai, X.L. Osbzip58, a basic leucine zipper transcription factor, regulates starch biosynthesis in rice endosperm. J. Exp. Bot. 2013, 64, 3453–3466. [Google Scholar] [CrossRef]
  22. Fu, F.F.; Xue, H.W. Coexpression analysis identifies rice starch regulator1, a rice ap2/erebp family transcription factor, as a novel rice starch biosynthesis regulator. Plant Physiol. 2010, 154, 927–938. [Google Scholar] [CrossRef]
  23. Huang, X.Z.; Qian, Q.; Liu, Z.B.; Sun, H.Y.; He, S.Y.; Luo, D.; Xia, G.M.; Chu, C.C.; Li, J.Y.; Fu, X.D. Natural variation at the DEP1 locus enhances grain yield in rice. Nat. Genet. 2009, 41, 494–497. [Google Scholar] [CrossRef]
  24. Zhang, X.J.; Wang, J.F.; Huang, J.; Lan, H.X.; Wang, C.L.; Yin, C.F.; Wu, Y.Y.; Tang, H.J.; Qian, Q.; Li, J.Y.; et al. Rare allele of OsPPKL1 associated with grain length causes extra-large grain and a significant yield increase in rice. Proc. Natl. Acad. Sci. USA 2012, 109, 21534–21539. [Google Scholar] [CrossRef] [Green Version]
  25. Ishimaru, K.; Hirotsu, N.; Madoka, Y.; Murakami, N.; Hara, N.; Onodera, H.; Kashiwagi, T.; Ujiie, K.; Shimizu, B.; Onishi, A.; et al. Loss of function of the IAA-glucose hydrolase gene TGW6 enhances rice grain weight and increases yield. Nat. Genet. 2013, 45, 707–711. [Google Scholar] [CrossRef]
  26. Hu, J.; Wang, Y.X.; Fang, Y.X.; Zeng, L.J.; Xu, J.; Yu, H.P.; Shi, Z.Y.; Pan, J.J.; Zhang, D.; Kang, S.J.; et al. A rare allele of GS2 enhances grain size and grain yield in rice. Mol. Plant 2015, 8, 1455–1465. [Google Scholar] [CrossRef] [Green Version]
  27. Liu, J.F.; Chen, J.; Zheng, X.M.; Wu, F.Q.; Lin, Q.B.; Heng, Y.Q.; Tian, P.; Cheng, Z.J.; Yu, X.W.; Zhou, K.N.; et al. GW5 acts in the brassinosteroid signaling pathway to regulate grain width and weight in rice. Nat. Plants 2017, 3, 17043. [Google Scholar] [CrossRef]
  28. Yang, W.S.; Wu, K.; Wang, B.; Liu, S.Y.; Liu, H.H.; Guo, S.Y.; Guo, X.Y.; Luo, W.; Sun, S.Y.; Ouyang, Y.D.; et al. The RING E3 ligase CLG1 targets GS3 for degradation via the endosome pathway to determine grain size in rice. Mol. Plant 2021, 14, 1699–1713. [Google Scholar] [CrossRef]
  29. Wang, Y.H.; Ma, Y.; Lü, B.J.; Xu, E.P.; Huang, Q.; Lai, M. Differential expression of mimecan and thioredoxin domain–containing protein 5 in colorectal adenoma and cancer: A proteomic study. Exp. Biol. Med. 2007, 232, 1152–1159. [Google Scholar] [CrossRef]
  30. Ramírez-Torres, A.; Barceló-Batllori, S.; Martínez-Beamonte, R.; Navarro, M.A.; Surra, J.C.; Arnal, C.; Guillén, N.; Acín, S.; Osada, J. Proteomics and gene expression analyses of squalene-supplemented mice identify microsomal thioredoxindomain-containing protein 5 changes associated with hepatic steatosis. J. Proteom. 2012, 77, 27–39. [Google Scholar] [CrossRef]
  31. Mchale, L.; Tan, X.; Koehl, P.; Michelmore, R.W. Plant NBS-LRR proteins: Adaptable guards. Genome Biology 2006, 7, 212. [Google Scholar] [CrossRef] [PubMed] [Green Version]
  32. Yang, S.H.; Gu, T.T.; Pan, C.Y.; Feng, Z.M.; Ding, J.; Hang, Y.Y.; Chen, J.Q.; Tian, D.C. Genetic variation of NBS-LRR class resistance genes in rice lines. Theor. Appl. Genet. 2008, 116, 165–177. [Google Scholar] [CrossRef]
  33. Smidansky, E.D.; Clancy, M.; Meyer, F.D.; Lanning, S.P.; Blake, N.K.; Talbert, L.E.; Giroux, M.J. Enhanced ADP-glucose pyrophosphorylase activity in wheat endosperm increases seed yield. Proc. Natl. Acad. Sci. USA 2002, 99, 1724–1729. [Google Scholar] [CrossRef] [Green Version]
  34. Kawagoe, Y.; Kubo, A.; Satoh, H.; Takaiwa, F.; Nakamura, Y. Roles of isoamylase and ADP-glucose pyrophosphorylase in starch granule synthesis in rice endosperm. Plant J. 2010, 42, 164–174. [Google Scholar] [CrossRef]
  35. Saripalli, G.; Gupta, P.K. AGPase: Its role in crop productivity with emphasis on heat tolerance in cereals. Theor. Appl. Genet. 2015, 128, 1893–1916. [Google Scholar] [CrossRef]
  36. Lee, S.K.; Hwang, S.K.; Han, M.; Eom, J.S.; Kang, H.G.; Han, Y.; Choi, S.B.; Cho, M.H.; Bhoo, S.H.; An, G.; et al. Identification of the ADP-glucose pyrophosphorylase isoforms essential for starch synthesis in the leaf and seed endosperm of rice (Oryza sativa L.). Plant Mol. Biol. 2007, 65, 531–546. [Google Scholar] [CrossRef]
  37. Li, Y.B.; Fan, C.C.; Xing, Y.Z.; Yun, P.; Luo, L.J.; Yan, B.; Peng, B.; Xie, W.B.; Wang, G.W.; Li, X.H.; et al. Chalk5 encodes a vacuolar H+-translocating pyrophosphatase influencing grain chalkiness in rice. Nat. Genet. 2014, 46, 398–404. [Google Scholar] [CrossRef]
  38. She, K.C.; Kusano, H.; Koizumi, K.; Yamakawa, H.; Hakata, M.; Imamura, T.; Fukuda, M.; Naito, N.; Tsurumaki, Y.; Yaeshima, M.; et al. Novel factor FLOURY ENDOSPERM2 is involved in regulation of rice grain size and starch quality. Plant Cell 2010, 22, 3280–3294. [Google Scholar] [CrossRef] [Green Version]
  39. Kuipers, G.J.; Vreem, J.T.M.; Meyer, H.; Jacobsen, E.; Feenstra, W.J.; Visser, R.G.F. Field evaluation of antisense RNA mediated inhibition of GBSS gene expression in potato. Euphytica 1991, 59, 83–91. [Google Scholar] [CrossRef]
  40. Edwards, A.; Vincken, J.P.; Suurs, L.C.J.M.; Visser, R.G.F.; Zeeman, S.; Smith, A.; Martin, C. Discrete forms of amylose are synthesized by isoforms of GBSSI in pea. Plant Cell 2002, 14, 1767–1785. [Google Scholar] [CrossRef] [Green Version]
  41. Burton, R.A.; Jenner, H.; Carrangis, L.; Fahy, B.; Fincher, G.B.; Hylton, C.; Laurie, D.A.; Parker, M.; Waite, D.; Wegen, S.V.; et al. Starch granule initiation and growth are altered in barley mutants that lack isoamylase activity. Plant J. 2002, 31, 97–112. [Google Scholar] [CrossRef] [PubMed]
  42. Kubo, A.; Myers, A.M. Functions of heteromeric and homomeric isoamylase-type starch-debranching enzymes in developing maize endosperm. Plant Physiol. 2010, 153, 956–969. [Google Scholar] [CrossRef] [PubMed] [Green Version]
  43. Wattebled, F.; Dong, Y.; Dume, S.; Delvallé, D.; Planchot, V.; Berbezy, P.; Vyas, D.; Colonna, P.; Chatterjee, M.; Ball, S.; et al. Mutants of Arabidopsis lacking a chloroplastic isoamylase accumulate phytoglycogen and an abnormal form of amylopectin. Plant Physiol. 2005, 138, 184–195. [Google Scholar] [CrossRef] [PubMed] [Green Version]
Figure 1. Phenotypes of transgenic rice plants. (A) Seed morphologies of T1 transgenic rice. WT = wild-type plants (‘Zhonghua 11’), bzip22 = normal transgenic rice plants of ZmbZIP22. Bar = 1 mm. (B) Co-segregation analysis of the grain size using T2 m-1a transgenic seeds. 1–24 = T2 m-1a transgenic seeds. Red dotted lines represent the size mean of wide-type seeds.
Agronomy 12 01706 g001
Figure 2. Phenotype analysis of T3 m-1a plants. (I) Different phenotypes: (a) panicles, (b) hulls, (c) stamens, (d) pistils and (e) glume hairs. (II) Developmental stages of T3 seeds. WT = wild-type plants (‘Zhonghua 11’). Bars = 1 mm.
Agronomy 12 01706 g002
Figure 3. Comparison of the size of apiculus in m-1a and wild-type rice. (I) Comparison of grain length and width. (II) Comparison of apiculus length. (II) Comparison of 1000-seed weight. C1–3 = m-1a plants; WT = wild-type plants (‘Zhonghua 11’). Values represent the mean ± SD of triplicates. The asterisks indicate that the correlation coefficients were significantly different (* p < 0.05, ** p < 0.01).
Agronomy 12 01706 g003
Figure 4. Comparison of the structures in m-1a and wild-type seeds. (a) Skin structure of brown rice grains in the light. (b) Cross-sections of brown rice grains in the light. (c) Skin structure of brown rice grains in transmission light. (d) Cross-sections of brown rice grains in transmission light. (I) Cross-sections of brown rice grains in scanning electron microscopy images. (II) Starch structure of endosperm center in scanning electron microscopy images. (ad) Bar = 1 mm. (I) Bar = 1 mm. (II) Bar = 20 μm. WT = wild-type plants (‘Zhonghua 11’).
Agronomy 12 01706 g004
Figure 5. Comparison of the amylose and starch contents in m-1a rice and wild-type seeds. (I) Comparison of the amylose contents. (II) Comparison of the starch contents. 1–3 = m-1a rice plants. (WT = wild-type plants (‘Zhonghua 11’). Values represent the mean ± SD of triplicates. The asterisks indicate that the correlation coefficients were highly significantly different (* p < 0.05, ** p < 0.01).
Agronomy 12 01706 g005
Figure 6. Accurate insertion location positioning of m-1a strain. Chr11 = chromosome 11; M = Mega base pair.
Agronomy 12 01706 g006
Figure 7. Expression profiles of 18 rice starch synthesis genes during development of Zhonghua 11 (wild-type) and the m-1a strain. The gene expression in the 3-d endosperm of wild-type rice was used as a control. d = days after pollination; WT = wild type. Values represent the mean ± SD of triplicates.
Agronomy 12 01706 g007
Figure 8. Expression profiles of 3 rice genes during development of Zhonghua 11 (wild type) and the m-1a strain. The gene expression in the 3-d endosperm of wild-type rice was used as a control. d = days after pollination; WT = wild type. Values represent the mean ± SD of triplicates.
Agronomy 12 01706 g008
Publisher’s Note: MDPI stays neutral with regard to jurisdictional claims in published maps and institutional affiliations.

