Article

Optimized Phosphorus Application Alleviated Adverse Effects of Short-Term Low-Temperature Stress in Winter Wheat by Enhancing Photosynthesis and Improved Accumulation and Partitioning of Dry Matter

1
School of Agronomy, Anhui Agricultural University, Hefei 230036, China
2
Jiangsu Collaborative Innovation Centre for Modern Crop Production, Nanjing 210095, China
*
Authors to whom correspondence should be addressed.
Agronomy 2022, 12(7), 1700; https://doi.org/10.3390/agronomy12071700
Submission received: 19 June 2022 / Revised: 13 July 2022 / Accepted: 15 July 2022 / Published: 18 July 2022

Abstract

:
Low-temperature stress has become an important abiotic factor affecting high and stable wheat production. Therefore, it is necessary to take appropriate measures to enhance low-temperature tolerance in wheat. A pot experiment was carried out using Yannong19 (YN19, a cold-tolerant cultivar) and Xinmai26 (XM26, a cold-sensitive cultivar). We employed traditional phosphorus application (TPA, i.e., R1) and optimized phosphorus application (OPA, i.e., R2) methods. Plants undertook chilling (T1 at 4 °C) and freezing treatment (T2 at −4 °C) as well as ambient temperature (CK at 11 °C) during the anther differentiation period to investigate the effects of OPA and TPA on photosynthetic parameters and the accumulation and distribution of dry matter. The net photosynthetic rate (Pn), stomatal conductance (Gs) and transpiration rate (Tr) of flag leaves decreased in low-temperature treatments, whereas intercellular carbon dioxide concentration (Ci) increased. Compared with R1CK, Pn in R1T1 and R1T2 treatments was reduced by 26.8% and 42.2% in YN19 and 34.2% and 54.7% in XM26, respectively. In contrast, it increased by 6.5%, 8.9% and 12.7% in YN19 and 7.7%, 15.6% and 22.6% in XM26 for R2CK, R2T1 and R2T2 treatments, respectively, under OPA compared with TPA at the same temperature treatments. Moreover, low-temperature stress reduced dry matter accumulation at the reproductive growth stage. OPA increased dry matter accumulation of vegetative organs after the flowering stage and promoted the transportation of assimilates to grains. Hence, the grain number per spike (GNPS), 1000-grain weight (TGW) and yield per plant (YPP) increased. The low-temperature treatments of T1 and T2 caused yield losses of 24.1~64.1%, and the yield increased by 8.6~20.5% under OPA treatments among the two wheat cultivars. In brief, OPA enhances low-temperature tolerance in wheat, effectively improves wheat architecture and photosynthesis, increases GNPS and TGW and ultimately lessens yield losses.

1. Introduction

Temperature is the primary abiotic factor affecting the growth of wheat and other crops [1]. Nowadays, several studies are being carried out on climate change and global warming, which impose abiotic stress on crops [2]. Low-temperature events’ intensity, frequency and duration are increasing due to global warming [3,4]. As spring approaches, wheat’s sensitivity to cold and the risk of low-temperature stress also increase [5]. Recently, low-temperature stress has caused considerable losses to wheat producers [6,7].
Many studies have shown that the most sensitive period of low temperature in wheat is from the jointing to booting stages [8,9]. When wheat enters the vegetative to reproductive phase, low-temperature stress causes severe damage to young spikes, which affects subsequent grain filling and fruiting [10]. Photosynthesis is one of the crops’ most sensitive physiological processes influenced by low temperature [11,12]. The photosynthetic capacity of wheat drastically decreases with the reduction in net photosynthetic rate and photosynthetic area, leading to reduced biomass accumulation and lowered grain yield [13]. Under low-temperature stress, the enzymatic activities associated with photosynthetic carbon assimilation were severely disrupted, leading to the Calvin cycle’s obstruction and the diminished rate of photosynthesis [11,14]. Low-temperature stress results in the yellowing of leaves and, in severe cases, permanent leaf wilting takes place, leading to the temporary or permanent restriction of photosynthesis [15]. With the extension of treatment time and the decrease of temperature, the net photosynthetic rate of wheat leaves decreased gradually and recovered slowly within 7~15 days after freezing treatment [5]. The structure and function of wheat flag leaves were seriously damaged when the temperature was below −5 °C [16].
The grain number per spike (GNPS) and 1000-grain weight (TGW) of wheat significantly decreased when it was subjected to low-temperature stress at the jointing and booting stages [17]. The decrease in GNPS was the primary reason for wheat yield decline. Studies revealed that low-temperature stress at the booting stage causes pollen sterility, poor spikelets setting and the yield to be reduced up to 50% [9,18]. This severe reduction is due to the low-temperature induced excessive accumulation of reactive oxygen species, which leads to pollen abortion, anther inactivation and decreased GNPS [11,19]. Moreover, under low-temperature stress, an imbalanced source–sink relationship reduces assimilates’ accumulation and transportation to spike, resulting in a significant decrease in GNPS and TGW [6].
As an essential nutrient in plants, phosphorus plays an important role in various metabolic activities and biological pathways [20,21]. Previously, plenty of studies showed that phosphorus could improve the stress resistance of horticultural crops and field crops [22,23]. Phosphorus application effectively improves the soil–plant nutrition relationship, ensures source–sink balance, strengthens membrane stability and alleviates dehydration and oxidation stress caused by abiotic stress such as low-temperature [6,24]. Under water deficit stress, the positive effects of phosphorus were reflected in improving the growth and phenolic compounds in the root [25]. Furthermore, it is good to enhance the antioxidant enzymatic activities in crop plants and reduce malondialdehyde content using microbial phosphorus [26]. In the reproductive growth stage of plants, senescent leaves are the primary source of nutrients for bank tissues, and the reactivation of phosphorus is beneficial for plants to obtain sufficient nutrients and maintain metabolic balance [27].
Previous studies comprehensively revealed the harm of low-temperature stress on wheat and the alleviating mechanism of phosphorus but lacked in quantitative analysis of phosphorus’s role under low-temperature stress. In the present study, controlled phytotron experiments were conducted using two winter wheat cultivars with different cold sensitivities under different low-temperature treatments and different methods of phosphorus application during the anther differentiation period. This study aimed to (1) analyze the effects of optimized phosphorus application (OPA) on the photosynthetic performance of wheat flag leaves under low-temperature stress, (2) quantify the effects of OPA on dry matter accumulation, transportation and its distribution under low-temperature stress and (3) compute the effects of OPA on wheat yield and its components under low-temperature stress.

2. Materials and Methods

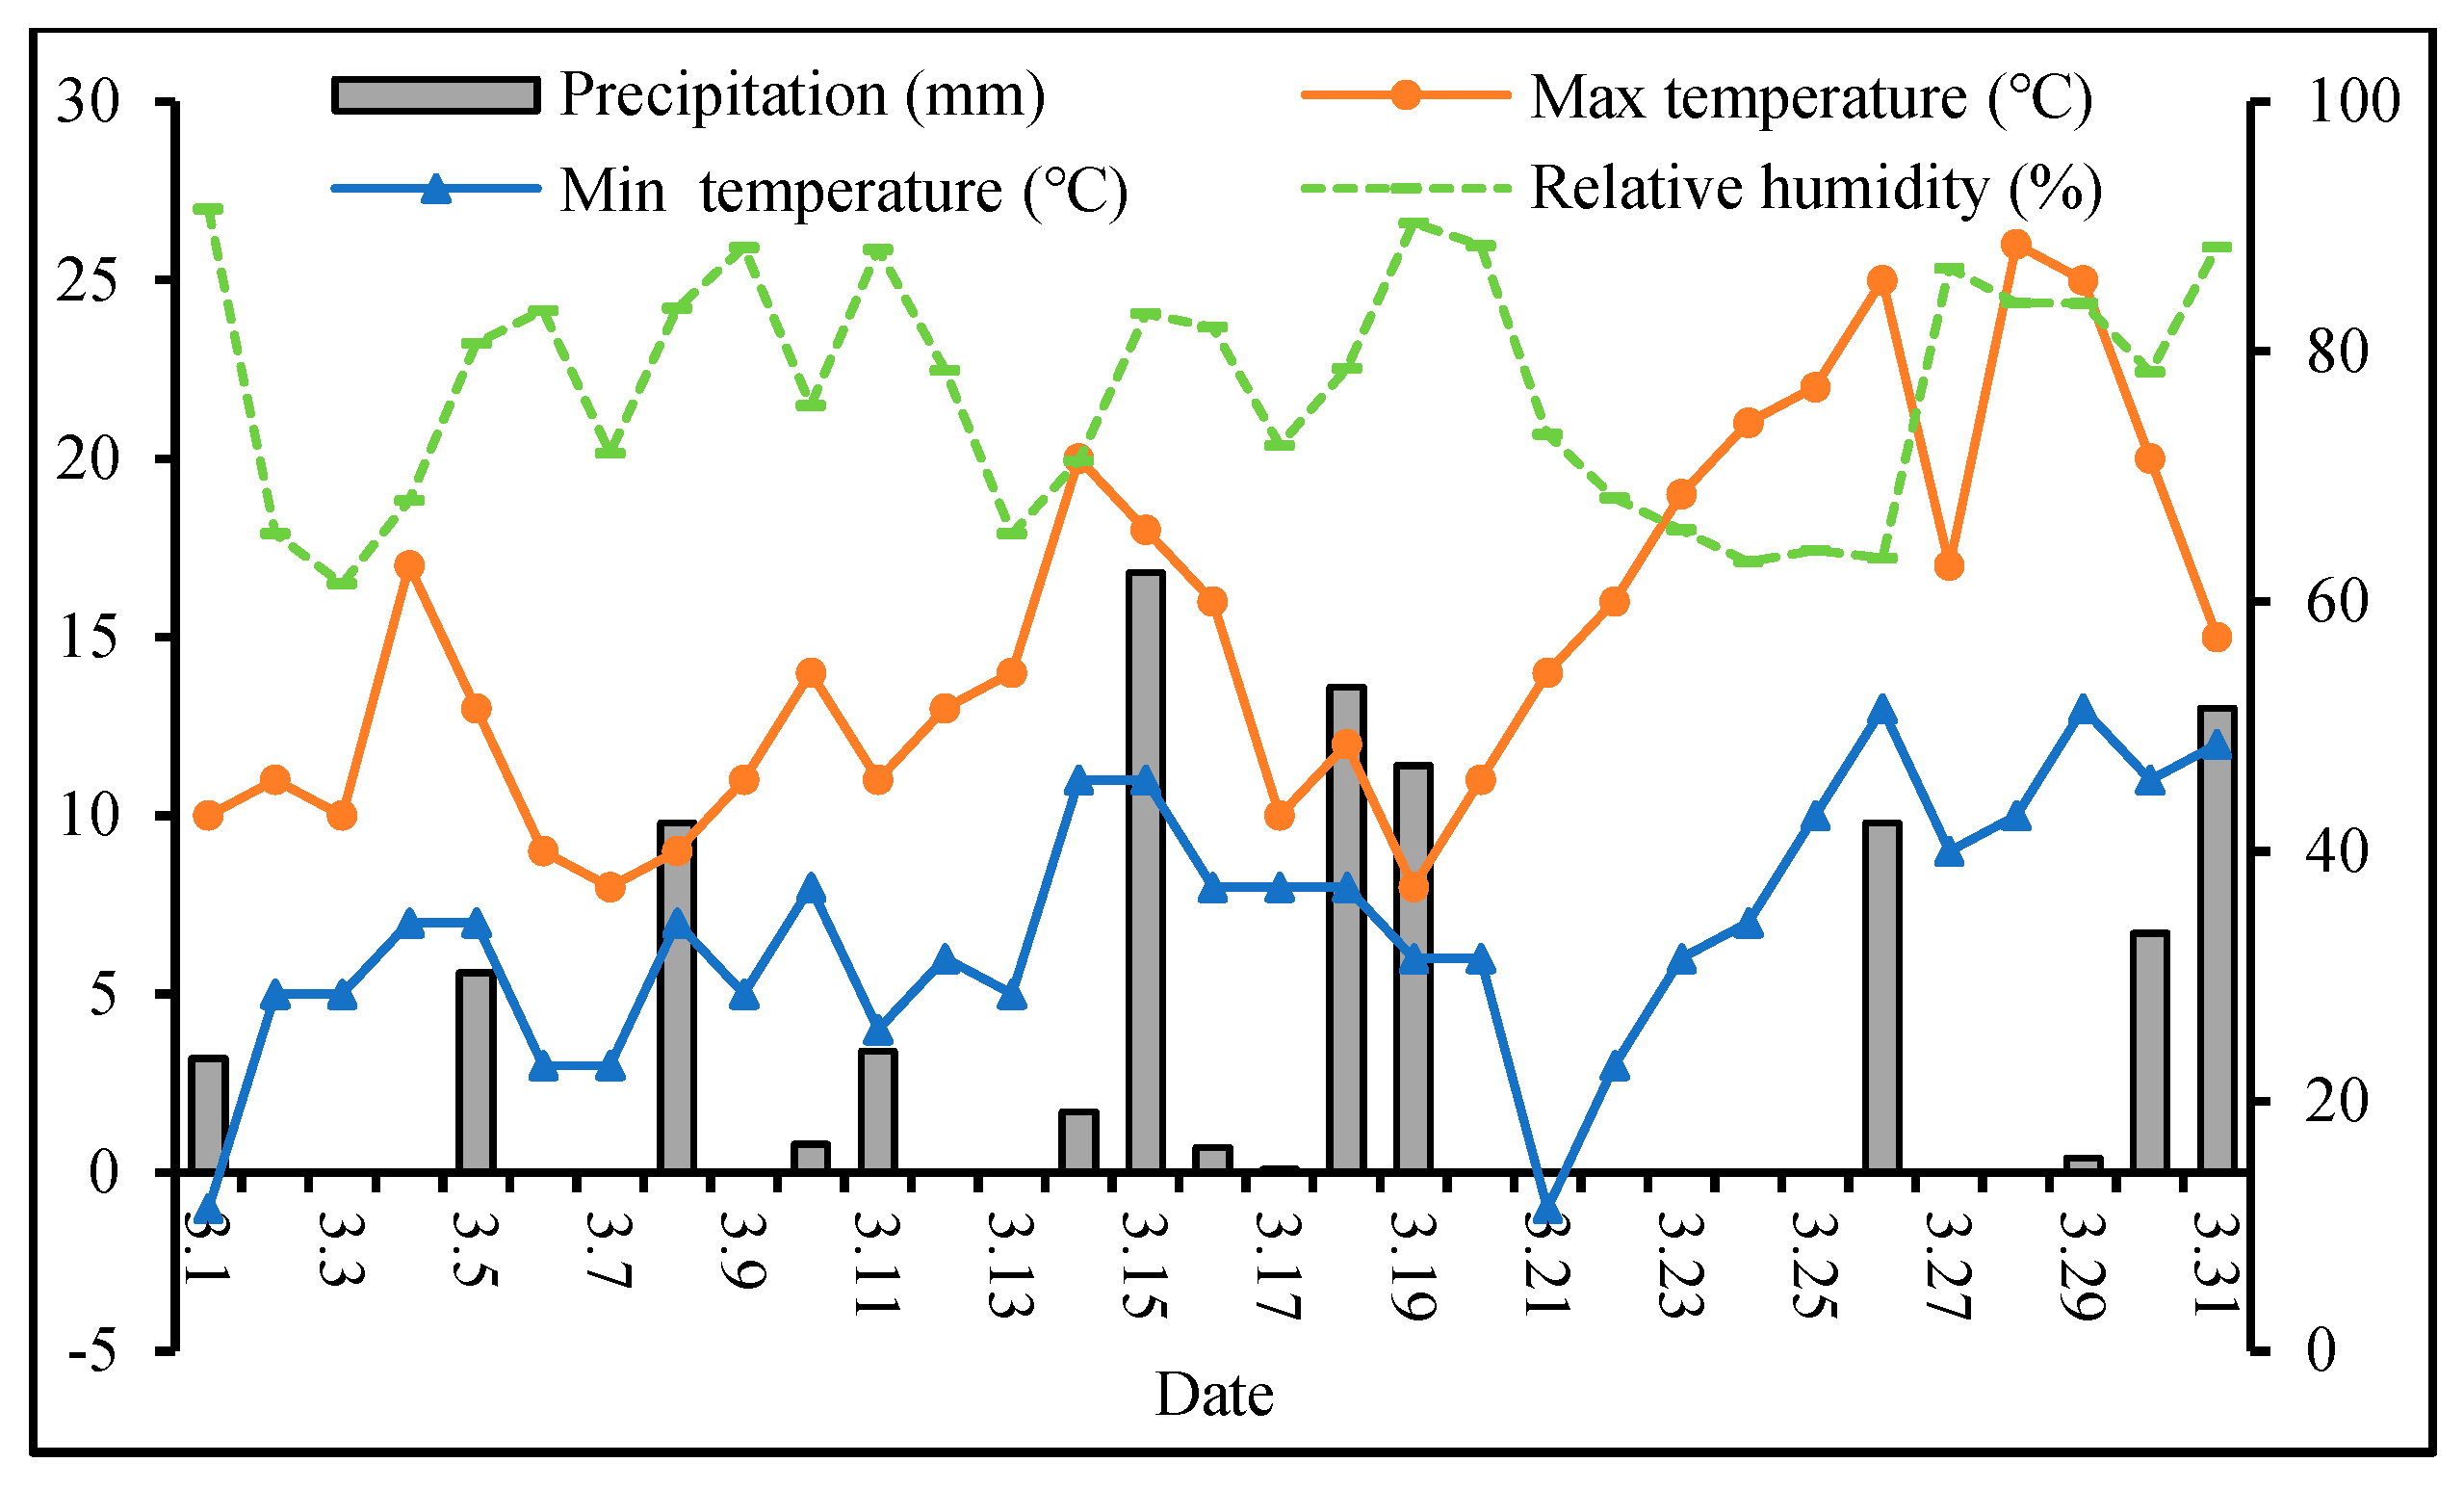
2.1. Experimental Design

This experiment was conducted in 2020–2021 in the Agricultural Extraction Garden of Anhui Agricultural University (31°86′ N, 117°26′ E; 30 m altitude) in Hefei, Anhui Province, China. This location has a humid monsoon climate in the northern subtropics. From 2016 to 2020, low-temperature events were frequent in March (Figure S1). Additionally, the wheat growing season is from November to May of the following year. The winter wheat cultivars Yannong19 (YN19, cold-tolerant) and Xinmai26 (XM26, cold-sensitive) were used for the experimentation. Wheat cultivars were sown in pots with a diameter of 26 cm and a height of 35 cm on 1 November 2020. Every pot was filled with 10 kg of soil before sowing, and then 3 cm of soil were covered on the wheat seeds after sowing.
Potting soil was taken from the 0~20 cm tillage layer with an organic matter content of 16.3 g kg−1 and available nitrogen, phosphorus and potassium contents of 112.2, 23.0 and 161.6 mg kg−1, respectively. In the whole growth period, 1.8 g urea (base application 1.2 g + top application 0.6 g at jointing stage) and 1.7 g potassium sulfate (one-off base application) were applied to each pot of wheat. The method of phosphorus application (MPA) was divided into traditional phosphorus application (TPA, R1: 5 g superphosphate for base application) and optimized phosphorus application (OPA, R2: base application 2.5 g + top application 2.5 g at jointing stage). There were 144 pots for two cultivars, i.e., 12 pots were planted in each treatment of YN19 and XM26 (Table 1). All the pots were buried in the soil, and the upper edge of the basin was flushed with the floor. Eighteen seeds were planted in each pot, and nine seedlings were maintained at the three-leaf stage.

2.2. Sampling and Measurement

2.2.1. Plant Morphology

Plant height and tillers number were measured at the booting stage (BS i.e., 3.29), flowering stage (FS, i.e., 13 April), grain-filling stage (GS, i.e., 29 April) and maturity stage (MS, i.e., 21 May), respectively. Similarly, leaf areas per plant were also measured at booting, flowering and grain-filling stages. Plant height and leaf areas were measured with a steel ruler of 1 m and a plastic ruler of 30 cm, respectively. The length (L) and max-width (W) of green leaves were measured to calculate the leaf area (LA): LA = 0.75 × L × W. Nine wheat plants in each pot were randomly chosen at each stage to measure the morphological indicators, and the average value of three plants was used as one replication.

2.2.2. Determination of Photosynthetic Parameters

A Li-6400 (LI-COR, Lincoln, NE, USA) portable photosynthetic measurement system was used to measure the net photosynthetic rate (Pn), stomatal conductance (Gs), intercellular carbon dioxide concentration (Ci) and transpiration rate (Tr) of flag leaves in the main stem at flowering and grain-filling stages, respectively. During the test, the leaf chamber of the red and blue light sources was used, and the photosynthetically active radiation was set at 1100 μmol·m−2·s−1. Three randomly selected flag leaves of the main stem were used to measure the photosynthetic traits in each treatment.

2.2.3. Dry Matter Accumulation, Translocation, and Distribution

The samples with measured morphological traits were put into a constant temperature air dryer (DHG-240L; Hefei Youke Instrument Equipment Co., Ltd., Hefei, China) and placed at 105 °C for 30 min, then dried at 75 °C to obtain constant weight. Wheat plants were divided into three parts at the flowering stage: spikes, stems + sheaths and leaves, and at the maturity stage, they were divided into four parts: grains, spike axis + glumes, stems + sheaths and leaves. Dry matter was weighed using a digital balance with an accuracy of 0.0001 g (ME204E/02; Shanghai Mettler Toledo Instrument Co., Ltd., Shanghai, China). Moreover, the following parameters related to dry matter accumulation and remobilization within the wheat plants during grain filling were calculated:
(1)
Dry matter transportation of vegetative organs before flowering stage (DMT) = Dry matter of vegetative organs at the flowering stage—dry matter of vegetative organs at maturity stage (g).
(2)
Proportion of dry matter transportation of vegetative organs before flowering stage (%) (PDMT) = (DMT/dry matter of vegetative organs at the flowering stage) × 100%.
(3)
Contribution of dry matter transportation of vegetative organs before the flowering stage to dry matter of grains (%) (CDMT) = (DMT/dry matter of grains at maturity stage) × 100%.
(4)
Dry matter accumulation of vegetative organs after flowering stage (DMAA) = Dry matter of grains at maturity stage—DMT (g).
(5)
Contribution of dry matter after flowering stage to dry matter of grains (%) (CDMAA) = (DMAA/dry matter of grains at maturity stage) × 100%.

2.2.4. Grain Yield Components

At the maturity stage, three wheat plants were randomly selected from each pot to investigate the grain number per spike (GNPS), spike number per plant (SNPP), 1000-grain weight (TGW) and the yield per plant (YPP = SNPP × GNPS × TGW).

2.3. Statistical Analysis

Microsoft Excel (version 2016; Microsoft, Inc., Redmond, WA, USA) was used to sort data, figures and tables. Comparisons were made using one-way ANOVA using SPSS statistical software (version 19; SPSS, Inc., Chicago, IL, USA). Statistical divergence among treatments was determined using Tukey’s honestly significant difference (HSD) test. Correlation tests were calculated using Pearson’s correlation coefficient. The data were expressed as mean ± standard error (SE) triplicates.

3. Results

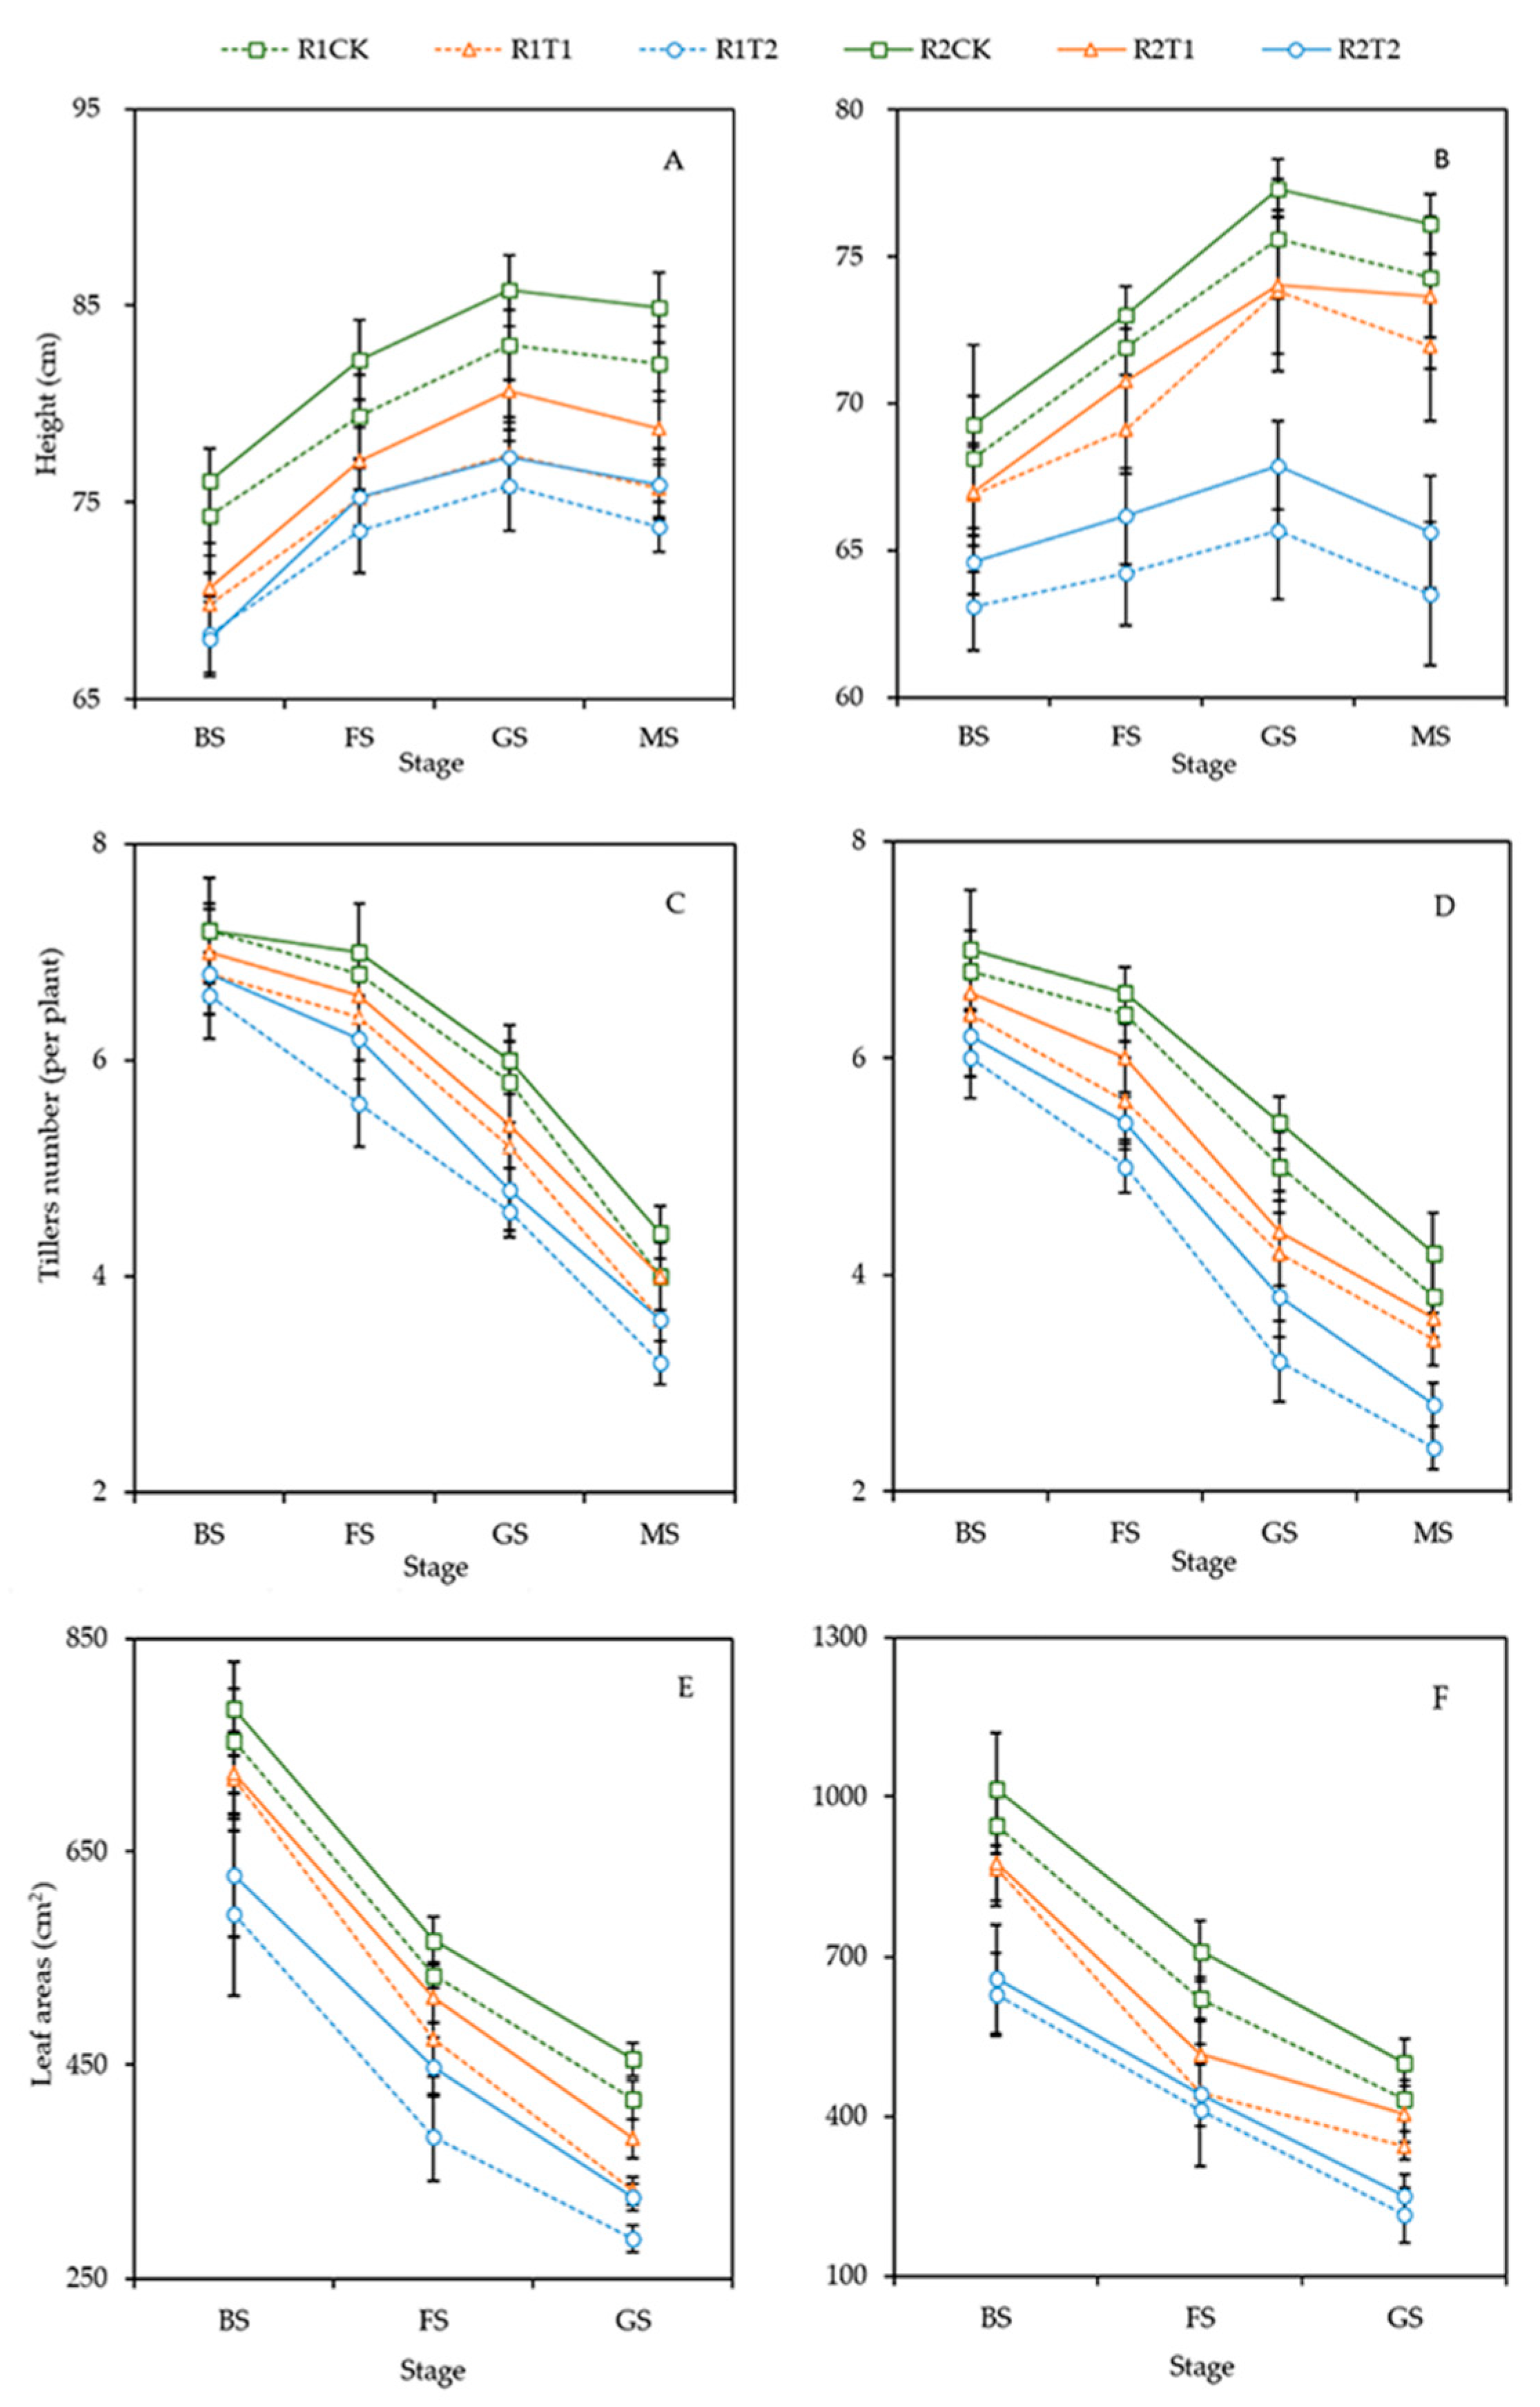
3.1. Plant Morphology

With the advancement of the growth stages, the plant height of YN19 and XM26 increased first, then decreased from the booting stage to the maturity stage and reached the maximum at the grain-filling stage, whereas the tillers number and leaf areas per plant decreased after the booting stage (Figure 2). Low-temperature stress resulted in reduced plant height, tiller number and leaf areas, and no significant difference was observed between the treatments at the booting and flowering stages. Compared with R1CK, the plant height of YN19 in R1T1 and R2T2 decreased by 7.8% and 10.1% at the maturity stage, respectively; whereas plant height increased by 3.4%, 4.1% and 2.8% in R2CK, R2T1 and R2T2 under OPA, compared with TPA at the same temperature levels, respectively. After low-temperature treatments, the plant height of XM26 in R1T1 and R1T2 decreased by 3.2% and 14.5% in R1CK, respectively; then it increased by 2.4%, 2.4% and 3.3% in R2CK, R2T1 and R2T2 under OPA, compared with the same temperature treatments under TPA, respectively. At the maturity stage in R1T1 and R1T2 treatments, the tiller number decreased by 10.0%~20.0% in YN19 and 10.5%~36.8% in XM26, respectively, compared with R1CK; while 10.0%, 11.0%, 12.5%, 10.5%, 5.9% and 16.7% increases in R2CK, R2T1 and R2T2 were observed in YN19 and XM26, respectively, under OPA, compared with the same temperature treatments under TPA. Additionally, the leaf areas per plant of the two cultivars were the highest in R2CK, significantly higher than those of T2. The leaf area per plant decreased by 20.5~31.3% in YN19 and 20.0~50.3% in XM26, respectively, after low-temperature treatment under TPA compared with R1CK; under OPA, it was increased by 9.0~14.9% in YN19 and 13.6~17.4% in XM26, respectively (Figure 2).
Thus, low-temperature treatments diminished the plant morphological traits in two cultivars, especially for XM26 in T2 treatment, and OPA alleviated the damage of low-temperature stress.

3.2. Photosynthetic Parameters

At the flowering stage, except for YNR2T1, the Pn of the low-temperature treatments among two wheat cultivars was significantly lower than that of CK. The Pn of T1 and T2 decreased by 19.1~33.1% in YN19 and 25.9~40.1% in XM26, respectively, under TPA, whereas it increased by 5.2~16.2% and 3.6~18.2%, respectively, under OPA treatment. At the grain-filling stage, the Pn in the ambient temperature was significantly higher than that in low-temperature treatments, which in T1 treatment was significantly higher than T2. However, no significant difference was found among the treatments at the same temperature. Compared with R1CK, the Pn of YN19 in the R1T1 and R1T2 treatment was reduced by 26.8% and 42.2%, respectively; it increased by 6.5%, 8.9% and 12.7% in the treatments of R2CK, R2T1 and R2T2, respectively, under OPA compared with those under TPA at the same temperature treatments. The Pn of XM26 under TPA was reduced by 34.2~54.7% after low-temperature treatment and increased by 7.7~22.6% under OPA treatments compared with TPA treatments (Table 2).
The Gs of two cultivars at the flowering stage was higher than that at the grain-filling stage in the same treatment. After low-temperature treatment, the Gs of the two cultivars except for YNR2T1 decreased significantly compared with ambient temperature treatment. Compared with R1CK at the grain-filling stage, the Gs in R1T1 and R1T2 decreased by 32.1~51.5% in YN19 and 31.1~54.6% in XM26, respectively, while it was increased by 8.2~15.4% and 5.9~22.2%, respectively, under OPA in the same temperature treatments (Table 2).
At the flowering and grain-filling stages, the Ci of the T2 treatment was significantly lower than CK, while there was no significant difference between T1 and T2 treatments between the two cultivars. At the grain-filling stage, the Ci of T1 and T2 under TPA treatment increased by 14.2% and 39.5% in YN19 and 20.2% and 41.3% in XM26, respectively. Compared with TPA, Ci decreased in the treatment of OPA by 4.2~7.7% in YN19 and 5.4~7.2% in XM26, respectively (Table 2).
At the flowering and grain-filling stages, Tr in the T2 treatment of YN19 was significantly lower than that of CK, and that of XM26 decreased significantly with the increase of low-temperature intensity. Compared with R1CK at the grain-filling stage, the Tr of R1T1 and R1T2 decreased by 19.1~27.8% in YN19 and 18.9~44.2% in XM26, respectively; whereas under OPA, the Tr increased by 5.1~6.3% in YN19 and 7.7~12.1% in XM26, respectively, compared with TPA at the same temperature treatments (Table 2).
It is shown in Table 2, with the increasing low-temperature and advancement of the growth stage, Pn, Gs and Tr showed a decreasing trend, whereas Ci took a different direction. The stronger the low-temperature intensity, the better the effect of OPA. Furthermore, the effect of OPA on XM26 was better than that of YN19. However, the reduction degree for the Ci of XM26 under T2 treatment was lower than that of YN19, which may be attributed to its sensitivity toward low-temperature stress and the irreversible damage of XM26 at −4 °C. In brief, OPA was beneficial in improving the photosynthesis of wheat leaves after low-temperature treatment.

3.3. Dry Matter

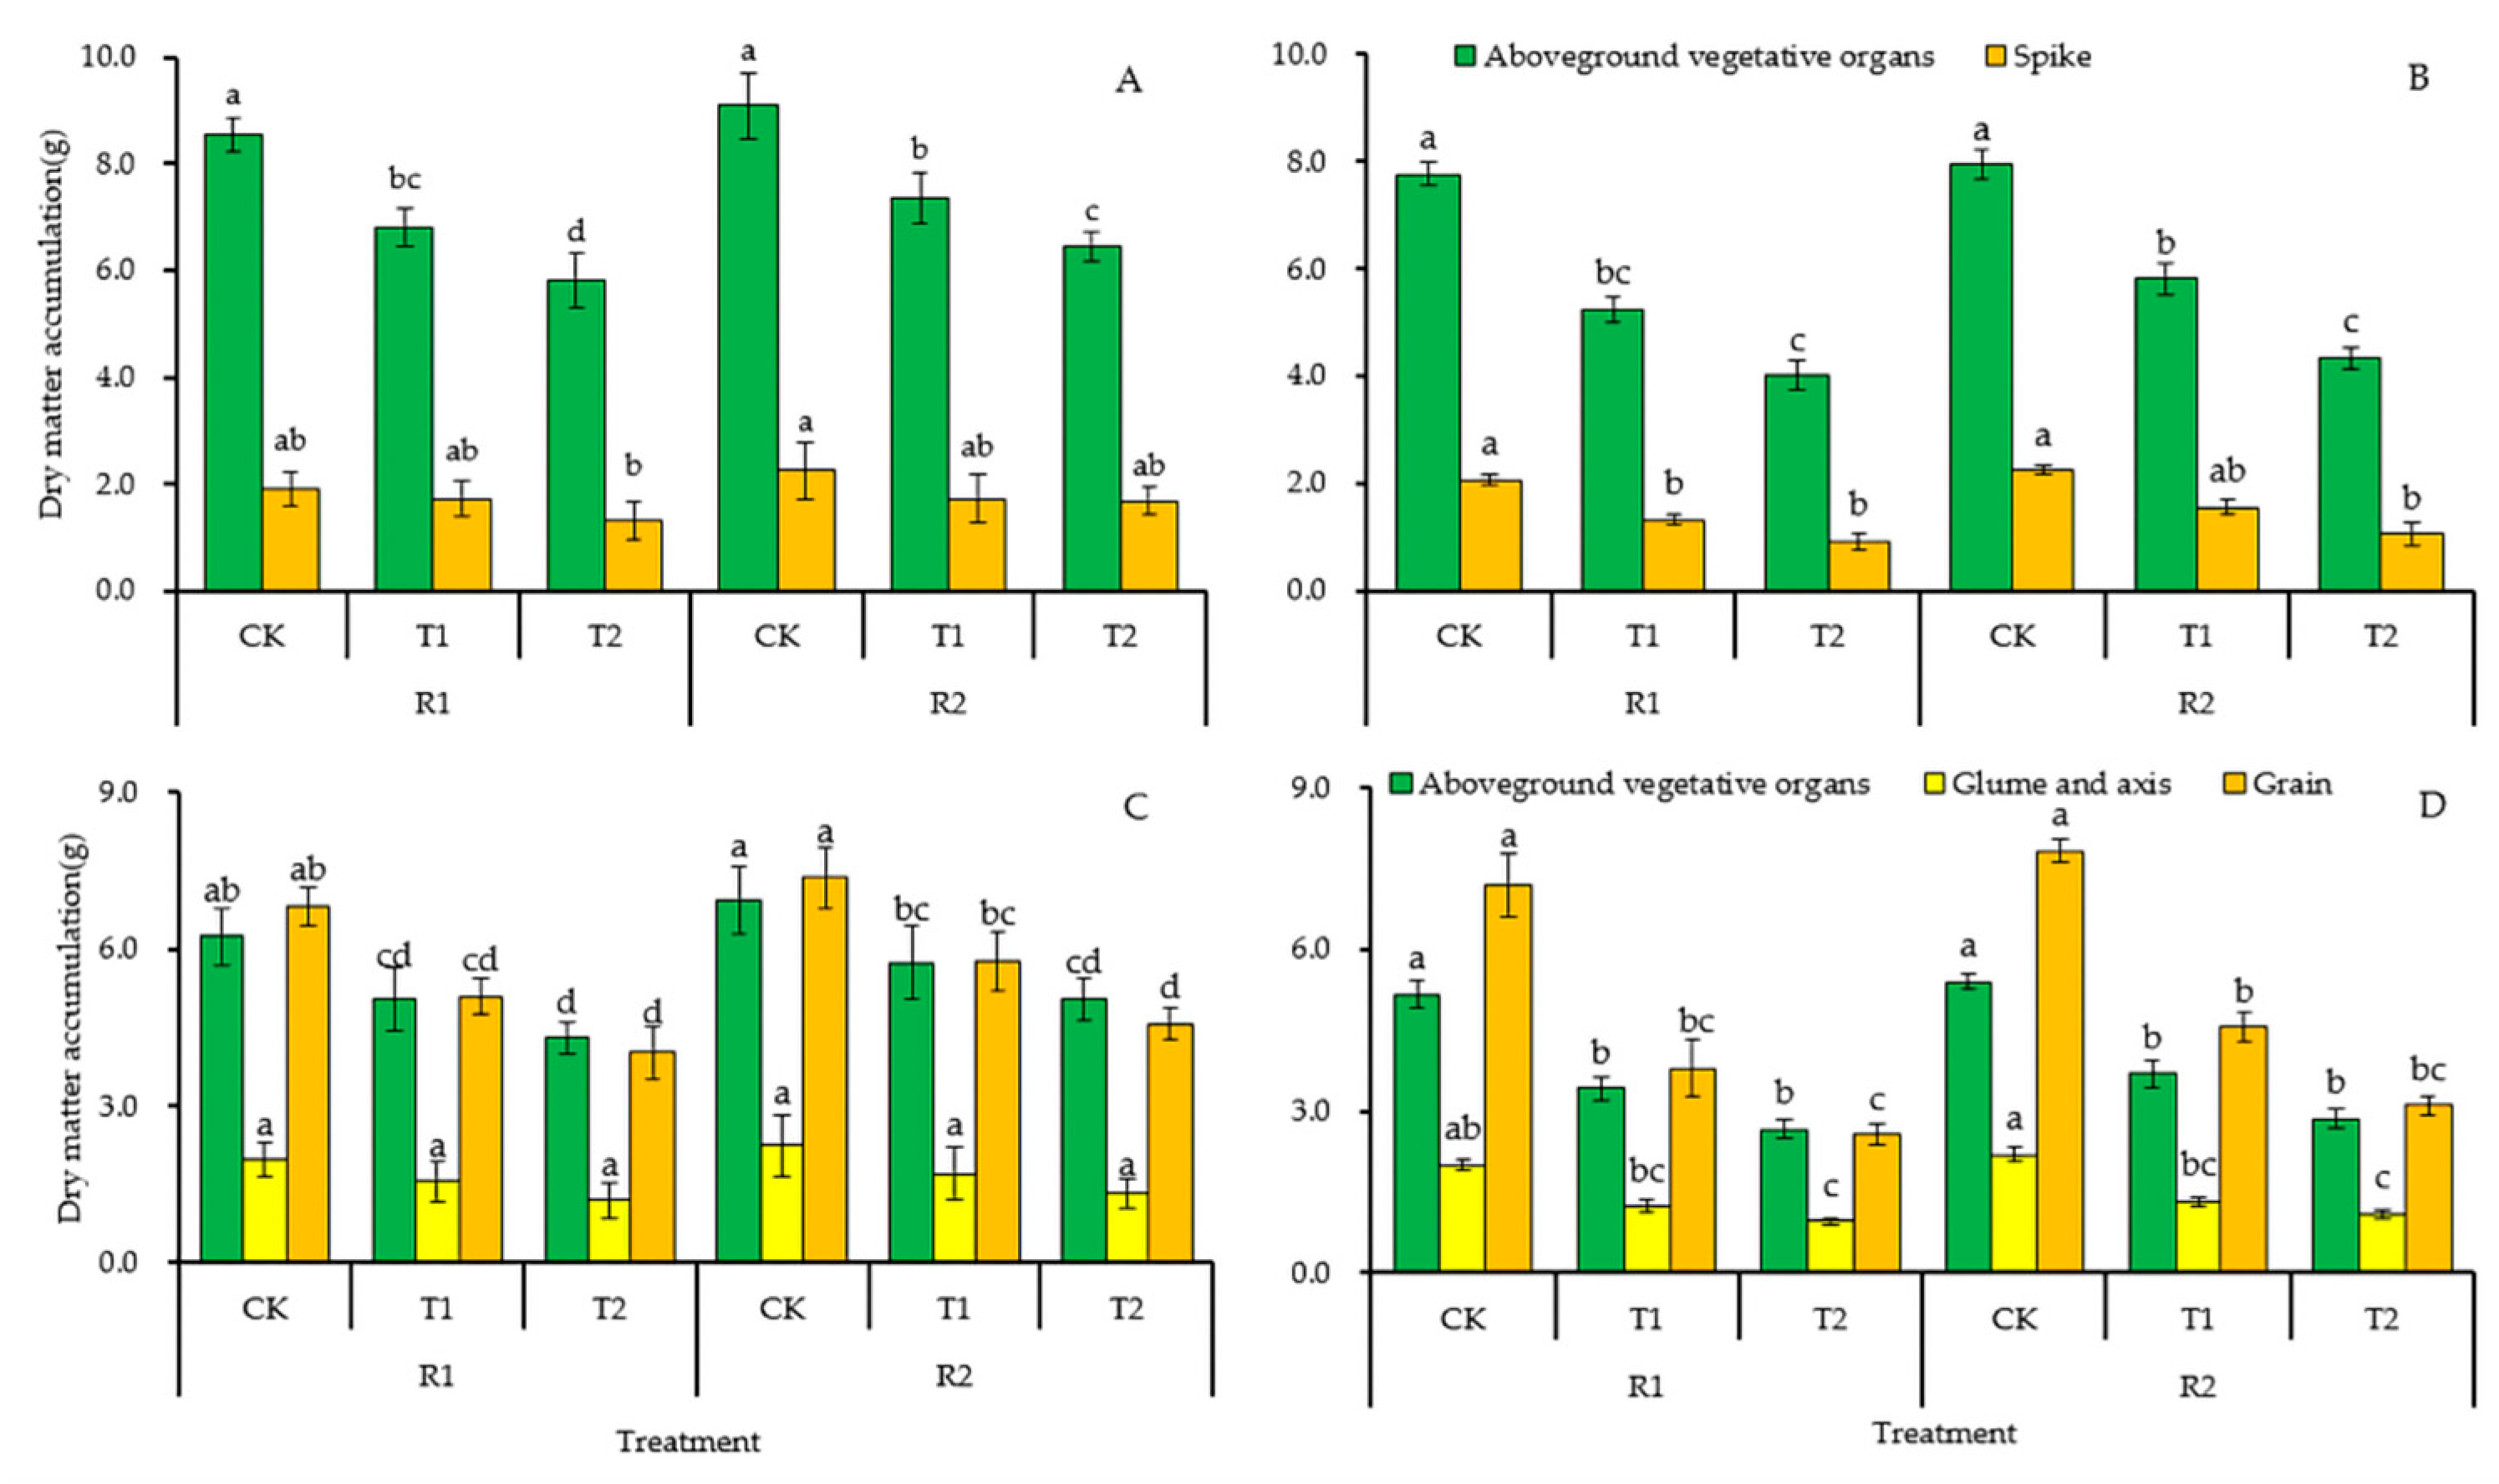
3.3.1. Dry Matter Accumulation

Dry matter accumulation showed an upward trend from the booting to maturity stage, while dry matter accumulation decreased with increasing low-temperature stress (Table 3). Low temperature had no significant effect on the dry matter accumulation of YN19 but significantly reduced the dry matter accumulation of XM26 at the booting stage. With the gradual decrease in low temperature, dry matter accumulation in T2 treatment showed a significant downward trend in two cultivars at the flowering and grain-filling stage. At the maturity stage, dry matter accumulation in the R1T1 and R1T2 treatments decreased by 22.1~36.6% in YN19 and 41.1~56.9% in XM26, respectively, compared with R1CK; while it increased by 10.1~14.8% in YN19 and 7.4~13.9% in XM26, respectively, under OPA compared with TPA in the same temperature treatments.

3.3.2. Dry Matter Accumulation in Different Wheat Organs

With the extension of low-temperature stress, the accumulation of aboveground vegetative organs showed a significant decreasing trend in both cultivars at the flowering stage. The dry matter accumulation in the spikes of YN19 decreased, but there was no significant difference among treatments. In XM26, the dry matter accumulation under T2 treatment was significantly lower than that under ambient temperature. Moreover, dry matter accumulation in T1 and T2 treatments was reduced by 20.4~32.0% in YN19 and 32.6~48.5% in XM26, respectively, under TPA after low-temperature treatments; dry matter accumulation increased by 6.3~11.2% in YN19 and 2.2~10.9% in XM26, respectively, under OPA with the same temperature treatments compared with TPA (Figure 3A,B).
The dry matter accumulation in aboveground vegetative organs, spike axis + glumes and grains of two cultivars decreased with the extension of low-temperature stress (Figure 3C,D). The dry matter accumulation in aboveground vegetative organs significantly decreased after low-temperature treatments, but there was no significant difference between T1 and T2 treatments among the two cultivars. The grain dry matter accumulation trend was similar to that of aboveground vegetative organs. At the maturity stage, compared with R1CK, dry matter accumulation of R1T1 and R2T2 in aboveground vegetative organs was reduced by 19.2~31.3% in YN19 and 33.7~48.4% in XM26, respectively; however, it increased by 11.2~17.5% in YN19 and 4.4~7.9% in XM26, respectively, under the treatments of OPA with the same temperature treatments compared with TPA. Compared with R1CK, the dry matter accumulation of spike axis + glumes of R1T1 and R2T2 decreased by 20.4~38.8% in YN19 and 38.0~51.5% in XM26, respectively; it increased by 8.3~14.3% in YN19 and 8.1~12.4% in XM26, respectively, under the treatments of OPA with the same temperature treatments compared with TPA. In addition, grain dry matter accumulation in T1 and T2 decreased by 25.1~41.0% in YN19 and 47.1~64.3% in XM26, respectively, under TPA compared with CK; it increased by 7.9~13.7% in YN19 and 8.9~21.0% in XM26, respectively, under OPA with the same temperature treatments compared with TPA.

3.3.3. Dry Matter Redistribution in Wheat

The DMAA and CDMAA of the two cultivars showed a downward trend, while CDMT exhibited an upward trend with the extension of low-temperature treatment. The DMAA of T1 and T2 decreased by 26.4~44.6% in YN19 and 56.4~73.0% in XM26 under TPA, respectively, while it increased by 15.3~26.0% in YN19 and 15.5~31.5% in XM26 under OPA with the same temperature treatments compared with TPA, respectively. Furthermore, CDMAA was reduced by 1.5~6.0% in YN19 and 18.9~24.4% in XM26 under OPA after low-temperature treatment, respectively, while it increased by 6.9~10.5% in YN19 and 2.8~6.4% in XM26 under OPA with the same temperature treatments compared with TPA, respectively (Table 4).

3.4. Yield and Yield Components

In general, low-temperature stress in T1 had no significant effect on the YPP of YN19 but resulted in a substantial decrease in the YPP of XM26. In addition, the YPP at T2 treatment was significantly lower than that at ambient temperature between the two cultivars, and there was no significant difference between T1 and T2. The YPP in R1T1 and R1T2 decreased by 24.1%~48.2% in YN19 and 47.1~64.1% in XM26, respectively, compared with R1CK; it increased by 8.6%, 10.3% and 10.4% in YN19 and 8.9%, 20.0% and 20.5% in XM26, respectively, under OPA with the same temperature treatments compared with TPA (Table 5).
The SNPP in the T1 treatment was not significantly decreased, while the SNPP in the T2 treatment was significantly lower than that in CK (Table 5). Compared with the R1CK, the SNPP of YN19 and XM26 under R1T2 treatment decreased by 20.0% and 24.2%, respectively, and decreased by 24.3% and 22.8%, respectively, under R2T2 treatment compared with the R2CK. There was no significant difference in the GNPS and KGW of YN19 among the treatments, whereas low-temperature treatments significantly reduced GNPS and KGW in XM26. The GNPS of XM26 in R1T1 and R2T2 decreased by 26.1% and 36.8%, respectively, compared with R1CK; GNPS increased by 7.2% and 8.8%, respectively, under OPA compared with TPA. The TGW of R1T1 and R1T2 decreased by 8.6% and 11.5% in YN19 and 15.5% and 24.2% in XM26, respectively, compared with R1CK; it increased by 3.0%, 8.2% and 1.8% in YN19 and 3.2%, 5.4% and 3.8% in XM26, respectively, under OPA with the same temperature treatments compared with TPA (Table 5).

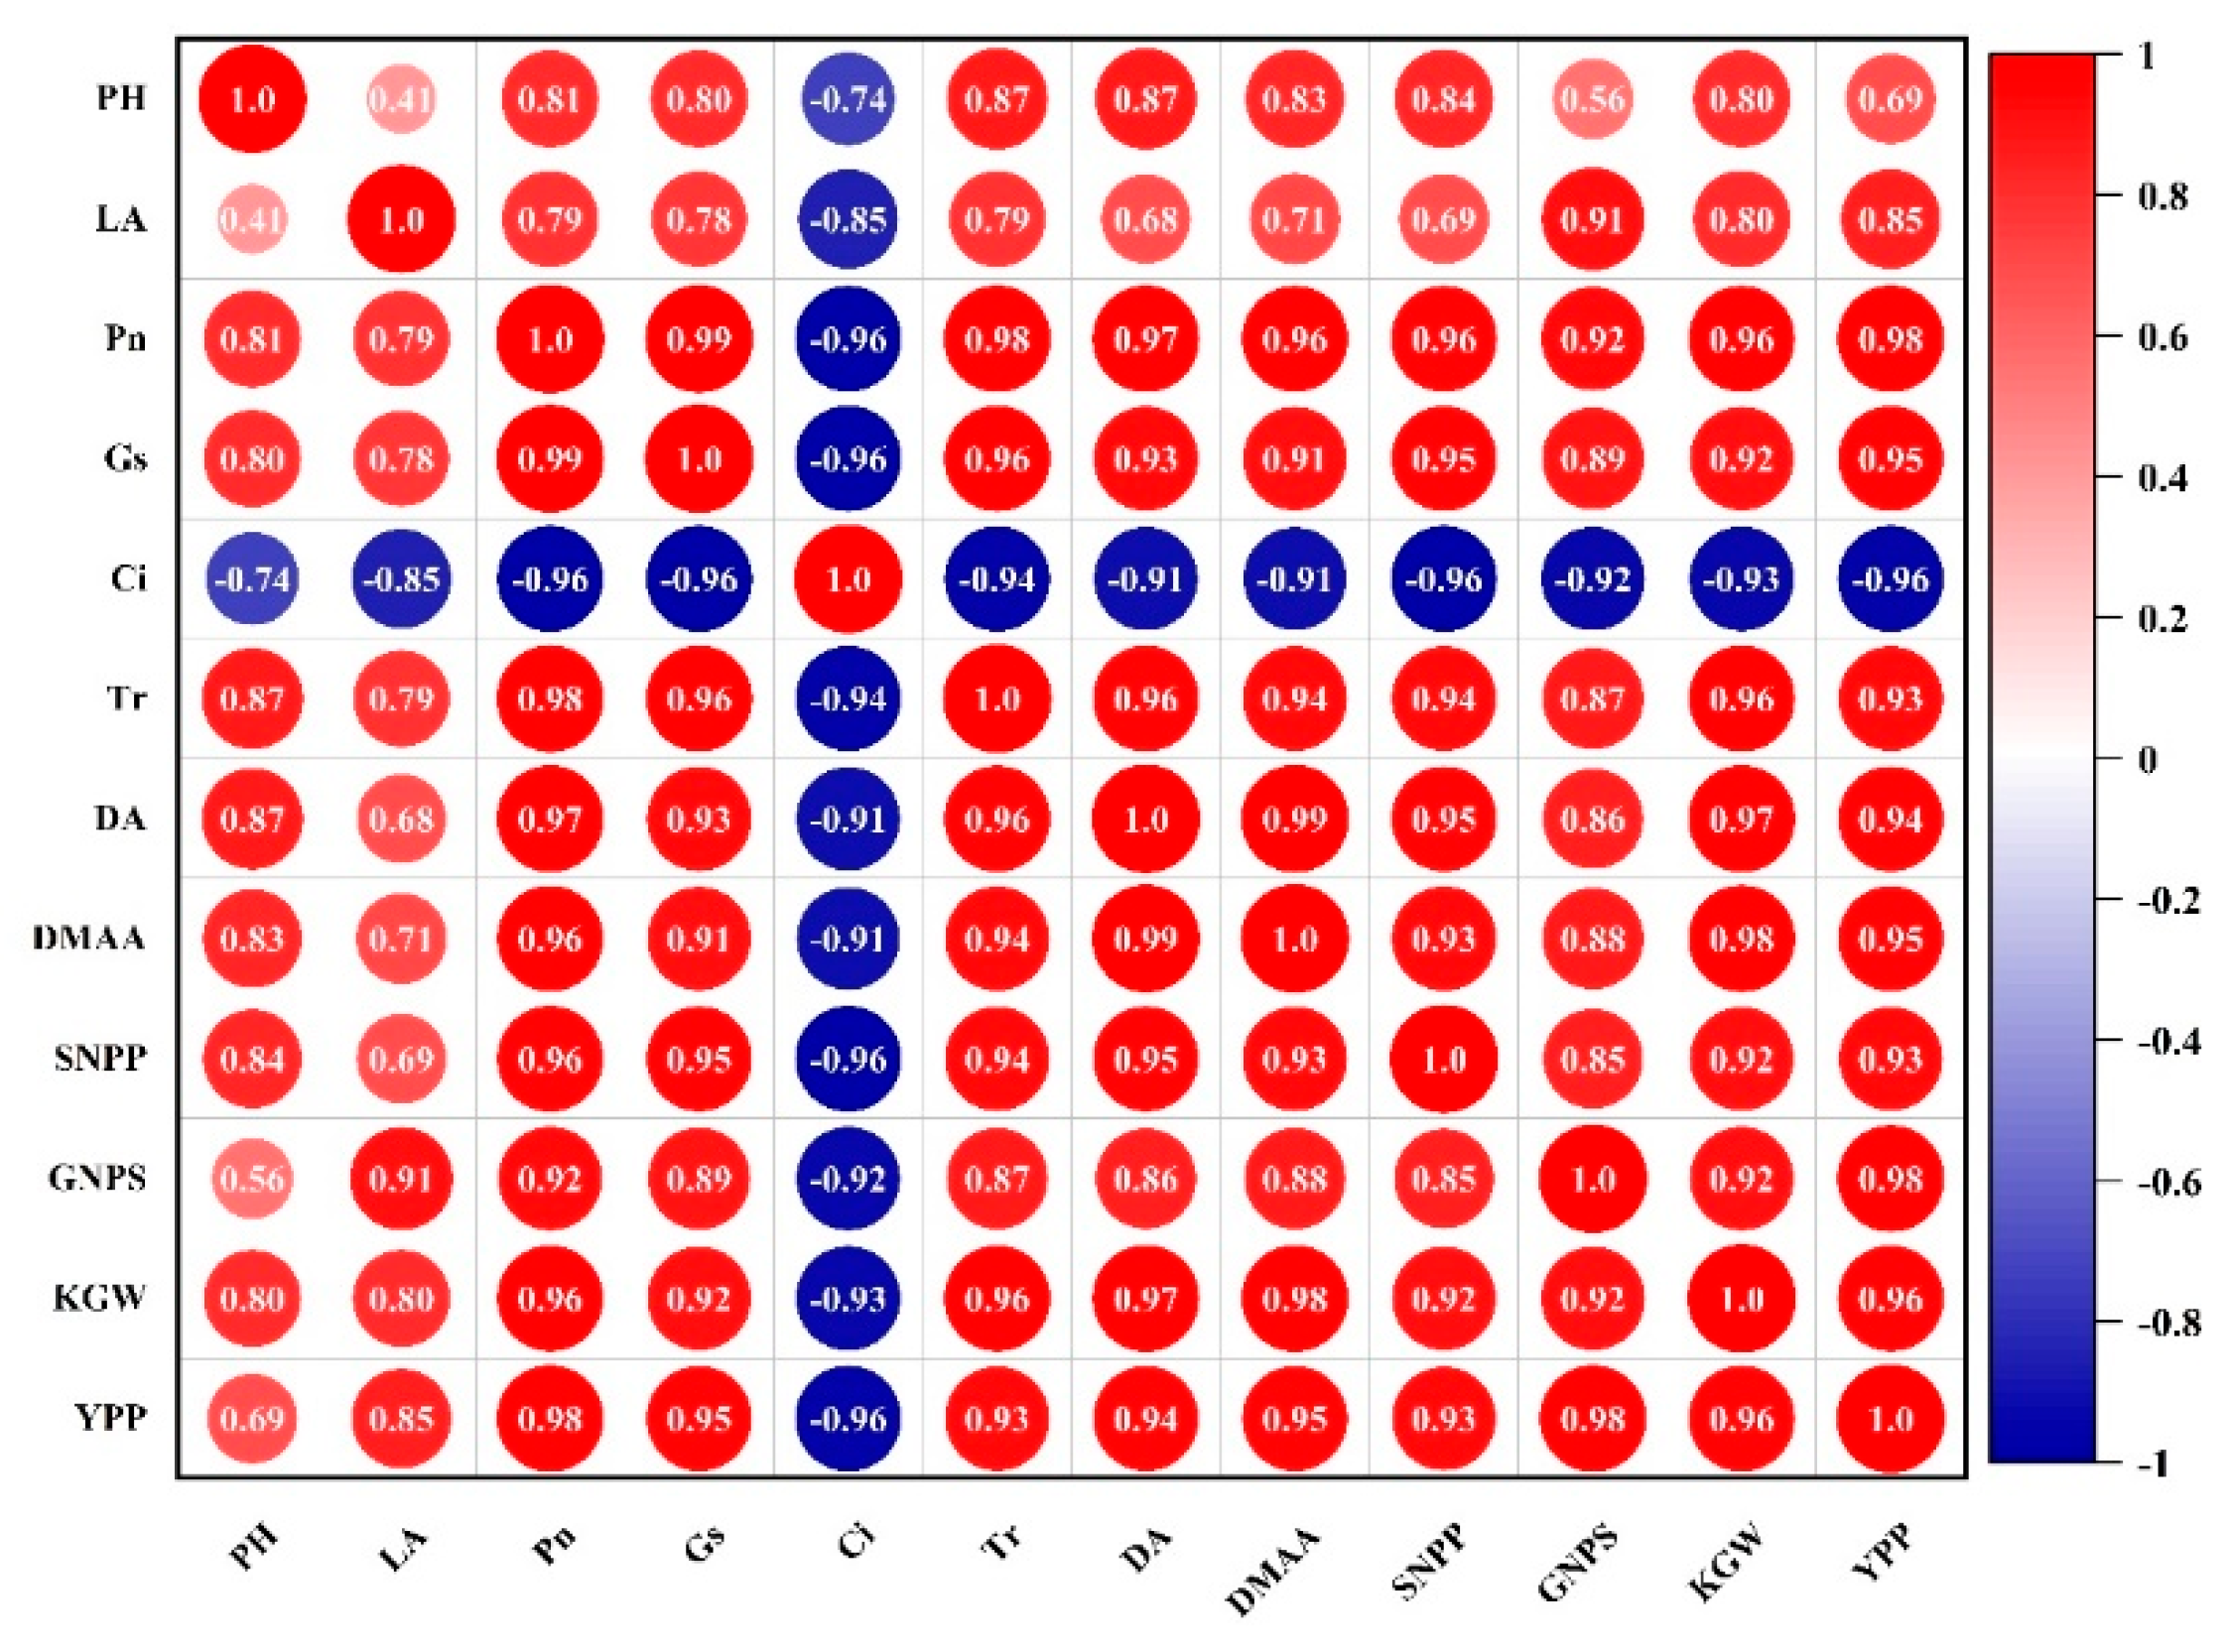
3.5. Correlation Analysis

The correlations among morphological traits, photosynthetic parameters, dry matter assimilation, translocation, yield and its components at the grain-filling stage are shown in Figure 4. The results showed that Ci was significantly and negatively correlated with all indexes. PH showed a significant and positive correlation with major indexes except for LA and GNPS, and LA showed a significant and positive correlation with other indexes. The photosynthetic parameters were highly significantly correlated with the yield and its components. The Pn has the highest correlation with SNPP, GNPS, TGW and YPP; Ci was significantly and negatively correlated with yield components. Moreover, DA and DMAA had significant and positive correlations with SNPP, GNPS, TGW and YPP.

4. Discussion

Researchers have extensively documented low-temperature stress-induced morphological changes in plants, and morphological changes are the most visible symptom of stress [28,29]. The plant height, tillers number and area of green leaves decreases significantly or even withers after low-temperature stress [9,30]. Studies have shown that when wheat leaves are exposed to −5 °C for 3 days at anther differentiation period, most leaves appear drooped and wilted, and the electrolyte leakage rate increases significantly [31]. Low-temperature stress at the jointing stage reduces the number of productive tillers, which the newly formed tillers cannot compensate for at the later growth stages [32]. It is well known that crop growth, development and stress tolerance are closely related to nutrient supply [33,34]. The optimal tillers number and leaf areas could be maintained by adequate phosphorus application, which is handy in achieving a higher grain yield in wheat [35,36]. The optimization of phosphorus application is vital in wheat cultivation which is more suitable for fulfilling the wheat nutrition demand, balanced source–sink relationship and harmonious growth of wheat organs [37]. Similarly, our study found that the tillers number of YN19 and XM26 increased by 9.0~14.9% and 13.6~17.4% at the grain-filling stage; whereas leaf areas per plant increased by 10.0~12.5% and 5.9~16.7%, respectively, at the maturity stage after OPA.
Photosynthesis is the source of plant energy conversion and carbon metabolism, the only way to accumulate dry matter and one of the physiological and biochemical processes [38,39]. It is highly vulnerable to low-temperature stress [40]. Chloroplast structure, photosynthetic pigment, photosynthetic rate and photosystem II activity are severely reduced under low-temperature stress [13,41]. Poor photosynthesis reduces dry matter accumulation and transportation, halting the final wheat yield [11]. Many studies showed that the photosynthetic capacity of various plant leaves reduced significantly after low-temperature stress [42]. In this study, Pn, Gs and Tr decreased, and Ci increased under low-temperature treatment, while Pn, Gs and Tr increased and Ci decreased after OPA. The damage of low-temperature stress to the leaves of cold-sensitive cultivar XM26 was greater than that of YN19, a cold-tolerant cultivar. This was because of the intrinsic genetic trait of the cold-tolerant wheat cultivar since it has greater temperature homeostasis in leaf respiration and photosynthesis than cold-sensitive cultivars [43]. Therefore, the recovery rate of YN19 was better than XM26 after low-temperature treatment during the anther differentiation period [5]. Waraich et al. [44] described that phosphorus also maintained cell turgor by maintaining high leaf water potential, thus increasing stomatal conductance and photosynthetic rate. This study showed that the Pn of YN19 and XM26 increased by 6.5~12.7% and 7.8~22.6%, respectively, after OPA at the grain-filling stage, suggesting that OPA could enhance the low-temperature stress tolerance of leaves and improve the photosynthetic capacity of wheat leaves in the two cultivars. Similarly, foliar application of potassium dihydrogen phosphate and salicylic acid effectively combats the low-temperature stress [45]. As an important nutrient element, phosphorus application also played an important role in reducing malondialdehyde, improving osmotic stress tolerance and cell membrane stability, and ultimately improving photosynthesis of wheat leaves [46,47].
Dry matter accumulation is the basis of yield formation. Due to the declined photosynthetic capacity, dry matter accumulation decreased significantly in wheat leaves after low-temperature treatment [48]. Liu et al. [49] pointed out that when the temperature dropped from −2 °C to −6 °C, the reduction rate of dry matter accumulation of cold-sensitive cultivars increased from 17.8% to 35.9% at the jointing stage. In this study, dry matter accumulation at the maturity stage in YN19 and XM26 was significantly reduced by 36.6% and 56.9%, respectively, at the low temperature of −4 °C. The dry matter drop rate in the present study is higher than that reported previously [49], which might be attributed to the treatment duration or equipment. Thus, it is suggested that the low-temperature effect on wheat dry matter accumulation depended on not only the low-temperature level and duration but also the wheat growth stages when the low-temperature event occurred [50]. Due to dehydration and poor photosynthesis caused by low-temperature stress, dry matter accumulation of aboveground organs and transportation to grains significantly decreased [6]. Ma et al. [51] also found that stress reduced dry matter assimilation and translocation capacity in the post-flowering stages. As a vital element, phosphorus improved stress tolerance and nutrient transport capacity to grains in wheat [52]. Likewise, when post-flowering nutrition of wheat is limited, phosphorus stored in the pre-flowering vegetative organs tends to maintain dry matter accumulation and transfer to grains through remobilization [53]. The optimal application of phosphorus increased the post-flowering supply and utilization efficiency of phosphorus, effectively maintained the dry matter accumulation in wheat organs and increased pre-flowering dry matter transportation and post-flowering accumulation in vegetative organs [27].
It is established that low-temperature stress eventually reduces yield by reducing photosynthesis and dry matter accumulation and transportation [6,49]. Previous studies mostly focused on the damage of low-temperature stress during the reproductive stage [54,55]. At this stage, wheat is undergoing spike differentiation and development. Here, low-temperature stress causes flower abortion, pollen and ovule sterility, disrupts fertilization and affects seed filling, resulting in poor seed setting and consequently lowered grain yield [56]. Our study showed that the chilling stress (T1) at the anther differentiation period did not significantly reduce SNPP in the two cultivars but could substantially reduce the GNPP in the sensitive cultivar XM26. Additionally, freezing stress (T2) significantly reduced GNPS, SNPP and TGW in both cultivars, XM26 and YN19. Analysis of spikelets at different locations revealed that low-temperature stress at the anther differentiation period poses maximum damage to the upper spikelets. The yield reduction rate of the cold-sensitive cultivar was more than 90% at −2 °C for 24 h [5]. This was due to the late development of upper spikelets, less accumulation of nutrients and osmotic adjustment substances [10,56]. Low-temperature stress had different effects on yield and its components in different growth stages of wheat. Zheng et al. [57] found that low-temperature stress during the vegetative stage mainly impacted the effective tillers number, resulting in a decreased SNPP. However, low-temperature stress during the reproductive stage caused higher yield losses, especially by significantly reducing GNPS and TGW [17].
Many previous studies examined the effects of different low-temperature intensities or durations on wheat yield and its components. Few explored the reduction in yield losses based on phosphorus optimization. Indeed, some researchers proposed strategies to improve wheat’s low-temperature tolerance or yield from the perspective of cultivation and breeding. In the field condition, the number of fertile spikelets increased significantly by increasing phosphorus from 60 to 90 kg hm−2, and the TGW also increased with increasing phosphorus application [44]. This study showed that OPA improved the low-temperature tolerance of wheat, which is consistent with previous studies. The yield increased by 8.6~8.9% after OPA at ambient temperature and by 10.1~20.5% after OPA at low-temperature treatment in both cultivars. The reason was that OPA increased the photosynthetic capacity of wheat leaves and promoted the transportation of assimilates to grains after the flowering stage. Subsequently, GNPS and TGW also increased. Qiu et al. [58] also indicated that minimizing phosphorus fixation and improving phosphorus utilization efficiency was a new scheme to apply phosphorus fertilizer with post-plant applications rather than pre-plant applications.

5. Conclusions

The present study concluded that low-temperature stress-induced morphological alterations and disrupted leaf photosynthesis led to the restricted accumulation and transportation of assimilates and severe reduction in DM transportation from vegetative organs (source pool) to grains (sink pool), resulting in the decrease of GNPS, TGW and YPP. The damage of low-temperature stress to cold-tolerant cultivar XM26 was more prominent than cold-tolerant cultivar YN19. The OPA could slow down flag leaf senescence, increase green leaf area, enhance photosynthetic capacity and improve the assimilation accumulation and transportation to grains, thus reducing wheat yield losses. The mitigation effect of OPA in XM26 was better than that in YN19, and that in T2 treatment was better than in T1 and CK treatments.
In future work, it is necessary to explore the physiological and molecular mechanism induced by phosphorus fertilizer to improve low-temperature tolerance in wheat to ensure efficient fertilizer utilization and maintain global food security.

Supplementary Materials

The following supporting information can be downloaded at: https://www.mdpi.com/article/10.3390/agronomy12071700/s1, Figure S1: Daily minimum temperature in March from 2016 to 2020 and daily average maximum temperature in March of these five years in Hefei.

Author Contributions

Conceptualization, H.X., X.C., Z.W. and J.L.; Formal analysis, H.X., Y.W. and J.L.; Methodology, H.X., M.Y. and D.S.; Resources, J.L.; Software, B.X. and A.C.; Writing—original draft, H.X. and M.A.H.; Writing—review and editing, H.X. and H.C. All authors have read and agreed to the published version of the manuscript..

Funding

This work was supported by the Major Science and Technology Projects in Anhui Province (202003b06020021), the Natural Science Foundation of Anhui Province (2008085QC122), the Major Science and Technology Projects of Huaibei City (HK2021013), the Special Fund for Anhui Agriculture Research System, the Open Fund Project of Smart Agriculture Research Institute of Anhui Agricultural University (IAR2021A01), Anhui Province College Students Innovation and Entrepreneurship Program in 2021 (S202110364291) and National College Students’ Innovation and Entrepreneurship Training Program in 2022.

Data Availability Statement

Data is contained within the article.

Acknowledgments

We thank Xianchun Xia (Institute of Crop Sciences, National Wheat Improvement Center, Chinese Academy of Agricultural Sciences, Beijing, China) for his guidance in revising this manuscript.

Conflicts of Interest

The authors declare no conflict of interest.

References

  1. Agnolucci, P.; Rapti, C.; Alexander, P.; De Lipsis, V.; Holland, R.A.; Eigenbrod, F.; Ekins, P. Impacts of rising temperatures and farm management practices on global yields of 18 crops. Nat. Food 2020, 1, 562–571. [Google Scholar] [CrossRef]
  2. Kulundzic, A.M.; Viljevac Vuletic, M.; Kocar, M.M.; Mijic, A.; Varga, I.; Sudaric, A.; Cesar, V.; Lepedus, H. The combination of increased temperatures and high irradiation causes changes in photosynthetic efficiency. Plants 2021, 10, 2076. [Google Scholar] [CrossRef] [PubMed]
  3. Chaudhry, S.; Sidhu, G.P.S. Climate change regulated abiotic stress mechanisms in plants: A comprehensive review. Plant Cell Rep. 2022, 41, 1–31. [Google Scholar] [CrossRef] [PubMed]
  4. Liu, L.L.; Song, H.; Shi, K.J.; Liu, B.; Zhang, Y.; Tang, L.; Cao, W.X.; Zhu, Y. Response of wheat grain quality to low temperature during jointing and booting stages-On the importance of considering canopy temperature. Agric. For. Meteorol. 2019, 278, 107658. [Google Scholar] [CrossRef]
  5. Zhang, Y.; Liu, L.; Chen, X.; Li, J. Effects of low-temperature stress during the anther differentiation period on winter wheat photosynthetic performance and spike-setting characteristics. Plants 2022, 11, 389. [Google Scholar] [CrossRef] [PubMed]
  6. Xu, H.; Hassan, M.A.; Sun, D.; Wu, Z.; Jiang, G.; Liu, B.B.; Ni, Q.; Yang, W.; Fang, H.; Jincai, L. Effects of low temperature stress on source-sink organs in wheat and phosphorus mitigation strategies. Front. Plant Sci. 2022, 13, 807844. [Google Scholar] [CrossRef] [PubMed]
  7. Zheng, B.; Chapman, S.C.; Christopher, J.T.; Frederiks, T.M.; Chenu, K. Frost trends and their estimated impact on yield in the Australian wheatbelt. J. Exp. Bot. 2015, 66, 3611–3623. [Google Scholar] [CrossRef] [Green Version]
  8. Osman, R.; Zhu, Y.; Ma, W.; Zhang, D.; Ding, Z.; Liu, L.; Tang, L.; Liu, B.; Cao, W. Comparison of wheat simulation models for impacts of extreme temperature stress on grain quality. Agric. For. Meteorol. 2020, 288, 107995. [Google Scholar] [CrossRef]
  9. Liu, L.; Xia, Y.; Liu, B.; Chang, C.; Xiao, L.; Shen, J.; Tang, L.; Cao, W.; Zhu, Y. Individual and combined effects of jointing and booting low-temperature stress on wheat yield. Eur. J. Agron. 2020, 113, 125989. [Google Scholar] [CrossRef]
  10. Zhang, W.; Wang, J.; Huang, Z.; Mi, L.; Xu, K.; Wu, J.; Fan, Y.; Ma, S.; Jiang, D. Effects of low temperature at booting stage on sucrose metabolism and endogenous hormone contents in winter wheat spikelet. Front. Plant Sci. 2019, 10, 498. [Google Scholar] [CrossRef]
  11. Hassan, M.A.; Xiang, C.; Farooq, M.; Muhammad, N.; Yan, Z.; Hui, X.; Ke, Y.Y.; Bruno, A.K.; Zhang, L.L.; Li, J.C. Cold stress in wheat: Plant acclimation responses and management strategies. Front. Plant Sci. 2021, 12, 15. [Google Scholar] [CrossRef] [PubMed]
  12. Allen, D.J.; Ort, D.R. Impacts of chilling temperatures on photosynthesis in warm-climate plants. Trends Plant Sci. 2001, 6, 36–42. [Google Scholar] [CrossRef]
  13. Bhattacharya, A. Effect of low temperature stress on photosynthesis and allied traits: A review. In Physiological Processes in Plants Under Low Temperature Stress; Bhattacharya, A., Ed.; Springer: Singapore, 2022; pp. 199–297. [Google Scholar] [CrossRef]
  14. Gan, P.; Liu, F.; Li, R.; Wang, S.; Luo, J. Chloroplasts—beyond energy capture and carbon fixation: Tuning of photosynthesis in response to chilling stress. Int. J. Mol. Sci. 2019, 20, 5046. [Google Scholar] [CrossRef] [PubMed] [Green Version]
  15. Sun, Y.; He, Y.; Irfan, A.R.; Liu, X.; Yu, Q.; Zhang, Q.; Yang, D. Exogenous brassinolide enhances the growth and cold resistance of maize (Zea mays L.) seedlings under chilling stress. Agronomy 2020, 10, 488. [Google Scholar] [CrossRef] [Green Version]
  16. Fuller, M.P.; Fuller, A.M.; Kaniouras, S.; Christophers, J.; Fredericks, T. The freezing characteristics of wheat at ear emergence. Eur. J. Agron. 2007, 26, 435–441. [Google Scholar] [CrossRef]
  17. Ji, H.T.; Xiao, L.J.; Xia, Y.M.; Song, H.; Liu, B.; Tang, L.; Cao, W.X.; Zhu, Y.; Liu, L.L. Effects of jointing and booting low temperature stresses on grain yield and yield components in wheat. Agric. For. Meteorol. 2017, 243, 33–42. [Google Scholar] [CrossRef]
  18. Zhong, X.; Mei, X.; Li, Y.; Yoshida, H.; Zhao, P.; Wang, X.; Han, L.; Hu, X.; Huang, S.; Huang, J.; et al. Changes in frost resistance of wheat young ears with development during jointing stage. J. Agron. Crop. Sci. 2008, 194, 343–349. [Google Scholar] [CrossRef]
  19. Thakur, P.; Kumar, S.; Malik, J.A.; Berger, J.D.; Nayyar, H. Cold stress effects on reproductive development in grain crops: An overview. Environ. Exp. Bot. 2010, 67, 429–443. [Google Scholar] [CrossRef]
  20. Yaakob, M.A.; Mohamed, R.M.S.R.; Al-Gheethi, A.; Ravishankar, G.A.; Ambati, R.R. Influence of nitrogen and phosphorus on microalgal growth, biomass, lipid, and fatty acid production: An overview. Cells 2021, 10, 393. [Google Scholar] [CrossRef]
  21. Poirier, Y.; Jaskolowski, A.; Clua, J. Phosphate acquisition and metabolism in plants. Curr. Biol. 2022, 32, 623–629. [Google Scholar] [CrossRef]
  22. Noor, I.; Sohail, H.; Hasanuzzaman, M.; Hussain, S.; Li, G.; Liu, J. Phosphorus confers tolerance against manganese toxicity in Prunus persica by reducing oxidative stress and improving chloroplast ultrastructure. Chemosphere 2022, 291, 132999. [Google Scholar] [CrossRef] [PubMed]
  23. Bouain, N.; Krouk, G.; Lacombe, B.; Rouached, H. Getting to the root of plant mineral nutrition: Combinatorial nutrient stresses reveal emergent properties. Trends Plant Sci. 2019, 24, 542–552. [Google Scholar] [CrossRef] [PubMed]
  24. Huang, J.X.; Wang, C.J.; Qi, L.L.; Zhang, X.L.; Tang, G.M.; Li, L.; Guo, J.H.; Jia, Y.J.; Dou, X.L.; Lu, M. Phosphorus is more effective than nitrogen in restoring plant communities of heavy metals polluted soils. Environ. Pollut. 2020, 266, 9. [Google Scholar] [CrossRef] [PubMed]
  25. Attarzadeh, M.; Balouchi, H.; Rajaie, M.; Dehnavi, M.M.; Salehi, A. Improving growth and phenolic compounds of Echinacea purpurea root by integrating biological and chemical resources of phosphorus under water deficit stress. Ind. Crop. Prod. 2020, 154, 7. [Google Scholar] [CrossRef]
  26. Li, H.Y.; Qiu, Y.Z.; Yao, T.; Ma, Y.C.; Zhang, H.R.; Yang, X.L. Effects of PGPR microbial inoculants on the growth and soil properties of Avena sativa, Medicago sativa, and Cucumis sativus seedlings. Soil Tillage Res. 2020, 199, 10. [Google Scholar] [CrossRef]
  27. Wang, Y.; Chen, Y.F.; Wu, W.H. Potassium and phosphorus transport and signaling in plants. J. Integr. Plant Biol. 2021, 63, 34–52. [Google Scholar] [CrossRef]
  28. Li, S.X.; Cheng, Z.H.; Dong, S.M.; Li, Z.B.; Zou, L.P.; Zhao, P.J.; Guo, X.; Bao, Y.; Wang, W.Q.; Peng, M. Global identification of full-length cassava lncRNAs unveils the role of cold-responsive intergenic lncRNA 1 in cold stress response. Plant Cell Environ. 2022, 45, 412–426. [Google Scholar] [CrossRef]
  29. Guo, X.Y.; Liu, D.F.; Chong, K. Cold signaling in plants: Insights into mechanisms and regulation. J. Integr. Plant Biol. 2018, 60, 745–756. [Google Scholar] [CrossRef] [Green Version]
  30. Xie, Y.K.; Wang, C.; Yang, W.D.; Feng, M.C.; Qiao, X.X.; Song, J.Y. Canopy hyperspectral characteristics and yield estimation of winter wheat (Triticum aestivum) under low temperature injury. Sci. Rep. 2020, 10, 244. [Google Scholar] [CrossRef] [Green Version]
  31. Han, Q.X.; Kang, G.Z.; Guo, T.C. Proteomic analysis of spring freeze-stress responsive proteins in leaves of bread wheat (Triticum aestivum L.). Plant Physiol. Biochem. 2013, 63, 236–244. [Google Scholar] [CrossRef]
  32. Li, X.N.; Pu, H.C.; Liu, F.L.; Zhou, Q.; Cai, J.; Dai, T.B.; Cao, W.X.; Jiang, D. Winter wheat photosynthesis and grain yield responses to spring freeze. Agron. J. 2015, 107, 1002–1010. [Google Scholar] [CrossRef]
  33. Seleiman, M.F. Use of plant nutrients in improving abiotic stress tolerance in wheat. In Wheat Production in Changing Environments; Springer: Berlin/Heidelberg, Germany, 2019; pp. 481–495. [Google Scholar] [CrossRef]
  34. Školníková, M.; Škarpa, P.; Ryant, P.; Kozáková, Z.; Antošovský, J. Response of winter wheat (Triticum aestivum L.) to fertilizers with nitrogen-transformation inhibitors and timing of their application under field conditions. Agronomy 2022, 12, 223. [Google Scholar] [CrossRef]
  35. Chen, X.X.; Zhang, W.; Liang, X.Y.; Liu, Y.M.; Xu, S.J.; Zhao, Q.Y.; Du, Y.F.; Zhang, L.; Chen, X.P.; Zou, C.Q. Physiological and developmental traits associated with the grain yield of winter wheat as affected by phosphorus fertilizer management. Sci. Rep. 2019, 9, 12. [Google Scholar] [CrossRef] [PubMed]
  36. Izhar Shafi, M.; Adnan, M.; Fahad, S.; Wahid, F.; Khan, A.; Yue, Z.; Danish, S.; Zafar-ul-Hye, M.; Brtnicky, M.; Datta, R. Application of single superphosphate with humic acid improves the growth, yield and phosphorus uptake of wheat (Triticum aestivum L.) in calcareous soil. Agronomy 2020, 10, 1224. [Google Scholar] [CrossRef]
  37. Jahan, M.; Amiri, M.B. Optimizing application rate of nitrogen, phosphorus and cattle manure in wheat production: An approach to determine optimum scenario using response-surface methodology. J. Soil Sci. Plant Nutr. 2018, 18, 13–26. [Google Scholar] [CrossRef] [Green Version]
  38. Gururani, M.A.; Venkatesh, J.; Tran, L.S.P. Regulation of photosynthesis during abiotic stress-induced photoinhibition. Mol. Plant 2015, 8, 1304–1320. [Google Scholar] [CrossRef] [Green Version]
  39. Hussain, S.; Ulhassan, Z.; Brestic, M.; Zivcak, M.; Zhou, W.J.; Allakhverdiev, S.I.; Yang, X.H.; Safdar, M.E.; Yang, W.Y.; Liu, W.G. Photosynthesis research under climate change. Photosynth. Res. 2021, 150, 5–19. [Google Scholar] [CrossRef]
  40. Khan, T.A.; Fariduddin, Q.; Yusuf, M. Low-temperature stress: Is phytohormones application a remedy? Environ. Sci. Pollut. Res. 2017, 24, 21574–21590. [Google Scholar] [CrossRef]
  41. Venzhik, Y.V.; Titov, A.F.; Talanova, V.V.; Frolova, S.A.; Talanov, A.V.; Nazarkina, Y.A. Influence of lowered temperature on the resistance and functional activity of the photosynthetic apparatus of wheat plants. Biol. Bull. 2011, 38, 132–137. [Google Scholar] [CrossRef]
  42. Nevyl, S.F.; Battaglia, M.E. Developmental plasticity in Arabidopsis thaliana under combined cold and water deficit stresses during flowering stage. Planta 2021, 253, 13. [Google Scholar] [CrossRef]
  43. Yamori, W.; Noguchi, K.; Hikosaka, K.; Terashima, I. Cold-tolerant crop species have greater temperature homeostasis of leaf respiration and photosynthesis than cold-sensitive species. Plant Cell Physiol. 2009, 50, 203–215. [Google Scholar] [CrossRef] [PubMed] [Green Version]
  44. Waraich, E.A.; Ahmad, R.; Ashraf, M. Role of mineral nutrition in alleviation of drought stress in plants. Aust. J. Crop. Sci. 2011, 5, 764–777. [Google Scholar] [CrossRef]
  45. Rafiullah; Khan, M.J.; Muhammad, D.; Fahad, S.; Adnan, M.; Wahid, F.; Alamri, S.; Khan, F.; Dawar, K.M.; Irshad, I.; et al. Phosphorus nutrient management through synchronization of application methods and rates in wheat and maize crops. Plants 2020, 9, 1389. [Google Scholar] [CrossRef] [PubMed]
  46. Nie, Z.; Li, S.; Hu, C.; Sun, X.; Tan, Q.; Liu, H. Effects of molybdenum and phosphorus fertilizers on cold resistance in winter wheat. J. Plant Nutr. 2015, 38, 808–820. [Google Scholar] [CrossRef]
  47. Mahmood, I.A.; Arshad, A. Response of direct seeded rice and wheat crops to phosphorus application with crop residue incorporation in saline-sodic soil. Int. J. Agric. Biol. 2015, 17, 1219–1224. [Google Scholar] [CrossRef]
  48. Wang, W.L.; Wang, X.; Huang, M.; Cal, J.; Zhou, Q.; Dai, T.B.; Jiang, D. Alleviation of field low-temperature stress in winter wheat by exogenous application of salicylic acid. J. Plant Growth Regul. 2021, 40, 811–823. [Google Scholar] [CrossRef]
  49. Liu, L.; Ji, H.; An, J.; Shi, K.; Ma, J.; Liu, B.; Tang, L.; Cao, W.; Zhu, Y. Response of biomass accumulation in wheat to low-temperature stress at jointing and booting stages. Environ. Exp. Bot. 2019, 157, 46–57. [Google Scholar] [CrossRef]
  50. Craufurd, P.Q.; Vadez, V.; Jagadish, S.V.K.; Prasad, P.V.V.; Zaman-Allah, M. Crop science experiments designed to inform crop modeling. Agric. For. Meteorol. 2013, 170, 8–18. [Google Scholar] [CrossRef] [Green Version]
  51. Ma, S.; Gai, P.; Wang, Y.; Ullah, N.; Zhang, W.; Fan, Y.; Shan, Y.; Huang, Z.; Hu, X. Carbohydrate assimilation and translocation regulate grain yield formation in wheat crops (Triticum aestivum L.) under post-flowering waterlogging. Agronomy 2021, 11, 2209. [Google Scholar] [CrossRef]
  52. Cong, W.F.; Suriyagoda, L.D.B.; Lambers, H. Tightening the phosphorus cycle through phosphorus-efficient crop genotypes. Trends Plant Sci. 2020, 25, 967–975. [Google Scholar] [CrossRef]
  53. El Mazlouzi, M.; Morel, C.; Robert, T.; Yan, B.; Mollier, A. Phosphorus uptake and partitioning in two durum wheat cultivars with contrasting biomass allocation as affected by different P supply during grain filling. Plant Soil 2020, 449, 179–192. [Google Scholar] [CrossRef]
  54. Zhang, C.A.H.; Gu, K.J.; Gu, D.X.; Zhang, S.M.; Wu, J.J. Quantifying the effect of low-temperature events on the grain quality formation of wheat. J. Cereal Sci. 2021, 100, 9. [Google Scholar] [CrossRef]
  55. Frederiks, T.M.; Christopher, J.T.; Harvey, G.L.; Sutherland, M.W.; Borrell, A.K. Current and emerging screening methods to identify post-head-emergence frost adaptation in wheat and barley. J. Exp. Bot. 2012, 63, 5405–5416. [Google Scholar] [CrossRef] [PubMed] [Green Version]
  56. Jiang, G.; Hassan, M.A.; Muhammad, N.; Arshad, M.; Chen, X.; Xu, Y.H.; Xu, H.; Ni, Q.Q.; Liu, B.B.; Yang, W.K.; et al. Comparative physiology and transcriptome analysis of young spikes in response to late spring coldness in wheat (Triticum aestivum L.). Front. Plant Sci. 2022, 13, 811884. [Google Scholar] [CrossRef]
  57. Zheng, D.X.; Yang, X.G.; Minguez, M.I.; Mu, C.Y.; He, Q.; Wu, X. Effect of freezing temperature and duration on winter survival and grain yield of winter wheat. Agric. For. Meteorol. 2018, 260, 1–8. [Google Scholar] [CrossRef]
  58. Qiu, Y.H.; Fall, T.; Su, Z.H.; Bortolozo, F.; Mussoline, W.; England, G.; Dinkins, D.; Morgan, K.; Clark, M.; Liu, G.D. Effect of phosphorus fertilization on yield of chipping potato grown on high legacy phosphorus soil. Agronomy 2022, 12, 812. [Google Scholar] [CrossRef]
Figure 1. The weather conditions during March at anther differentiation period in the wheat-growing season (2020−2021).
Agronomy 12 01700 g001
Figure 2. Effects of OPA on wheat morphology under low-temperature stress at booting, flowering and grain-filling stages. (A) Plant height of YN19. (B) Plant height of XM26. (C) Tiller number of YN19. (D) Tiller number of XM26. (E) Leaf areas per plant of YN19. (F) Leaf areas per plant of XM26. Data represent means ± SE (n = 3). Vertical bars represent standard errors. Abbreviations: YN19 = Yannong19; XM26 = Xinmai26; BS = booting stage; FS = flowering stage; GS = grain-filling stage; MS = maturity stage. R1CK, R1T1 and R1T2 represent 11 °C, 4 °C and −4 °C under traditional phosphorus application, respectively; and R2CK, R2T1 and R2T2 represent 11 °C, 4 °C and −4 °C under optimized phosphorus application, respectively.
Agronomy 12 01700 g002
Figure 3. Effects of OPA on dry matter accumulation in different wheat organs under low-temperature stress at different growth stages. (A) Different organs dry matter accumulation of Yannong19 at the flowering stage. (B) Different organs dry matter accumulation of Xinmai26 at the flowering stage. (C) Different organs dry matter accumulation of Yannong19 at the maturity stage. (D) Different organs dry matter accumulation of Xinmai26 at the maturity stage. Data represent mean ± SE (n = 3). Different letters following the data within each column indicate significant differences at p < 0.05. Aboveground vegetative organs: leaves + stems + sheaths. R1 and R2 represent traditional phosphorus application and optimized phosphorus application, respectively. CK, T1, and T2 represent 11 °C, 4 °C and −4 °C, respectively.
Agronomy 12 01700 g003
Figure 4. Correlation analysis of morphological traits, photosynthesis, dry matter assimilation and transportation with yield. Abbreviations: PH: plant height at the grain-filling stage; LA: leaf area at the grain-filling stage; Pn: the net photosynthetic rate at the grain-filling stage; Gs: stomatal conductance at the grain-filling stage; Ci: intercellular carbon-dioxide concentration at the grain-filling stage; Tr: transpiration rate at the grain-filling stage; DA: dry matter accumulation in maturity stage; DMAA: dry matter accumulation of vegetative organs after flowering stage; SNPP: spike number per plant; GNPS: grain number per spike; TGW: 1000-grain weight; YPP: yield per plant.
Agronomy 12 01700 g004
Table 1. Test treatment.
VarietyMPATemperature RegimesNumber of
Experimental Pots
CK (11 °C)T1 (4 °C)T2 (−4 °C)
YN19R1YNR1CKYNR1T1YNR1T236 pots
R2YNR2CKYNR2T1YNR2T236 pots
XM26R1XMR1CKXMR1T1XMR1T236 pots
R2XMR2CKXMR2T1XMR2T236 pots
From 14 to 15 March 2021, crop plants were observed under a microscope when the spikes had reached the anther differentiation period (OLYMPUS SZ2-ILST; Tokyo, Japan). Except for the control treatments (CK), all other pots were transferred to an artificial climate chamber (DGXM−1008; Ningbo Jiangnan Instrument Manufacturing Factory, Ningbo, China; 1300 mm length × 630 mm width × 1305 mm height) with a humidity of 75% and light intensity of 0 µmol·m−2·s−1·s for each treatment. The average temperature on the day of treatment (15 March 2021) was 15 °C, and the lowest temperature at night was 11 °C (Figure 1). The temperature in the chamber was set at 4 °C (T1) and −4 °C (T2) from 01:00 a.m. to 05:00 a.m., and the pots were moved back to the field after treating with low temperature. Field conditions were maintained until the plants reached maturity. One hour before and after the low-temperature treatments, pots were moved to the indoor climate chamber to prevent sudden temperature drop shock. Abbreviations: MPA = the method of phosphorus application; R1 = traditional phosphorus application; R2: optimized phosphorus application.
Table 2. Effects of OPA on wheat photosynthetic parameters under low-temperature stress at flowering and grain-filling stages.
StageMPATEMPYN19XM26
PnGsCiTrPnGsCiTr
μmol·m−2·s−1mol·m−2·s−1μmol·mol−1mmol·m−2·s−1μmol·m−2·s−1mol·m−2·s−1μmol·mol−1mmol·m−2·s−1
FSR1CK25.1 ± 0.7 a0.231 ± 0.005 ab141.7 ± 4.1 cd4.89 ± 0.34 a24.7 ± 0.4 a0.219 ± 0.010 a148.3 ± 5.5 de4.74 ± 0.14 a
T120.3 ± 0.3 bc0.179 ± 0.003 c154.0 ± 2.3 bc3.78 ± 0.13 abc18.3 ± 0.5 bc0.153 ± 0.007 bc170.7 ± 7.4 bc3.46 ± 0.10 b
T216.8 ± 0.7 c0.124 ± 0.013 d175.7 ± 3.7 a2.55 ± 0.10 c14.8 ± 0.5 d0.110 ± 0.005 d195.0 ± 5.7 a2.24 ± 0.10 d
R2CK26.4 ± 0.8 a0.255 ± 0.014 a132.0 ± 2.5 d5.11 ± 0.23 a25.6 ± 0.8 a0.230 ± 0.009 a135.7 ± 2.8 e4.96 ± 0.08 a
T123.6 ± 1.0 ab0.200 ± 0.007 bc146.3 ± 6.9 cd3.93 ± 0.44 ab19.9 ± 0.4 b0.168 ± 0.002 b162.0 ± 2.5 cd3.58 ± 0.08 b
T219.4 ± 0.2 c0.158 ± 0.006 cd169.0 ± 2.5 ab3.27 ± 0.25 bc17.5 ± 0.6 c0.133 ± 0.008 cd184.7 ± 8.4 ab2.89 ± 0.07 c
GSR1CK12.3 ± 0.3 a0.134 ± 0.004 a174.0 ± 5.5 c3.35 ± 0.12 a11.7 ± 0.2 a0.119 ± 0.005 a175.3 ± 3.84 de3.12 ± 0.09 ab
T19.0 ± 0.3 bc0.091 ± 0.003 bc198.7 ± 6.8 bc2.71 ± 0.07 bc7.7 ± 0.4 bc0.082 ± 0.003 bc210.7 ± 3.53 bc2.53 ± 0.16 c
T27.1 ± 0.3 c0.065 ± 0.004 c242.7 ± 6.0 a2.42 ± 0.09 c5.3 ± 0.4 d0.054 ± 0.008 c247.7 ± 6.98 a1.74 ± 0.07 d
R2CK13.1 ± 0.3 a0.145 ± 0.004 a166.7 ± 5.8 c3.52 ± 0.13 a12.6 ± 0.3 a0.126 ± 0.006 a162.7 ± 3.84 e3.36 ± 0.08 a
T19.8 ± 0.2 b0.101 ± 0.007 b187.0 ± 7.5 c2.88 ± 0.07 b8.9 ± 0.4 b0.098 ± 0.007 ab197.7 ± 4.98 cd2.81 ± 0.07 bc
T28.0 ± 0.3 cd0.075 ± 0.002 cd224.0 ± 6.2 ab2.55 ± 0.07 bc6.5 ± 0.5 cd0.066 ± 0.003 c234.3 ± 6.36 ab1.95 ± 0.12 d
Data represent mean ± SE (n = 3). Different letters following the data within each column indicate significant differences at p < 0.05. Abbreviations: YN19 = Yannong19; XM26 = Xinmai26; Pn: net photosynthetic rate; Gs: stomatal conductance; Ci: intercellular carbon-dioxide concentration; Tr: transpiration rate; MPA = the methods of phosphorus application; TEMP = temperature; FS = flowering stage; GS = grain-filling stage. R1 and R2 represent traditional phosphorus application and optimized phosphorus application, respectively. CK, T1 and T2 represent 11 °C, 4 °C and −4 °C, respectively.
Table 3. Effects of OPA on wheat dry matter accumulation under low-temperature stress at different growth stages.
VarietyMPATEMPBSFSGSMS
YN19R1CK7.41 ± 0.57 a10.45 ± 0.65 ab12.19 ± 0.52 ab15.01 ± 1.22 ab
T16.95 ± 0.54 a8.54 ± 0.71 cd9.99 ± 0.27 c11.70 ± 1.31 cd
T26.37 ± 0.07 a7.13 ± 0.88 d9.26 ± 0.28 c9.52 ± 1.17 d
R2CK7.55 ± 0.44 a11.35 ± 1.16 a12.66 ± 0.38 a16.53 ± 1.83 a
T17.14 ± 0.40 a9.09 ± 0.94 bc10.62 ± 0.17 bc13.20 ± 1.76 bc
T26.72 ± 0.16 a8.15 ± 0.52 cd9.75 ± 0.42 c10.93 ± 0.98 cd
XM26R1CK7.14 ± 0.45 ab9.83 ± 0.15 a11.31 ± 0.62 a14.37 ± 0.22 a
T15.63 ± 0.24 cd6.55 ± 0.22 bc7.41 ± 0.57 bc8.47 ± 0.15 bc
T24.62 ± 0.18 d4.91 ± 0.12 d5.48 ± 0.30 c6.20 ± 0.48 d
R2CK7.37 ± 0.34 a10.18 ± 0.35 a12.57 ± 0.51 a15.44 ± 0.68 a
T16.27 ± 0.23 bc7.35 ± 0.35 b8.43 ± 0.45 b9.60 ± 0.18 b
T25.18 ± 0.12 d5.39 ± 0.41 cd6.25 ± 0.25 bc7.06 ± 0.22 cd
Data represent mean ± SE (n = 3). Different letters following the data within each column indicate significant differences at p < 0.05. Abbreviations: YN19 = Yannong19; XM26 = Xinmai26; MPA = the methods of phosphorus application; TEMP = temperature; BS = booting stage; FS = flowering stage; GS = grain-filling stage; MS = maturity stage. R1 and R2 represent traditional phosphorus application and optimized phosphorus application, respectively. CK, T1 and T2 represent 11 °C, 4 °C and −4 °C, respectively.
Table 4. Effects of OPA on wheat redistribution under low-temperature stress during the anther differentiation period.
VarietyMPATEMPDry Matter BFDry Matter AF
PDMTCDMTDMAACDMAA
YN19R1CK26.96 ± 0.57 a33.81 ± 0.92 a4.51 ± 0.07 ab66.19 ± 0.92 a
T126.06 ± 4.82 a34.79 ± 6.25 a3.32 ± 0.32 cd65.21 ± 6.25 a
T226.06 ± 1.74 a37.78 ± 2.52 a2.50 ± 0.18 d62.22 ± 2.51 a
R2CK23.65 ± 0.22 a29.22 ± 0.61 a5.20 ± 0.05 a70.78 ± 0.62 a
T122.34 ± 3.43 a28.67 ± 4.73 a4.13 ± 0.38 bc71.33 ± 4.73 a
T222.01 ± 1.67 a31.26 ± 2.89 a3.15 ± 0.22 d68.74 ± 2.89 a
XM26R1CK33.65 ± 5.29 a36.11 ± 4.27 a4.59 ± 0.48 a63.89 ± 4.26 a
T134.50 ± 2.51 a48.21 ± 2.97 a2.00 ± 0.38 b51.79 ± 2.97 a
T233.22 ± 1.79 a51.73 ± 2.98 a1.24 ± 0.11 b48.27 ± 2.98 a
R2CK31.78 ± 2.90 a32.49 ± 4.27 a5.30 ± 0.42 a67.51 ± 4.27 a
T135.60 ± 7.21 a45.30 ± 9.18 a2.46 ± 0.33 b54.70 ± 9.18 a
T233.80 ± 5.01 a48.62 ± 11.22 a1.63 ± 0.42 b51.38 ± 11.22 a
Data represent mean ± SE (n = 3). Different letters following the data within each column indicate significant differences at p < 0.05. Abbreviations: YN19 = Yannong19; XM26 = Xinmai26; MPA = the methods of phosphorus application; TEMP = temperature; BF: before flowering stage; AF = after flowering stage; PDMT = proportion of dry matter transportation of vegetative organs; CDMT = contribution of dry matter transportation of vegetative organs to dry matter of grains; DMAA = dry matter accumulation of vegetative organs; CDMAA = contribution of dry matter to dry matter of grains. R1 and R2 represent traditional phosphorus application and optimized phosphorus application, respectively. CK, T1, and T2 represent 11 °C, 4 °C, and −4 °C, respectively.
Table 5. Effects of OPA on wheat redistribution under low-temperature stress during the anther differentiation period.
VarietyMPATEMPSpike NumberGrains per Spike1000-Grain Weight (g)Yield per Plant (g)Yield Reduction Rate (%)
YN19R1CK3.5 ± 0.2 ab46.4 ± 2.0 a40.03 ± 1.27 ab6.52 ± 0.50 ab
T13.3 ± 0.2 ab40.3 ± 3.2 a36.59 ± 1.73 ab4.95 ± 0.58 bc24.1
T22.7 ± 0.2 b35.8 ± 2.1 a35.44 ± 1.05 b3.38 ± 0.17 c48.2
R2CK3.7 ± 0.2 a46.9 ± 2.2 a41.22 ± 0.63 a7.08 ± 0.42 a−8.6
T13.3 ± 0.3 ab41.4 ± 2.8 a39.59 ± 0.68 ab5.46 ± 0.36 abc16.3
T22.8 ± 0.2 ab36.3 ± 2.9 a36.09 ± 0.94 ab3.73 ± 0.38 c42.8
XM26R1CK3.3 ± 0.2 a52.4 ± 4.3 a41.13 ± 0.59 a7.19 ± 0.63 a
T12.8 ± 0.2 ab38.7 ± 1.3 b34.77 ± 1.74 bc3.80 ± 0.08 bc47.1
T22.5 ± 0.2 b33.1 ± 0.3 b31.18 ± 1.42 d2.58 ± 0.11 c64.1
R2CK3.5 ± 0.2 a52.8 ± 2.6 a42.44 ± 0.28 a7.83 ± 0.35 a−8.9
T13.0 ± 0.0 ab41.5 ± 4.8 b36.66 ± 1.24 b4.56 ± 0.57 b36.6
T22.7 ± 0.2 b36.0 ± 2.4 b32.38 ± 0.55 cd3.11 ± 0.25 bc56.7
Data represent mean ± SE (n = 3). Different letters following the data within each column indicate significant differences at p < 0.05. Abbreviations: YN19 = Yannong19; XM26 = Xinmai26; MPA = the methods of phosphorus application; TEMP = temperature. R1 and R2 represent traditional phosphorus application and optimized phosphorus application, respectively. CK, T1 and T2 represent 11 °C, 4 °C and −4 °C, respectively.
Publisher’s Note: MDPI stays neutral with regard to jurisdictional claims in published maps and institutional affiliations.

