
Density-Dependent Fertilization of Nitrogen for Optimal Yield of Perennial Rice

Abstract
:1. Introduction
2. Materials and Methods
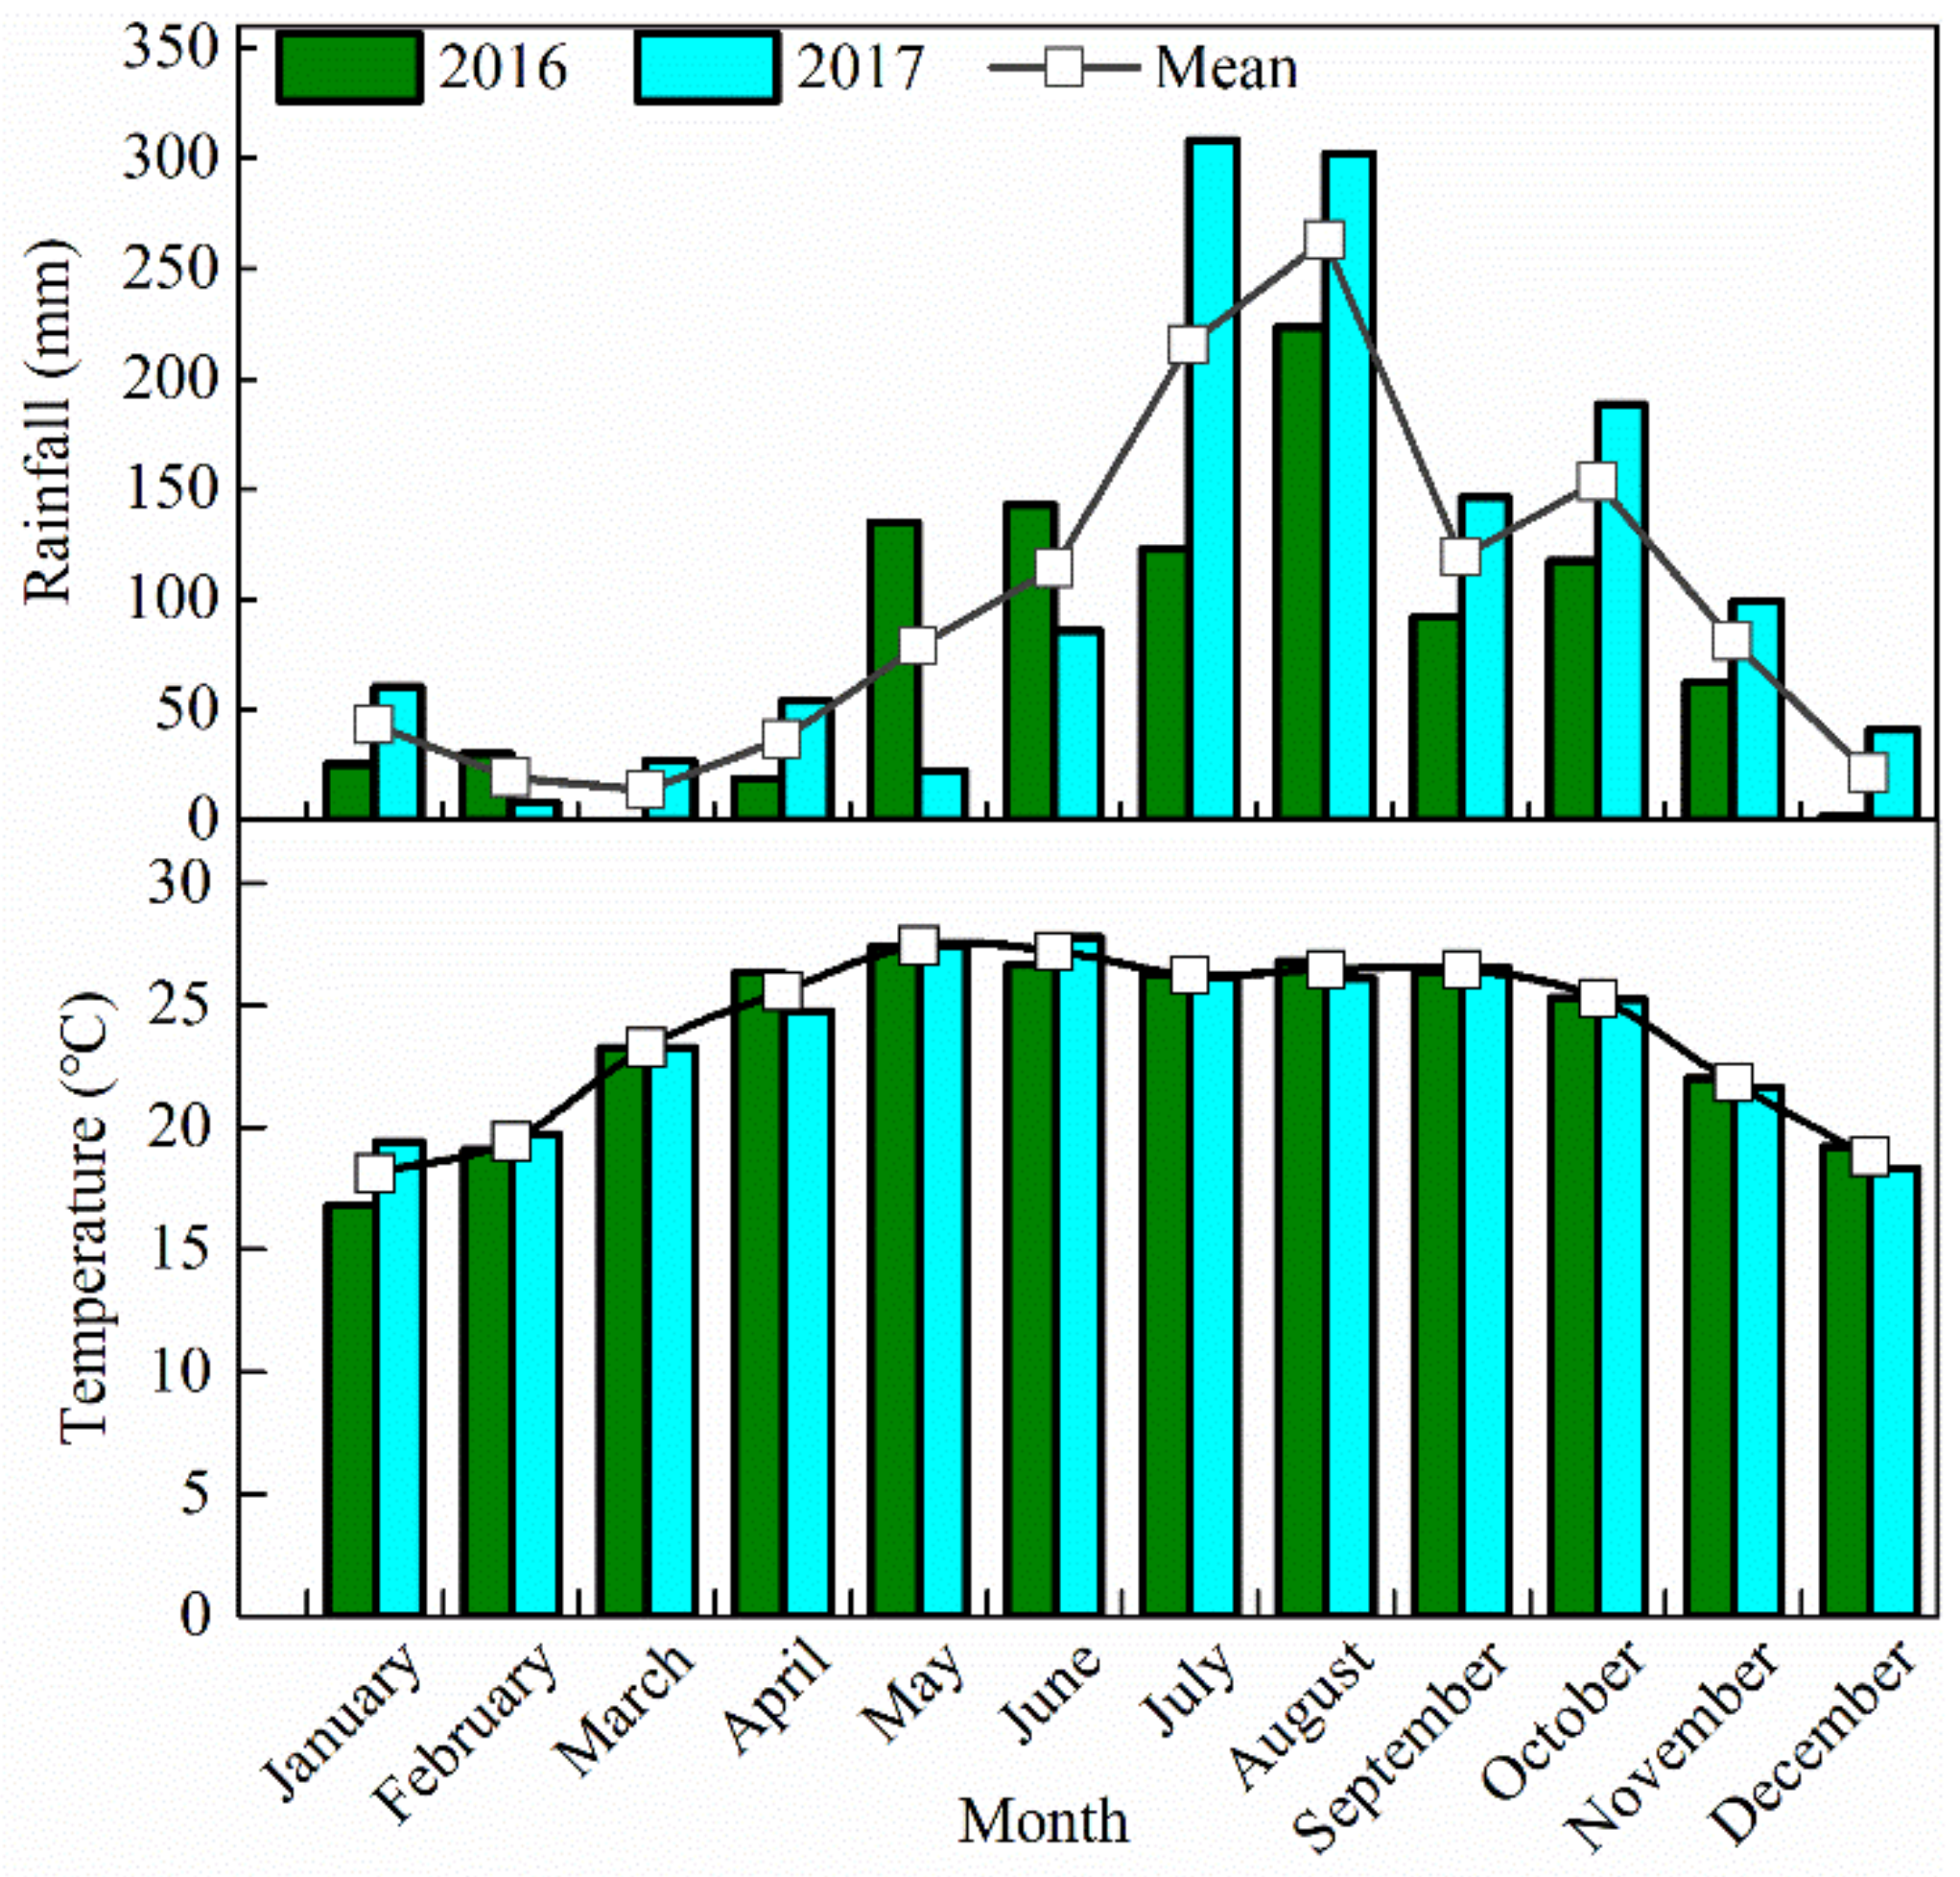
2.1. Site Description
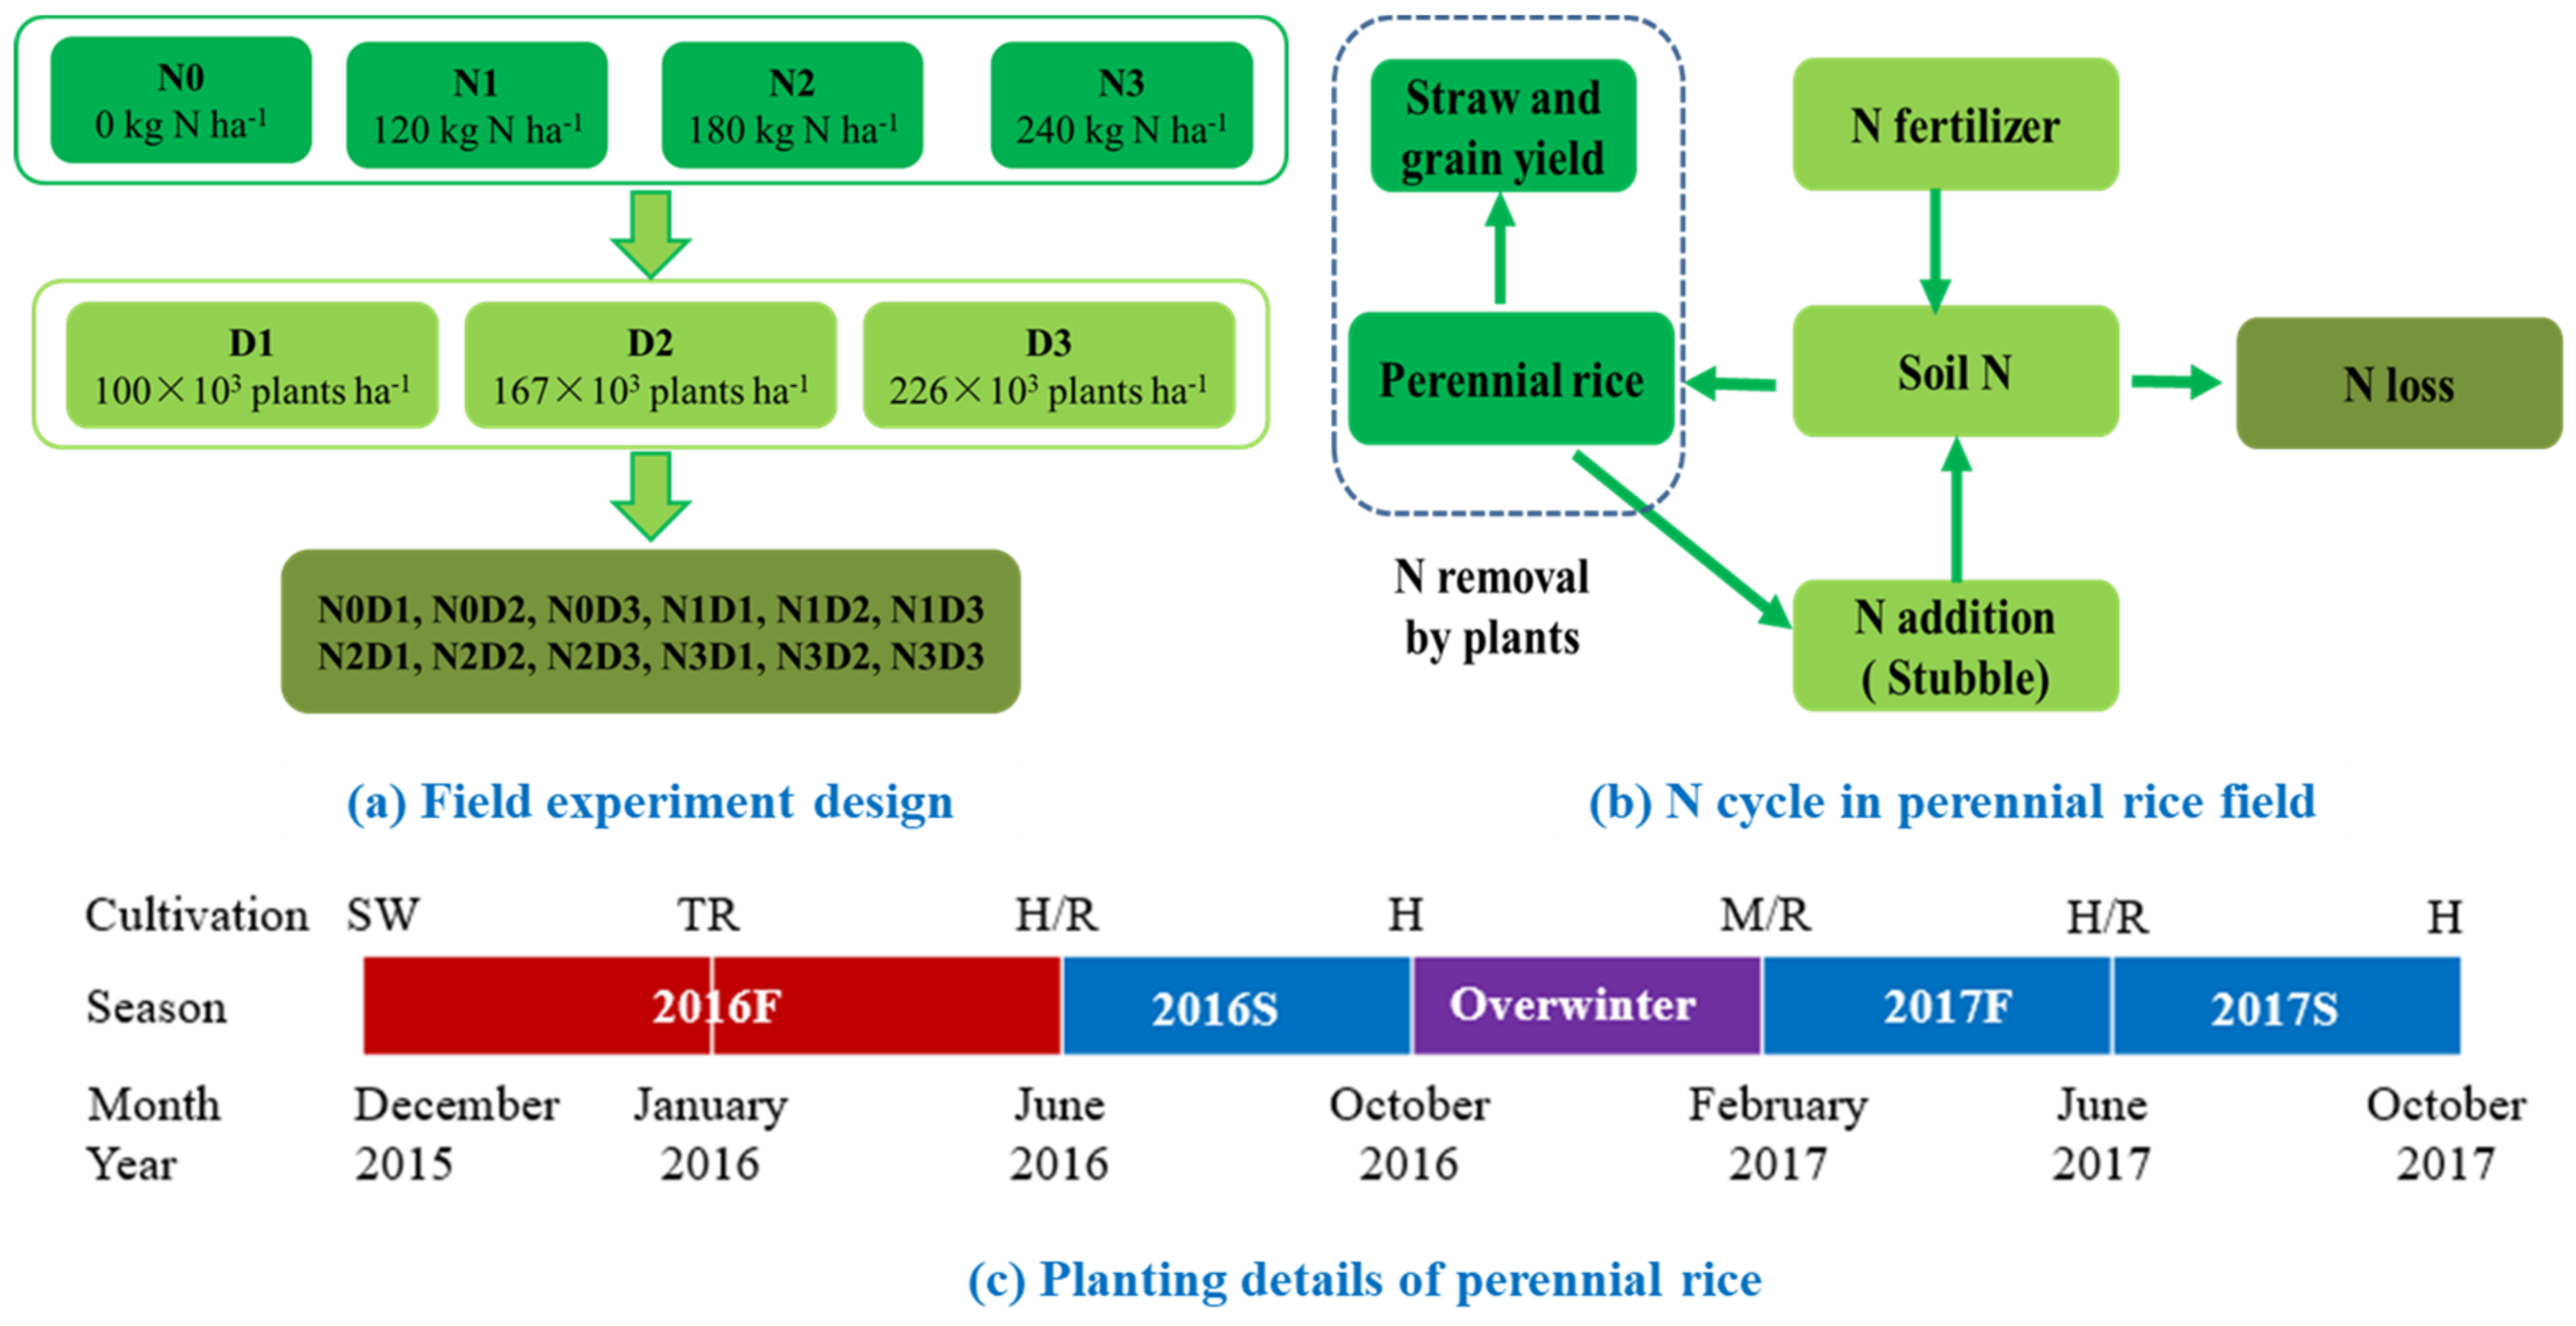
2.2. Experimental Design
2.2.1. Irrigation Regime
2.2.2. Field Management
Weeds Control
Pest Control
Disease Control
2.3. Sampling and Analytical Methods
2.3.1. Grain Yield
2.3.2. Soil and Plant Nitrogen
2.4. Statistical Analysis
3. Results
3.1. Yield
3.1.1. Grain Yield
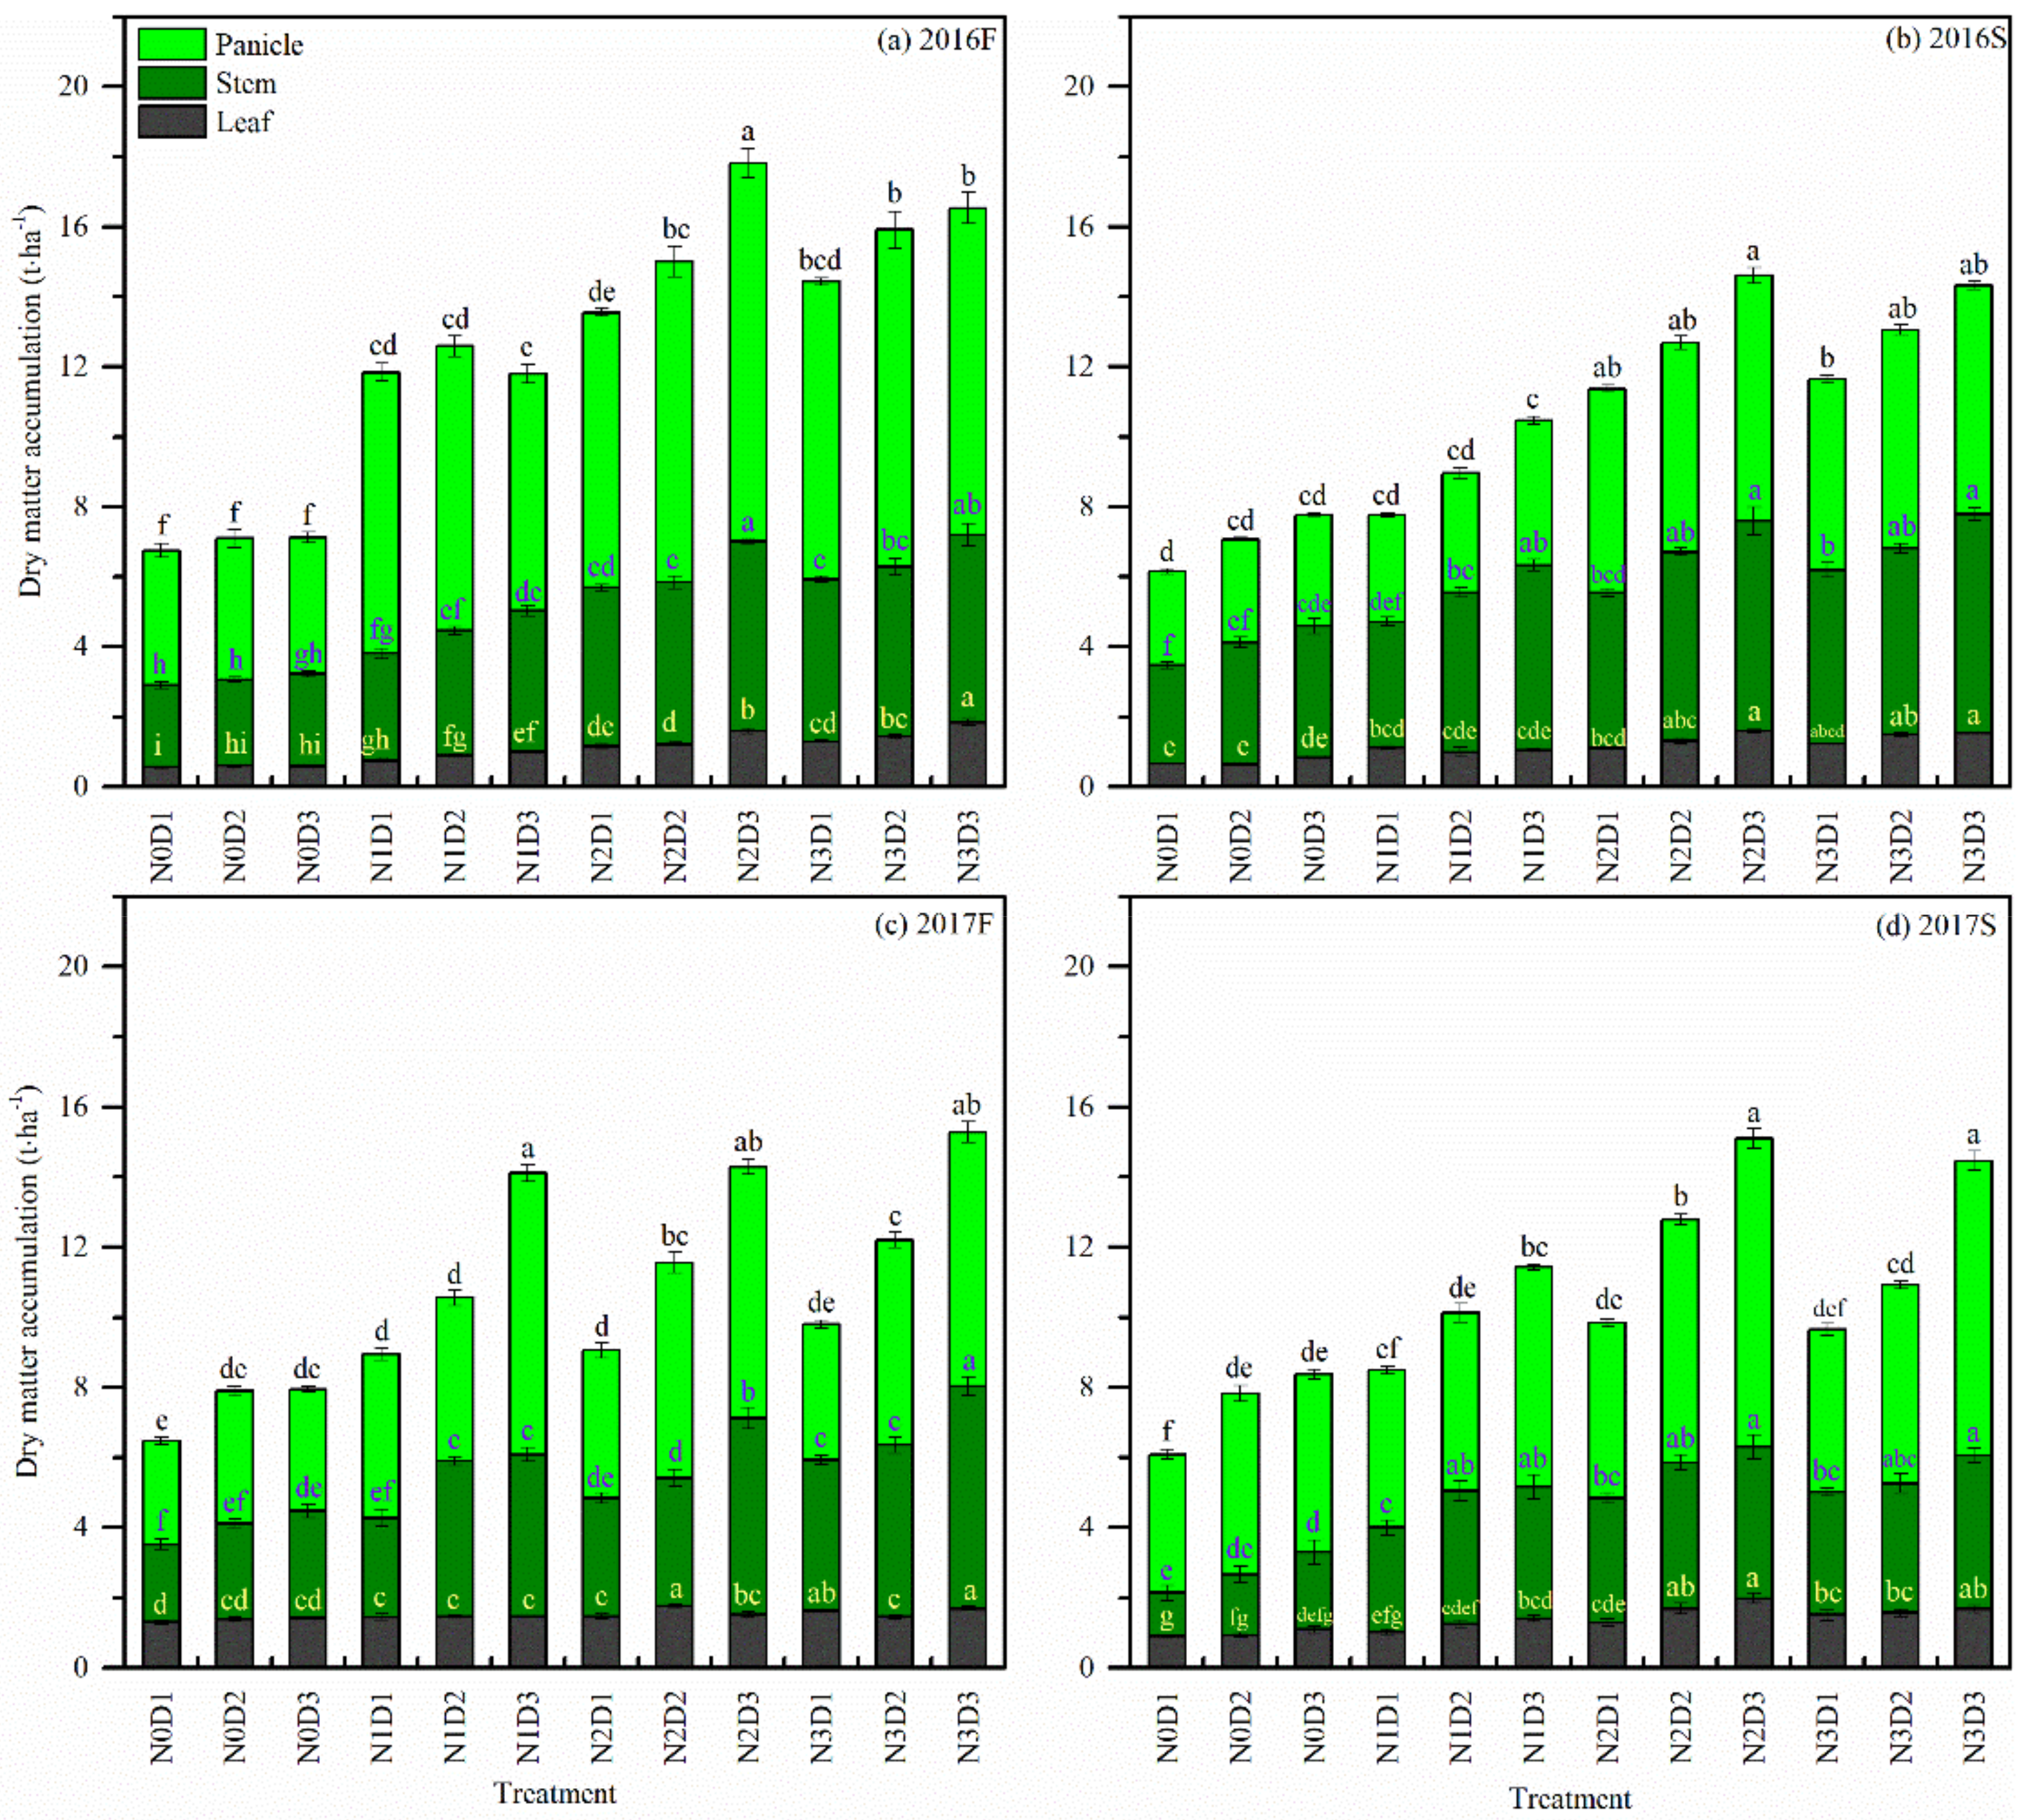
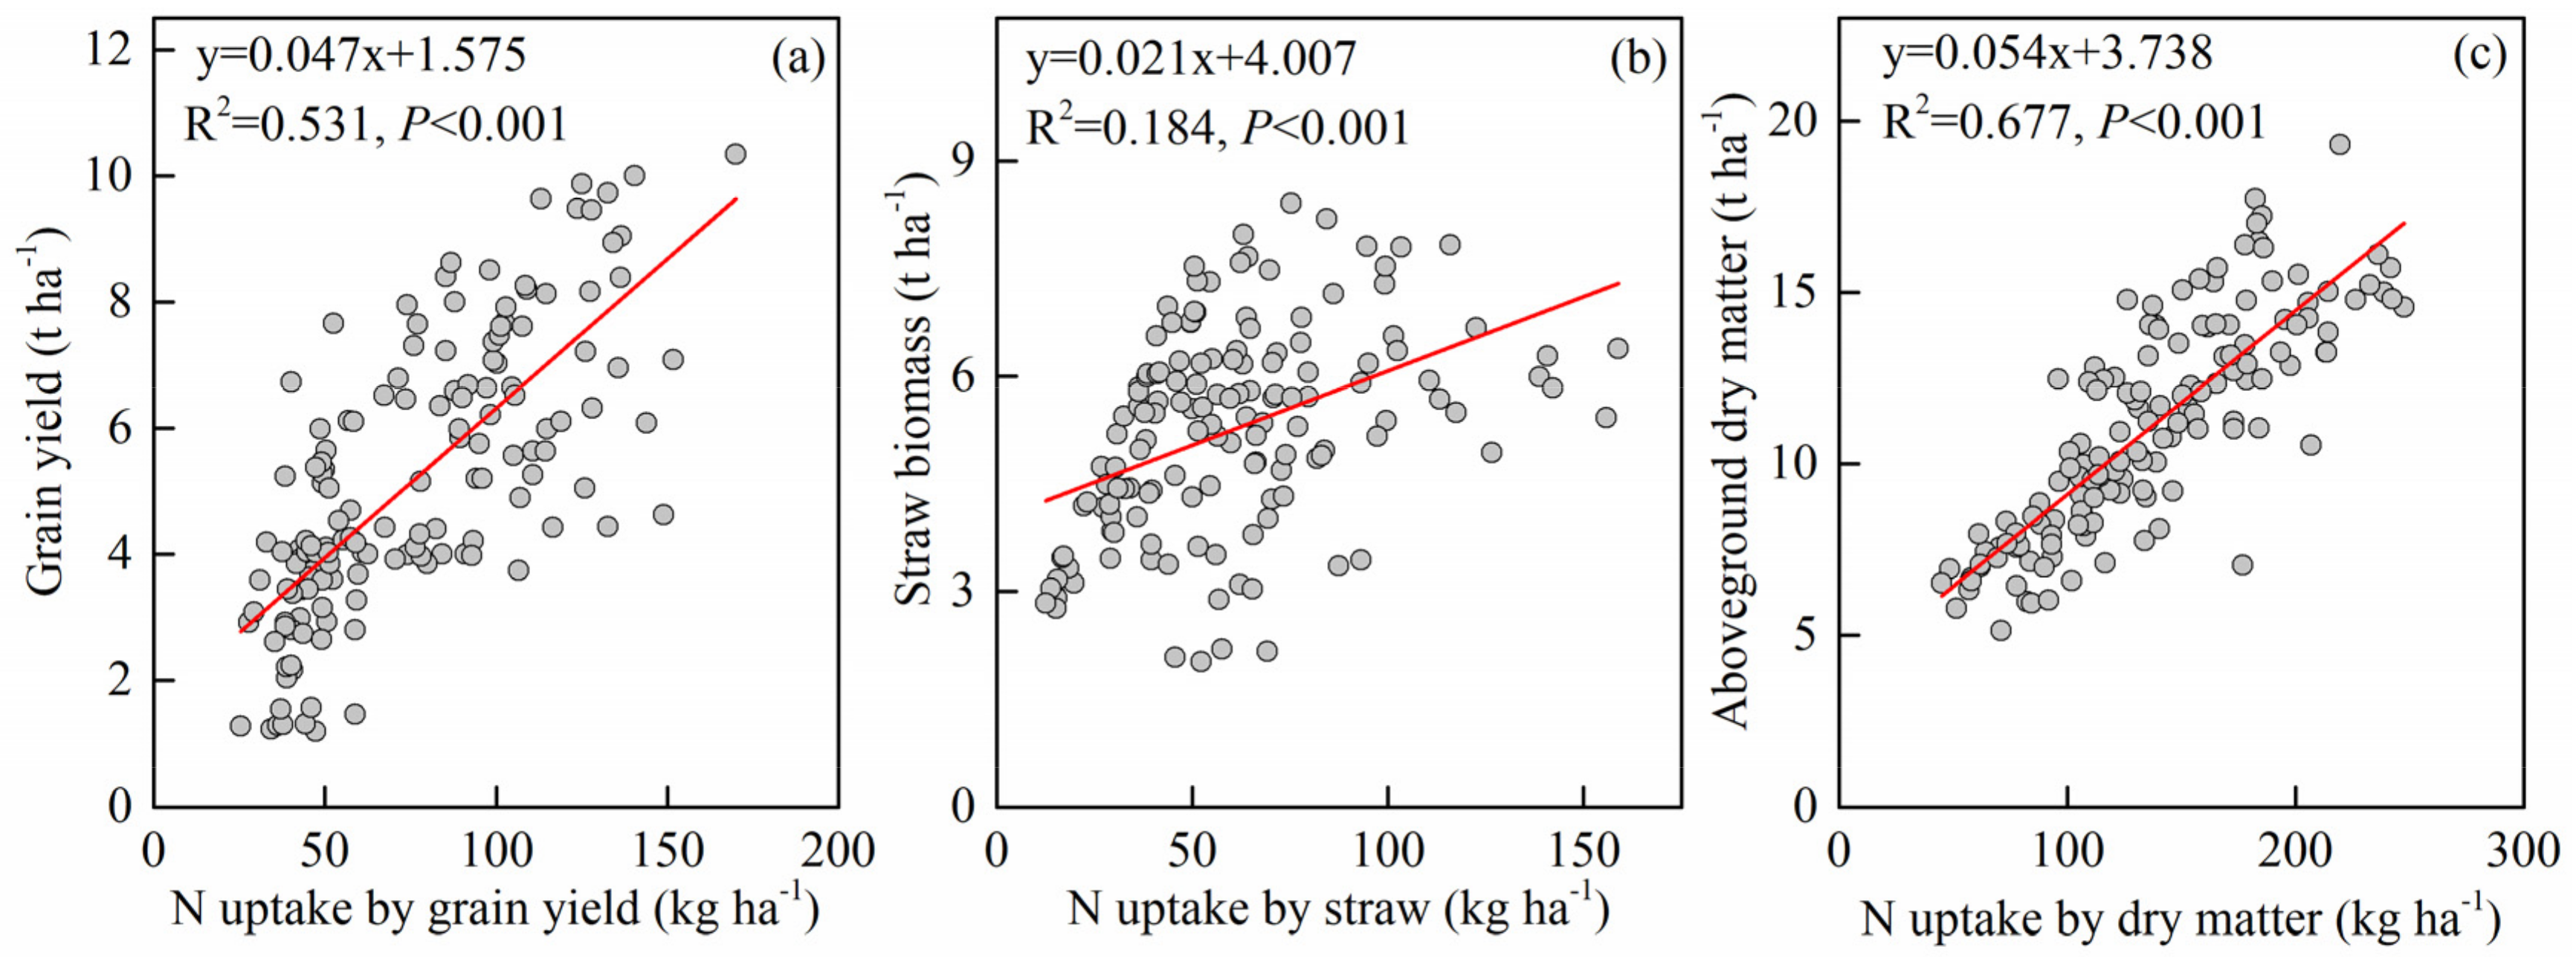
3.1.2. Dry Matter Accumulation
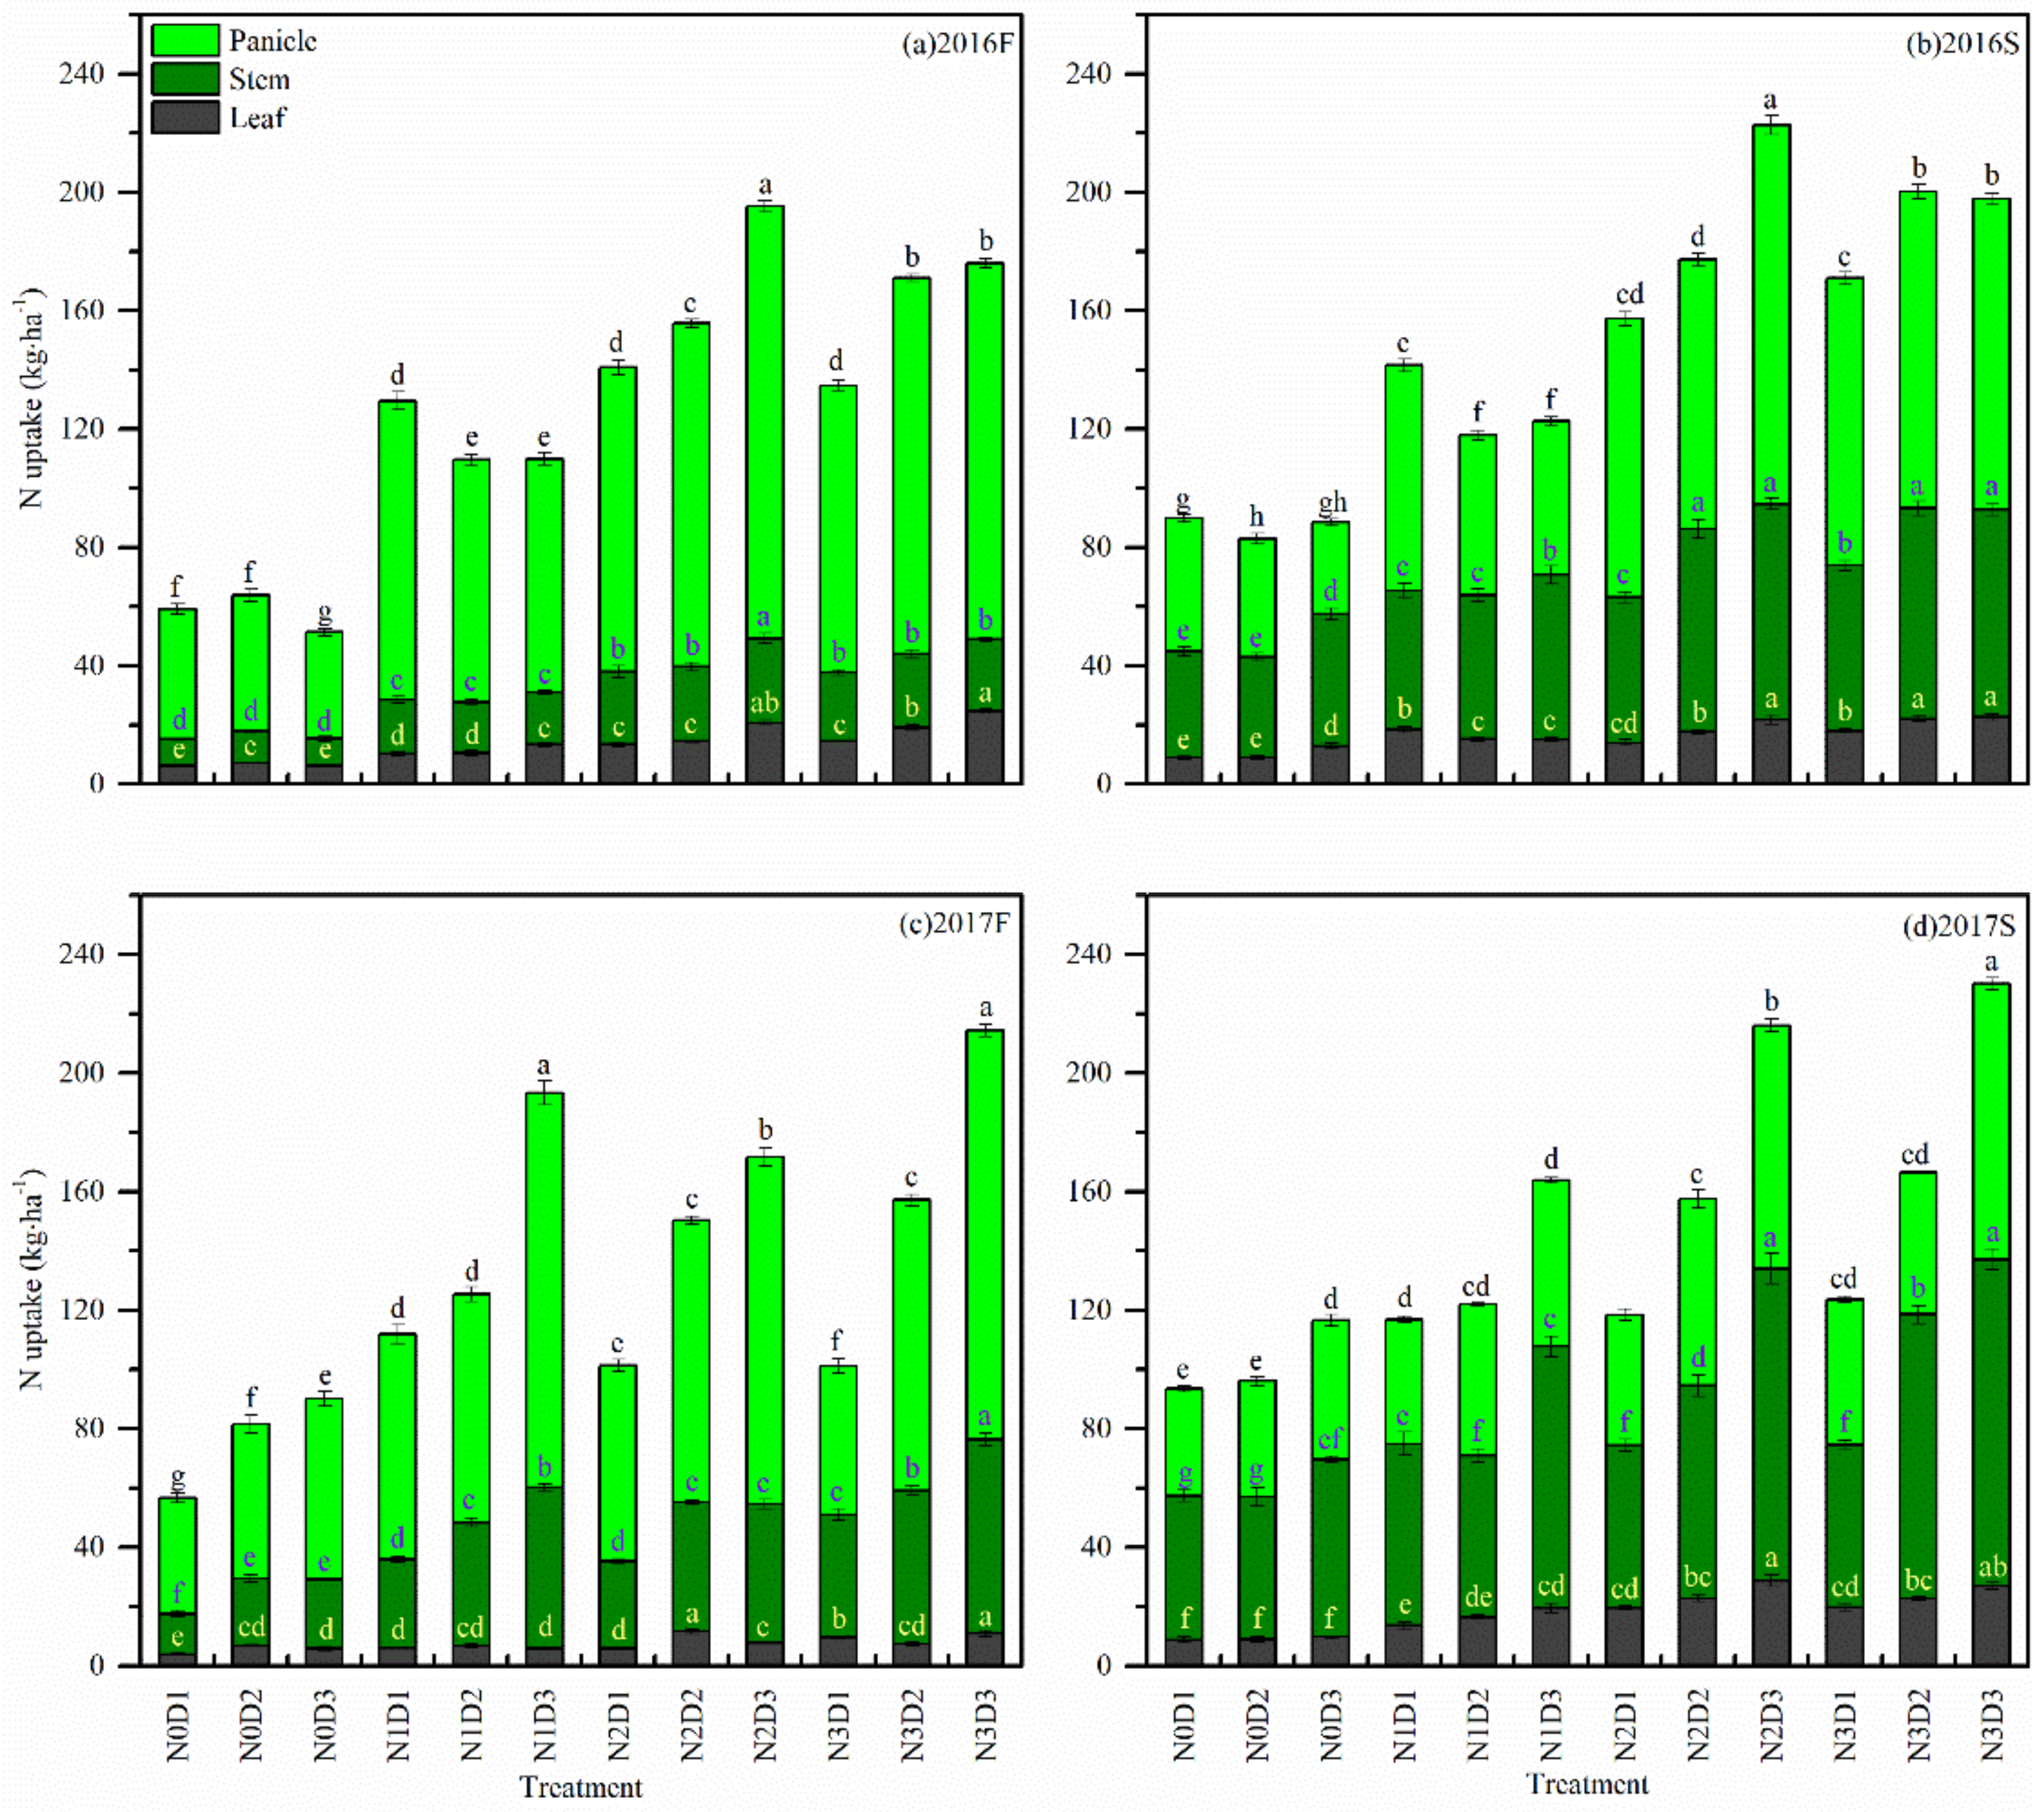
3.2. Plant N Uptake
3.3. Soil N Cycle
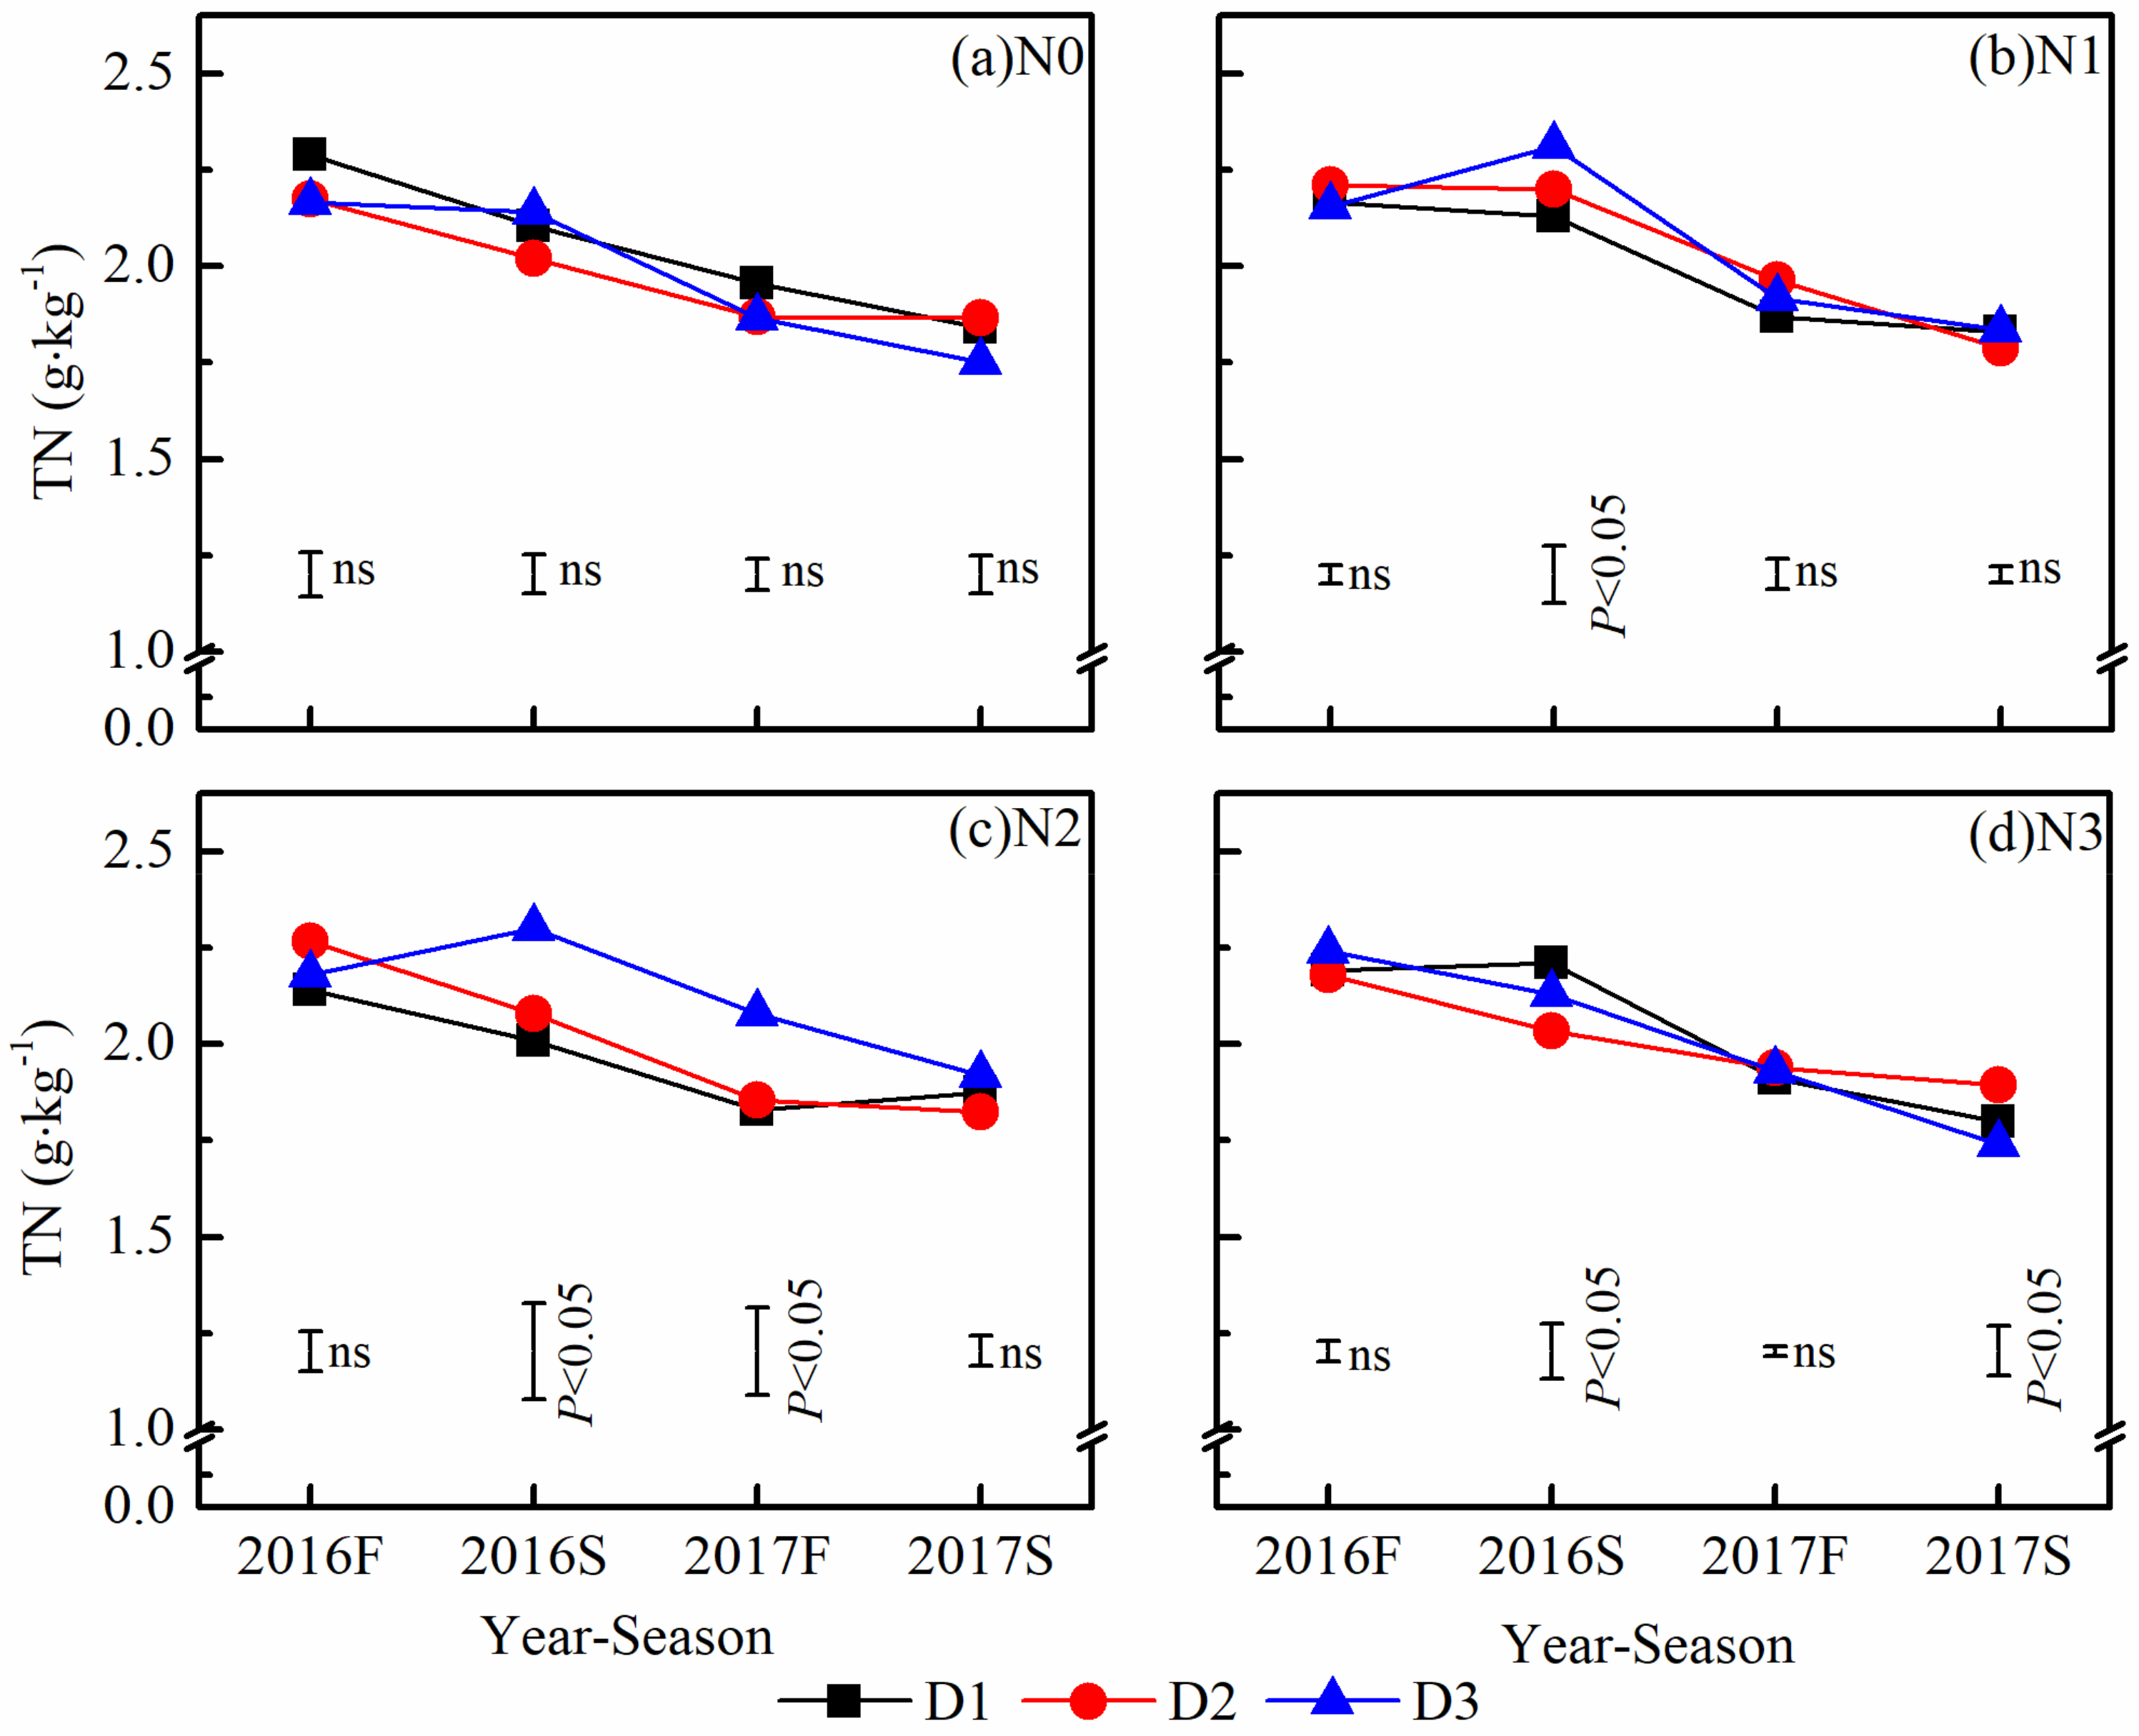
3.3.1. Soil N
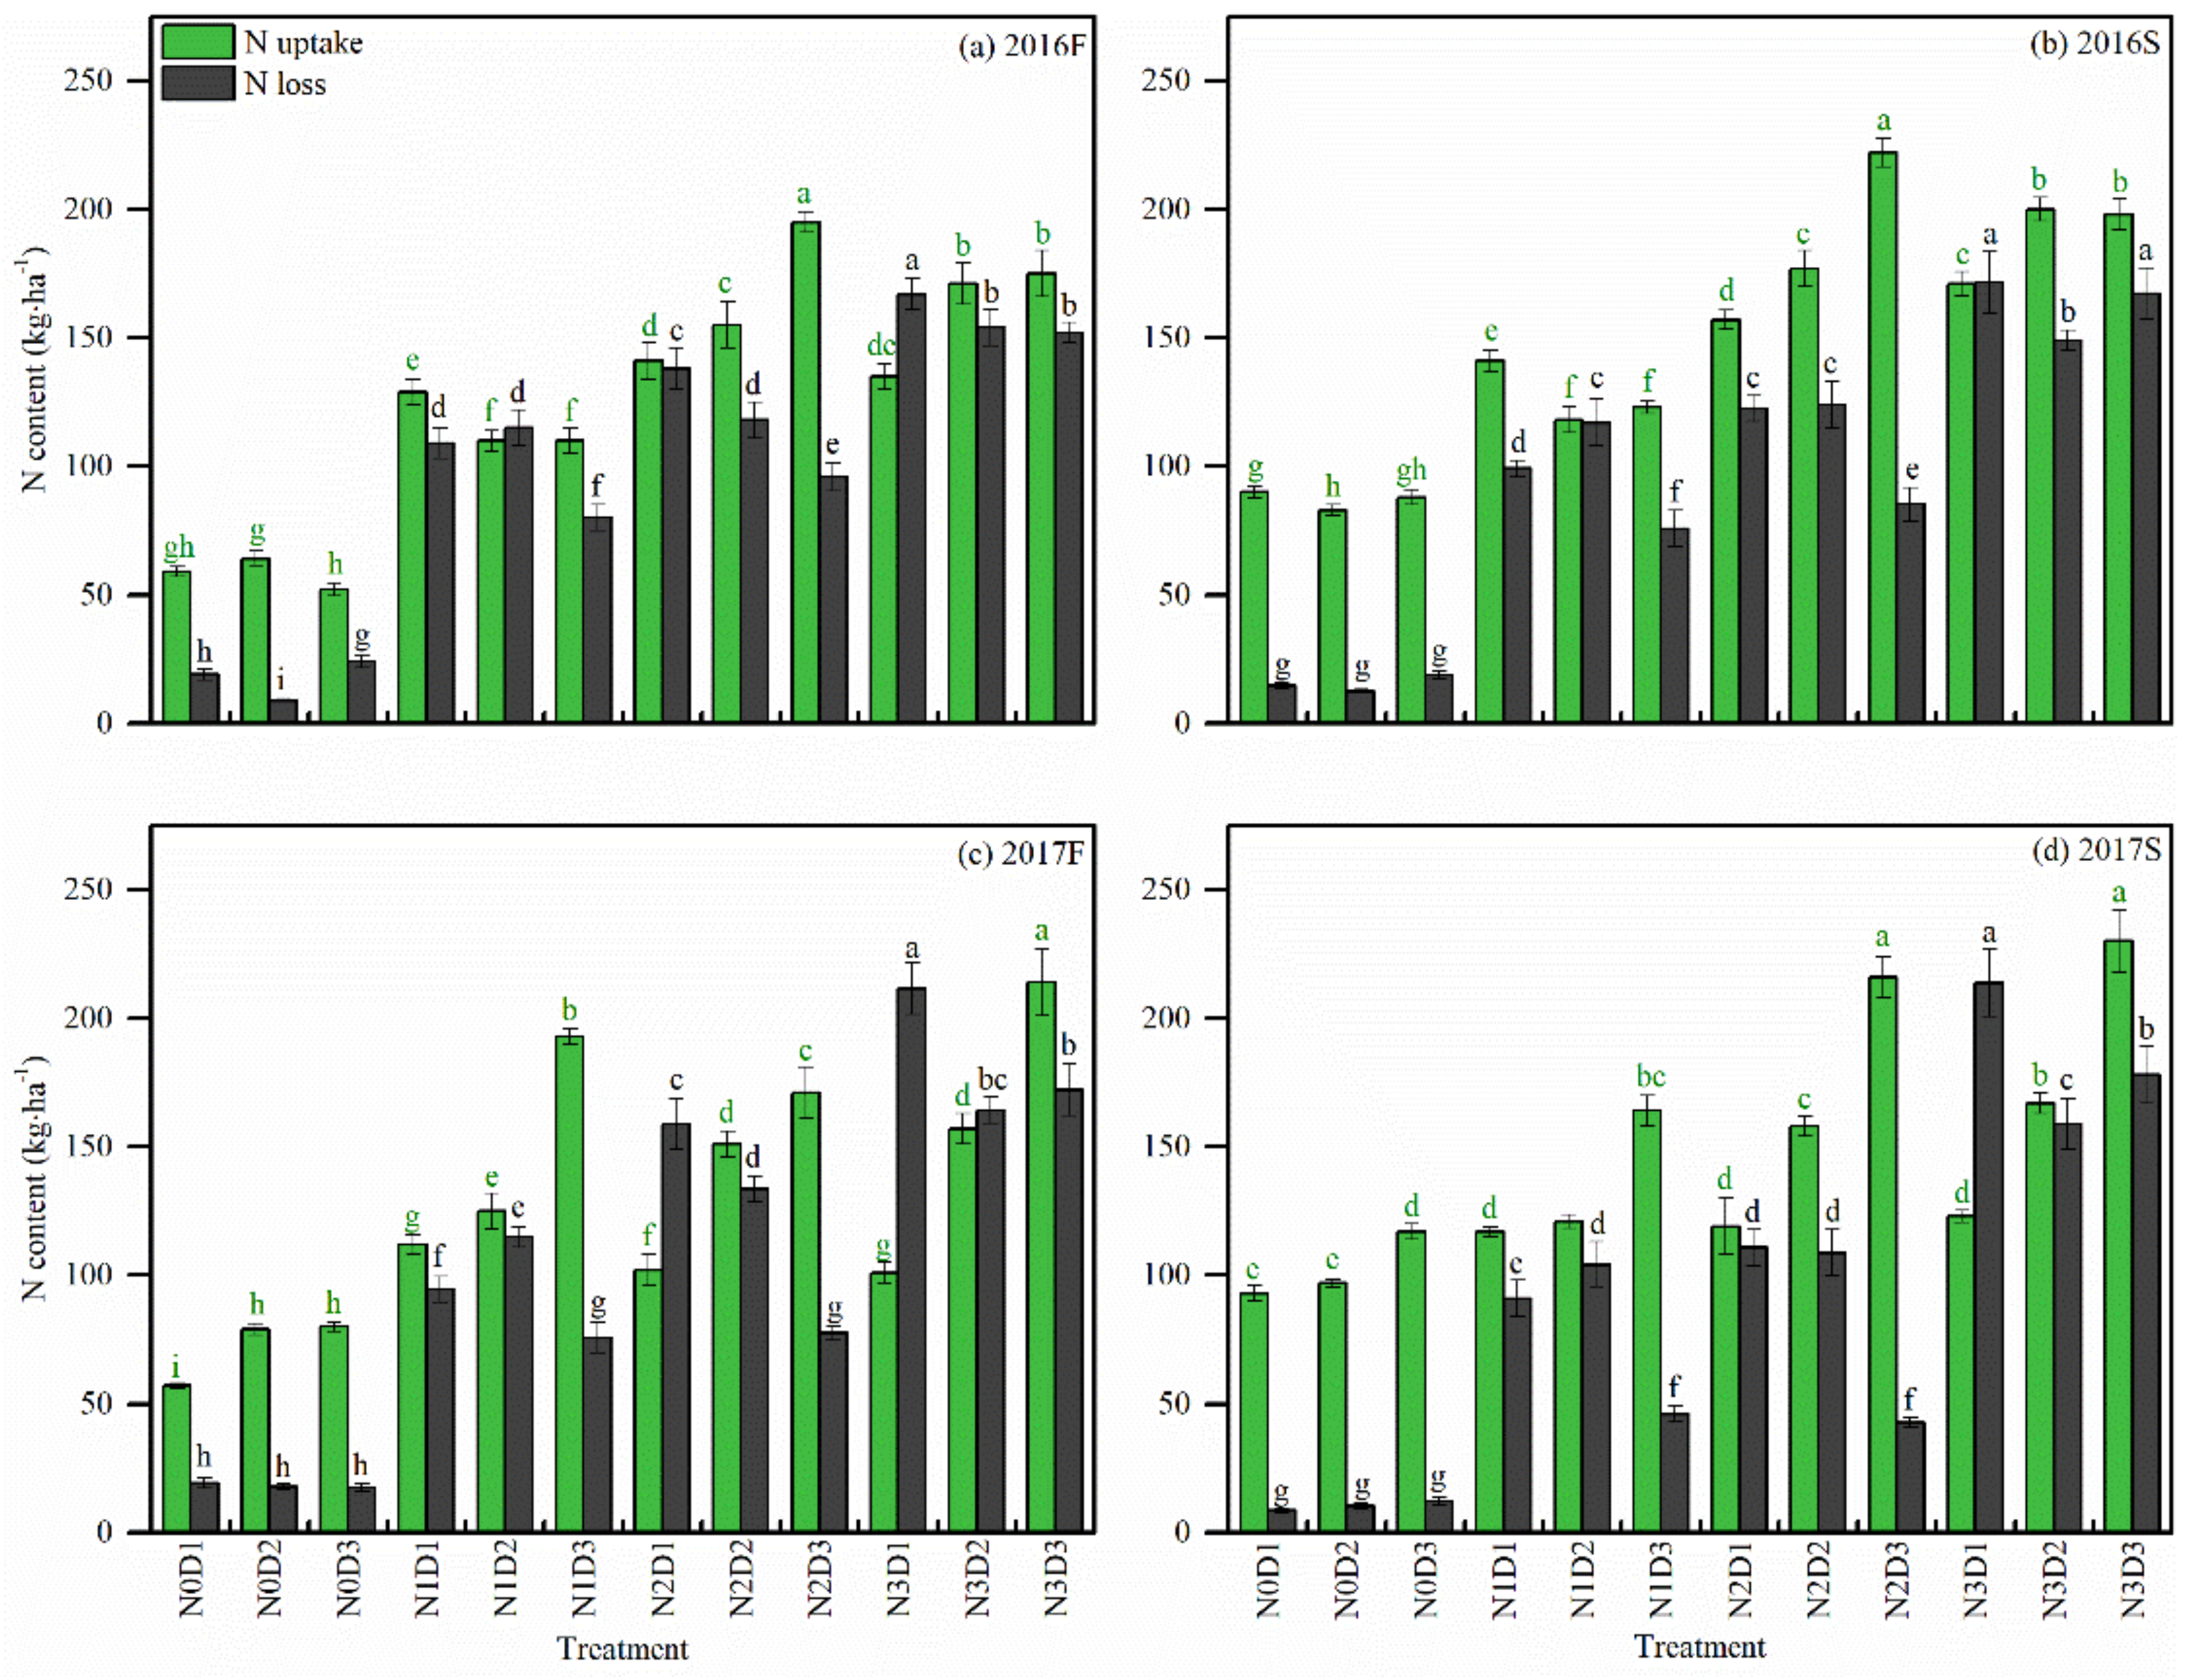
3.3.2. Soil N Removal and Loss
3.3.3. Apparent N Balance
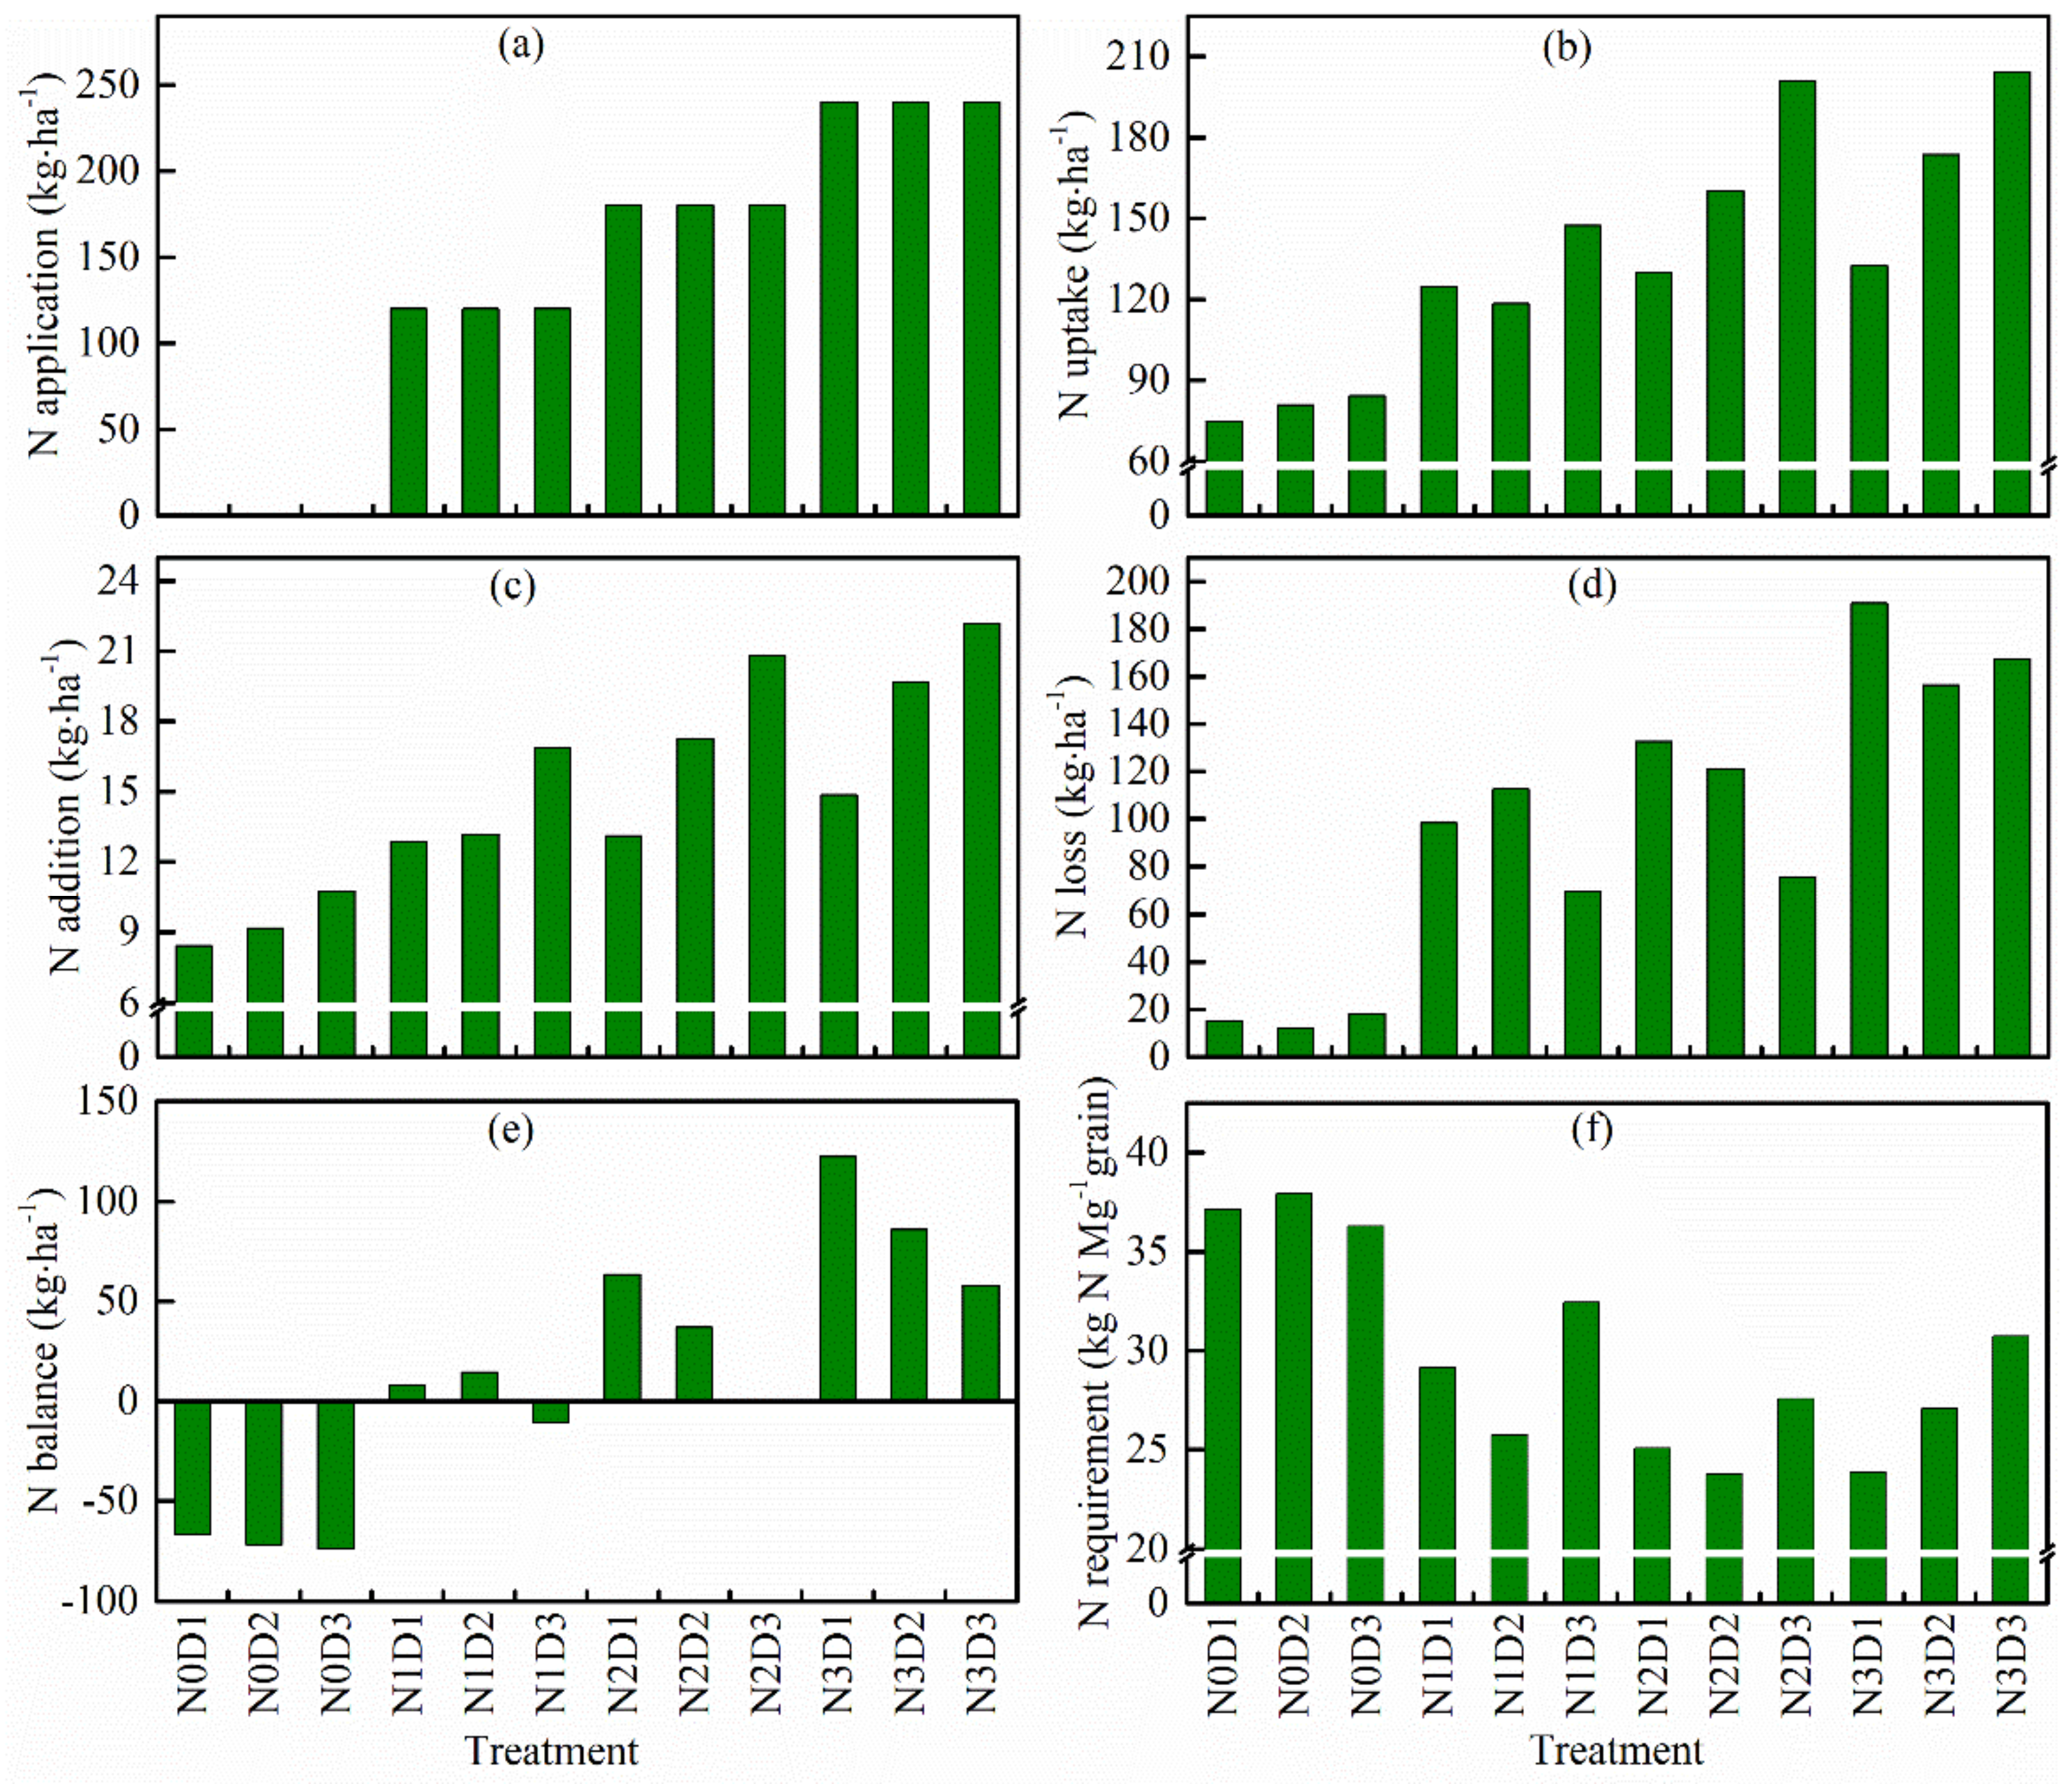
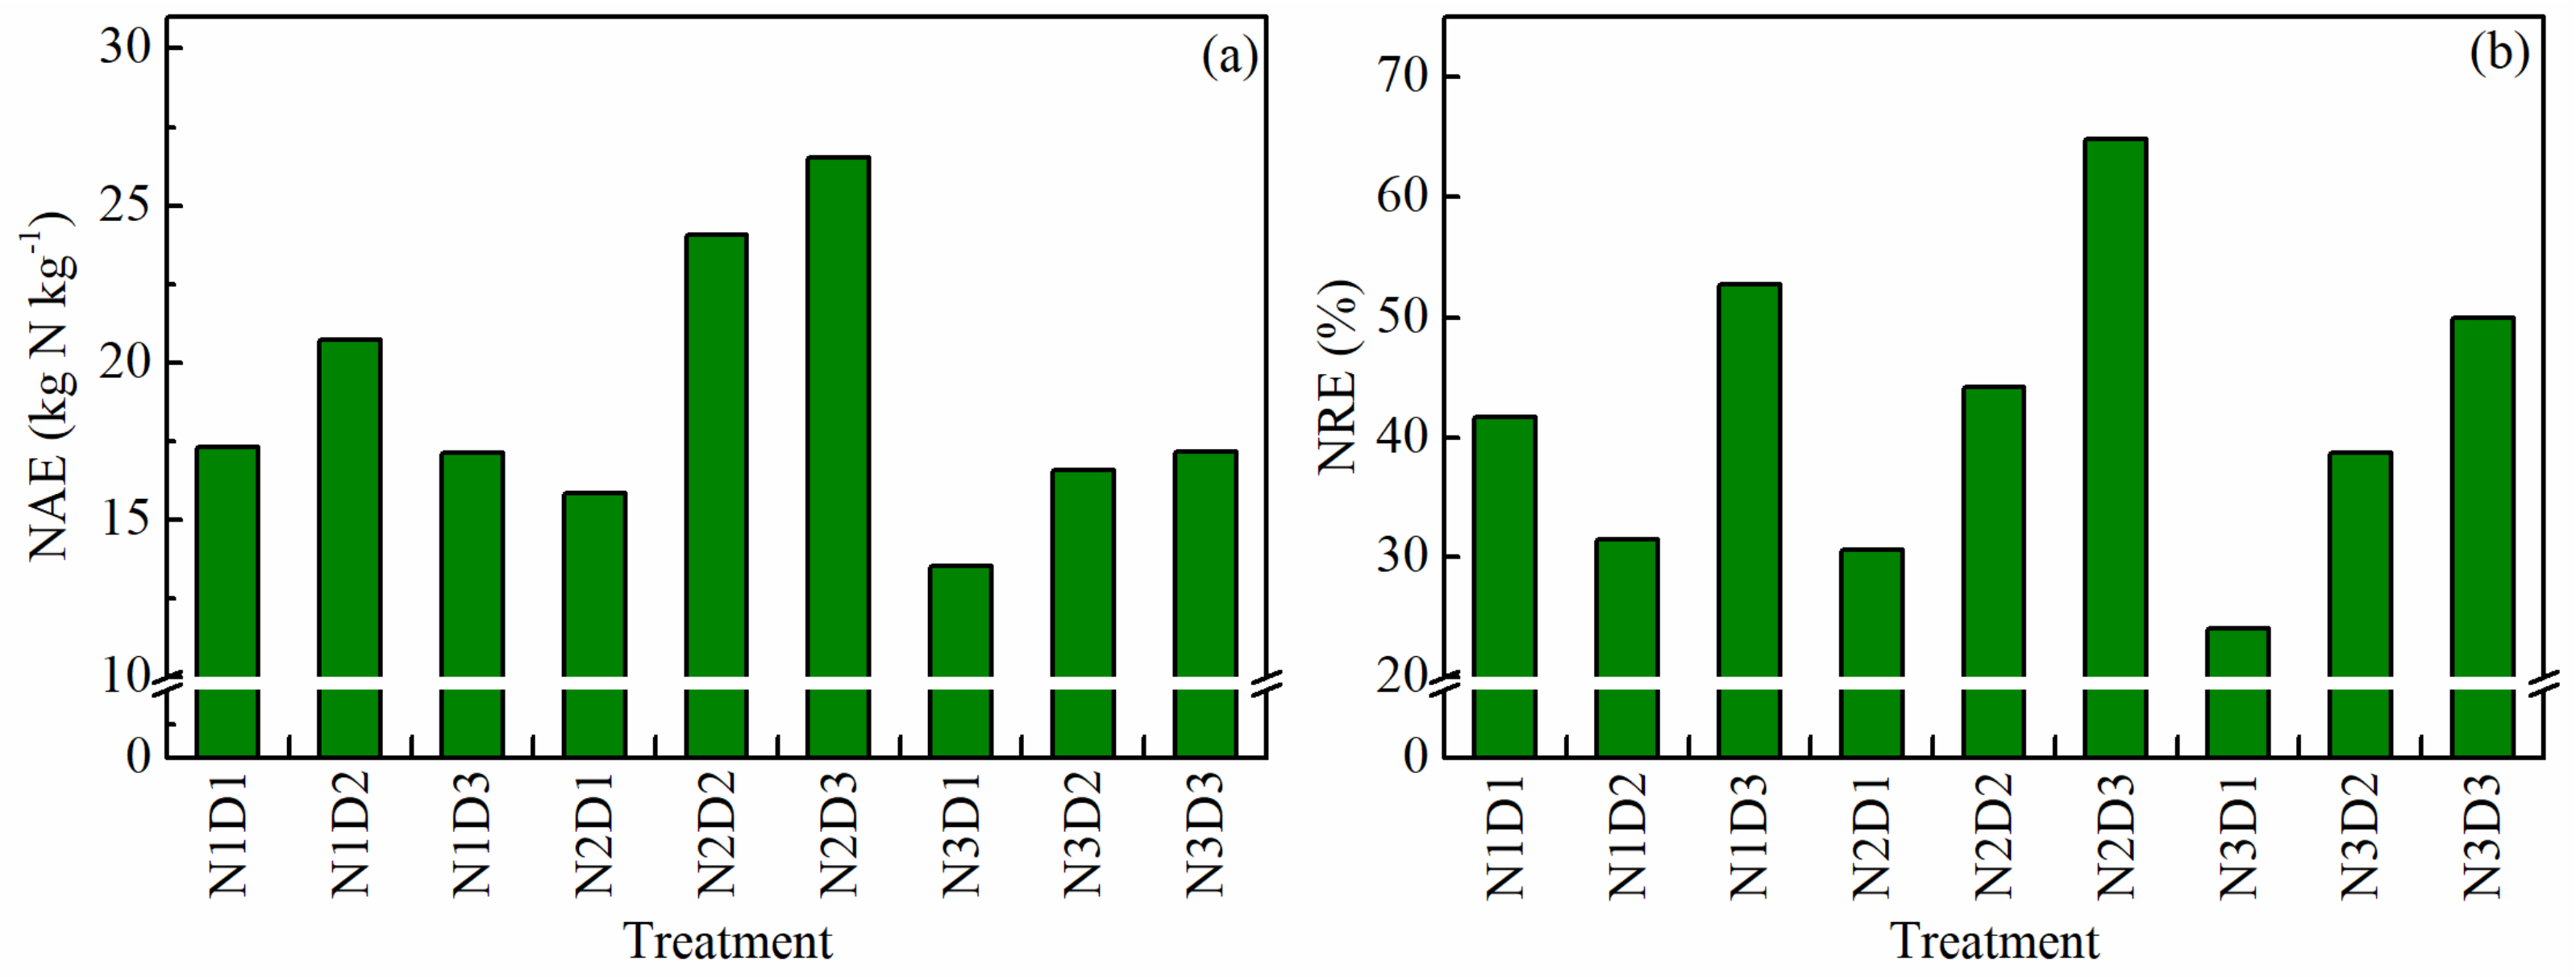
3.4. N Effects and Requirement
4. Discussion
4.1. Dry Matter Accumulation
4.2. Plants N Uptake and N Use Efficiency
4.3. N Cycle and Balance
5. Conclusions
Author Contributions
Funding
Data Availability Statement
Conflicts of Interest
References
- Godfray, H.C.J.; Beddington, J.R.; Crute, I.R.; Haddad, L.; Lawrence, D.; Muir, J.F.; Pretty, J.; Robinson, S.; Thomas, S.M.; Toulmin, C. Food security: The challenge of feeding 9 billion people. Science 2010, 327, 812–818. [Google Scholar] [CrossRef] [PubMed] [Green Version]
- Seck, P.A.; Diagne, A.; Mohanty, S.; Wopereis, M.S.C. Crops that feed the world 7: Rice. Food Secur. 2012, 4, 7–24. [Google Scholar] [CrossRef]
- Deng, N.; Grassini, P.; Yang, H.; Huang, J.; Cassman, K.G.; Peng, S. Closing yield gaps for rice self-sufficiency in China. Nat. Commun. 2019, 10, 1725. [Google Scholar] [CrossRef] [PubMed] [Green Version]
- Hayashi, S.; Kamoshita, A.; Yamagishi, J. Effect of planting density on grain yield and water productivity of rice (Oryza sativa L.) grown in flooded and non-flooded fields in Japan. Plant Prod. Sci. 2006, 9, 298–311. [Google Scholar] [CrossRef] [Green Version]
- Xu, X.; He, P.; Yang, F.; Ma, J.; Pampolino, M.F.; Johnston, A.M.; Zhou, W. Methodology of fertilizer recommendation based on yield response and agronomic efficiency for rice in China. Field Crops Res. 2017, 206, 33–42. [Google Scholar] [CrossRef]
- Naylor, R.L.; Liska, A.J.; Burke, M.B.; Falcon, W.P.; Gaskell, J.C.; Rozelle, S.D.; Cassman, K.G. The ripple effect: Biofuels, food security, and the environment. Environment 2007, 49, 30–43. [Google Scholar] [CrossRef] [Green Version]
- Liu, J.Y.; Liu, M.L.; Tian, H.Q.; Zhuang, D.F.; Zhang, Z.X.; Zhang, W.; Tang, X.M.; Deng, X.Z. Spatial and temporal patterns of China’s cropland during 1990–2000: An analysis based on Landsat TM data. Remote Sens. Environ. 2005, 98, 442–456. [Google Scholar] [CrossRef]
- Hou, W.F.; Khan, M.R.; Zhang, J.L.; Lu, J.W.; Ren, T.; Cong, R.H.; Li, X.K. Nitrogen rate and plant density interaction enhance radiation interception, yield, and nitrogen use efficiency of mechanically transplanted rice. Agric. Ecosyst. Environ. 2019, 269, 183–192. [Google Scholar] [CrossRef]
- Lutes, K.; Oelbermann, M.; Thevathasan, N.V.; Gordon, A.M. Effect of nitrogen fertilizer on greenhouse gas emissions in two willow clones (Salix miyabeana and S. dasyclados) in southern Ontario. Can. Agroforest Syst. 2016, 90, 785–796. [Google Scholar] [CrossRef]
- Li, P.F.; Lu, J.W.; Wang, Y.; Hussain, S.; Ren, T.; Cong, R.H.; Li, X.K. Nitrogen losses, use efficiency, and productivity of early rice under controlled-release urea. Agr. Ecosyst. Environ. 2018, 251, 78–87. [Google Scholar] [CrossRef]
- Jing, Q.; Bouman BA, M.; Hengsdijk, H.; Keulen, H.V.; Cao, W. Exploring options to combine high yields with high nitrogen use efficiencies in irrigated rice in China. Eur. J. Agron. 2007, 26, 166–177. [Google Scholar] [CrossRef]
- Zhang, Y.J.; Wang, S.L.; Wang, H.; Wang, R.; Wang, X.L.; Li, J. Crop yield and soil properties of dryland winter wheat-spring maize rotation in response to 10-year fertilization and conservation tillage practices on the Loess Plateau. Field Crops Res. 2018, 225, 170–179. [Google Scholar] [CrossRef]
- Huang, G.F.; Qin, S.W.; Zhang, S.L.; Cai, X.L.; Wu, S.K.; Dao, J.R.; Zhang, J.; Huang, L.Y.; Harnpichitvitaya, D.; Wade, L.J.; et al. Performance, economics, and potential impact of perennial rice PR23 relative to annual rice cultivars at multiple locations in Yunnan Province of China. Sustainability 2018, 10, 1086. [Google Scholar] [CrossRef] [Green Version]
- Aziz, I.; Mahmood, T.; Islam, K.R. Effect of long-term no-till and conventional tillage practices on soil quality. Soil Tillage Res. 2013, 131, 28–35. [Google Scholar] [CrossRef]
- Zhang, Y.J.; Huang, G.F.; Zhang, S.L.; Zhang, J.; Gan, S.X.; Cheng, M.; Hu, J.; Huang, L.Y.; Hu, F.Y. An innovated crop management scheme for perennial rice cropping system and its impacts on sustainable rice production. Eur. J. Agron. 2021, 122, 126186. [Google Scholar] [CrossRef]
- Zhang, S.L.; Hu, J.; Yang, C.D.; Liu, H.T.; Yang, F.; Zhou, J.H.; Samson, B.K.; Boualaphanh, C.; Huang, L.Y.; Huang, G.F.; et al. Genotype by environment interactions for grain yield of perennial rice derivatives (Oryza sativa L./Oryza longistaminata) in southern China and Laos. Field Crops Res. 2017, 207, 62–70. [Google Scholar] [CrossRef]
- Zhang, S.L.; Huang, G.F.; Zhang, J.; Huang, L.Y.; Cheng, M.; Wang, Z.L.; Zhang, Y.N.; Wang, C.L.; Zhu, P.F.; Yu, X.L.; et al. Genotype by environment interactions for the performance of perennial rice genotypes (Oryza sativa L./Oryza longistaminata) relative to annual rice genotypes over regrowth cycles and locations in southern China. Field Crops Res. 2019, 241, 107556. [Google Scholar] [CrossRef]
- Pimentel, D.; Cerasale, D.; Stanley, R.C.; Perlman, R.; Newman, E.M.; Brent, L.C.; Mullan, A.; Chang, D.T. Annual vs. perennial grain production. Agric. Ecosyst. Environ. 2012, 161, 1–9. [Google Scholar] [CrossRef]
- Wu, Q.; Wang, Y.Z.; Chen, T.T.; Zheng, J.L.; Sun, Y.D.; Chi, D.C. Soil nitrogen regulation using clinoptilolite for grain filling and grain quality improvements in rice. Soil Tillage Res. 2020, 199, 104547. [Google Scholar] [CrossRef]
- Tilman, D.; Balzer, C.; Hill, J.; Befort, B.L. Global food demand and the sustainable intensification of agriculture. Proc. Natl. Acad. Sci. USA 2011, 108, 20260–20264. [Google Scholar] [CrossRef] [Green Version]
- Zhang, X.; Davidson, E.A.; Mauzerall, D.L.; Searchinger, T.D.; Dumas, P.; Shen, Y. Managing nitrogen for sustainable development. Nature 2015, 528, 51–59. [Google Scholar] [CrossRef] [Green Version]
- Tan, C.J.; Cao, X.; Yuan, S.; Wang, W.Y.; Feng, Y.Z.; Qiao, B. Effects of long-term conservation tillage on soil nutrients in sloping fields in regions characterized by water and wind erosion. Sci. Rep. 2015, 5, 17592. [Google Scholar] [CrossRef] [Green Version]
- Yin, Y.L.; Ying, H.; Zheng, H.F.; Zhang, Q.S.; Xue, Y.F.; Cui, Z.L. Estimation of N.P.K. requirements for rice production in diverse Chinese environments under optimal fertilization rates. Agric. For. Meteorol. 2019, 279, 107756. [Google Scholar] [CrossRef]
- Wang, B.; Guo, C.; Wan, Y.F.; Li, J.L.; Ju, X.T.; Cai, W.W.; You, S.C.; Qin, X.B.; Wilkes, A.; Li, Y.E. Air warming and CO2 enrichment increase N use efficiency and decrease N surplus in a Chinese double rice cropping system. Sci. Total Environ. 2020, 706, 136063. [Google Scholar] [CrossRef]
- Wang, Z.; Wang, Z.; Luo, Y.; Zhan, Y.N.; Meng, Y.L.; Zhou, Z.G. Biochar increases 15N fertilizer retention and indigenous soil N uptake in a cotton-barley rotation system. Geoderma 2020, 357, 113944. [Google Scholar] [CrossRef]
- Ahmed, S.; Humphreys, E.; Salim, M.; Chauhan, B.S. Growth, yield, and nitrogen use efficiency of dry-seeded rice as influenced by nitrogen and seed rates in Bangladesh. Field Crops Res. 2016, 186, 18–31. [Google Scholar] [CrossRef]
- Sharma, P.; Singh, A.; Kahlon, C.S.; Brar, A.S.; Grover, K.K.; Dia, M.; Steiner, R.L. The role of cover crops towards sustainable soil health and agriculture—A review paper. Am. J. Plant Sci. 2018, 9, 1935–1951. [Google Scholar] [CrossRef] [Green Version]
- Chen, H.F.; Feng, Y.; Cai, H.M.; Xu, F.S.; Zhou, W.; Liu, F.; Pang, Z.M.; Li, D.R. Effect of the interaction of nitrogen and transplanting density on the rice population structure and grain yield in low-yield paddy fields. J. Plant Nutr. Fertil. 2014, 20, 1319–1328. [Google Scholar]
- Gardner, J.B.; Drinkwater, L.E. The fate of nitrogen in grain cropping systems: A meta-analysis of 15N field experiments. Ecol. Appl. 2019, 19, 2167–2184. [Google Scholar] [CrossRef]
- Chen, X.P.; Cui, Z.L.; Vitousek, P.M.; Zhang, F.S. Integrated soil-crop system management for food security. Proc. Natl. Acad. Sci. USA 2011, 108, 6399–6404. [Google Scholar] [CrossRef] [Green Version]
- Cui, Z.L.; Zhang, H.Y.; Chen, X.P.; Zhang, C.C.; Ma, W.Q.; Huang, C.D.; Zhang, W.F.; Mi, G.H.; Miao, Y.X.; Li, X.L.; et al. Pursuing sustainable productivity with millions of smallholder farmers. Nature 2018, 555, 363–366. [Google Scholar] [CrossRef]
- Ladha, J.K.; Pathak, H.J.; Krupnik, T.; Six, J.; van Kessel, C. The efficiency of fertilizer nitrogen in cereal production: Retrospects and prospects. Adv. Agron. 2005, 87, 85–156. [Google Scholar]
- Zhang, L.; Zhou, L.H.; Wei, J.B.; Xu, H.Q.; Tang, Q.Y.; Tang, J.W. Integrating cover crops with chicken grazing to improve soil nitrogen in rice field and increase economic output. Sci. Total Environ. 2020, 713, 135218. [Google Scholar] [CrossRef]
- Xie, Z.B.; Xu, Y.P.; Liu, G.; Liu, Q.; Zhu, J.G.; Tu, C.; Amonette, J.E.; Cadisch, G.; Yong, J.W.H.; Hu, S.J. Impact of biochar application on nitrogen nutrition of rice, greenhouse-gas emissions, and soil organic carbon dynamics in two paddy soils of China. Plant Soil 2013, 370, 527–540. [Google Scholar] [CrossRef]
- Cassman, K.G.; Dobermann, A.; Walters, D.T. Agroecosystems, nitrogen-use efficiency, and nitrogen management. Ambio 2002, 31, 132–140. [Google Scholar] [CrossRef]
- Quan, Z.; Li, S.L.; Zhang, X.; Zhu, F.F.; Li, P.P.; Sheng, R.; Chen, X.; Zhang, L.M.; He, J.Z.; Wei, W.X.; et al. Fertilizer nitrogen use efficiency and fates in maize cropping systems across China: Field 15N tracer studies. Soil Tillage Res. 2020, 197, 104498. [Google Scholar] [CrossRef]
- Mulvaney, R.L.; Khan, S.A.; Ellsworth, T.R. Synthetic nitrogen fertilizers deplete soil nitrogen: A global dilemma for sustainable cereal production. J. Environ. Qual. 2009, 38, 2295–2314. [Google Scholar] [CrossRef] [Green Version]
- Ju, X.; Christie, P. Calculation of theoretical nitrogen rate for simple nitrogen recommendations in intensive cropping systems: A case study on the North China Plain. Field Crops Res. 2011, 124, 450–458. [Google Scholar] [CrossRef] [Green Version]


| Treatment | Leaf (t ha−1) | Stem (t ha−1) | Panicle (t ha−1) | Dry Matter (t ha−1) | Grain (t ha−1) |
|---|---|---|---|---|---|
| Season | |||||
| 2016F | 1.08 ± 0.43 b | 3.96 ± 1.18 b | 7.50 ± 2.39 a | 12.54 ± 3.96 a | 7.26 ± 2.15 a |
| 2016S | 1.13 ± 0.33 b | 4.65 ± 1.76 a | 4.71 ± 1.84 c | 10.49 ± 2.76 b | 4.42 ± 1.27 b |
| 2017F | 1.50 ± 0.13 a | 4.00 ± 1.64 b | 5.17 ± 1.43 bc | 10.68 ± 2.54 b | 4.76 ± 1.74 b |
| 2017S | 1.36 ± 0.47 a | 3.28 ± 1.04 c | 5.79 ± 1.89 b | 10.43 ± 2.75 b | 4.32 ± 2.05 b |
| N rates | |||||
| N0 | 0.91 ± 0.23 c | 2.55 ± 1.01 d | 3.75 ± 1.00 c | 7.22 ± 2.45 c | 2.69 ± 0.97 d |
| N1 | 1.16 ± 0.33 b | 3.88 ± 1.56 c | 5.56 ± 1.46 b | 10.59 ± 2.77 b | 4.90 ± 1.66 c |
| N2 | 1.47 ± 0.46 a | 4.59 ± 2.11 b | 7.07 ± 1.92 a | 13.14 ± 4.37 a | 6.68 ± 1.76 a |
| N3 | 1.54 ± 0.47 a | 4.87 ± 1.79 a | 6.78 ± 2.14 a | 13.19 ± 4.09 a | 6.48 ± 1.48 b |
| Planting density | |||||
| D1 | 1.16 ± 0.41 c | 3.40 ± 1.69 c | 4.94 ± 2.03 c | 9.49 ± 4.15 c | 4.59 ± 1.82 c |
| D2 | 1.26 ± 0.43 b | 3.96 ± 1.72 b | 5.80 ± 2.01 b | 11.02 ± 4.03 b | 5.34 ± 2.24 b |
| D3 | 1.40 ± 0.45 a | 4.56 ± 1.79 a | 6.63 ± 2.08 a | 12.59 ± 4.15 a | 5.64 ± 2.36 a |
| ANOVA | F-value | ||||
| S (df = 3) | 7.330 ** | 9.120 ** | 5.792 * | 2.729 (ns) | 15.599 *** |
| N (df = 3) | 17.185 *** | 54.708 *** | 11.529 ** | 28.399 *** | 36.502 *** |
| D (df = 2) | 12.319 ** | 22.538 ** | 10.116 * | 25.797 *** | 9.332 * |
| N × S (df = 9) | 4.303 ** | 4.041 ** | 5.639 *** | 9.051 *** | 9.047 *** |
| D × S (df = 6) | 1.391 (ns) | 4.129 ** | 2.701 * | 4.018 * | 4.071 ** |
| N × D (df = 6) | 1.524 (ns) | 2.979 * | 2.554 (ns) | 5.088 ** | 7.399 *** |
| N × D × S (df = 18) | 1.757 * | 1.040 (ns) | 2.967 *** | 1.916 * | 2.521 ** |
| Treatment | N Uptake (kg ha−1) | N Loss (kg ha−1) | Soil N (g kg−1) |
|---|---|---|---|
| Season | |||
| 2016F | 124.67 ± 47.33 a | 98.42 ± 54.93 a | 2.20 ± 0.05 a |
| 2016S | 147.33 ± 47.57 a | 96.46 ± 56.88 a | 2.14 ± 0.10 b |
| 2017F | 128.50 ± 48.85 a | 104.81 ± 65.72 a | 1.92 ± 0.07 c |
| 2017S | 143.50 ± 44.28 a | 90.40 ± 68.74 a | 1.83 ± 0.05 d |
| N rate | |||
| N0 | 79.92 ± 19.10 d | 12.29 ± 4.83 d | 2.00 ± 0.17 a |
| N1 | 130.25 ± 24.93 c | 93.52 ± 21.18 c | 2.03 ± 0.18 a |
| N2 | 163.67 ± 35.65 b | 109.67 ± 30.90 b | 2.03 ± 0.17 a |
| N3 | 170.17 ± 37.68 a | 171.60 ± 21.05 a | 2.02 ± 0.17 a |
| Planting density | |||
| D1 | 115.44 ± 42.45 c | 109.31 ± 57.50 a | 2.01 ± 0.17 a |
| D2 | 133.31 ± 40.93 b | 100.67 ± 56.05 b | 2.01 ± 0.16 a |
| D3 | 159.25 ± 41.59 a | 82.58 ± 51.20 c | 2.04 ± 0.17 a |
| ANOVA | F-value | ||
| S (df = 3) | 1.096 (ns) | 0.987 (ns) | 58.506 *** |
| N (df = 3) | 38.063 *** | 129.932 *** | 0.612 (ns) |
| D (df = 2) | 8.054 * | 24.154 ** | 0.759 (ns) |
| N × S (df = 9) | 3.514 * | 5.008 ** | 0.876 (ns) |
| D × S (df = 6) | 6.307 *** | 1.616 (ns) | 1.783 (ns) |
| N × D (df = 6) | 7.758 *** | 17.010 *** | 2.673 * |
| N × D × S (df = 18) | 2.585 ** | 2.289 ** | 4.560 *** |
Publisher’s Note: MDPI stays neutral with regard to jurisdictional claims in published maps and institutional affiliations. |
© 2022 by the authors. Licensee MDPI, Basel, Switzerland. This article is an open access article distributed under the terms and conditions of the Creative Commons Attribution (CC BY) license (https://creativecommons.org/licenses/by/4.0/).
Share and Cite
Huang, G.; Zhang, Y.; Zhang, S.; Zhang, J.; Hu, F.; Li, F. Density-Dependent Fertilization of Nitrogen for Optimal Yield of Perennial Rice. Agronomy 2022, 12, 1698. https://doi.org/10.3390/agronomy12071698
Huang G, Zhang Y, Zhang S, Zhang J, Hu F, Li F. Density-Dependent Fertilization of Nitrogen for Optimal Yield of Perennial Rice. Agronomy. 2022; 12(7):1698. https://doi.org/10.3390/agronomy12071698
Chicago/Turabian StyleHuang, Guangfu, Yujiao Zhang, Shilai Zhang, Jing Zhang, Fengyi Hu, and Fengmin Li. 2022. "Density-Dependent Fertilization of Nitrogen for Optimal Yield of Perennial Rice" Agronomy 12, no. 7: 1698. https://doi.org/10.3390/agronomy12071698
APA StyleHuang, G., Zhang, Y., Zhang, S., Zhang, J., Hu, F., & Li, F. (2022). Density-Dependent Fertilization of Nitrogen for Optimal Yield of Perennial Rice. Agronomy, 12(7), 1698. https://doi.org/10.3390/agronomy12071698