Article

Increasing the Environmental Sustainability of Greenhouse Vegetable Production by Combining Biochar Application and Drip Fertigation—Effects on Soil N2O Emissions and Carbon Sequestrations

1
College of Resources and Environmental Sciences, China Agricultural University, Beijing 100193, China
2
College of Life Science and Technology, Hubei Engineering University, Xiaogan 432000, China
3
Institute for Meteorology and Climate Research (IMK–IFU), Karlsruhe Institute of Technology, 82467 Garmisc-Partenkirchen, Germany
4
State Key Laboratory of Atmospheric Boundary Layer Physics and Atmospheric Chemistry, Institute of Atmospheric Physics, Chinese Academy of Sciences, Beijing 100029, China
5
Pioneer Center Land-CRAFT, Department of Agroecology, University of Aarhus, 8000 Aarhus, Denmark
*
Author to whom correspondence should be addressed.
Agronomy 2022, 12(7), 1661; https://doi.org/10.3390/agronomy12071661
Submission received: 21 June 2022 / Revised: 7 July 2022 / Accepted: 7 July 2022 / Published: 12 July 2022
(This article belongs to the Special Issue Application of Organic Amendments in Agricultural Production)

Abstract

:
Drip fertigation with reduced fertilizer and water inputs has been widely used in greenhouse vegetable production in China. However, farmers usually do not apply additional organic material with a high carbon content, although soil organic carbon (SOC) concentrations are mostly below the optimum level for vegetable production. Returning straw or biochar to fields is an effective strategy for sustainability and environmental friendliness. We tested whether drip fertigation, (DIF) combined with maize straw (DIF+S) or biochar (DIF+BC), is a suitable option to improve SOC sequestration over eight growing seasons, and how these options affect soil N2O emissions and yields or partial factor productivity of applied N (PFPN) of crops over three growing seasons. During the winter–spring growing season, DIF+BC significantly reduced soil N2O emission by 61.2% and yield-scaled N2O emission by 62.4%, while increasing the tomato yield and PFPN compared with DIF. Straw incorporation had similar trends but without significant effects. Conversely, straw and biochar incorporation increased N2O emission during the autumn–winter season. The structural equation model indicated N2O emission was dominantly driven by soil NH4+-N concentration, temperature and moisture. The N2O emission factor decreased significantly with increased PFPN. Moreover, the contribution of biochar to the increased SOC was approximately 78%, which was four times higher than that of straw incorporation. Overall, the results highlighted the potential of drip fertigation with biochar incorporation to mitigate N2O emissions, improve PFPN and significantly increase SOC storage, which could all contribute to maintaining environmental sustainability and soil quality of greenhouse vegetable production.

Graphical Abstract

1. Introduction

Vegetables are an essential part of the human diet and a remarkable source of vitamins and minerals. Vegetable fields account for approximately 7% of the total croplands globally, and China has become the largest vegetable-producing country in the world [1]. The greenhouses in China cover an area of approximately 4.7 million hectares [2]. However, greenhouse vegetable production, specifically in China, is generally characterized by the use of large inputs of fertilizer and irrigation water compared with other arable cropping systems [3,4,5]. In China, a common practice amongst farmers is the overuse of N fertilizer (>2000 kg N ha−1 yr−1) and irrigation water (>1200 mm yr−1) [6,7,8]. Such overuse results in low nitrogen and water use efficiencies, and it has a serious effect on the environment, leading to soil acidification [7,9], leaching of nitrate and dissolved organic nitrogen [10,11,12] and emission of the powerful greenhouse gas N2O [13,14,15]. The total annual N2O emissions from greenhouse vegetable production systems have been estimated to reach 50 kg N ha−1 yr−1 [8,14,15], with a global mean of approximately 12.4 kg N ha−1 yr−1 [5], which is 5–20 times higher than the mean soil N2O emissions from global arable cropping systems [16].
To improve the resource utilization efficiency and reduce the N2O emission and N leaching, an increasing number of farmers are using drip fertigation to produce vegetables in greenhouses in China [5,8,15]. However, this drip fertigation practice with a reduced rate of fertilization and irrigation may jeopardize fruit yields, as N or water may become limited for rapid crop growth, especially in sunken greenhouses with low soil organic carbon (SOC). The reason for the low SOC content is related to the construction of sunken greenhouses and the management of greenhouse vegetable cultivation. For construction, 0.5–2 m of autochthonous fertile topsoil is removed to build a north-facing back wall. This procedure exposes the subsoil, which originally shows SOC concentrations of <4.9 g kg−1 [6]. Although the SOC content could increase with decades of vegetable cultivation, it is still below the recommended optimum SOC value (25 g kg−1) [6,17,18]. In addition, the over use of fertilizer and irrigation water combined with high soil temperature, intensive cropping and vegetable residue removal resulted in more soil C decomposition than sequestration [19,20,21]. Moreover, as a result of low heterotrophic soil respiration rates that are intrinsically linked to SOC content, the CO2 concentrations in greenhouses during midday are often below atmospheric concentrations; such a phenomenon negatively affects crop productivity [22]. Therefore, improving SOC content is needed for the breakdown of the limited soil water and nutrient retention, as well as to release more CO2 for plant photosynthesis.
The application of straw is the preferred option, as it may not only improve SOC content and promote soil respiration but also alleviate soil acidification and promote high crop productivity [23,24]. However, given the relative high soil moisture and temperature values in greenhouses, the added straw is quickly mineralized and significant increases in SOC may only occur after decades of high rates of straw application [25,26,27]. In addition, straw application may stimulate soil N2O emissions through microbial nitrification and denitrification [28,29] and offset its advantages of increasing soil carbon sequestration [30].
Meanwhile, considering the risk of spreading soilborne fungi and pathogens to the next crop, the residues of vegetables grown in greenhouses could not be applied to soil and are usually completely removed at final harvest [31,32]. However, vegetable residues may be reapplied to vegetable soils if converted to biochar by pyrolysis at high temperatures. Biochar is a more recalcitrant organic material with higher organic carbon content than maize straw [33,34,35,36] and it has been found to have the potential to reduce greenhouse gas emissions when used as a soil amendment in agroecosystems [37,38,39]. Furthermore, biochar incorporation improves soil physical properties, such as the water-holding capacity [40] and aeration of soils [41,42], and provides an additional absorption capacity for mineral nutrients [33,43,44], which would be beneficial for plant growth under the drip fertigation practice. However, whether the application of biochar to greenhouse soils could significantly reduce soil N2O emission fails to reach an agreement [45,46,47], as they depend on soil temperature and residual mineral N content [37,38,48].
In North China, greenhouse vegetable production is usually across two different growing seasons namely, the winter–spring (WS) season (from the end of August to the end of January) and the autumn–winter (AW) season (from the end of February to the end of June). These two growing seasons involve large differences in soil temperature and residual soil mineral N content before transplanting [4,15] which would influence soil C and N cycling when organic material is added. Whether biochar or straw additions in combination with reduced rates of N fertilizers and irrigation water in different growing seasons could significantly reduce soil N2O emissions and improve vegetable yield and SOC content has not been widely focused on. Here, we report on an experiment comparing the effect of straw versus biochar application on soil N2O emissions over three growing seasons and SOC contents over a four-year period of eight growing seasons for greenhouse vegetable production systems, based on drip irrigation with optimized fertilization (DIF). As a control, DIF (380 kg N ha−1 season−1) was used without any additional application of straw or biochar. The implementation of drip fertigation with biochar incorporation was hypothesized to result in a significant reduction in soil N2O emissions, with dependence on environmental conditions related to different growing seasons. Moreover, biochar addition could result in a significantly higher SOC sequestration rate than straw addition, due to its low decomposability and the fact that its yields cannot be negatively affected.

2. Materials and Methods

2.1. Field Site and Experiment Design

The field experiment was conducted in a sunken solar greenhouse in Northern China (Tianjin, Wuqin District, 39°25′35′′ N, 116°57′18′′ E), which has been used since the beginning of 2016 (i.e., the start of the experiment) for the production of tomatoes. The greenhouse was built in 2011, and a former arable field was used for wheat and maize cropping. Since 2011, greenhouses have been used for tomato and cucumber cultivation using flood irrigation and fertilization [4]. The main climatic and soil properties of the study sites are presented in Table 1. In agreement with local farmers’ practices, tomatoes were cultivated during the WS (from the end of February to the end of June) and AW (from the end of August to the end of January) seasons, with both seasons separated by an approximately 1.5 month-long summer fallow period of August. The experiments covered the period from the beginning of 2016 to February 2020, that is, eight growing seasons (Table S1).
In the experiment, three different treatments were investigated, which are as follows:
(a)
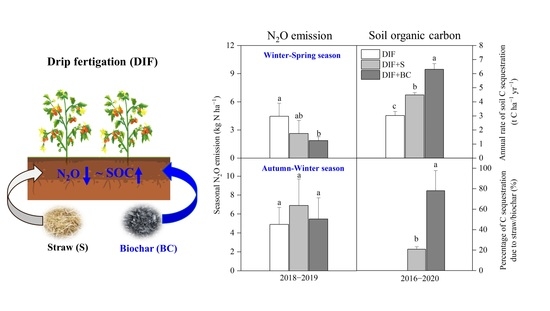
DIF: drip irrigation with reduced fertilization;
(b)
DIF+S: drip irrigation with reduced fertilization, plus the incorporation of maize straw;
(c)
DIF+BC: drip irrigation with reduced fertilization, plus the incorporation of biochar.
A randomized block design was used with three replicates; thus, nine plots were investigated. Each plot covered an area of 24 m2 (6.7 m × 3.6 m). Adjacent plots were separated by an impermeable plastic membrane, which was dug down to a soil depth of 0.6 m. Each plot consisted of three raised beds (0.7 m in width), plus walkways (0.5 m in width) in between. One raised bed was used for soil and plant sampling, whilst the other two were used for greenhouse gas flux measurements or determination of fruit yields. Two rows of tomato were planted in each raised bed, with a row spacing of 0.5 m and a plant spacing of 0.35 m. Two drip lines (2 cm in diameter) were laid on the soil surface close to the tomato plants, with drip emitters spaced every 0.4 m. Each emitter allowed for a mean flow rate of 3.19 ± 0.07 L h−1.
All plots were managed in the same manner for fertilization and irrigation. Fertilization management consisted of basal fertilization and fertigation during the growth period. At the beginning of each growing season, 200 kg N ha−1 commercial chicken manure (1.45% N and 13.2% C, δ13C = −21.83‰ ± 0.061‰) was incorporated into the top 20 cm of the soil as basal fertilization 2 days before transplanting. Immediately following transplantation, all plots received initial flood irrigation with 50–100 mm of water to ensure the survival of tomato seedlings. Drip fertigation started 20 days after transplanting, with rates of fertigation depending on weather conditions and the tomato growth stage. On sunny days, the drip fertigation rate was 3–5 mm of irrigation water with 2.0–4.0 kg N ha−1 of water-soluble chemical fertilizer (N:P2O5:K2O, 19:8:27) (Figure 1a and Table S1). In agreement with farmers’ practices and following transplanting, all treatment plots were covered with a plastic film (10 μm thick) to reduce soil evaporation losses and increase soil temperatures. Details of the fertilization and irrigation schemes in the eight growing seasons are provided in the Supplementary Materials (Table S1).
DIF treatment did not receive any C input in addition to the C applied with the chicken manure (1821 kg C ha−1 season−1, Table 2), DIF+S treatment received an additional 3500 kg C ha−1 season−1 of maize straw while DIF+BC received 2100 kg C ha−1 season−1 of biochar (Table 2), which was based on 40% of the organic carbon that was assumed to be lost during the conversion of peanut husks to biochar. Therefore, from the perspective of carbon balance, the initial carbon inputs of DIF+S and DIF+BC remained essentially the same. As there is no biochar produced from vegetable residues on the market, peanut husks biochar commonly found in the market was used in this study. Maize straw and biochar were incorporated with chicken manure (basal fertilizer) into the top 20 cm of soil. The total C and N concentrations in maize straw were 41.6% and 0.96%, respectively. The δ13C signal of maize straw was −14.18‰ ± 0.055‰ (Table 2). The total C and N concentrations of the commercial biochar (Golden Future Agriculture Technology Co., Ltd., Anshan, China), which were derived from peanut husks, were 54.8% and 1.08%, respectively, with the C fraction showing δ13C of −24.37‰ ± 0.019‰. The pH of biochar was 9.2 ± 0.1, measured in distilled water at a w/w ratio of 1:5 (Table 2).

2.2. Measurement of Soil N2O Emission

Soil N2O fluxes were measured in only three out of eight growing seasons, specifically from March 2018 to July 2019 (2018WS, 2018AW, and 2019WS). Moreover, soil N2O fluxes were measured during the 6-week fallow period in the summer of 2018 by using the static vented chamber method described by Yao et al. (2019) [14]. A stainless-steel frame (50 × 50 cm) was inserted into the soil to a depth of 25 cm in each plot directly following field preparation and 2–3 days before vegetable transplanting. Each frame contained one tomato plant. For flux measurements, a chamber was fixed tightly on the metal frame, with the height of the chamber varying between 60 and 120 cm, depending on plant growth. Flux measurements were conducted daily or at intervals of every 2 days in the morning hours between 08:30 and 10:00. For each flux measurement, the headspace of the closed chamber was sampled using a 50 mL polypropylene syringe with a Luer lock at 0, 15, 30, 45 and 60 min after chamber closure. Headspace gas samples were analyzed for N2O by gas chromatography (Agilent 7890A, Agilent Technologies, Santa Clara, CA, USA; equipped with an electron capture detector) within 7 h of sampling. N2O fluxes were determined from the linear or nonlinear changes in gas concentrations over time after chamber closure, using the approach outlined by [49]. The fluxes were corrected for the actual values of air temperature and pressure, as described by Zhao et al. (2021) [15].

2.3. Measurements of SOC and δ13C

The first topsoil (0–30 cm) sampling for the analysis of SOC content and bulk δ13C signals was conducted in January 2016. In brief, before the start of the experiment, nine independent soil samples were randomly obtained within the greenhouse. The soil was resampled for SOC and δ13C in February 2020, and soil samples were removed from all treatment plots. Three soil samples down to a depth of 30 cm were obtained from the raised beds in each plot for soil sampling. All soil samples for SOC analysis were acquired using a gouge auger (3 cm diameter). For later analysis, the soil samples were air-dried and then ball-milled for 10 min (250 r min−1). Then, soil samples (20–30 mg dry weight) were packed into tin capsules and analyzed for organic carbon and 13C/12C isotope ratios by using an elemental analyzer (Costech ECH 4024, Costech company, Picarro, Italy) and mass spectrometer (Elementar Isoprime 100, Elementar company, Hanau, Germany), respectively. Maize straw and BC were analyzed in the same manner for 13C/12C isotope ratios, with isotope ratios reported as δ13C values (‰) by referring to 13CVPDB standards [50].

2.4. Auxiliary Measurements

In each plot, the soil temperature and volumetric water content at 0–12 cm were monitored hourly using frequency domain reflectometry devices and a temperature sensor (CS655, Campbell Scientific, Inc., Logan, UT, USA). Soil mineral N (NO3-N and NH4+-N) concentrations at 0–30 cm soil depth were determined in soil samples from raised beds at weekly intervals (Figure 2) by extracting fresh soil with 100 mL of 0.01 mol/L CaCl2 solution. The extracts were analyzed using a continuous flow analyzer (AA3, Nordstadt Hamburg, Germany). The tomato yield was calculated as the total weight of fresh fruit (36 plants per subplot), which were picked by hand at the time of commercial maturity, that is, when the tomato seeds were yellow and the fruit pulp appeared red. Fruit samples were obtained from raised beds that were used to determine vegetable yields.

2.5. Calculation of Crop Performance and Environmental Parameters

Annual fruit yields, N fertilizer application rate, and annual N2O emission were all calculated by the mean value of 2018WS and 2019WS plus 2018AW.
Seasonal or annual partial factor productivity of applied N (PFPN) was calculated as follows:
P F P N   ( kg   yield   kg 1   N ) =   F r e s h   v e g e t a b l e   y i e l d   kg   ha 1   N   f e r t i l i z e r   a p p l i c a t i o n   kg   N   ha 1
Seasonal or annual yield-scaled N2O emission (Yield-N2O) was calculated as follows:
Y i e l d - N 2 O   ( g   N   Mg 1   yield ) =   C u m u l a t i v e   N 2 O   e m i s s i o n s   g   N   ha 1 F r e s h   v e g e t a b l e   y i e l d   Mg   ha 1
In this study, the seasonal or annual apparent N2O emission factor (EFApparent) was calculated without considering the background N2O emissions as follows:
E F A p p a r e n t   ( % ) =   C u m u l a t i v e   N 2 O   e m i s s i o n s   kg   N   ha 1 T o t a l   N   f e r t i l i z e r   a p p l i c a t i o n   kg   N   ha 1   ×   100
The annual rate of soil C sequestration (ΔSOC) between the end (2020) and beginning (2016) of the experiment was calculated as follows:
Δ S O C   ( t   C   ha 1   yr 1   ) =   S O C 2020 S O C 2016   t   C   ha 1   4
here SOC2020 and SOC2016 represent the measured topsoil (0–30 cm) SOC content in 2020 and 2016, respectively.
The percentage of increased SOC contents due to the additional application of straw or biochar was calculated as follows:
S O C   ( % ) = S O C D I F + S   o r   D I F + B C     S O C D I F   g   C   kg 1   SDW C   i n p u t   s t r a w   o r   b i o c h a r g   C   kg 1   SDW   ×   100
where SOCDIF+S or DIF+BC represents the SOC content in DIF+S and DIF+BC, SOCDIF represents it in DIF, C input is the total amount of straw or biochar carbon addition rate for the eight growing seasons and SDW represents the soil dry weight.

2.6. Statistical Analyses

Statistical analyses were conducted using SAS 8.0 (SAS Institute Inc., Cary, NC, USA) and OriginPro 9 (OriginLab Corporation, Northampton, MA, USA). Treatment effects were assessed using one-way ANOVA and independent-sample t tests. Differences between treatments were determined by Duncan’s test at a significance level of 0.05. Shapiro–Wilk normality and Leven’s test were used to check the normality and homogeneity of variance of all the data. Pearson’s correlation was used to analyze the correlation between PFPN and EFApparent. The latent variable path analyses of structural equation modelling (Amos, 24, SPSS, IBM) were used to analyze the influence of soil water content, temperature and mineral N content on N2O emissions.

3. Results

3.1. Soil Environmental Conditions

Except for the flood irrigation event on the day of transplanting, the average number of drip fertigation events was approximately 62 during for all the treatments in each growing season (Figure 1a). The seasonal rates of irrigation water and chemical N fertilizer were 343 mm season−1 and 187 kg N ha−1 season−1, respectively (Figure 1b and Table S1). Soil temperatures showed a pronounced seasonal pattern, with the highest values of up to 40 °C in summer and lowest values during the winter periods (>5 °C, Figure 1c). Soil temperatures during transplanting for the WS season (February–March) were usually approximately 11 °C–14 °C. By contrast, soil temperatures during transplanting for the AW season (August) were always >25 °C (Figure 1c). Across all treatments, the highest soil water-filled pore space (WFPS) values were observed immediately following transplantation, which was directly followed by a single flood irrigation event (50–100 mm). In the following event, soil moisture was maintained at approximately 60% WFPS by drip fertigation (Figure 1d). Soil mineral N concentration fluctuated in the range of 61–222 mg N kg−1 for NO3-N (mean: 128 ± 5.0 mg N kg−1) and 1.0–6.3 mg N kg−1 for NH4+-N (mean: 3.2 ± 0.2 mg N kg−1). Soil NO3-N and NH4+-N concentrations following transplanting tended to be higher in the AW season than in the WS season (Figure 1e,f).

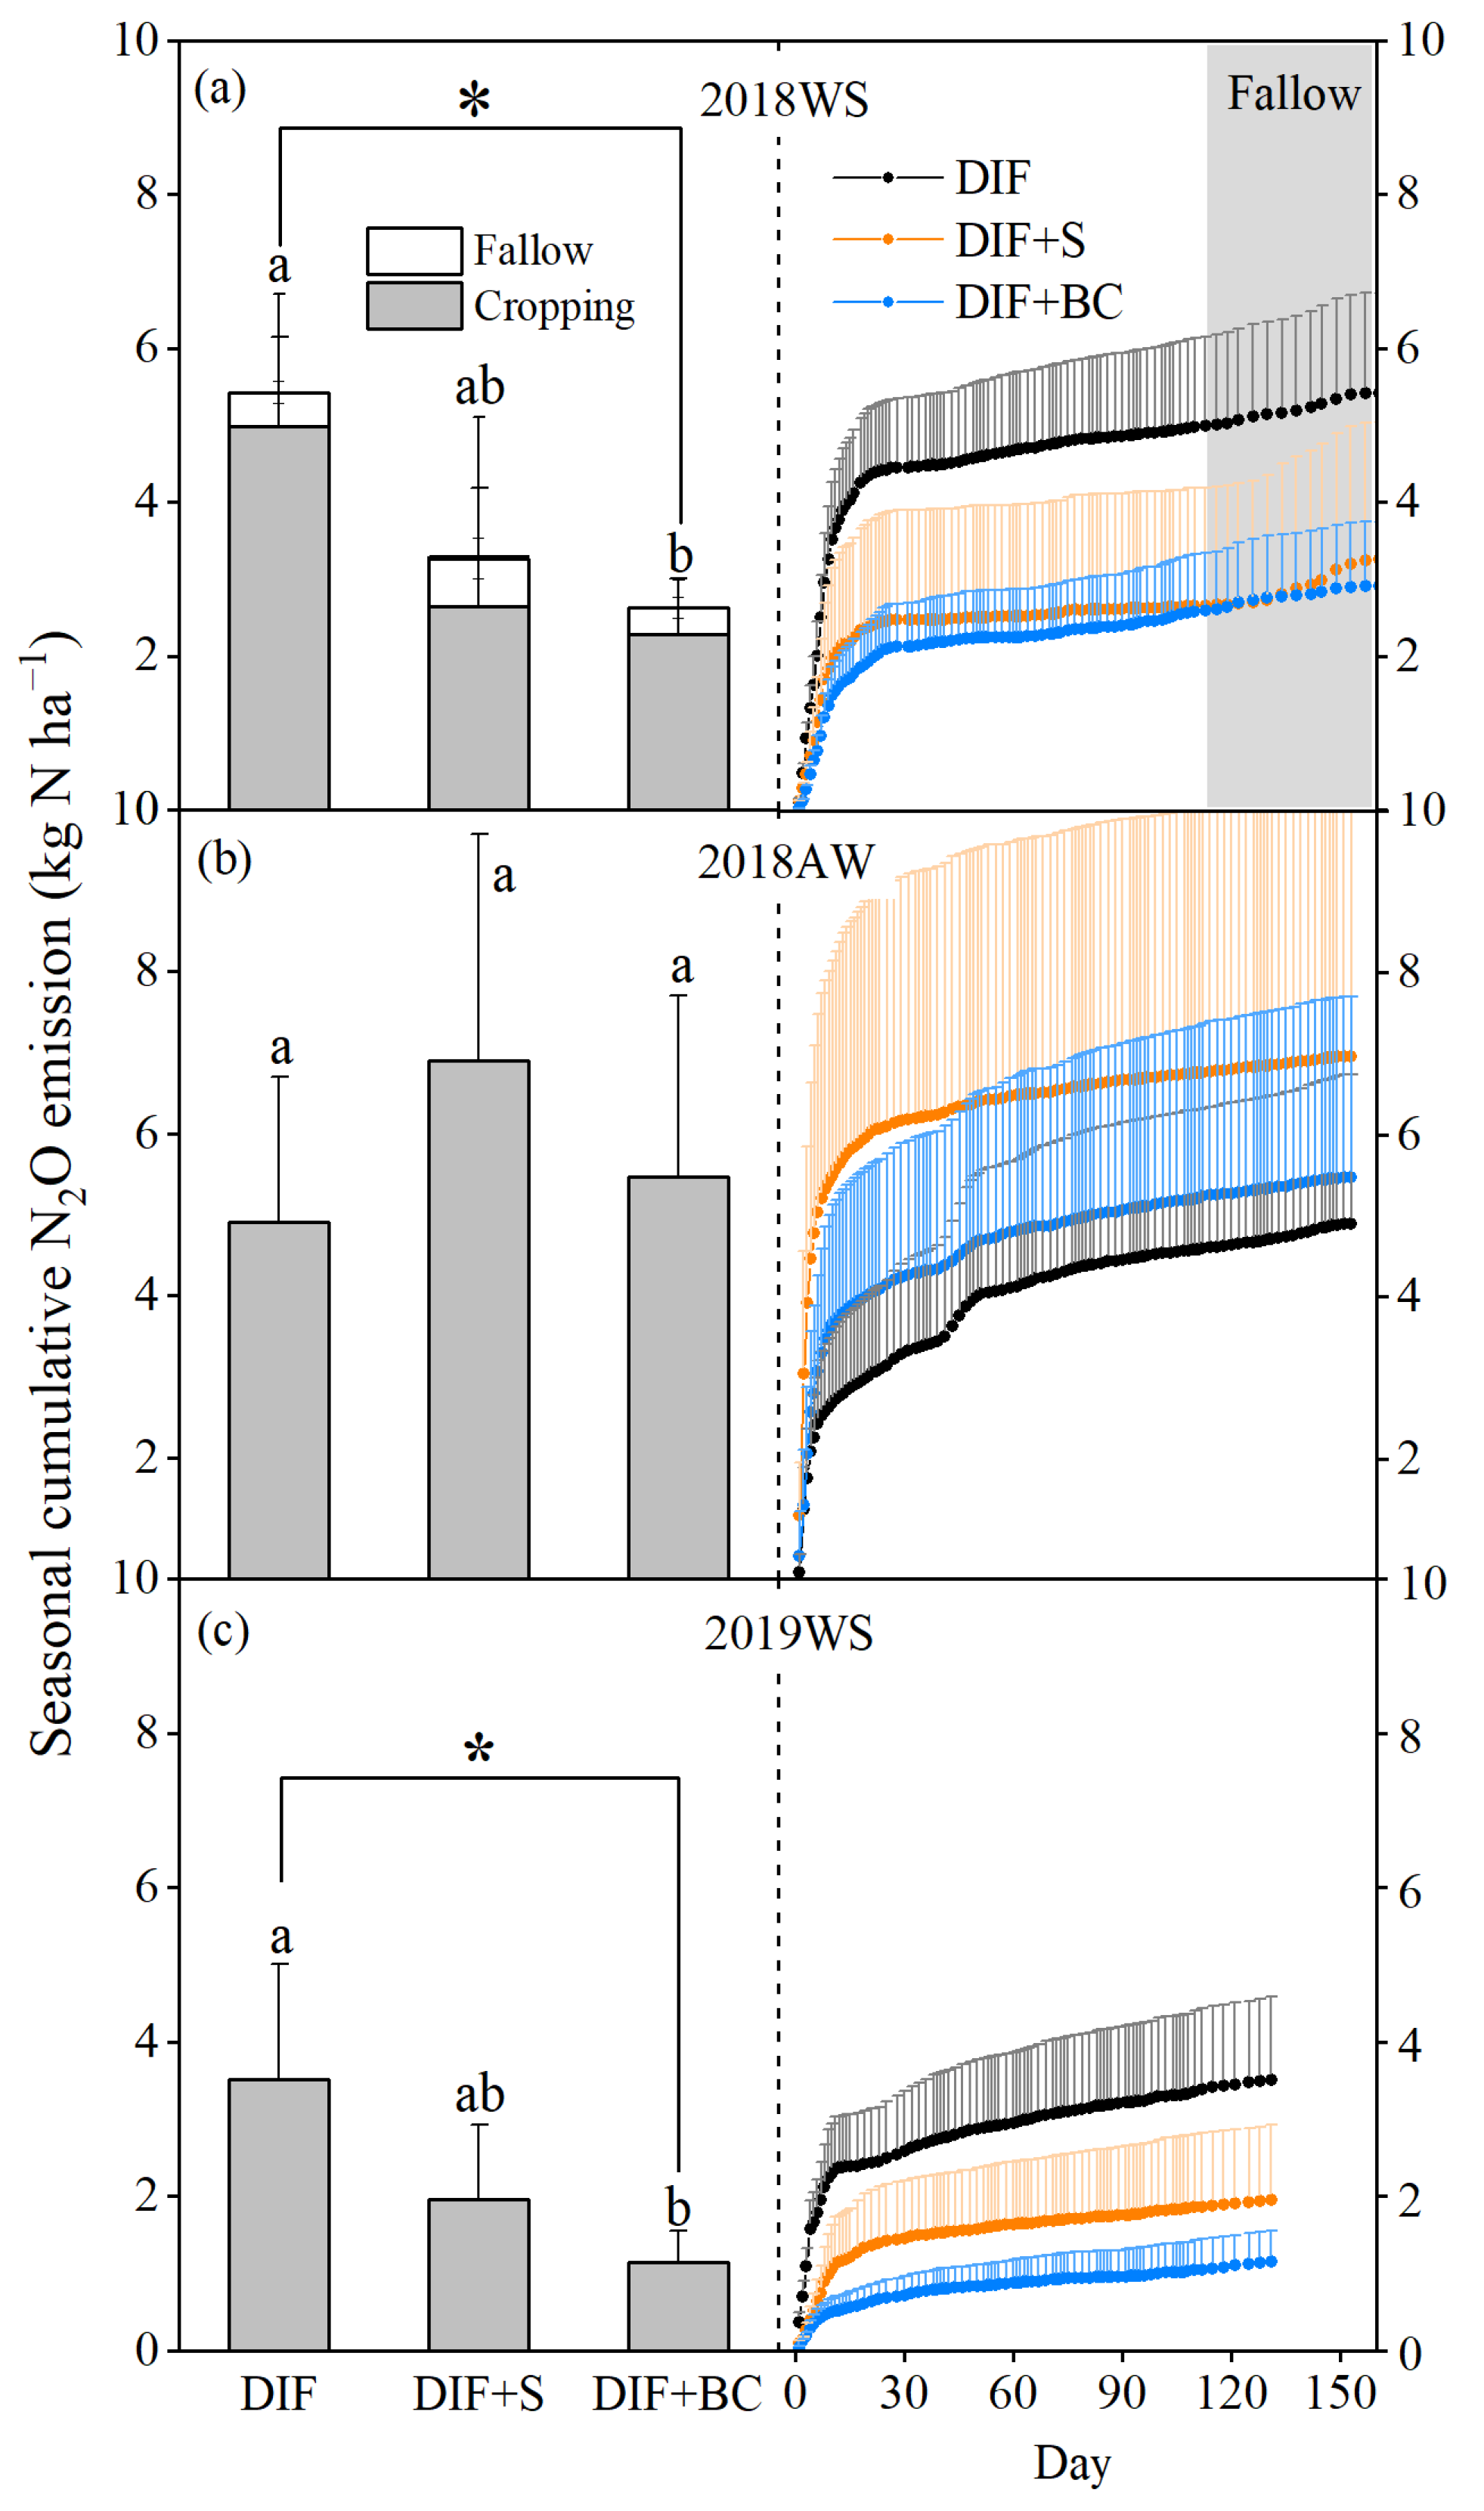
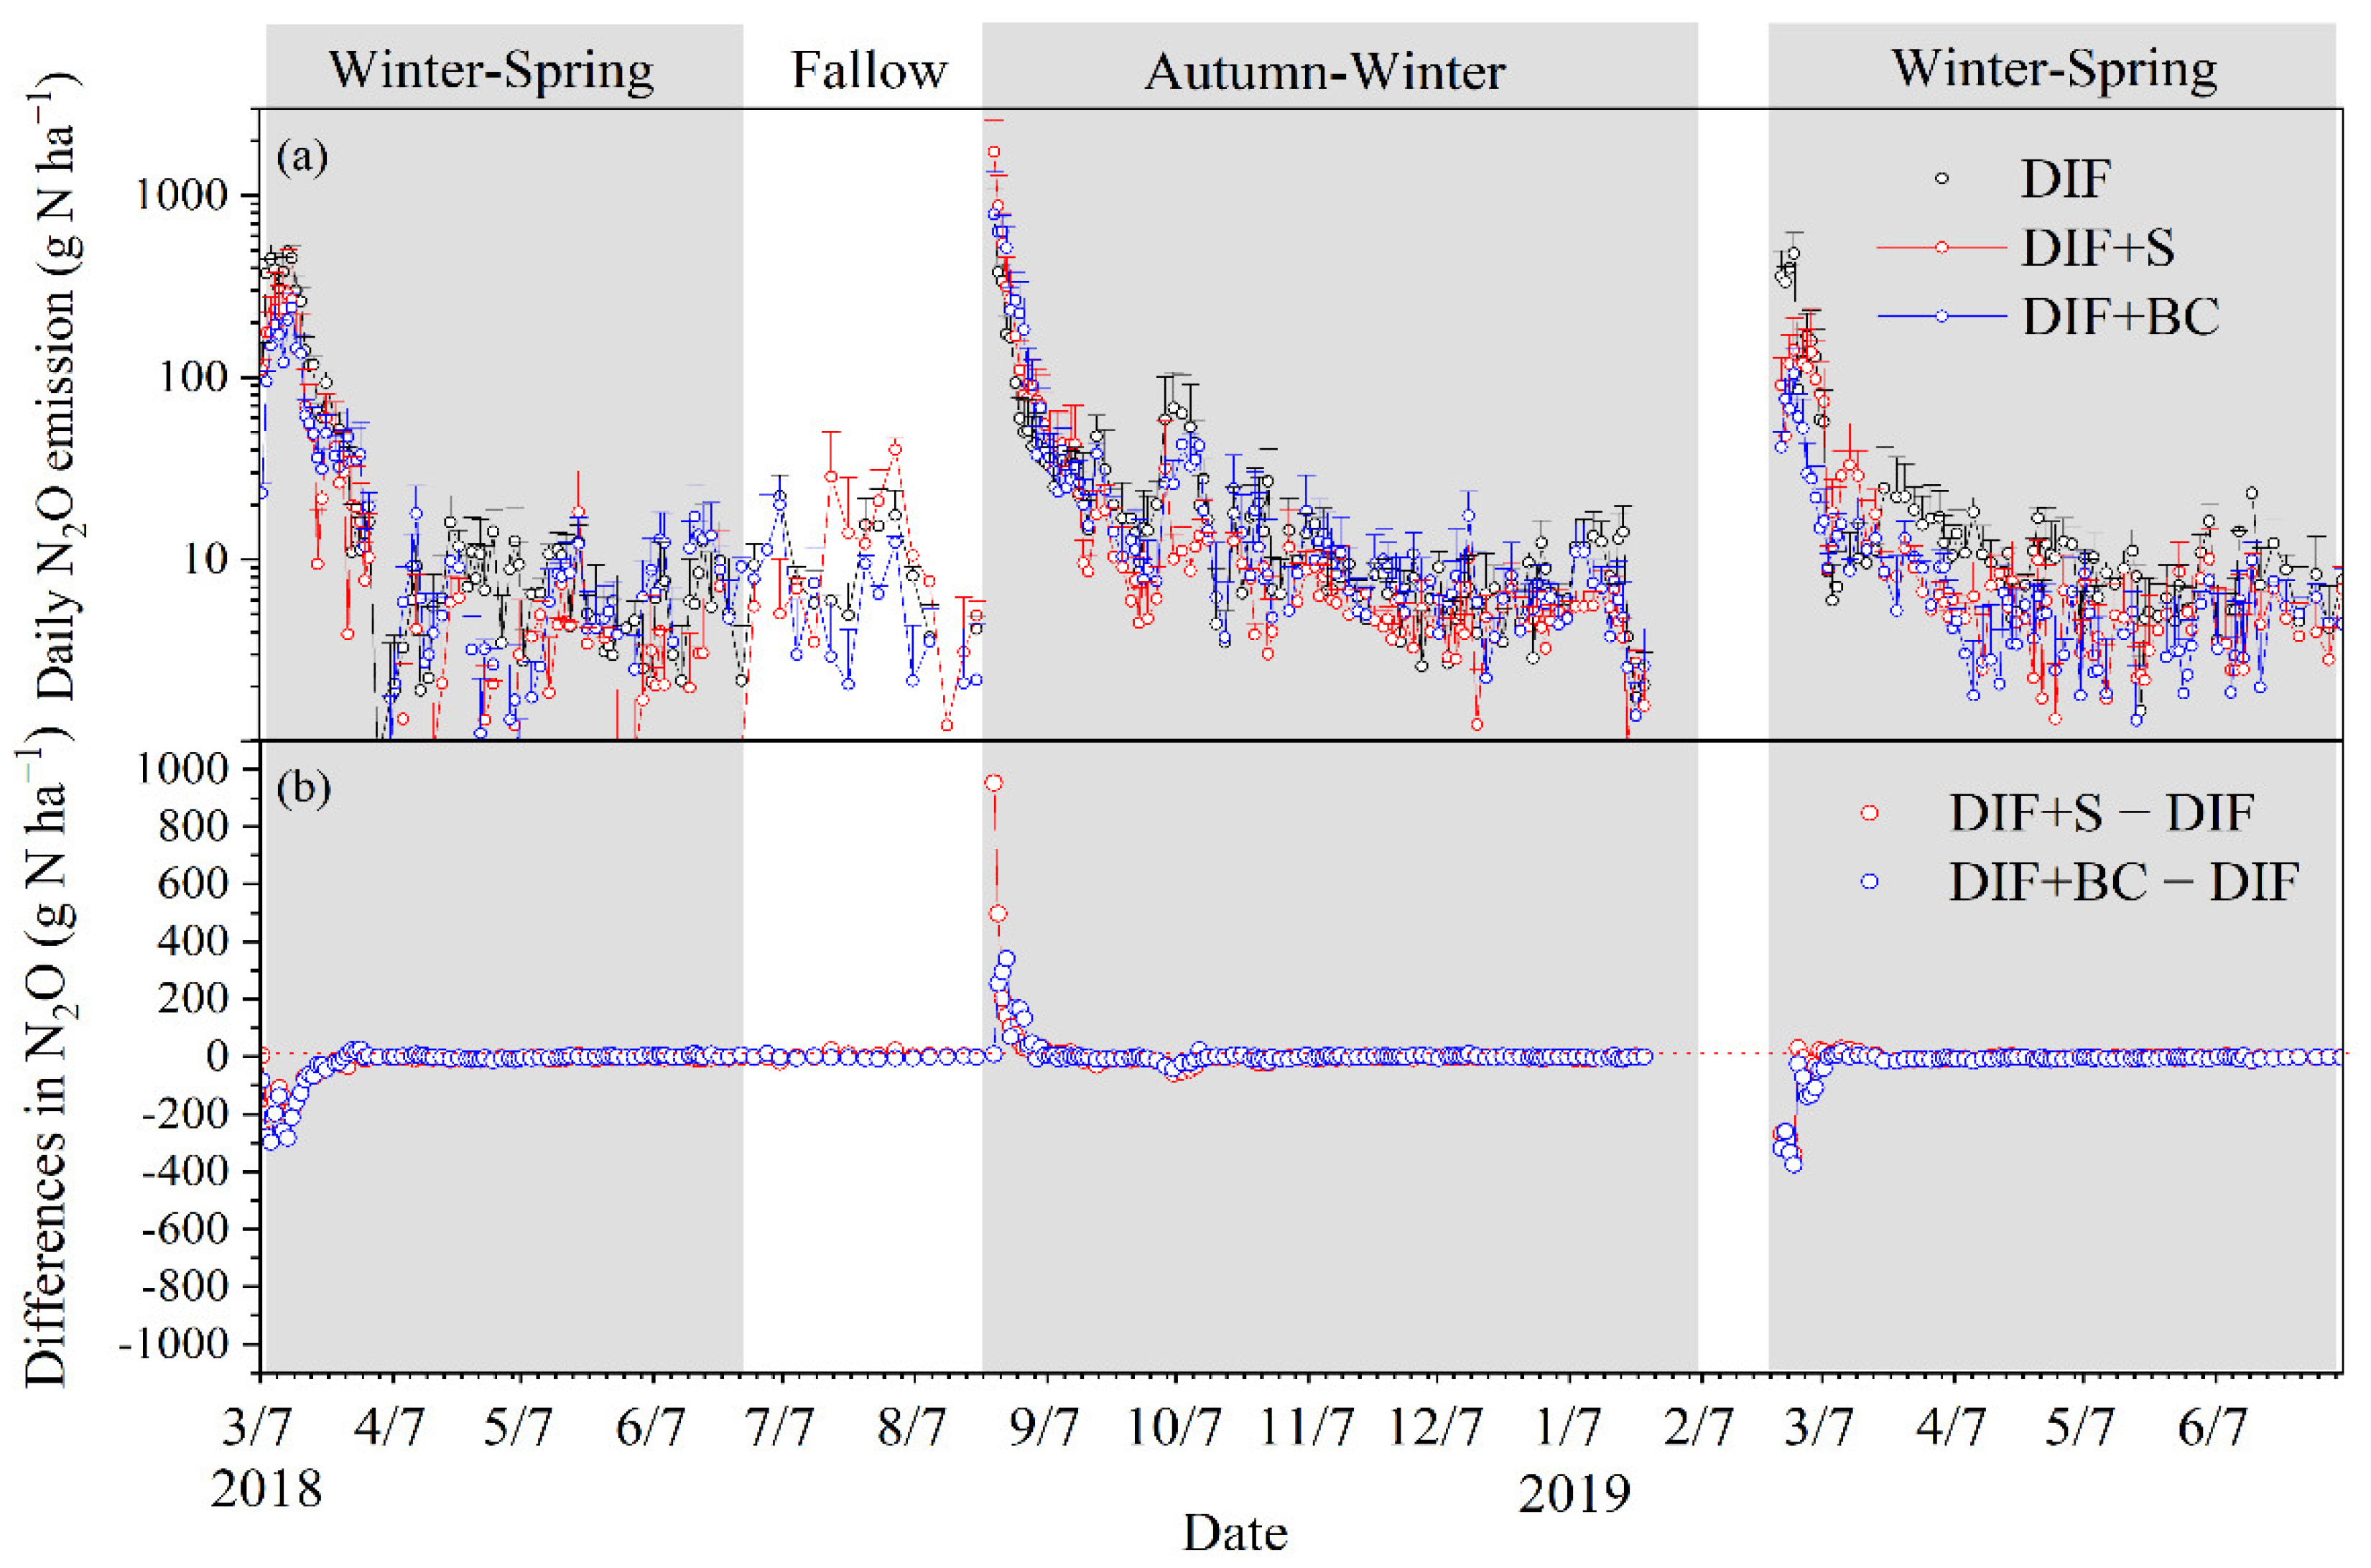
3.2. Seasonal Cumulative N2O Emission and Fluxes

The seasonal cumulative N2O emissions in 2018WS, 2018AW, and 2019WS varied in the range of 3.5–5.4 kg N ha−1 yr−1 for DIF and 2.0–6.9 and 1.2–5.5 kg N ha−1 yr−1 for DIF +S and DIF+BC, respectively (Figure 2). Seasonal N2O emissions for DIF+BC were significantly reduced compared with those for DIF in WS seasons 2018WS (−52%) and 2019WS (−69%), with opposing trends in the AW season. No significant difference was detected between DIF+S and DIF+BC in the WS and AW seasons (Figure 2). The peak N2O emission fluxes occurred in the first 10 days following transplanting and initial flood irrigation, accounting for up to 70–80% of total seasonal emissions (Figure 2 and Figure 3). Within 3–4 days after basal fertilization and irrigation in the WS seasons, the daily N2O fluxes were up to the highest (DIF: 447–480, DIF+S: 142–236, DIF+BC: 105–197 g N ha−1 d−1) and then declined sharply by at least one order of magnitude, until the harvest time in the WS seasons (Figure 3a). Meanwhile, in the 2018AW season, the highest N2O emission peaks appeared 1 day after basal fertigation in the order of DIF+S (1739) > DIF+BC (794) ≥ DIF (785 g N ha−1 d−1). The differences in daily N2O emission fluxes between with and without straw or biochar incorporation showed an opposite trend in dependence on growing seasons (Figure 3b). In 2018WS and 2019WS, straw or biochar incorporation significantly reduced daily N2O emissions compared with DIF during the basal fertigation period. Meanwhile, in 2018AW, the incorporation of straw or biochar stimulated daily N2O emissions after basal fertigation, and the increased N2O emissions induced by straw incorporation was the highest, up to 109 times higher than that induced by biochar (Figure 3b). However, in the WS and AW seasons, the different effects of straw or biochar incorporation on daily N2O emissions was negligible after 1 month of basal fertigation (Figure 3b).
Notably, daily N2O emissions were significantly affected by soil temperature, moisture, and mineral N concentration (Figure S1). Soil NH4+-N concentration had the largest positive direct effect (0.52) on soil N2O emissions, followed by soil temperature (0.17) and soil WFPS (0.16, Figure 4). Moreover, soil NH4+-N concentration had a significant positive direct effect (0.30) on soil NO3-N concentration (Figure 4).

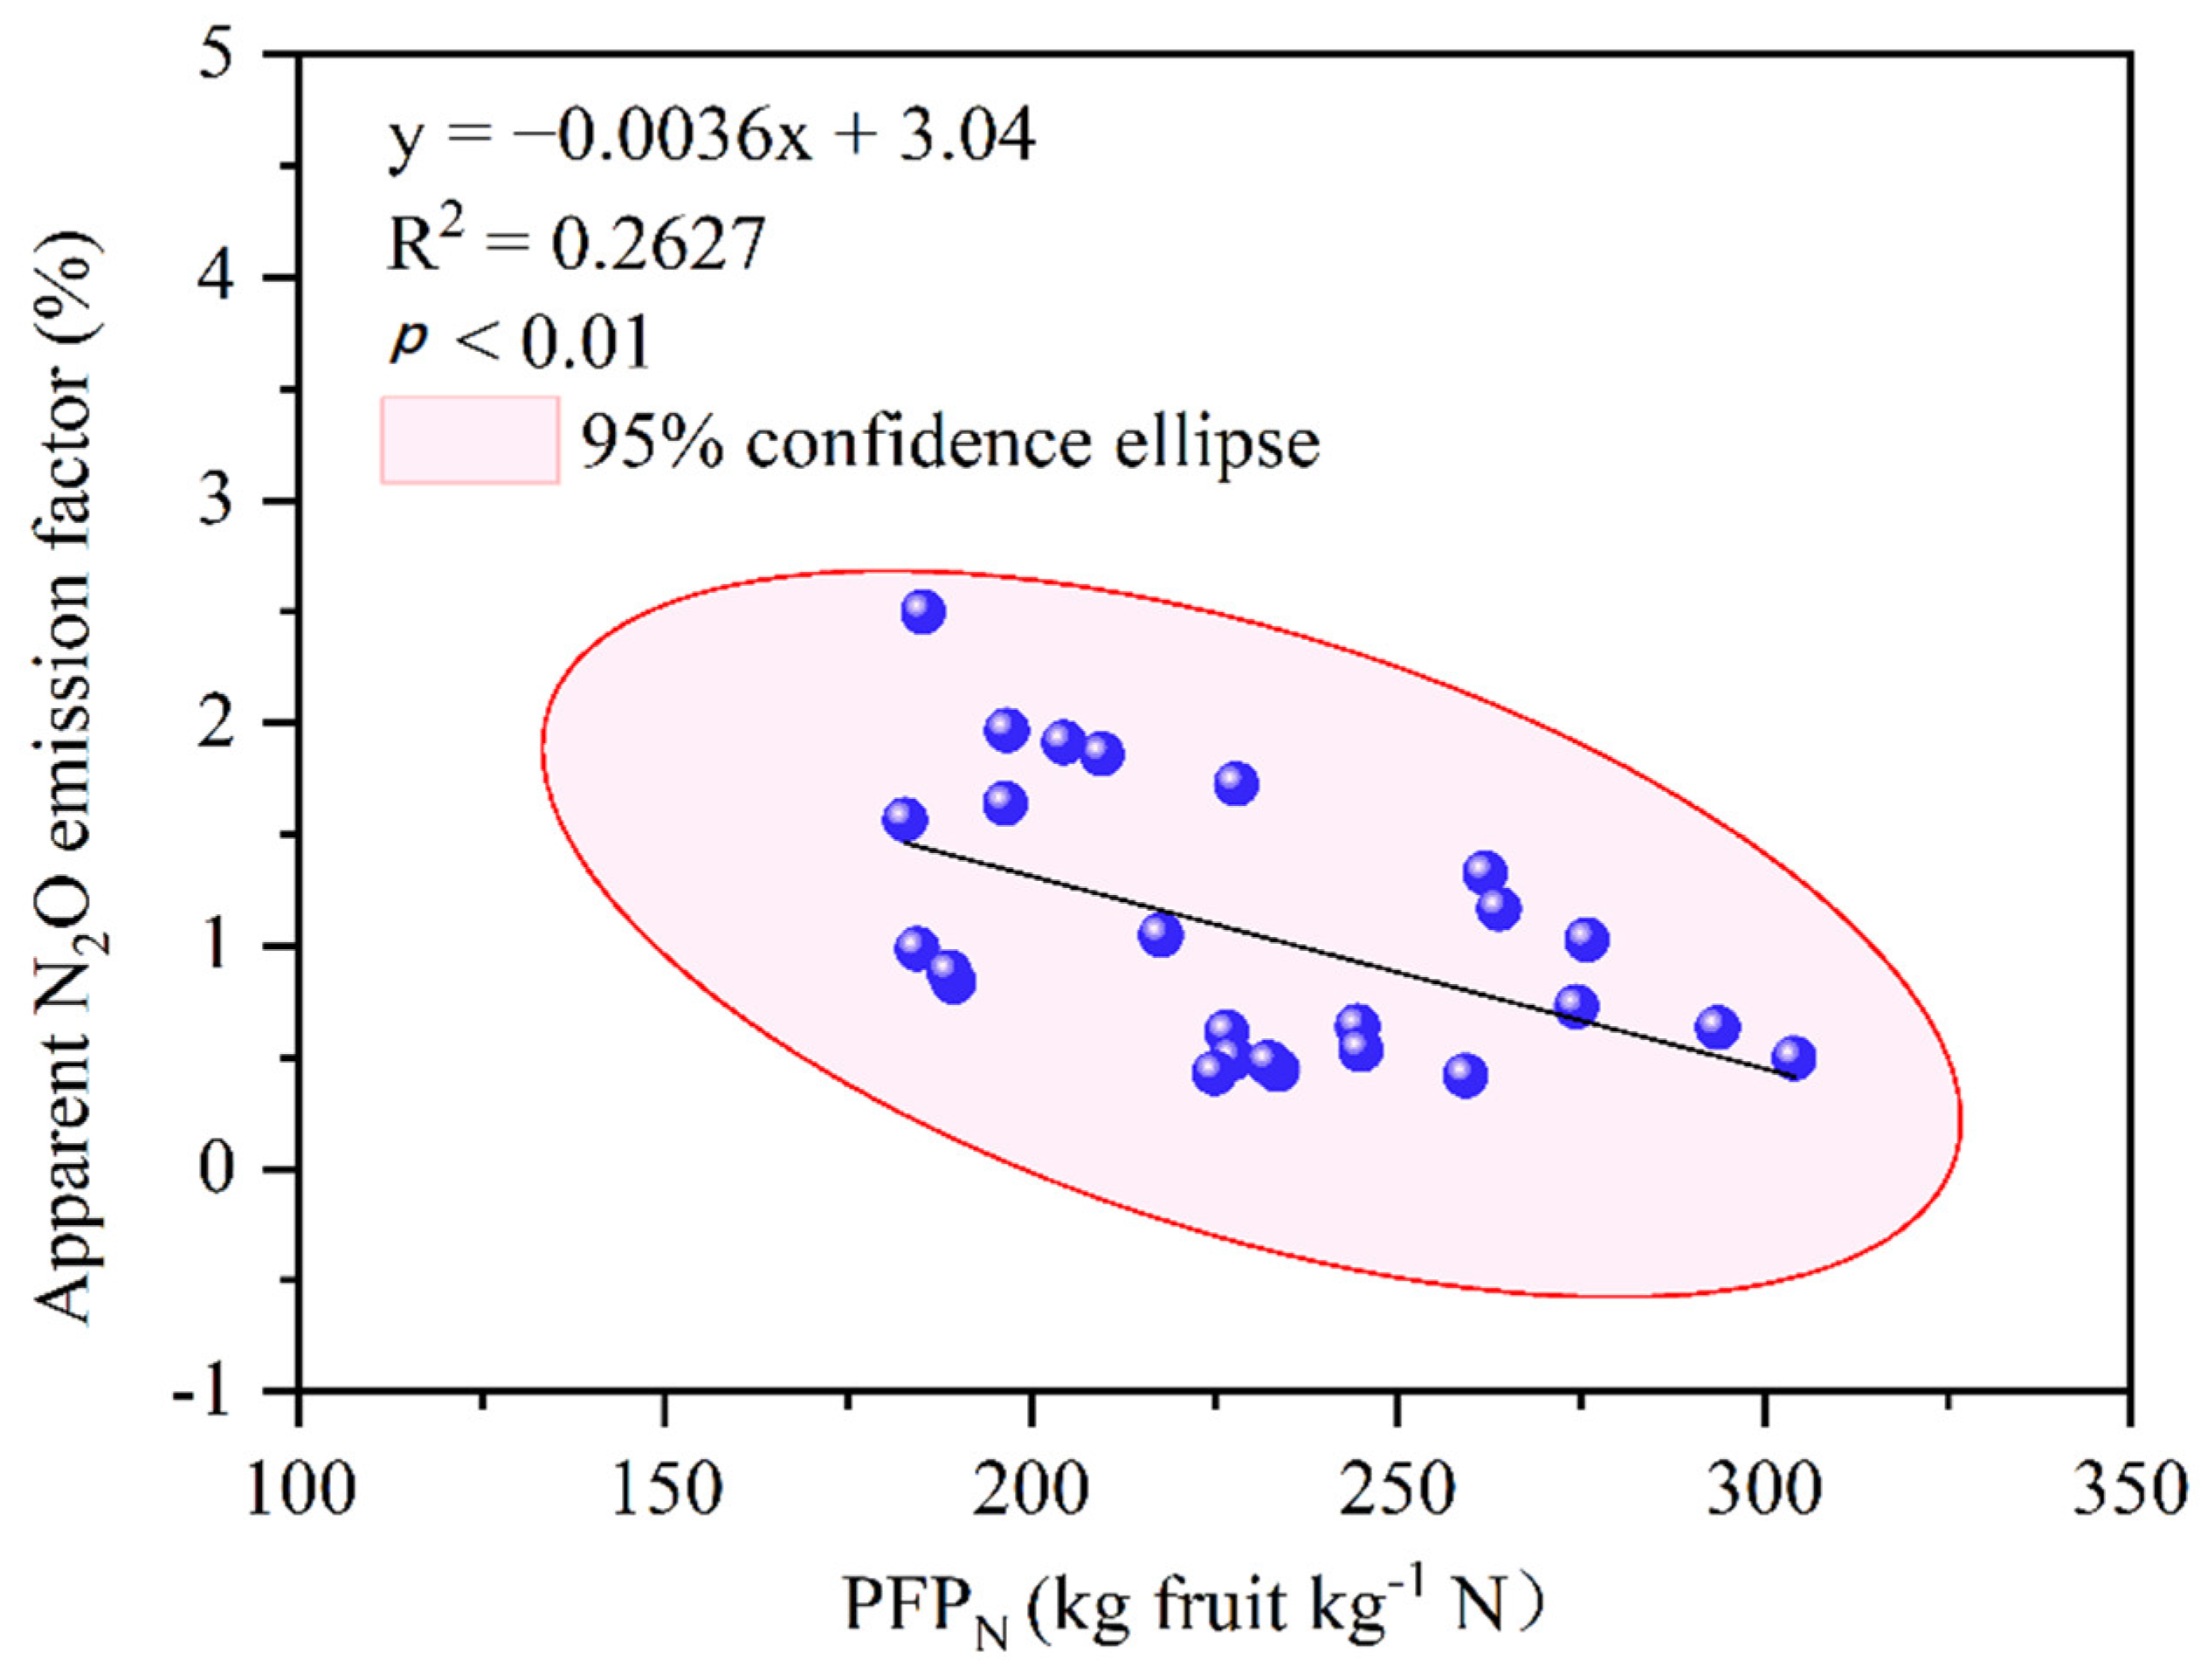
3.3. Yield-Scaled N2O Emission and EFApparent

The seasonal yield-scaled N2O emissions in DIF+S and DIF+BC were significantly 53% and 72% lower than that in DIF in the WS seasons (Table 3), whereas straw or biochar incorporation had an opposite effect in the AW season. On an annual scale, the yield-scaled N2O emissions ranged from 40.5 g N Mg−1 yr−1 (DIF+BC) to 56.6 (DIF) g N Mg−1 yr−1, without significant differences between treatments. Similar trends were found for the apparent N2O emission factor, i.e., % of fertilizer N emitted in form of N2O without deducting background emissions. The annual EFApparent were 1.22% (DIF), 1.00% (DIF+S), and 0.82% (DIF+BC) (Table 3).
The annual tomato yields were, on average, 175 Mg ha−1 yr−1, without significant difference between treatments (Table 3). However, compared with DIF in 2019WS, DIF+BC significantly increased tomato yields and PFPN by 17.2%. No significant effects were found in the yields or PFPN of straw incorporation in WS and AW seasons (Table 3). A significant linear relationship was found between PFPN and EFApparent (Figure 5). EFApparent decreased significantly with increased PFPN across all three treatments and growing seasons (p < 0.01, Figure 5).

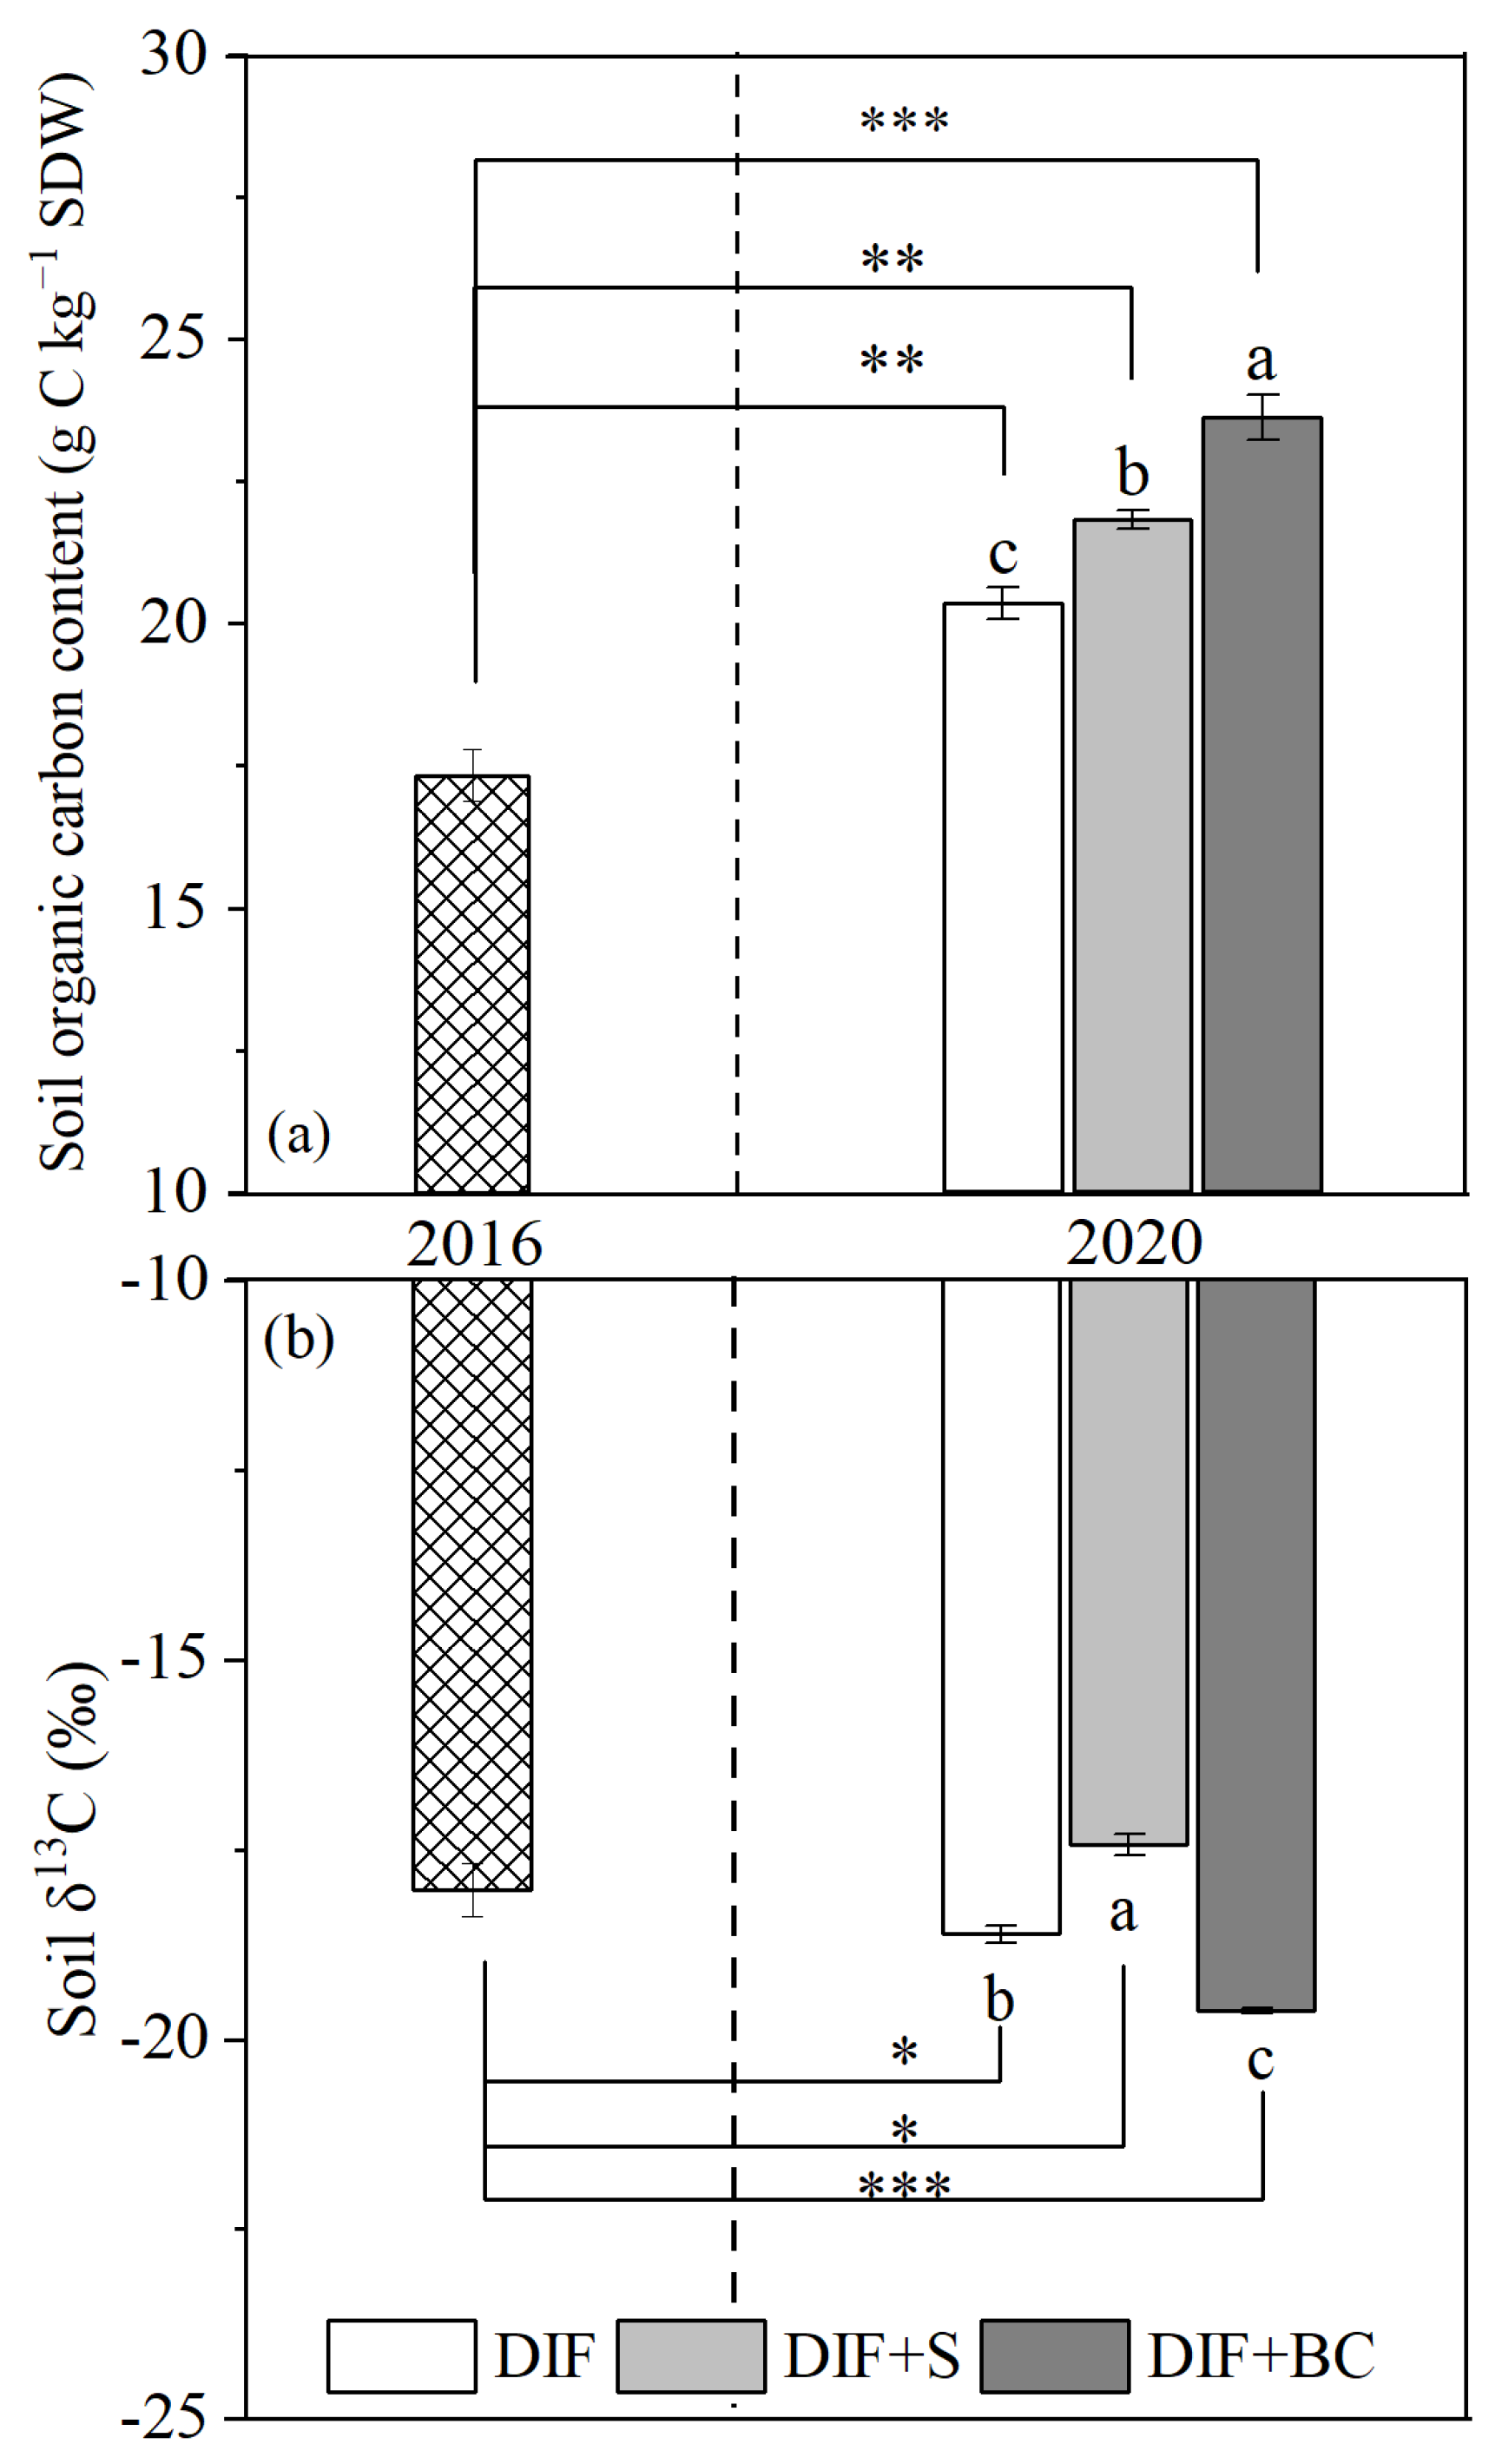
3.4. Changes in SOC Content

In January 2016 (i.e., at the start of our experiment), the mean SOC (0–30 cm) concentration was 17.3 ± 0.45 g C kg−1 SDW. Resampling of topsoil after 4 years in February 2020 revealed that the SOC contents of all treatments significantly increased, and the differences in SOC amongst different treatments were significant. The highest SOC concentration was observed for DIF+BC (23.6 ± 0.40 g C kg−1 SDW), followed by DIF+S (21.8 ± 0.17 g C kg−1 SDW) and DIF (20.4 ± 0.28 g C kg−1 SDW) in February 2020 (Figure 6a). The calculated annual rates of soil C sequestration were 6.31 ± 0.40 (DIF+BC), 4.49 ± 0.17 (DIF+S) and 3.03 ± 0.28 t C ha−1 yr−1 (DIF) (Figure 7a).
On the basis of the calculation of differences between increases in SOC contents for DIF compared with those for DIF+S and DIF+BC, approximately 5.6 or 12.8 t C ha−1 remained in the topsoil (0–30 cm), due to straw or BC being incorporated over the eight growing seasons into the soil (DIF+S: 3.5 t C ha−1 season−1 × 8 = 28 t C ha−1 over 4 years; DIF+BC: 2.1 t ha−1 season−1 × 8 = 16.8 t C ha−1 over 4 years). In other words, assuming that the subsoil C content did not change, the C sequestration rates due to additional straw and BC were 20% (DIF+S) and 78% (DIF+BC, Figure 7b), respectively. Besides SOC content, soil δ13C changed significantly over the 4 observation years (Figure 6b). DIF+S soil δ13C was higher in 2020 than in 2016, but lower soil δ13C values were observed for DIF and DIF+BC (Figure 6b).

4. Discussion

Vegetable production in greenhouses is a hotspot of soil N2O emissions and degradation of soil health is a major concern [5,13]. The negative environmental connotations are mainly due to the way greenhouses are usually managed by farmers, as flood irrigation schemes in combination with high rates of organic and mineral fertilizer applications are common practices [7,8]. In recent years, the use of drip fertigation (DIF) schemes for vegetable production in greenhouses, which allow for reduced rates of irrigation and fertilization, has been strongly promoted. However, the common drip fertigation scheme does not consider the additional application of organic matter, either in the form of straw (DIF+S) or biochar (DIF+BC), even though this may help to significantly increase the soil carbon content of greenhouse soils [18]. The present paper showed that the additional application of straw or biochar was advantageous, as it allowed a further increase in SOC content and decrease in seasonal N2O emissions but maintained crop yields.

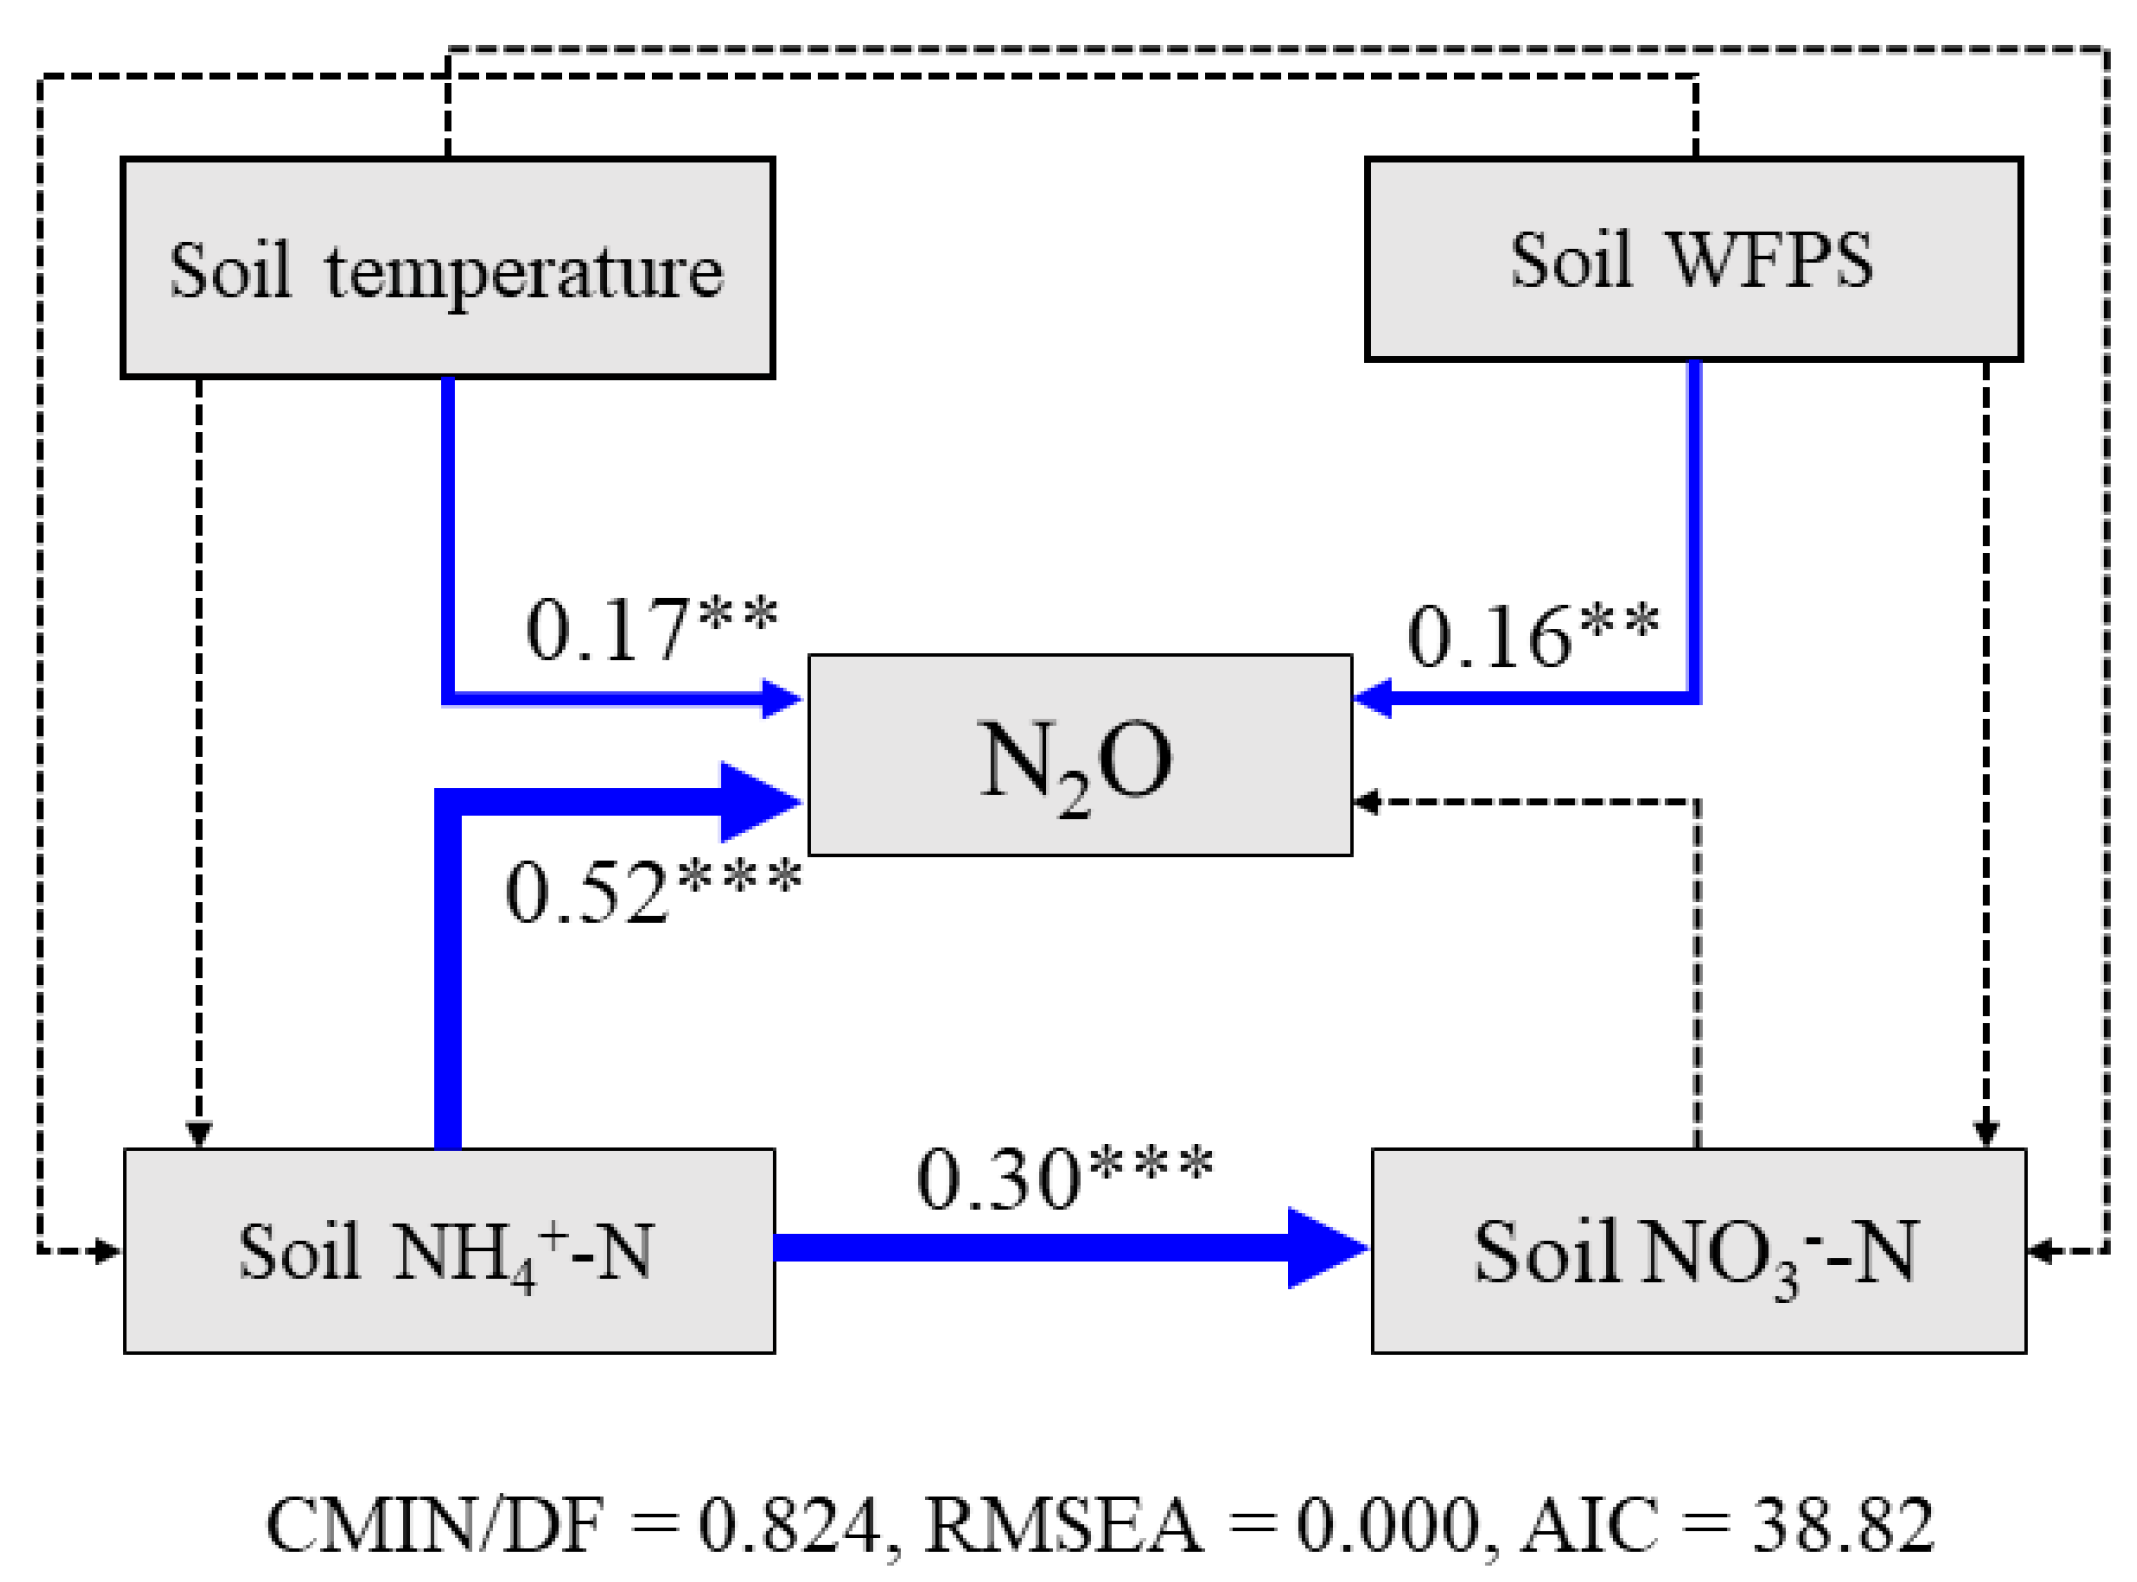
4.1. Magnitude and Interrelationships of Soil N2O Emissions and N Productivity

The annual soil N2O emissions ranged from 7.5 to 9.4 kg N ha−1 yr−1 from the investigated greenhouse soils (Figure 2). Although the annual N2O emissions were much higher than the mean soil N2O emissions from global arable growing systems (2.4 kg N ha−1 yr−1) [16], they were still significantly lower than the global mean value from greenhouse vegetable systems (12 kg N ha−1 yr−1) [5]. Moreover, the soil N2O emissions in the present study were nearly one magnitude lower than those in several reports on annual soil N2O emissions (40–238 kg N ha−1 yr−1) from intensively managed greenhouse vegetable systems with high fertilization (>2000 kg N ha−1 yr−1) and flood irrigation (>1300 mm yr−1) [14,15,51].
Reduced N fertilizer application and lowered soil moisture during the growing season explain the differences in soil N2O emissions between greenhouse vegetable systems managed by drip fertigation compared with those managed by over fertilization and flood irrigation [8,15,52]. Based on the structure equation modelling analysis, the significant positive direct effect (standardized path coefficients 0.52, p < 0.001, Figure 4) of soil NH4+-N concentration on N2O emissions indicated that the N2O emissions in this drip fertigation systems were primed by the availability of inorganic N, and by nitrification rather than by coupled nitrification-denitrification [52,53,54], as soil moisture levels stayed lower. In contrast, N2O emissions were driven by both nitrification and denitrification in the conventional systems managed with over fertilization and flood irrigation [55]. In addition, the high frequency of drip fertigation practice maintained stable soil WFPS (Figure 1d), and thus reduced N2O emission pulses caused by soil drying and wetting [54,56], which usually existed in conventional flood irrigation systems with low irrigation frequency. Furthermore, the relative low soil WFPS (60–70%) of drip fertigation reduced N2O emissions produced by the denitrification process in comparison to conventional flood irrigation [57], although coupled nitrification-denitrification may be favored under such conditions [58,59,60].
The annual yield-scaled N2O emissions were in the range of 40.5–56.6 g N2O-N Mg−1 yr−1, with the lowest values observed for the DIF+BC treatment in the WS growing seasons (Table 3), in line with the mean yield-scaled N2O emissions for global greenhouse vegetable production systems of 50 ± 10 g N2O-N Mg−1 yr−1 [5]. No significant differences amongst the treatments were found not only for annual yield-scaled N2O emissions and EFApparent but also for tomato yield and PFPN (Table 3). Meanwhile, EFApparent significantly decreased with PFPN (Figure 5), which is in accordance with previous reports [61]. However, the seasonal yield-scaled N2O emissions and EFApparent were significantly lower in DIF+BC than in DIF during WS seasons (Table 3). This finding could be partly explained by opposite results (higher yield and PFPN in DIF+BC than in DIF) and the different pattern of N2O emission flux related to the change in seasonal environment factors (Figure 1 and Figure 3) [47,62].

4.2. Different Seasonal Responses of N2O Emissions to Biochar or Straw Incorporation

Compared with DIF, the additional application of biochar to greenhouse soils significantly reduced soil N2O emissions by approximately 61.2% during the WS growing seasons (2018WS and 2019WS), whereas an opposite effect was observed during the AW season in 2018 (Figure 2 and Figure 3). This result is consistent with previous reports that biochar incorporation could either mitigate N2O emissions [30,38,62,63] or stimulate N2O emissions [45,64,65] in agricultural systems. Straw incorporation had less pronounced effects on the mitigation of N2O emissions than biochar during WS seasons, whereas it induced larger N2O emissions during the AW season (Figure 2 and Figure 3). These different responses of biochar or straw incorporation were dependent on the properties of organic carbon used, availability of nitrogen and carbon sources and soil temperature and moisture [30,63,66].
During the WS growing seasons, the mitigation effects on N2O emissions of biochar or straw mainly occurred within 10 days after basal fertigation (Figure 3b), when the soil environment condition was conducive to nitrifier and denitrifier activity [28,52]. Firstly, the significant reduction in N2O emission fluxes with biochar incorporation compared with DIF is related to its large specific surface and porosity, meaning lower availability of NH4+-N and dissolved organic carbon for microbial nitrification and denitrification [38,39]. Secondly, a high C/N ratio of biochar and straw stimulates microbial N immobilization and reduces ammonium and nitrate concentration for N2O production [48,67,68]. Thirdly, nitrification and denitrification were mitigated by limited biological available carbon [58] with biochar incorporation versus straw incorporation, due to its recalcitrant structure (Figure 7) [32,66]. Moreover, the emission of volatile organic compounds from biochar might show a toxic effect on soil microorganisms, and thus decrease the nitrification rate and N2O emissions [69,70].
Oppositely, several days after basal fertigation in the AW growing season, the increase in daily N2O flux induced by straw incorporation was significantly higher than that with biochar (Figure 3b; Δ (DIF+S–DIF): 953–498, Δ (DIF+BC–DIF): 8.7–255 g N ha−1 d−1), resulting in higher seasonal N2O emissions in DIF+S than in DIF+BC (Figure 2b). This finding was closely related to the soil carbon and nitrogen cycling caused by the high soil temperature and moisture at the beginning of the AW growing season (Figure 1c and Figure 4) [64,71]. On the one hand, the higher soil temperature (>28 °C) and moisture stimulated the decomposition of chicken manure and soil organic nitrogen, and thus increased soil NH4+-N substrates for microbial nitrification (Figure 1f) [71,72]. This finding could be confirmed by the high pathway coefficient between N2O emissions and soil NH4+-N concentration (Figure 4). On the other hand, the soil denitrification process was mainly controlled by soil anaerobic conditions, sufficient nitrogen substrates, and organic carbon sources [58]. The high soil temperature during this period stimulated soil microbe activity and resulted in the increased consumption of soil oxygen when straw was incorporated, leading to a rapid reduction in soil redox potential and increased N2O emissions produced by the denitrification process [55,73,74]. Moreover, the intensity of the denitrification process was influenced by the fraction of C and C/N ratios of organic matters [48,61,75]. Compared with biochar with condensed aromatic C [76,77], straw contained easily decomposable C fractions, which could strongly promote N2O emissions by soil denitrification [55,75].

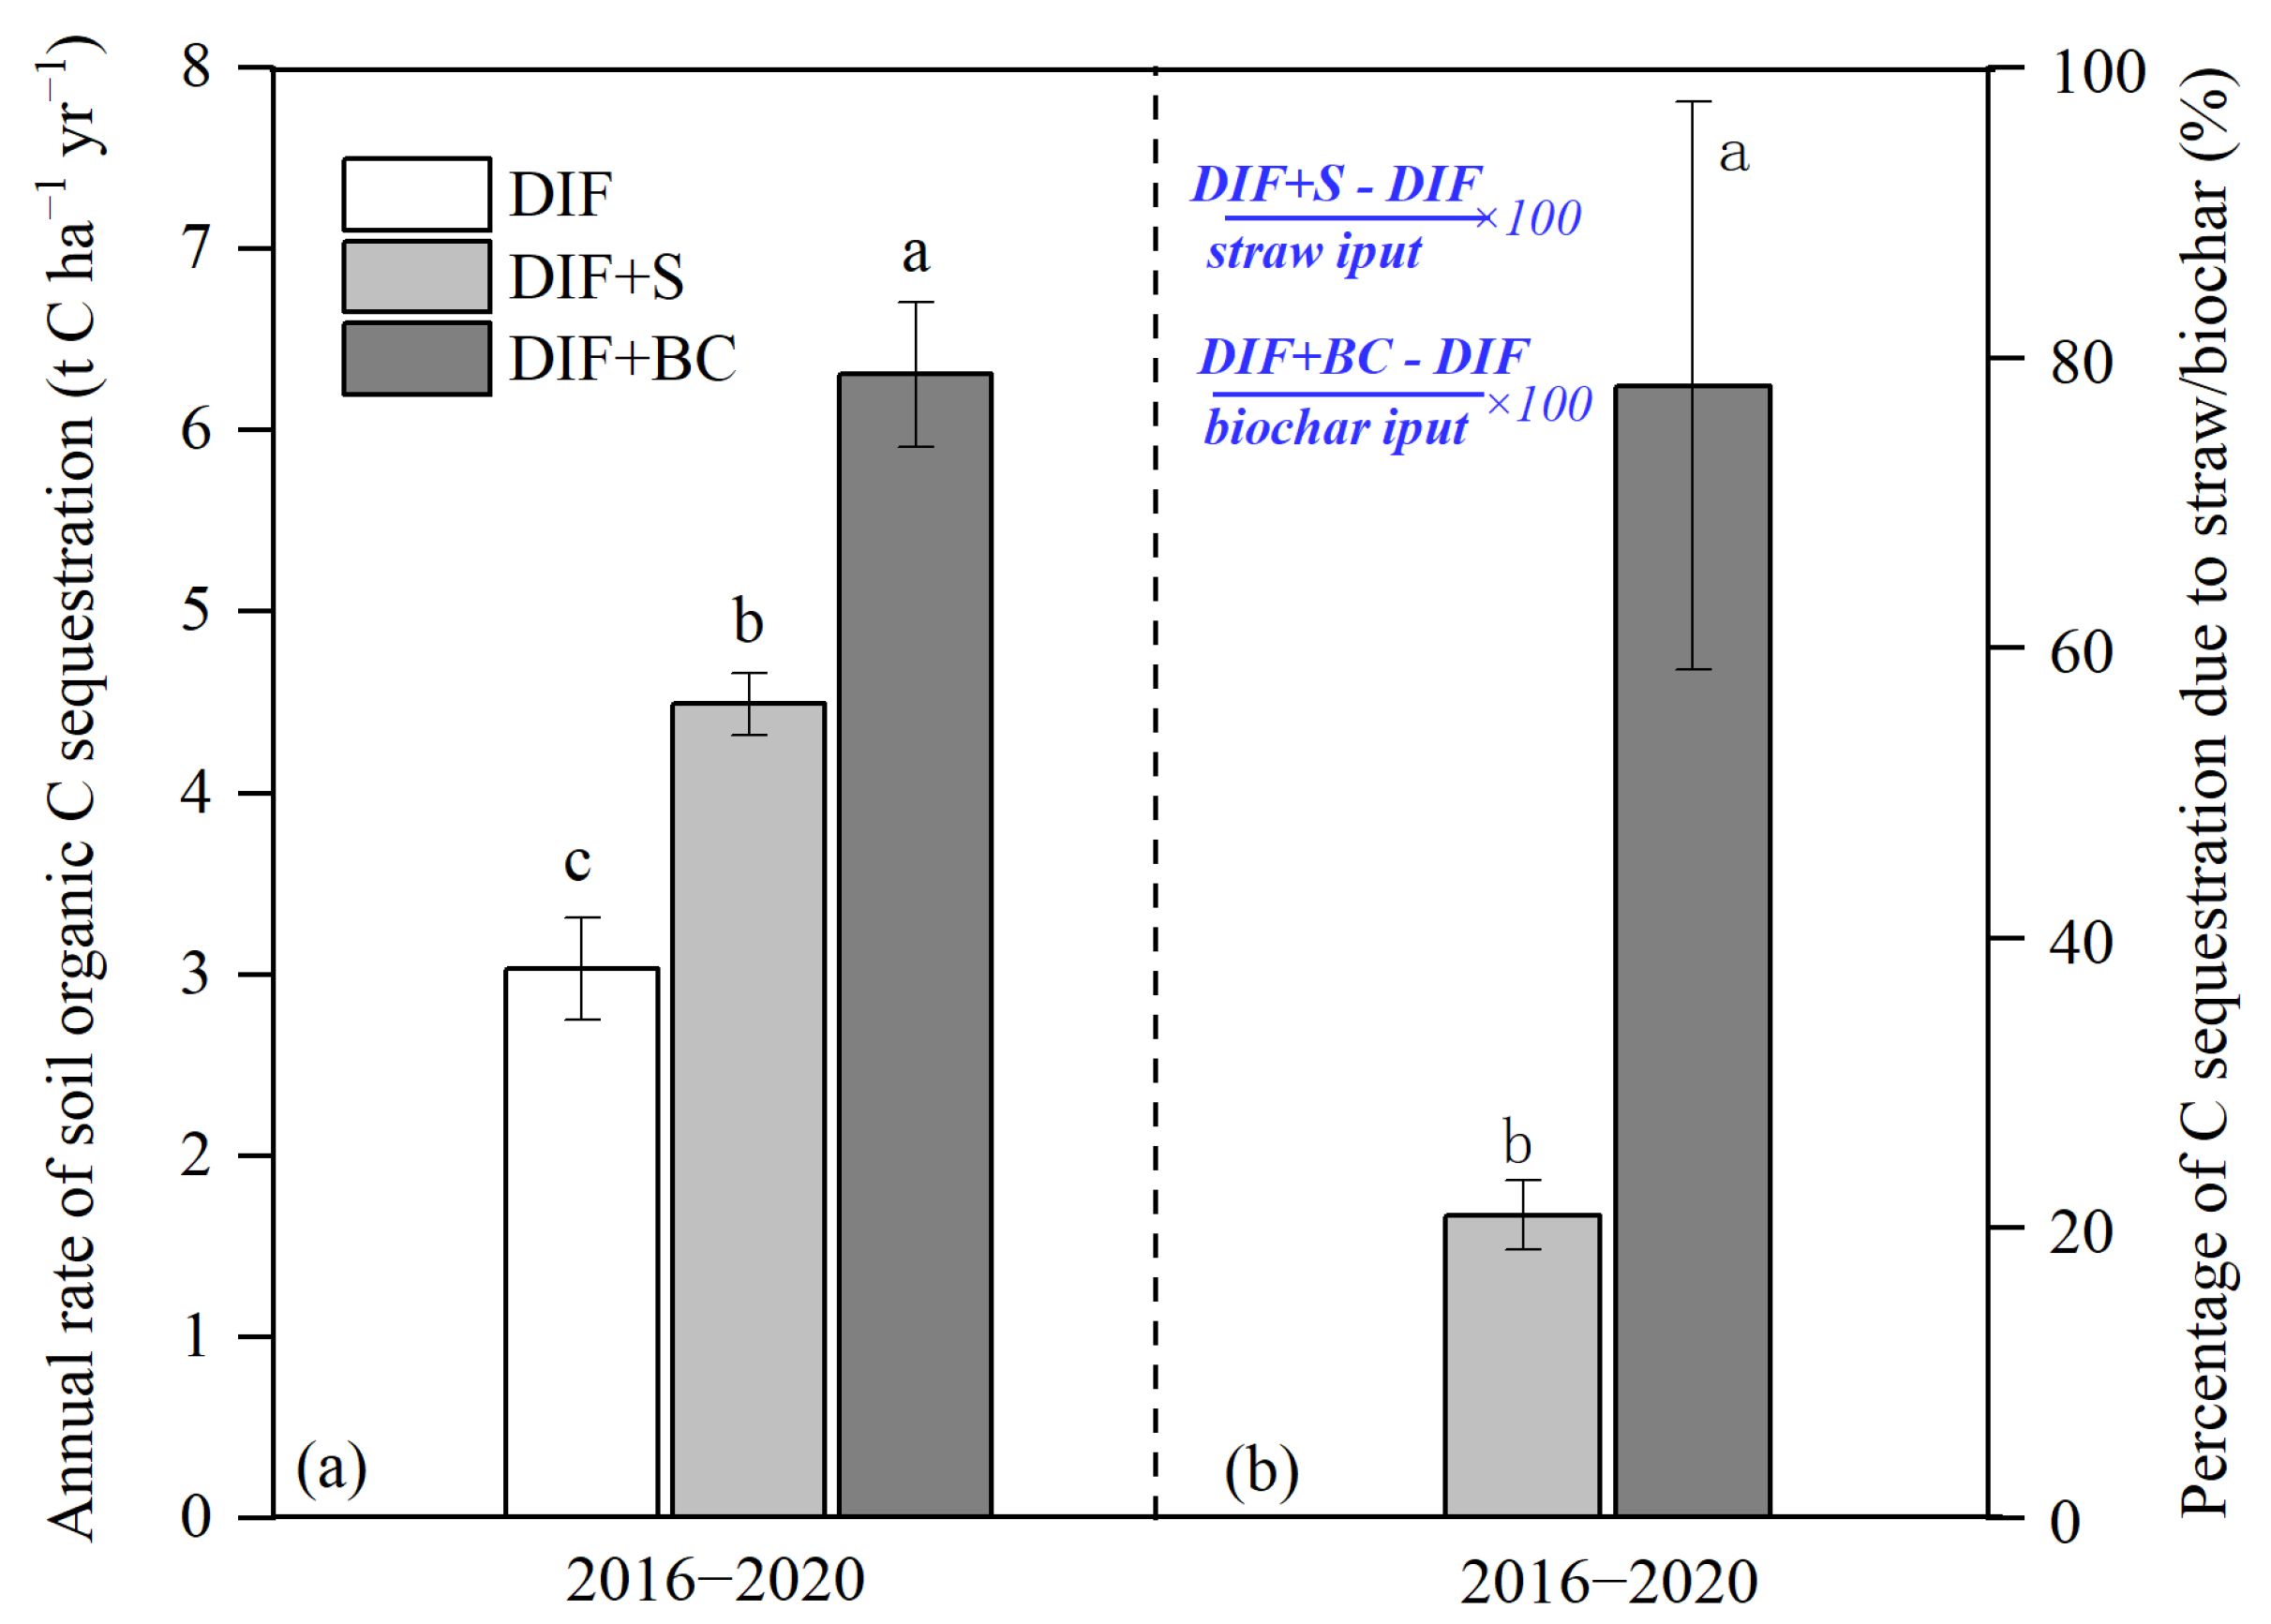
4.3. Changes in Rates of Soil C Sequestration Due to Additional C Inputs

Over the 4-year observation period, annual increases were found in topsoil SOC content in the range of 3.03 (DIF)–6.31 (DIF+BC) t C ha−1 yr−1 for all treatments (Figure 7a). These can be confirmed by the change in SOC and by the soil δ13C signature (Figure 6). By contrast, no significant increase in SOC concentration was found in a parallel experiment, where tomatoes were grown by applying farmers’ conventional management of flood irrigation with over-fertilization [18,78]. Thus, drip fertigation may generally improve soil C sequestration even for DIF treatment solely originating from the added chicken manure, which was used as a basal fertilizer. Moreover, the input of additional exogenous organic material, maize straw or biochar, in the present study increased soil C sequestration, similar to the results of other studies (Figure 6) [27,79,80,81]. With regard to increasing soil C content, the most effective was the addition of biochar, as 78% of the added biochar carbon was finally found in the topsoil. By contrast, only 20% of the added straw-C remained in the topsoil (Figure 7b), whilst the remaining 80% was likely mineralized and respired. These observations were consistent with the results of recent meta-analyses on the effect of long-term straw return on SOC storage and sequestration in arable soils in China and India [82,83]. The much higher C sequestration rates for the DIF+BC treatment in the present study may be explained by the high stability of biochar, which strongly hampers its decomposition (Figure 6) [33,84,85].

5. Conclusions

This study showed that drip fertigation with the additional application of organic amendments in the form of straw or biochar is a suitable management option for greenhouse vegetable production. This approach significantly reduced irrigation water and fertilizer inputs, compared with farmers’ current conventional practice of flood irrigation with over-fertilization. The tested method resulted in high rates of soil carbon sequestration and reduced seasonal N2O emissions. This effect was most pronounced for biochar addition, whereas the effects of added straw on C sequestration rates and soil N2O emissions were lower. The different seasonal response of N2O emission induced by straw or biochar incorporation should be given further attention to optimize the carbon and nitrogen management of greenhouse vegetable soils. As many greenhouse vegetable production systems experience low indoor atmospheric CO2 concentrations during midday in the AW season, the combined application of straw and biochar is likely to be the best option for decreasing soil N2O emissions and increasing SOC stocks and soil respiration to favor crop growth.

Supplementary Materials

The following supporting information can be downloaded at: https://www.mdpi.com/article/10.3390/agronomy12071661/s1, Figure S1: Pearson’s correlation between daily N2O emissions and daily mean values of soil temperature, soil water-filled pore space (WFPS) and soil mineral N concentration (NO3-N and NH4+-N); Table S1: Growth duration; transplanting and final harvest dates of tomato cultivation; amount of mineral nitrogen, phosphate, potassium and organic fertiliser application; number of irrigation events and total amounts of irrigation water for different seasons in drip fertigation systems.

Author Contributions

Conceptualization, S.L. and Y.Z.; Methodology, Y.Z., H.L. and Y.W.; Investigation, J.H. and H.L.; Data Curation, S.L. and Y.Z.; Writing–Original Draft Preparation, Y.Z.; Writing–Review and Editing, K.B.-B., S.L. and Y.Z.; Project Administration, S.L. and K.B.-B.; Funding Acquisition, S.L., G.L. and K.B.-B. All authors have read and agreed to the published version of the manuscript.

Funding

This work was supported by the National Natural Science Foundation of China (grant no. 41761134087 and 42177013) and Deutsche Forschungsgemeinschaft (grant no. BU1173/19–1), co-supported by the Department of Science and technology of Hubei, China (2019ABA117).

Data Availability Statement

Not applicable.

Acknowledgments

We thank Yuanshi Gong for providing us with the gas chromatograph and the Tianjin Academy of Agricultural Sciences for providing us with working and available facilities.

Conflicts of Interest

The authors declare no conflict of interest.

References

  1. FAOSTAT. Production: Crop. 2020. Available online: http://www.fao.org/faostat/en/#data/QC (accessed on 21 July 2020).
  2. Li, T. Development Strategy of Greenhouse Horticulture in China; China Science Publishing & Media Ltd.: Beijing, China, 2020. [Google Scholar]
  3. Li, J.; Liu, H.; Wang, H.; Luo, J.; Zhang, X.; Liu, Z.; Zhang, Y.; Zhai, L.; Lei, Q.; Ren, T.; et al. Managing Irrigation and Fertilization for the Sustainable Cultivation of Greenhouse Vegetables. Agric. Water Manag. 2018, 210, 354–363. [Google Scholar] [CrossRef]
  4. Lv, H.; Lin, S.; Wang, Y.; Lian, X.; Zhao, Y.; Li, Y.; Du, J.; Wang, Z.; Wang, J.; Butterbach-Bahl, K. Drip Fertigation Significantly Reduces Nitrogen Leaching in Solar Greenhouse Vegetable Production System. Environ. Pollut. 2019, 245, 694–701. [Google Scholar] [CrossRef] [PubMed]
  5. Qasim, W.; Xia, L.; Lin, S.; Wan, L.; Zhao, Y.; Butterbach-Bahl, K. Global Greenhouse Vegetable Production Systems Are Hotspots of Soil N2O Emissions and Nitrogen Leaching: A Meta-Analysis. Environ. Pollut. 2021, 272, 116372. [Google Scholar] [CrossRef] [PubMed]
  6. Bai, X.; Gao, J.; Wang, S.; Cai, H.; Chen, Z.; Zhou, J. Excessive Nutrient Balance Surpluses in Newly Built Solar Greenhouses over Five Years Leads to High Nutrient Accumulations in Soil. Agric. Ecosyst. Environ. 2020, 288, 106717. [Google Scholar] [CrossRef]
  7. Lv, H.; Zhao, Y.; Wang, Y.; Wan, L.; Wang, J.; Butterbach-Bahl, K.; Lin, S. Conventional Flooding Irrigation and over Fertilization Drives Soil PH Decrease Not Only in the Top- but Also in Subsoil Layers in Solar Greenhouse Vegetable Production Systems. Geoderma 2020, 363, 114156. [Google Scholar] [CrossRef]
  8. Ni, B.; Zhang, W.; Xu, X.; Wang, L.; Bol, R.; Wang, K.; Hu, Z.; Zhang, H.; Meng, F. Exponential Relationship between N2O Emission and Fertilizer Nitrogen Input and Mechanisms for Improving Fertilizer Nitrogen Efficiency under Intensive Plastic-Shed Vegetable Production in China: A Systematic Analysis. Agric. Ecosyst. Environ. 2021, 312, 107353. [Google Scholar] [CrossRef]
  9. Guo, J.H.; Liu, X.J.; Zhang, Y.; Shen, J.L.; Han, W.X.; Zhang, W.F.; Christie, P.; Goulding, K.W.T.; Vitousek, P.M.; Zhang, F.S. Significant Acidification in Major Chinese Croplands. Science 2010, 327, 1008–1010. [Google Scholar] [CrossRef] [Green Version]
  10. Liang, H.; Lv, H.; Bachelor, W.D.; Lian, X.; Wang, Z.; Hu, K. Simulating Nitrate and DON Leaching to Optimize Water and N Management Practices for Greenhouse Vegetable Production Systems. Agric. Water Manag. 2020, 241, 106377. [Google Scholar] [CrossRef]
  11. Lv, H.; Zhou, W.; Dong, J.; He, S.; Chen, F.; Bi, M.; Wang, Q.; Li, J.; Liang, B. Irrigation Amount Dominates Soil Mineral Nitrogen Leaching in Plastic Shed Vegetable Production Systems. Agric. Ecosyst. Environ. 2021, 317, 107474. [Google Scholar] [CrossRef]
  12. Wang, X.; Zou, C.; Gao, X.; Guan, X.; Zhang, Y.; Shi, X.; Chen, X. Nitrate Leaching from Open-Field and Greenhouse Vegetable Systems in China: A Meta-Analysis. Environ. Sci. Pollut. Res. 2018, 25, 31007–31016. [Google Scholar] [CrossRef]
  13. Wang, X.; Zou, C.; Gao, X.; Guan, X.; Zhang, W.; Zhang, Y.; Shi, X.; Chen, X. Nitrous Oxide Emissions in Chinese Vegetable Systems: A Meta-Analysis. Environ. Pollut. 2018, 239, 375–383. [Google Scholar] [CrossRef] [PubMed]
  14. Yao, Z.; Yan, G.; Wang, R.; Zheng, X.; Liu, C.; Butterbach-Bahl, K. Drip Irrigation or Reduced N-Fertilizer Rate Can Mitigate the High Annual N2O + NO Fluxes from Chinese Intensive Greenhouse Vegetable Systems. Atmos. Environ. 2019, 212, 183–193. [Google Scholar] [CrossRef]
  15. Zhao, Y.; Lv, H.; Qasim, W.; Wan, L.; Wang, Y.; Lian, X.; Liu, Y.; Hu, J.; Wang, Z.; Li, G.; et al. Drip Fertigation with Straw Incorporation Significantly Reduces N2O Emission and N Leaching While Maintaining High Vegetable Yields in Solar Greenhouse Production. Environ. Pollut. 2021, 273, 116521. [Google Scholar] [CrossRef]
  16. Philibert, A.; Loyce, C.; Makowski, D. Quantifying Uncertainties in N2O Emission Due to N Fertilizer Application in Cultivated Areas. PLoS ONE 2012, 7, e50950. [Google Scholar] [CrossRef] [PubMed]
  17. Loveland, P. Is There a Critical Level of Organic Matter in the Agricultural Soils of Temperate Regions: A Review. Soil Tillage Res. 2003, 70, 1–18. [Google Scholar] [CrossRef]
  18. Wang, Y.; Dannenmann, M.; Lin, S.; Lv, H.; Li, G.; Lian, X.; Wang, Z.; Wang, J.; Butterbach-Bahl, K. Improving Soil Respiration While Maintaining Soil C Stocks in Sunken Plastic Greenhouse Vegetable Production Systems–Advantages of Straw Application and Drip Fertigation. Agric. Ecosyst. Environ. 2021, 316, 107464. [Google Scholar] [CrossRef]
  19. Fei, C.; Zhang, S.; Li, J.; Liang, B.; Ding, X. Partial Substitution of Rice Husks for Manure in Greenhouse Vegetable Fields: Insight from Soil Carbon Stock and Aggregate Stability. Land Degrad. Dev. 2021, 32, 3962–3972. [Google Scholar] [CrossRef]
  20. Sierra, J.; Causeret, F.; Chopin, P. A Framework Coupling Farm Typology and Biophysical Modelling to Assess the Impact of Vegetable Crop-Based Systems on Soil Carbon Stocks. Application in the Caribbean. Agric. Syst. 2017, 153, 172–180. [Google Scholar] [CrossRef]
  21. Yan, Y.; Cheng-Hua, L.; Zhong-Jian, P. Effect of Greenhouse Soil Management on Soil Aggregation and Organic Matter in Northeast China. Catena 2015, 133, 412–419. [Google Scholar] [CrossRef]
  22. Liu, S.; Li, Q.; Wang, F.; Shang, M. Design and Applied Research of an Intelligent Cooling Vetiliation Fan for Greenhouse. Shandong Agric. Sci. 2018, 50, 147–150. [Google Scholar]
  23. Dahri, I.A.; Tagar, A.A.; Adamowski, J.; Leghari, N.; Shah, A.R.; Soomro, S.A. Influence of Straw Incorporation-to-Planting Interval on Soil Physical Properties and Maize Performance. Int. Agrophysics 2018, 32, 341–348. [Google Scholar] [CrossRef]
  24. Huang, R.; Liu, J.; He, X.; Xie, D.; Ni, J.; Xu, C.; Zhang, Y.; Ci, E.; Wang, Z.; Gao, M. Reduced Mineral Fertilization Coupled with Straw Return in Field Mesocosm Vegetable Cultivation Helps to Coordinate Greenhouse Gas Emissions and Vegetable Production. J. Soils Sediments 2020, 20, 1834–1845. [Google Scholar] [CrossRef]
  25. Lou, Y.; Xu, M.; Wang, W.; Sun, X.; Liang, C. Soil Organic Carbon Fractions and Management Index after 20 Yr of Manure and Fertilizer Application for Greenhouse Vegetables: Soil Organic C and Fertilizer Use. Soil Use Manag. 2011, 27, 163–169. [Google Scholar] [CrossRef]
  26. Luan, H.; Gao, W.; Huang, S.; Tang, J.; Li, M.; Zhang, H.; Chen, X.; Masiliūnas, D. Organic Amendment Increases Soil Respiration in a Greenhouse Vegetable Production System through Decreasing Soil Organic Carbon Recalcitrance and Increasing Carbon-Degrading Microbial Activity. J. Soils Sediments 2020, 20, 2877–2892. [Google Scholar] [CrossRef]
  27. Poulton, P.; Johnston, J.; Macdonald, A.; White, R.; Powlson, D. Major Limitations to Achieving “4 per 1000” Increases in Soil Organic Carbon Stock in Temperate Regions: Evidence from Long-Term Experiments at Rothamsted Research, United Kingdom. Glob. Change Biol. 2018, 24, 2563–2584. [Google Scholar] [CrossRef] [Green Version]
  28. Butterbach-Bahl, K.; Baggs, E.M.; Dannenmann, M.; Kiese, R.; Zechmeister-Boltenstern, S. Nitrous Oxide Emissions from Soils: How Well Do We Understand the Processes and Their Controls? Phil. Trans. R. Soc. B 2013, 368, 20130122. [Google Scholar] [CrossRef] [PubMed]
  29. Duan, M.; Wu, F.; Jia, Z.; Wang, S.; Cai, Y.; Chang, S.X. Wheat Straw and Its Biochar Differently Affect Soil Properties and Field-Based Greenhouse Gas Emission in a Chernozemic Soil. Biol. Fertil. Soils 2020, 56, 1023–1036. [Google Scholar] [CrossRef]
  30. Guenet, B.; Gabrielle, B.; Chenu, C.; Arrouays, D.; Balesdent, J.; Bernoux, M.; Bruni, E.; Caliman, J.-P.; Cardinael, R.; Chen, S.; et al. Can N2O Emissions Offset the Benefits from Soil Organic Carbon Storage? Glob. Chang. Biol. 2021, 27, 237–256. [Google Scholar] [CrossRef]
  31. Shafique, H.A.; Sultana, V.; Ehteshamul-Haque, S.; Athar, M. Management of Soil-Borne Diseases of Organic Vegetables. J. Plant Prot. Res. 2016, 56, 221–230. [Google Scholar] [CrossRef]
  32. Zhao, Y.; Lin, S.; Liu, Y.; Li, G.; Wang, J.; Butterbach-Bahl, K. Application of Mixed Straw and Biochar Meets Plant Demand of Carbon Dioxide and Increases Soil Carbon Storage in Sunken Solar Greenhouse Vegetable Production. Soil Use Manag. 2020, 36, 439–448. [Google Scholar] [CrossRef]
  33. Case, S.D.C.; McNamara, N.P.; Reay, D.S.; Whitaker, J. The Effect of Biochar Addition on N2O and CO2 Emissions from a Sandy Loam Soil–The Role of Soil Aeration. Soil Biol. Biochem. 2012, 51, 125–134. [Google Scholar] [CrossRef]
  34. Hansen, V.; Müller-Stöver, D.; Munkholm, L.J.; Peltre, C.; Hauggaard-Nielsen, H.; Jensen, L.S. The Effect of Straw and Wood Gasification Biochar on Carbon Sequestration, Selected Soil Fertility Indicators and Functional Groups in Soil: An Incubation Study. Geoderma 2016, 269, 99–107. [Google Scholar] [CrossRef]
  35. Kang, S.-W.; Kim, S.-H.; Park, J.-H.; Seo, D.-C.; Ok, Y.S.; Cho, J.-S. Effect of Biochar Derived from Barley Straw on Soil Physicochemical Properties, Crop Growth, and Nitrous Oxide Emission in an Upland Field in South Korea. Env. Sci. Pollut. Res. 2018, 25, 25813–25821. [Google Scholar] [CrossRef]
  36. Rajput, V.; Minkina, T.; Ahmed, B.; Singh, V.; Mandzhieva, S.; Sushkova, S.; Bauer, T.; Verma, K.; Shan, S.; van Hullebusch, E.; et al. Nano-Biochar: A Novel Solution for Sustainable Agriculture and Environmental Remediation. Environ. Res. 2022, 210, 112891. [Google Scholar] [CrossRef]
  37. Borchard, N.; Schirrmann, M.; Cayuela, M.L.; Kammann, C.; Wrage-Mönnig, N.; Estavillo, J.M.; Fuertes-Mendizábal, T.; Sigua, G.; Spokas, K.; Ippolito, J.A.; et al. Biochar, Soil and Land-Use Interactions That Reduce Nitrate Leaching and N2O Emissions: A Meta-Analysis. Sci. Total Environ. 2019, 651, 2354–2364. [Google Scholar] [CrossRef] [PubMed]
  38. Cayuela, M.L.; van Zwieten, L.; Singh, B.P.; Jeffery, S.; Roig, A.; Sánchez-Monedero, M.A. Biochar’s Role in Mitigating Soil Nitrous Oxide Emissions: A Review and Meta-Analysis. Agric. Ecosyst. Environ. 2014, 191, 5–16. [Google Scholar] [CrossRef]
  39. Lehmann, J.; Cowie, A.; Masiello, C.A.; Kammann, C.; Woolf, D.; Amonette, J.E.; Cayuela, M.L.; Camps-Arbestain, M.; Whitman, T. Biochar in Climate Change Mitigation. Nat. Geosci. 2021, 14, 883–892. [Google Scholar] [CrossRef]
  40. Yan, Q.; Dong, F.; Li, J.; Duan, Z.; Yang, F.; Li, X.; Lu, J.; Li, F. Effects of Maize Straw-Derived Biochar Application on Soil Temperature, Water Conditions and Growth of Winter Wheat. Eur. J. Soil Sci. 2019, 70, 1280–1289. [Google Scholar] [CrossRef]
  41. Obia, A.; Mulder, J.; Hale, S.E.; Nurida, N.L.; Cornelissen, G. The Potential of Biochar in Improving Drainage, Aeration and Maize Yields in Heavy Clay Soils. PLoS ONE 2018, 13, e0196794. [Google Scholar] [CrossRef]
  42. Wang, C.; Ma, X.; Wang, G.; Li, G.; Zhu, K. Implication of O2 Dynamics for Both N2O and CH4 Emissions from Soil during Biological Soil Disinfestation. Sci. Rep. 2021, 11, 6590. [Google Scholar] [CrossRef]
  43. Bai, S.H.; Reverchon, F.; Xu, C.-Y.; Xu, Z.; Blumfield, T.J.; Zhao, H.; van Zwieten, L.; Wallace, H.M. Wood Biochar Increases Nitrogen Retention in Field Settings Mainly through Abiotic Processes. Soil Biol. Biochem. 2015, 90, 232–240. [Google Scholar] [CrossRef]
  44. Teutscherova, N.; Houška, J.; Navas, M.; Masaguer, A.; Benito, M.; Vazquez, E. Leaching of Ammonium and Nitrate from Acrisol and Calcisol Amended with Holm Oak Biochar: A Column Study. Geoderma 2018, 323, 136–145. [Google Scholar] [CrossRef]
  45. Duan, P.; Zhang, X.; Zhang, Q.; Wu, Z.; Xiong, Z. Field-Aged Biochar Stimulated N2O Production from Greenhouse Vegetable Production Soils by Nitrification and Denitrification. Sci. Total Environ. 2018, 642, 1303–1310. [Google Scholar] [CrossRef] [PubMed]
  46. Jia, J.; Li, B.; Chen, Z.; Xie, Z.; Xiong, Z. Effects of Biochar Application on Vegetable Production and Emissions of N2O and CH4. Soil Sci. Plant Nutr. 2012, 58, 503–509. [Google Scholar] [CrossRef] [Green Version]
  47. Li, B.; Huang, W.; Elsgaard, L.; Yang, B.; Li, Z.; Yang, H.; Lu, Y. Optimal Biochar Amendment Rate Reduced the Yield-Scaled N2O Emissions from Ultisols in an Intensive Vegetable Field in South China. Sci. Total Environ. 2020, 723, 138161. [Google Scholar] [CrossRef]
  48. Cayuela, M.L.; Sánchez-Monedero, M.A.; Roig, A.; Hanley, K.; Enders, A.; Lehmann, J. Biochar and Denitrification in Soils: When, How Much and Why Does Biochar Reduce N2O Emissions? Sci. Rep. 2013, 3, 1732. [Google Scholar] [CrossRef] [Green Version]
  49. Hutchinson, G.L.; Livingston, G.P. Use of chamber systems to measure trace gas fluxes. In Agricultural Ecosystem Effects on Trace Gases and Global Climate Change; John Wiley & Sons, Ltd.: Hoboken, NJ, USA, 1993; pp. 63–78. ISBN 978-0-89118-321-1. [Google Scholar]
  50. Jastrow, J.D.; Miller, R.M.; Boutton, T.W. Carbon Dynamics of Aggregate-Associated Organic Matter Estimated by Carbon-13 Natural Abundance. Soil Sci. Soc. Am. J. 1996, 60, 801–807. [Google Scholar] [CrossRef]
  51. Jia, J.; Sun, L.; Kong, X.; Yan, X.; Xiong, Z. Annual N2O and CH4 Emissions from Intensively Managed Vegetable Fields in Nanjing, China. Soil Sci. Plant Nutr. 2012, 58, 91–103. [Google Scholar] [CrossRef]
  52. Wang, J.; Zhang, J.; Müller, C.; Cai, Z. The Mechanisms of High N2O Emissions from Greenhouse Vegetable Field Soils: Soil. Clean-Soil Air Water 2017, 45, 1600210. [Google Scholar] [CrossRef]
  53. Martens-Habbena, W.; Berube, P.M.; Urakawa, H.; de la Torre, J.R.; Stahl, D.A. Ammonia Oxidation Kinetics Determine Niche Separation of Nitrifying Archaea and Bacteria. Nature 2009, 461, 976–979. [Google Scholar] [CrossRef]
  54. Verhoeven, E.; Decock, C.; Barthel, M.; Bertora, C.; Sacco, D.; Romani, M.; Sleutel, S.; Six, J. Nitrification and Coupled Nitrification-Denitrification at Shallow Depths Are Responsible for Early Season N2O Emissions under Alternate Wetting and Drying Management in an Italian Rice Paddy System. Soil Biol. Biochem. 2018, 120, 58–69. [Google Scholar] [CrossRef]
  55. Qasim, W.; Zhao, Y.; Wan, L.; Lv, H.; Lin, S.; Gettel, G.M.; Butterbach-Bahl, K. The Potential Importance of Soil Denitrification as a Major N Loss Pathway in Intensive Greenhouse Vegetable Production Systems. Plant Soil 2022, 471, 157–174. [Google Scholar] [CrossRef]
  56. Burger, M.; Jackson, L.E.; Lundquist, E.J.; Louie, D.T.; Miller, R.L.; Rolston, D.E.; Scow, K.M. Microbial Responses and Nitrous Oxide Emissions during Wetting and Drying of Organically and Conventionally Managed Soil under Tomatoes. Biol. Fertil. Soils 2005, 42, 109–118. [Google Scholar] [CrossRef]
  57. Vico, A.; Sáez, J.A.; Pérez-Murcia, M.D.; Martinez-Tomé, J.; Andreu-Rodríguez, J.; Agulló, E.; Bustamante, M.A.; Sanz-Cobena, A.; Moral, R. Production of Spinach in Intensive Mediterranean Horticultural Systems Can Be Sustained by Organic-Based Fertilizers without Yield Penalties and with Low Environmental Impacts. Agric. Syst. 2020, 178, 102765. [Google Scholar] [CrossRef]
  58. Butterbach-Bahl, K.; Dannenmann, M. Denitrification and Associated Soil N2O Emissions Due to Agricultural Activities in a Changing Climate. Curr. Opin. Environ. Sustain. 2011, 3, 389–395. [Google Scholar] [CrossRef]
  59. Chen, Y.; Huang, B.; Hu, W.; Weindorf, D.C.; Yang, L. Environmental Assessment of Closed Greenhouse Vegetable Production System in Nanjing, China. J. Soils Sediments 2013, 13, 1418–1429. [Google Scholar] [CrossRef]
  60. Khalil, M.I.; Baggs, E.M. CH4 Oxidation and N2O Emissions at Varied Soil Water-Filled Pore Spaces and Headspace CH4 Concentrations. Soil Biol. Biochem. 2005, 37, 1785–1794. [Google Scholar] [CrossRef]
  61. Yao, Z.; Yan, G.; Zheng, X.; Wang, R.; Liu, C.; Butterbach-Bahl, K. Straw Return Reduces Yield-Scaled N2O plus NO Emissions from Annual Winter Wheat-Based Cropping Systems in the North China Plain. Sci. Total Environ. 2017, 590, 174–185. [Google Scholar] [CrossRef]
  62. Fan, C.; Chen, H.; Li, B.; Xiong, Z. Biochar Reduces Yield-Scaled Emissions of Reactive Nitrogen Gases from Vegetable Soils across China. Biogeosciences 2017, 14, 2851–2863. [Google Scholar] [CrossRef] [Green Version]
  63. Lee, S.-I.; Park, H.-J.; Jeong, Y.-J.; Seo, B.-S.; Kwak, J.-H.; Yang, H.I.; Xu, X.; Tang, S.; Cheng, W.; Lim, S.-S.; et al. Biochar-Induced Reduction of N2O Emission from East Asian Soils under Aerobic Conditions: Review and Data Analysis. Environ. Pollut. 2021, 291, 118154. [Google Scholar] [CrossRef]
  64. Bamminger, C.; Poll, C.; Marhan, S. Offsetting Global Warming-Induced Elevated Greenhouse Gas Emissions from an Arable Soil by Biochar Application. Glob. Change Biol. 2018, 24, e318–e334. [Google Scholar] [CrossRef]
  65. Lin, Y.; Ding, W.; Liu, D.; He, T.; Yoo, G.; Yuan, J.; Chen, Z.; Fan, J. Wheat Straw-Derived Biochar Amendment Stimulated N2O Emissions from Rice Paddy Soils by Regulating the AmoA Genes of Ammonia-Oxidizing Bacteria. Soil Biol. Biochem. 2017, 113, 89–98. [Google Scholar] [CrossRef]
  66. Zavalloni, C.; Alberti, G.; Biasiol, S.; Vedove, G.D.; Fornasier, F.; Liu, J.; Peressotti, A. Microbial Mineralization of Biochar and Wheat Straw Mixture in Soil: A Short-Term Study. Appl. Soil Ecol. 2011, 50, 45–51. [Google Scholar] [CrossRef]
  67. Akiyama, H.; Yamamoto, A.; Uchida, Y.; Hoshino, Y.T.; Tago, K.; Wang, Y.; Hayatsu, M. Effect of Low C/N Crop Residue Input on N2O, NO, and CH4 Fluxes from Andosol and Fluvisol Fields. Sci. Total Environ. 2020, 713, 136677. [Google Scholar] [CrossRef] [PubMed]
  68. Harter, J.; Krause, H.-M.; Schuettler, S.; Ruser, R.; Fromme, M.; Scholten, T.; Kappler, A.; Behrens, S. Linking N2O Emissions from Biochar-Amended Soil to the Structure and Function of the N-Cycling Microbial Community. ISME J. 2014, 8, 660–674. [Google Scholar] [CrossRef] [PubMed]
  69. Gorovtsov, A.V.; Minkina, T.M.; Mandzhieva, S.S.; Perelomov, L.V.; Soja, G.; Zamulina, I.V.; Rajput, V.D.; Sushkova, S.N.; Mohan, D.; Yao, J. The Mechanisms of Biochar Interactions with Microorganisms in Soil. Env. Geochem Health 2020, 42, 2495–2518. [Google Scholar] [CrossRef]
  70. Wang, Z.; Zong, H.; Zheng, H.; Liu, G.; Chen, L.; Xing, B. Reduced Nitrification and Abundance of Ammonia-Oxidizing Bacteria in Acidic Soil Amended with Biochar. Chemosphere 2015, 138, 576–583. [Google Scholar] [CrossRef]
  71. Cui, P.; Fan, F.; Yin, C.; Song, A.; Huang, P.; Tang, Y.; Zhu, P.; Peng, C.; Li, T.; Wakelin, S.A.; et al. Long-Term Organic and Inorganic Fertilization Alters Temperature Sensitivity of Potential N2O Emissions and Associated Microbes. Soil Biol. Biochem. 2016, 93, 131–141. [Google Scholar] [CrossRef]
  72. He, T.; Yuan, J.; Luo, J.; Wang, W.; Fan, J.; Liu, D.; Ding, W. Organic Fertilizers Have Divergent Effects on Soil N2O Emissions. Biol. Fertil. Soils 2019, 55, 685–699. [Google Scholar] [CrossRef]
  73. Brettar, I.; Sanchez-Perez, J.-M.; Tremolieres, M. Nitrate Elimination by Denitrification in Hardwood Forest Soils of the Upper Rhine FLoodplain–Correlation with Redox Potential and Organic Matter. Hydrobiologia 2002, 469, 11–21. [Google Scholar] [CrossRef] [Green Version]
  74. Pan, F.; Chapman, S.J.; Li, Y.; Yao, H. Straw Amendment to Paddy Soil Stimulates Denitrification but Biochar Amendment Promotes Anaerobic Ammonia Oxidation. J. Soils Sediments 2017, 17, 2428–2437. [Google Scholar] [CrossRef]
  75. Wei, Z.; Shan, J.; Chai, Y.; Well, R.; Yan, X.; Senbayram, M. Regulation of the Product Stoichiometry of Denitrification in Intensively Managed Soils. Food Energy Secur. 2020, 9, e251. [Google Scholar] [CrossRef]
  76. Rechberger, M.V.; Kloss, S.; Rennhofer, H.; Tintner, J.; Watzinger, A.; Soja, G.; Lichtenegger, H.; Zehetner, F. Changes in Biochar Physical and Chemical Properties: Accelerated Biochar Aging in an Acidic Soil. Carbon 2017, 115, 209–219. [Google Scholar] [CrossRef]
  77. Yang, Y.; Meehan, B.; Shah, K.; Surapaneni, A.; Hughes, J.; Fouché, L.; Paz-Ferreiro, J. Physicochemical Properties of Biochars Produced from Biosolids in Victoria, Australia. Int. J. Environ. Res. Public Health 2018, 15, 1459. [Google Scholar] [CrossRef] [PubMed] [Green Version]
  78. Mancinelli, R.; Marinari, S.; Brunetti, P.; Radicetti, E.; Campiglia, E. Organic Mulching, Irrigation and Fertilization Affect Soil CO2 Emission and C Storage in Tomato Crop in the Mediterranean Environment. Soil Tillage Res. 2015, 152, 39–51. [Google Scholar] [CrossRef]
  79. Farina, R.; Testani, E.; Campanelli, G.; Leteo, F.; Napoli, R.; Canali, S.; Tittarelli, F. Potential Carbon Sequestration in a Mediterranean Organic Vegetable Cropping System. A Model Approach for Evaluating the Effects of Compost and Agro-Ecological Service Crops (ASCs). Agric. Syst. 2018, 162, 239–248. [Google Scholar] [CrossRef]
  80. Smith, P. Soil Carbon Sequestration and Biochar as Negative Emission Technologies. Glob. Chang. Biol. 2016, 22, 1315–1324. [Google Scholar] [CrossRef]
  81. Jatav, H.S.; Rajput, V.D.; Minkina, T.; Singh, S.K.; Chejara, S.; Gorovtsov, A.; Barakhov, A.; Bauer, T.; Sushkova, S.; Mandzhieva, S.; et al. Sustainable Approach and Safe Use of Biochar and Its Possible Consequences. Sustainability 2021, 13, 10362. [Google Scholar] [CrossRef]
  82. Berhane, M.; Xu, M.; Liang, Z.; Shi, J.; Wei, G.; Tian, X. Effects of Long-term Straw Return on Soil Organic Carbon Storage and Sequestration Rate in North China Upland Crops: A Meta-analysis. Glob. Chang. Biol. 2020, 26, 2686–2701. [Google Scholar] [CrossRef]
  83. Dhaliwal, S.S.; Naresh, R.K.; Gupta, R.K.; Panwar, A.S.; Mahajan, N.C.; Singh, R.; Mandal, A. Effect of Tillage and Straw Return on Carbon Footprints, Soil Organic Carbon Fractions and Soil Microbial Community in Different Textured Soils under Rice–Wheat Rotation: A Review. Rev. Environ. Sci. Biotechnol. 2020, 19, 103–115. [Google Scholar] [CrossRef]
  84. Asai, H.; Samson, B.K.; Stephan, H.M.; Songyikhangsuthor, K.; Homma, K.; Kiyono, Y.; Inoue, Y.; Shiraiwa, T.; Horie, T. Biochar Amendment Techniques for Upland Rice Production in Northern Laos. Field Crops Res. 2009, 111, 81–84. [Google Scholar] [CrossRef]
  85. Woolf, D.; Amonette, J.E.; Street-Perrott, F.A.; Lehmann, J.; Joseph, S. Sustainable Biochar to Mitigate Global Climate Change. Nat. Commun. 2010, 1, 56. [Google Scholar] [CrossRef] [PubMed] [Green Version]
Figure 1. Temporal dynamics of daily fertigation (i.e., synthetic fertilizers applied with irrigation water) (a), cumulative amount of irrigation and fertilization (b), soil temperature (c) and soil water-filled pore space (WFPS, 0–12 cm soil depth) (d) and soil inorganic N concentrations in 0–30 cm soil depth ((e): NO3-N concentration; (f): NH4+-N concentration) for the three growing seasons, for which information on soil N2O fluxes (Figure 3) is also available. Different colors in panels (cf) refer to different treatments, including black: drip fertigation (DIF); red: drip fertigation with straw incorporation (DIF+S); blue: drip fertigation with biochar incorporation (DIF+BC). SDW represents soil dry weight. Error bars represent the standard error (n = 3).
Agronomy 12 01661 g001
Figure 2. Cumulative seasonal N2O emissions for 2018WS (a), 2018AW (b) and 2019WS (c) for the three different treatments. Following the 2018WS growing season, measurements of soil N2O fluxes also continued during the fallow period (52 days). DIF: drip fertigation; DIF+S: drip fertigation with straw incorporation; DIF+BC: drip fertigation with biochar incorporation. * indicates significant difference between treatments (p < 0.05, n = 3). Different lowercase letters indicate significant difference amongst three treatments (p < 0.05, n = 3). Error bars represent the standard error (n = 3).
Agronomy 12 01661 g002
Figure 3. Daily fluxes of N2O emissions during three growing seasons for the three different treatments (a) and differences in daily N2O emissions between with and without straw or biochar incorporation (b). DIF: drip fertigation; DIF+S: drip fertigation with straw incorporation; DIF+BC: drip fertigation with biochar incorporation. DIF+S − DIF and DIF+BC − DIF means the differences between with and without S or BC incorporation. Error bars represent the standard error (n = 3).
Agronomy 12 01661 g003
Figure 4. Structure equation model of daily N2O emissions and soil environment parameters (soil temperature, soil WFPS, soil NO3-N, and NH4+-N). The solid blue lines indicate a significant effect, whilst the dashed lines indicate no significant effect. Larger path coefficients are reflected in the width of blue lines. The numbers are standardized path coefficients. CMIN/DF, RMSEA, and AIC are goodness of fit statistics. ** p < 0.001, *** p < 0.001. (n = 208).
Agronomy 12 01661 g004
Figure 5. Pearson’s correlation between partial factor productivity of applied N fertilizer (PFPN) and apparent N2O emission factor (n = 25).
Agronomy 12 01661 g005
Figure 6. Observed changes in topsoil (0–30 cm) SOC contents (a) and soil organic matter δ13C values (b) for different treatments between January 2016 (start of the experiment) and February 2020. DIF: drip fertigation; DIF+S: drip fertigation with straw incorporation; DIF+BC: drip fertigation with biochar incorporation. Different lowercase letters indicate significant difference amongst three treatments at the end of experiment (p < 0.05, n = 3). *, ** and *** mean significant difference between 2016 and 2020 (p < 0.05, p < 0.01, p < 0.001, n = 3).
Agronomy 12 01661 g006
Figure 7. Calculated rates of annual soil C sequestration (a) and contribution of straw and biochar additions to total C sequestration between 2016 to 2020 (b). Different lowercase letters indicate significant difference amongst treatments (p < 0.05, n = 3). DIF: drip fertigation (DIF); DIF+S: drip fertigation with straw incorporation; DIF+BC: drip fertigation with biochar incorporation. Error bars represent the standard error (n = 3).
Agronomy 12 01661 g007
Table 1. General climatic characteristics at the experimental site and main soil properties of greenhouse soil (0–30 cm depth).
Characteristics of experimental site
SiteWuqin District, Tianjin
Coordinates39°25′35′′ N, 116°57′18′′ E
ClimateWarm temperate monsoon climate
Mean annual precipitation (mm)532 (1981–2020)
Mean annual air temperature (°C)13.5 (1981–2020)
Annual sunshine duration (h)2392 (Meteorological Observation Station)
Characteristics of experimental soil
Soil typeAquic cambisols (FAO classification)
Soil textureSilty loam
Particle fraction (%)
Sand (20–2000 µm)30 ± 1.40
Silt (2–20 µm)62 ± 1.50
Clay (<2 µm)8 ± 0.26
Bulk density (g cm−3)1.34 ± 0.02
Soil organic carbon (g kg−1)17.3 ± 1.31
pH8.6 ± 0.05
Electric conductivity (µs cm−1)370 ± 21
Values are expressed as the mean ± standard error (n ≥ 3).
Table 2. Total C and N concentrations and δ13C signature of chicken manure, maize straw and biochar. In addition, seasonal rates of organic matter applications for the different treatments are provided.
Total CTotal Nδ13CIncorporation Rate (kg C or N ha−1 Season−1)
DIFDIF+SDIF+BC
Organic Matter%%CNCNCN
Chicken manure13.2 ± 0.061.45 ± 0.01−21.83 ± 0.061182120018212001821200
Maize straw41.6 ± 0.100.96 ± 0.01−14.18 ± 0.055--350080.8--
Biochar54.8 ± 0.101.08 ± 0.01−24.37 ± 0.019----210041.4
Values are expressed as the mean ± standard error (n = 3). - means no addition.
Table 3. Seasonal and annual values of yield-scaled N2O emissions, apparent N2O emission factor, tomato yield and partial factor productivity of applied nitrogen fertilizer (PFPN) during winter–spring 2018, autumn–winter 2019 (2019AW) and winter–spring 2019 (2019WS).
2018WS2018AW2019WS2018–2019
Yield-scaled N2O emission (g N2O-N Mg−1)
DIF51.8 ± 8.2 a63.6 ± 14 a46.7 ± 15 a56.6 ± 9.4 a
DIF+S33.0 ± 7.7 ab75.3 ± 26 a25.5 ± 12 ab52.4 ± 17 a
DIF+BC24.6 ± 1.1 b64.8 ± 13 a13.0 ± 0.91 b40.5 ± 5.4 a
Apparent N2O emission factor (%)
DIF1.38 ± 0.22 a1.30 ± 0.28 a1.46 ± 0.48 a1.22 ± 0.16 a
DIF+S0.83 ± 0.19 ab1.61 ± 0.55 a0.81 ± 0.38 ab1.00 ± 0.29 a
DIF+BC0.67 ± 0.03 b1.46 ± 0.30 a0.48 ± 0.032 b0.82 ± 0.041a
Tomato yield (Mg fresh fruit ha−1)
DIF105 ± 2.0 a76.7 ± 3.9 a75.3 ± 3.3 b167 ± 4.5 b
DIF+S99.4 ± 13 a80.3 ± 5.2 a76.8 ± 5.6 ab176 ± 2.3 a
DIF+BC107 ± 5.6 a84.5 ± 12 a88.3 ± 2.8 a182 ± 15 a
PFPN (kg fresh fruit kg−1 N)
DIF266 ± 5.0 a204 ± 10 a210 ± 9.2 b222 ± 3.3 a
DIF+S252 ± 34 a213 ± 14 a214 ± 16 ab224 ± 19 a
DIF+BC271 ± 14 a225 ± 33 a246 ± 7.8 a242 ± 19 a
Data in figure are mean ± standard error (n = 3). Different lowercase letters indicate significant difference amongst drip fertigation (DIF), DIF with straw incorporation (DIF+S) and DIF with biochar incorporation (DIF+BC). n = 3, p < 0.05.
Publisher’s Note: MDPI stays neutral with regard to jurisdictional claims in published maps and institutional affiliations.

