Abstract
The Multi-Trait selection index (MTSI) has been used to select highly productive and stable faba bean landraces across various traits. Fifteen productive, morphological, and phenological traits with desired and undesired selection gains (SGs) were evaluated in fifteen faba bean landraces under Mediterranean field conditions between 2019–2021. According to our results, most of the faba bean traits are influenced by the genotype × environment interaction (GEI) effects. Banner length (BL), seed yield (SY), diameter (D), number of flowers per inflorescence (NFI), branch number (BRN), and 100 seed weight (HSW) were found to be highly influenced by the environment, the proportions of variance explained by environmental factors were arranged between 83.21% and 74.08%, and only seed number per pod (SNP) was the highest genotypic effect (54.02%). According to the MTSI index, only three landraces (Gaada Mascara (G4), Oued zentai (G13), and Khmakhem (G15)) were considered to be highly yield-productive and to have a broad adaptability across Mediterranean environments. When numerous traits were evaluated, the MTSI index provided a strong and powerful tool for developing improved selection techniques for Faba bean studies.
1. Introduction
Faba bean (Vicia faba L.), also referred to broad bean, fava bean, horse bean, or field bean is an annual herbaceous [1]. It can reduce up to 200 kg of atmospheric nitrogen (N2) per ha, thanks to its symbiotic relationship with rhizobium [2], thereby reducing the need for inorganic nitrogen fertilizers. The faba bean is an ideal protein source for humans [3,4]. According to Khazaei et al. [5], the average protein content of the Vicia faba seed varies from 24–35%. This legume originated in the Mediterranean and West Asia region [6,7,8].
In 2020, China lead faba bean production, accounting for 30.40% of the total world production, followed by Ethiopia, United Kingdom, and Australia [9]. In the Mediterranean countries, this crop is used as a source of protein for both human and animal nutrition because of the high nutritional value of its seeds [10]. Moreover, it plays a crucial function in crop rotation [11]; contributes to reduction of pest, diseases, and weed control in cereal production [12]; improves soil properties and fertility; and provides higher yields for following crops [13].
In Algeria, the faba bean is the most widely grown food legume [9]. It is grown in all of Algeria’s agro-ecological zones—the coastal plains, the inland plains, the High Plateau and the Biskra region [14]. It is cultivated especially for food and feed [15]. In Algeria, the cultivation of this legume has progressively decreased after independence (1962), from over 65,000 ha to less than 40,000 ha [9]. In 2020, approximately five thousand tonnes of faba beans were produced in Algeria on approximately 39,849 hectares, yielding an average of approximately 12.51 quintals per hectare [9]. Its seeds are used dry or fresh in traditional Algerian cuisine and are mainly utilized for homemade consumption and subsistence [16].
Broad bean culture in Algeria has not yet received the necessary attention and its harvest area has significantly declined since 1987 [9]. On the other hand, productivity and production did not improve (remained low), necessitating the use of imports to meet rising consumption [17].
One of the primary causes of the decline in faba bean cultivation in Algeria is the absence of improved cultivars [18]. Faba bean landraces are typically preserved in traditional farming systems by passing down traditional seeds from generation to generation [17]. According to Ouslim [19], abiotic and biotic factors are the primary factors that prevent faba beans from reaching their full yield potential and cause yield instability in Algeria.
The most effective method for overcoming biotic and abiotic constraints on faba bean production is to develop varieties suited to the environments in which faba bean is grown [20]. To increase the adoption of this crop, agricultural practices must be adjusted, integrated pest management strategies refined, genotypes resistant to major diseases and abiotic stresses such as frost and water stress should be developed [21,22,23,24], and genotype adaptation to changing environments must be improved [8].
Faba bean is considered a crop species that can adapt to a broad range of environmental conditions and soil types [25]. In contrast to non-legume species, the yield of faba bean, like that of many other legumes, is considered unstable due to its high interannual variability [4,26]. Faba bean cultivation is unsuitable in arid and semiarid regions because this crop is susceptible to moisture and high-temperature stresses and is not sufficiently drought and heat tolerant [27,28].
Faba bean yield is determined by several factors, including the number of pods per plant, the number of seeds per pod, and seed weight [29]. Previous research found that environmental effects and genotype x environment interactions (GEI) had a significant impact on faba bean yield [3,4]. Thus, the primary objective of the breeding programs for this plant is to achieve yield stability in various agricultural environments.
The main goals of faba bean genetic improvement are production stability, seed quality, and higher nitrogen fixation efficiency. For this reason, some plant breeders used classic stability indices, such as mean regression, coefficient of variation, and deviation from regression parameters of a single trait, often seed yield (SY), in order to select the desirable and well-adapted genotypes to a broad range of environments [30]. According to Olivoto et al. [31], these statistical tools are inadequate for determining the strengths and weaknesses of genotypes and selecting those with the desired selection gains (SGs) across different environmental conditions. This means that genotype selection must take into account the mean performance and stability (MPE) of multiple traits.
Based on this context, the current study intends to identify the stable and adaptable faba bean landraces for cultivation in the center north of Algeria over three consecutive years using MTSI index.
2. Materials and Methods
2.1. Experimental Site
During three growing seasons, a field experiment was carried out (2018–19, 2019–20 and 2020–21) at the experimental station of Higher National school of Algiers, 12 km south-east of Algiers (36°43.143′ N, 3°9.045′ E, 10 m of altitude). The climate is Csa (Hot-summer, Mediterranean climate) according to the Köppen–Geiger climate classification [32]. The weather regime, in terms of precipitation (P) and average temperatures (T-mean) during each month are given in Figure 1 for the three growing seasons as compared to the 32 years’ historical means (1990–2021). At the experimental site, the climatic trend was different from these 32 years of historical data, especially in the case of volume and distribution of rainfall.
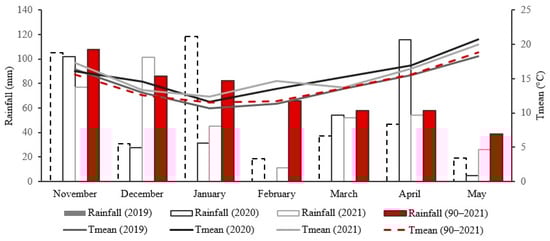
Figure 1.
Monthly rainfall and mean air temperatures at the experimental site during the three growing seasons (2019, 2020, and 2021) compared to the year historical means (1990–2021).
The trial carried out in the second season (2020) was characterized by a dry winter season (December–February) and moderately wet spring (March–May) compared to the other two growing seasons, in which the average cumulative rainfall was 103.95 mm and 57.00 mm lower and higher than the value recorded in the same winter and spring season in other growing seasons, respectively. The second and the third growing seasons were characterized by warmer conditions—mean air temperature was 1.3 and 1.2 °C, respectively—higher when compared to the long-term 32 years.
Following the computation of the deciles index (DI) on a seasonal scale [33], the first (2019), second (2020), and third growing (2021) seasons were classified as weak, severe, and moderate drought winters, respectively, whereas the spring for these three growing seasons was classified as normal.
Based on analysis performed in 2018, the site soil (0–30 cm) comprised 29.5% clay, 36.85% silt, and 25.65% sand (clay loam in texture, Soil Survey Staff [34]). The pH of the soil was alkaline (8.27); electrical conductivity (ECe) was 0.2 dS m−1; organic matter content was 2.64 g kg−1; total nitrogen was 1.1 g kg−1; available P was 24.5 ppm; and calcium carbonate (CaCO3) was 14.77 g kg−1.
2.2. Crop Management and Experimental Design
Fifteen landraces of faba bean from different geographical regions of Algeria were collected and used in the current study. Collection sites were localized in 15 provinces of Algeria (Table 1). The seeds for the trials were sown on 22 November, 20 November, and 16 December, in the first, second, and third growing seasons, respectively. The harvest was carried out at the end of May for all growing seasons. The plot size was 46.64 m2 (with 0.55 m row spacing and 0.35 m between two plants) and sown at a rate of 10 plants m−2. The sowing was conducted using a randomized complete block design (RCBD) with four replications. A passage by cover-crop was conducted in September of each growing season in order to bury the plant debris of the preceding culture followed by a plowing, which was carried out at the beginning of October with an aim of storing the first rains of autumn, and finally a last passage of the cover-crop was carried out at the end of October in order to loosen the seedbed.

Table 1.
The landraces materials and their locations.
2.3. Measurements
During the growing season, we evaluated the following phenological traits: number of branches per plant (NBR), plant height (cm), plant diameter (cm), leaf area index (LAI), number of inflorescences per plant (NIP), number of flowers per inflorescence (NFI), and banner length (or standard petal; BL; cm).
At maturity, 12 plants in each block across all three growing seasons were harvested by hand to determine seed yield (SY; t ha−1) and seven yield-component traits, namely above-ground biomass (AGB; g plant−1), harvest index (HI; %); pod length (PL; cm), number of seeds per pod (SNP), pods number per plant (PNP), number of aborted ovules/pod (NAOP), and hundred seed weight (HSW; g).
2.4. Statistical Analysis
All dependent variables were preliminarily evaluated for normal distribution and homogeneity of variance according to the Kolmogorov–Smirnov test and Bartlett’s test, respectively. Since the normality assumption was violated, we transformed data into normal scores in order to apply any standard parametric procedure. The total of fifteen traits were analyzed using a mixed-model approach to evaluate the significance of the genotype (G), and environment (E) effects and their interactions (GEI) based on the variance components’ structure. Likelihood ratio test (LRT) of variance components were obtained by restricted maximum likelihood (REML) using the expectation–maximization algorithm [35].
To quantify the performance and stability of the seed yield (SY) and determine the strengths and weaknesses of genotypes and select those with the desired selection gains (SGs), we used in this study the superiority index (WAASBY: weighted average of absolute scores from the singular value decomposition of the matrix of best linear unbiased predictions for the genotype × environment interaction effects generated by an linear mixed-effect model and response variable) and the MTSI according to Olivoto et al.’s procedure [36,37].
The WAASBY was calculated to take into account the MPE of individual traits, which permits weighting between mean performance (SY) and stability (WAASB). WAASB is the weighted average of absolute scores from the singular value decomposition (SVD) of the best linear unbiased predictions (BLUP) matrix for the GE interaction effect [36].
The landrace ranking, depending on the weights for stability and performance, was carried out according to the WAASBY index (WAASB/SY ratio). The ranks obtained with a ratio of 100/0 exclusively consider the stability for genotype ranking. Conversely, a ratio of 0/100 exclusively considers the productivity for genotype ranking. The landraces were classified into four groups with similar stability and productivity performance. The four clusters were generated automatically by the software package metan-MET analysis [37] in R studio software [38].
We used the MTSI based on factor analysis with a selection intensity of 20 percent to account for the MPE of several traits at the same time. The MTSI theory is based on four primary steps. (i) Rescaling the traits so that all have a 0–100 range, (ii) using factor analysis to account for the correlation structure and dimensionality reduction of data, (iii) planning an ideotype based on known/desired values of traits, and (iv) to compute the distance between each landrace to the planned ideotype. Therefore, the landrace with the lowest MTSI is closest to the ideotype and exhibits desirable values for all variables analyzed. The stability analysis over three growing seasons was carried out using the software package metan-MET analysis [37] in R studio software [38].
Principal component analysis (PCA) was applied to all traits across three growing seasons to identify patterns of variation among the factors and select the best-adapted landraces. This analysis was conducted using the software package FactoMineR [39] within the RStudio software [38].
3. Results
3.1. Variance Components and Likelihood-Ratio Tests
The likelihood-ratio test (LRT) indicated that only five faba bean traits (SY, HSW, PL, SNP, and PNP) had significant environment, genotype, and genotype by environment interaction effects (Table 2). Furthermore, the LRT revealed that nine traits (AGB, HI, LAI, height, diameter, BRN, NFI, BL, and NAOP) had a non-significant genotypic effect (Table 2). All variables showed significant GEI effects except for LAI and diameter (Table 2).
Table 2.
Likelihood Ratio Test and Estimated Variance Components of 15 Faba Bean Landraces Evaluated for Three Consecutive Growing Seasons.
Except for plant height, NIP, and SNP, the environmental component (σe2) contributed significantly more to phenotypic variance than any other faba bean traits (Figure 2). Genotype effect was stronger on SNP traits, which accounted for 54.02% of overall phenotypic variation. As a result, heritability values are quite high (hg2 = 0.540). For SY, AGB, HI, HSW, and LAI, the GEI variance (σge2) was more evident than the genotypic (σg2) and residual variance (σr2) (Figure 2).
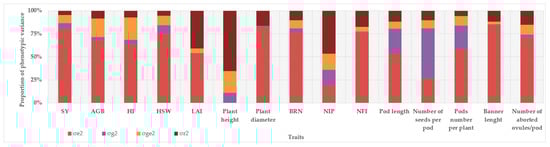
Figure 2.
Proportion of the phenotypic variance for fifteen faba bean traits (SY, AGB, HI, HSW, LAI; plant height, plant diameter, BRN, NBBF, pod length, seed number per pod, pods number per plant, banner length, and aborted fruits number per pod) evaluated during three consecutive growing seasons. SY = seed yield; AGB = above ground biomass; HI = harvest index; HSW = 100 seed weight; LAI = leaf area index; BRN = branch number; NIP = number of inflorescences per plant; NFI = number of flowers per inflorescence. σe2 = environment variance; σg2 = genotype variance; σge2 = interaction g × e variance, and σr2 = residual variance.
However, except for plant height, the values of faba bean traits were significantly different across years (Figure 3), with the lowest values of all traits reported in the second season (2020). There were nine faba bean traits (SY, AGB, HI, HSW, plant diameter, BRN, NIP, SNP, and PNP) that reached their peak in the third growing season.
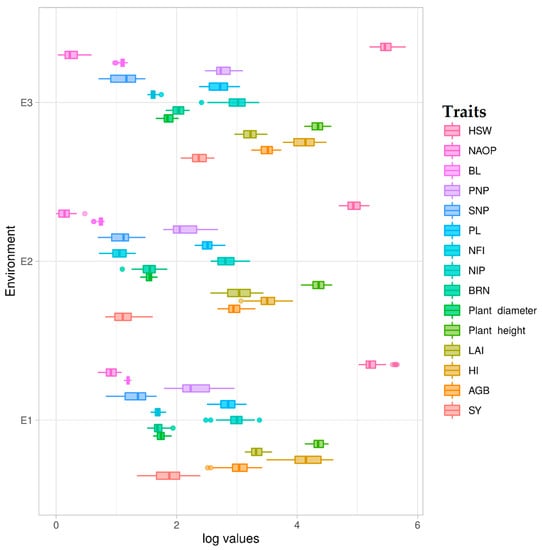
Figure 3.
Box plot of variation of faba bean yield and morphologic parameters of 15 landraces across three consecutive growing seasons. HSW = hundred seed weight; NAOP = number of aborted ovules/pods; BL = banner length; PNP = pods number per plant; SNP = number of seeds per pod; PL = pod length; NFI = number of flowers per inflorescence; NIP = number of inflorescences per plant; BRN = branch number; LAI = leaf area index; HI = harvest index; AGB = above ground biomass and SY = seed yield. E1, E2m, and E3 were the 2018/2019, 2019/2020, and 2020/2021 growing seasons, respectively.
The SY varied across the landraces and environments, and it ranged from 2.26 t ha−1 (G5 in E2) to 13.83 t ha−1 (G15 in E3) with a coefficient of variation of 50.29%. The average SY of the three growing seasons was 6.95 t ha−1 (data not shown), with SY decreasing by 38.43 and 70.72% from the first and second seasons, respectively. The coefficient of variation of faba bean traits between landraces across the three growing seasons showed that the maximum variability after the SY was observed for traits such as NAOP (38.03%), PNP (35.48%), and HI (35.20%) and the minimum variability was observed for traits such as plant height (11.43%), plant diameter (15.49), and BL (18.68%).
3.2. Principal Component Analysis
The first two principal components (PCs) for yield and yield components had eigenvalues greater than one and accounted for 72.01 percent of the total variance. PC1 (first component) explained 47.56%, while PC2 (second component) explained 24.45% of the cumulative variance for the faba bean traits (Figure 4).
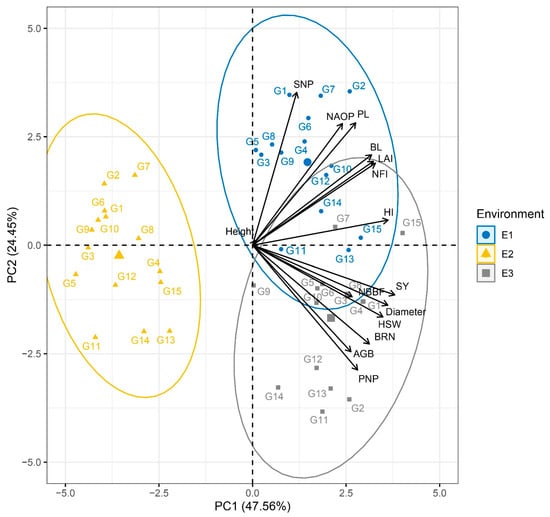
Figure 4.
Principal component analysis (PCA) biplot of faba bean yield and morphologic parameters as a function of environment and landraces. The principal variables are denoted by black arrows. Each ellipse represents a 95% confidence interval around each group. See Figure 3 for the complete trait description.
PC1 was positively and significantly correlated (>0.6) with increased SY, AGB, HI, HSW, Diameter, NIP, NFI, LAI, BL, and BRN. PC2 was positively correlated with increased NAOP, SNP, and PL. PC2 was also negatively correlated with PNP (Figure 4).
The upper right quadrant of Figure 4 included most of the landraces for the 2019 growing season (E1), where G2, G13, and G15 were the most productive landraces. The landraces coming from the 2020 growing season (E2) were in the left quadrant of Figure 4, and they were characterized by lower growth and productivity. The G3 and G5 were the lowest productive Faba bean landraces for the E2 (Figure 4). The lower right quadrant of Figure 4 included most of the landraces for the 2021 growing season (E3), where G7 and G15 were the most productive landraces.
The variation in yield due to environment and genotype factors was quite large, as shown in Figure 4, with the landrace G5 generating the lowest value of 2.61 t ha−1 in E2 and the landrace G15 generating the highest value of 13.83 t ha−1 in E3.
3.3. Productivity and Stability Performance
To quantify the performance and stability of SY, 15 faba bean landraces were ranked according to their WAASBY (WAASB/SY ratio) scores (Figure 5). The WAASBY index allows for the investigation of how landrace rankings change in response to the weights assigned to yield (performance) and WAASB index (environmental stability).
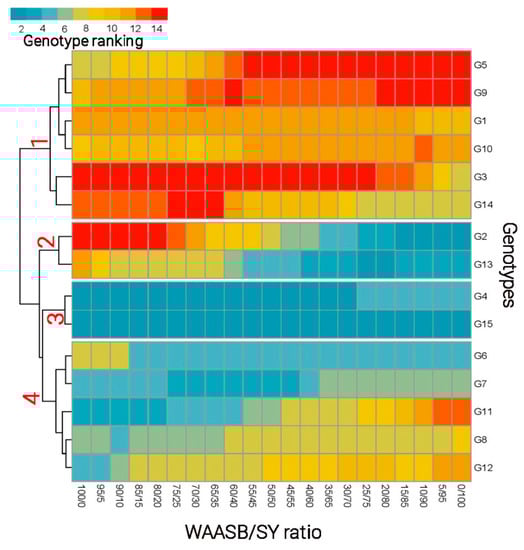
Figure 5.
The ranking of 15 landraces of faba bean based on various WAASB and SY evaluated over three growing seasons. Values from 1 to 15 represent the different landraces (see Table 1 for more details). Red values from 1 to 4 represent the different clusters.
According to Olivoto et al. [40], the most-left ranks were obtained solely by taking stability into account (100/0). On the other hand, the most right-ranks were obtained solely by taking SY into account (0/100) (Figure 5).
The landraces were classified into four clusters based on their similarity in terms of both stability and productivity (Figure 5). The first cluster consists of six landraces (G1, G3, G5, G9, G10, and G14) that are low-yielding and unstable. Cluster 2 included G2 and G13, which are unstable landraces with high productivity. The landraces G4 and G15 in the third cluster were the most productive and stable. Finally, cluster 4 contained five landraces (G6, G7, G8, G11, G12), which were stable but low-productive.
3.4. Landrace Ranking According to the Multi-Trait Selection Index
The eigenvalues, relative, and cumulative percentages of total variance; factorial loadings after varimax rotation; and communalities for faba bean traits obtained from factor analysis are shown in Table 3. In the factorial analysis performed with the WAASBY index, four factors components that accounted for 86.88% of the total variance among faba bean traits were retained.
Table 3.
Factorial analysis of 13 faba bean traits.
The 13 traits were categorized into the following four factors (FA): FA1, which included the traits BRN, NIP, NFI, and PNP; FA2, which included the traits related to the plant productivity (SY, HI, HSW) and BL; FA3, which included the growth traits (AGB and Height); and FA4 clustered three traits PL, SNP, and NAOP.
The ranking of the 15 Faba beans landraces according to the MTSI with the selection pressure of 20% is depicted in Figure 6. Out of the fifteen landraces studied, three landraces were chosen: G4, G13, and G15. For all traits except PL, SNP, and NAOP, the MTSI generates a positive gain (SG). The selection gain (SG) percentage for traits with values desired ranged from −14.28% for SNP to 5.15% for PNP. The SG ranged from −2.06% for NAOP to 0.35% for BL for traits with low values that were desired (Table 4).
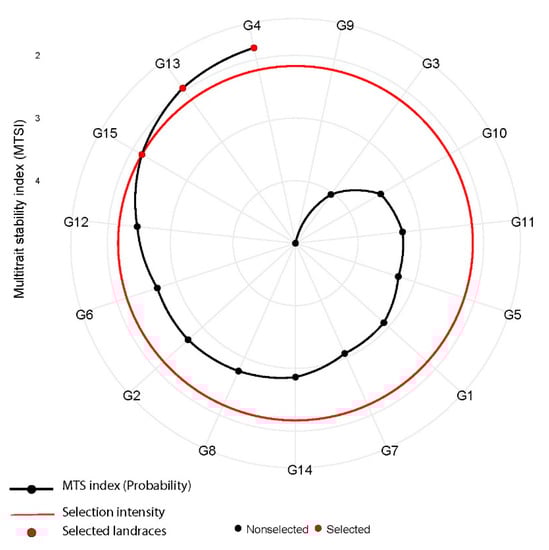
Figure 6.
Landrace ranking based on the MTSI considering a selection intensity of 20 percent red circle. Selected landraces are highlighted in red. 2, 3, and 4 indicate the multi-trait stability index.
Table 4.
Faba bean traits, selection differential (SD), heritability (h2), and selection gain (SG) for the WAASBY index in 15 faba bean landraces.
3.5. The Strengths and Weaknesses View
Figure 7 depicts the strengths and weaknesses of the stable landraces identified over three growing seasons. In this analysis, we observed that the G4 has strength related to FA1 and FA3, which means that G4 has high performance with growth traits BRN, NIP, NFI, PNP, AGB, and plant height. When we compared G4, G13, and G15 regarding FA2 and FA4, we concluded that G15 and G13 have strengths related to FA2 (SY, HI, HSW, and BL) and FA4 (PL, SNP, and NAOP), respectively. Thus, the G15 presents a positive gain for traits related to the plant productivity (SY, HI, and HSW) and BL. On the other hand, the G13 shows negative gains for PL, SNP, and NAOP.
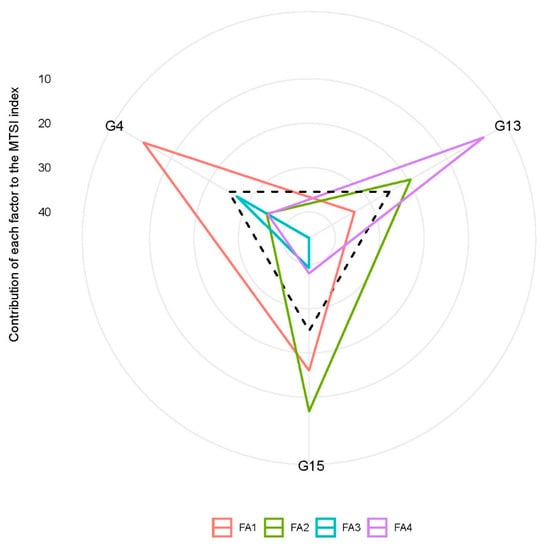
Figure 7.
Strengths and weaknesses view of the stable landraces identified across environments, shown as the proportion of each factor on the computed MTSI. Smaller proportions explained by a factor (closer to the external edge) indicate that the trait within that factor is more similar to the ideotype. The dashed line represents the value that would be expected if all factors contributed equally. FA1: BRN, NIP, NFI, and PNP; FA2: SY, HI, HSW, and BL; FA3: AGB and Height; and FA4: PL, SNP, and NAOP. 10, 20, 30 and 40 indicate the contribution of each factor to the MTSI.
4. Discussion
This study demonstrated the use of MTSI to select faba bean landraces with the appropriate mean performance and stability (MPE) across various traits. Field trails were conducted over three growing seasons to evaluate 15 faba beans landraces in the Mediterranean environment, particularly that of Algeria. The results of our study show a wide range of fluctuation in the studied parameters throughout the experiment.
The likelihood ratio test and estimated variance components indicated that the genetic effect (σg2) explained only a small portion of the total phenotypic variance for all traits except number of seeds per pod. These indicate that the genotypes differed less than the environments. According to our findings, earlier research has identified environmental factors as the primary determinants of faba bean yield and yield component traits [3,41,42].
In contrast to the other two growing seasons, the extreme drought of winter 2020 is responsible for an astonishingly high percentage of faba bean traits variance. The average maximum temperature in February 2020 (flowering stage) was about 21.3 °C with 0 mm of rainfall. Faba bean yield is adversely affected by drought stress, which occurs frequently in the seedling stage. The presence of drought stress effect on growth and yield have been published in Faba bean was reported by various authors, such as Bidai et al. [43] and Araújo et al. [44].
The likelihood ratio test demonstrated that the effects of GEI had a substantial impact on the variation of seed yield and morphologic parameters (except for leaf area index and plant diameter) for all the landraces studied here. This suggests that faba bean landraces perform differently in various environments. According to Flores et al. [45] and Maalouf et al. [46], faba bean genotypes interact strongly with environmental conditions, and Temesgen et al. [42] found that the environment explained 89% of yield variation. In their study, Karkanis et al. [13] found that GEI are more prevalent in faba bean than in the vast majority of other crops.
However, in our experiment, the greatest percentage of variance in number of seeds per pod were explained by genotype effects (54.02%). Similar findings were reported by Elshafei et al. [47].
Most plant breeders appear to focus on analyzing the MPE of a single trait, which is typically SY, as opposed to focusing on selection based on many traits [31]. According to previous studies [31,48,49], there is evidence that multivariate selection is more effective than univariate selection. Based on the ideotype–genotype Euclidean distance, the MTSI is a sophisticated genetic tool for the exploitation of suitable genotypes across all legume species [30,48,49] and any environmental conditions [50,51] with high yield stability and desirable traits. In their study, Zuffo et al. [50] used the MTSI as a genetic tool to select soybean genotypes under drought and salinity stress. Hussain et al. [51], recommended using MTSI as a tool to select superior drought-tolerant chickpea cultivars under water stress environments. Therefore, the MTSI can determine the strengths and weaknesses of landraces and select those with desired MPE. This tool is one of the most prominent multivariate selection indices because it is free from the multicollinearity problem that presents in some multivariate selection indices, such as the Smith–Hazel (SH) index [52,53]. The landraces G4, G13, and G15 were the most productive and stable among the 15 faba bean landraces, demonstrating their capacity for high performance in a wide range of climatic conditions. Due to their lower WAASBY values, these three landraces were considered to be closer to the ideotype and they could be classified as a widely adapted landrace in Algeria’s environmental conditions. As recommended by Papastylianou et al. [54], we suggest that the stable and productive landraces described in this study can be used as potential sources of stability alleles and can be utilized in breeding programs.
5. Conclusions
In the present study, we showed the effect of environment (σe2), genotype (σg2), and GEI (σge2) variability on yield and several morphologic traits among a set of faba bean landraces under the Mediterranean environment. Here, the landraces (G4, G13, and G15) selected by the MTSI showed favorable gains and desired stability among the 15 investigated landraces. It was determined that the G4, G13, and G15 landraces (stable landraces) might be recommended for cultivation in Algeria based on this index. Further, there was a positive correlation between MTSI and WAASB results. Both approaches identified the same desirable landraces (G4 and G15) as being both highly productive and stable across different environmental conditions. Overall, the MTSI is a useful tool for selecting superior faba bean landraces in experiments under Mediterranean field conditions where many traits were evaluated. Therefore, we highly recommend that future faba bean breeding programs adopt the MTSI to account for multiple traits in multi-environment trials (METs).
Author Contributions
Conceptualization, D.H.e.h. and S.T.; methodology, D.H.e.h. and S.T.; validation, D.H.e.h. S.T., and P.R.; formal analysis, M.H.S.; investigation, D.H.e.h., K.G., S.A., C.T. and N.A.; resources, D.H.e.h., S.T. and P.R.; data curation, M.H.S.; writing—original draft preparation, D.H.e.h. and M.H.S.; writing—review and editing, C.P. and M.H.S.; supervision, M.H.S. All authors have read and agreed to the published version of the manuscript.
Funding
This research received no external funding.
Institutional Review Board Statement
Not applicable.
Informed Consent Statement
Not applicable.
Data Availability Statement
Not applicable.
Conflicts of Interest
The authors declare no conflict of interest.
References
- Li, X.; Yang, Y. A novel perspective on seed yield of broad bean (Vicia faba L.): Differences resulting from pod characteristics. Sci. Rep. 2014, 4, 6859. [Google Scholar] [CrossRef] [Green Version]
- Neugschwandtner, R.; Ziegler, K.; Kriegner, S.; Wagentristl, H.; Kaul, H.-P. Nitrogen yield and nitrogen fixation of winter faba beans. Acta Agric. Scand. Sect. B Soil Plant Sci. 2015, 65, 658–666. [Google Scholar] [CrossRef]
- Skovbjerg, C.K.; Knudsen, J.N.; Füchtbauer, W.; Stougaard, J.; Stoddard, F.L.; Janss, L.; Andersen, S.U. Evaluation of yield, yield stability, and yield–protein relationship in 17 commercial faba bean cultivars. Legum. Sci. 2020, 2, e39. [Google Scholar] [CrossRef]
- Sellami, M.; Lavini, A.; Calandrelli, D.; De Mastro, G.; Pulvento, C. Evaluation of Genotype, Environment, and Management Interactions on Fava Beans under Mediterranean Field Conditions. Agronomy 2021, 11, 1088. [Google Scholar] [CrossRef]
- Khazaei, H.; Subedi, M.; Nickerson, M.; Martínez-Villaluenga, C.; Frias, J.; Vandenberg, A. Seed Protein of Lentils: Current Status, Progress, and Food Applications. Foods 2019, 8, 391. [Google Scholar] [CrossRef] [PubMed] [Green Version]
- Zohary, D. Comment on the origin of cultivated broad bean (Vicia faba L.). Israel J. Bot. 1977, 26, 39–40. [Google Scholar]
- Tanno, K.-I.; Willcox, G. The origins of cultivation of Cicer arietinum L. and Vicia faba L.: Early finds from Tell el-Kerkh, north-west Syria, late 10th millennium b.p. Veg. Hist. Archaeobotany 2006, 15, 197–204. [Google Scholar] [CrossRef]
- Crépon, K.; Marget, P.; Peyronnet, C.; Carrouée, B.; Arese, P.; Duc, G. Nutritional value of faba bean (Vicia faba L.) seeds for feed and food. Field Crop. Res. 2010, 115, 329–339. [Google Scholar] [CrossRef]
- FAO stat. Statistics Database of the Food and Agriculture Organization of the United Nations. 2021. Available online: http://www.fao.org/statistics/databases/en/ (accessed on 26 May 2022).
- Mejri, S.; Mabrouk, Y.; Voisin, M.; Delavault, P.; Simier, P.; Saidi, M.; Belhadj, O. Variation in quantitative characters of faba bean after seed irradiation and associated molecular changes. Afr. J. Biotechnol. 2012, 11, 8383–8390. [Google Scholar] [CrossRef]
- Kharrat, M.; Ouchari, H. Faba bean status and prospects in Tunisia. Grain Legumes 2011, 56, 11–12. [Google Scholar]
- Landry, E.J.; Coyne, C.J.; Hu, J. Agronomic Performance of Spring-Sown Faba Bean in Southeastern Washington. Agron. J. 2015, 107, 574–578. [Google Scholar] [CrossRef] [Green Version]
- Karkanis, A.; Ntatsi, G.; Lepse, L.; Fernández, J.A.; Vågen, I.M.; Rewald, B.; Alsiņa, I.; Kronberga, A.; Balliu, A.; Olle, M.; et al. Faba Bean Cultivation—Revealing Novel Managing Practices for More Sustainable and Competitive European Cropping Systems. Front. Plant Sci. 2018, 9, 1115. [Google Scholar] [CrossRef] [PubMed]
- Feliachi, K. Le développement des légumineuses alimentaires et les perspectives de relance en Algérie. In Proceedings of the du 2ème Séminaire du Réseau REMAFEVE/REMALA, «Le Devenir des Légumineuses Alimentaires dans le Maghreb», Hammamet, Tunisie, 30 January–2 February 2002. [Google Scholar]
- Chouaki, S. Deuxième Rapport National sur l’état des Ressources Phylogénétiques, INRA, 2006. Available online: www.pgrfa.org/gpa/dza/algerie.pdf. (accessed on 26 May 2022).
- Malek, N.; Aci, M.; Khamassi, K.; Lupini, A.; Rouissi, M.; Hanifi-Mekliche, L. Agro-Morphological and Molecular Variability among Algerian Faba Bean (Vicia faba L.) Accessions. Agronomy 2021, 11, 1456. [Google Scholar] [CrossRef]
- Maatougui, I. Situation de la culture des fèves en Algérie et principales contraintes. Céréaliculture Numéro Spécial Fève 1997, 29, 6–15. [Google Scholar]
- Zaghouane, O. The situation of faba bean (Vicia faba L.) in Algeria. Options Mediterranéennes. Série Séminaires 1991, 10, 123–125. [Google Scholar]
- Ouslim, S. BNL Associées Aux Légumineuses Alimentaires (Vicia faba L) dans l’ouest Algérien « Caractérisation et Importance ». Ph.D. Thesis, University of Oran, Oran, Algeria, 2016; 159p. [Google Scholar]
- Tufan, H.; Erdoğan, C. Genetic diversity in some faba bean (Vicia faba L.) genotypes assessed by simple sequence repeats. Biotechnol. Biotechnol. Equip. 2016, 31, 29–35. [Google Scholar] [CrossRef] [Green Version]
- Jensen, E.S.; Peoples, M.B.; Hauggaard-Nielsen, H. Faba bean in cropping systems. Field Crop. Res. 2010, 115, 203–216. [Google Scholar] [CrossRef] [Green Version]
- Stoddard, F.; Nicholas, A.; Rubiales, D.; Thomas, J.; Villegas-Fernández, A. Integrated pest management in faba bean. Field Crop. Res. 2010, 115, 308–318. [Google Scholar] [CrossRef] [Green Version]
- Alharbi, N.H.; Alghamdi, S.S.; Migdadi, H.M.; El-Harty, E.H.; Adhikari, K.N. Evaluation of Frost Damage and Pod Set in Faba Bean (Vicia faba L.) under Field Conditions. Plants 2021, 10, 1925. [Google Scholar] [CrossRef]
- Muktadir, M.A.; Adhikari, K.N.; Merchant, A.; Belachew, K.Y.; Vandenberg, A.; Stoddard, F.L.; Khazaei, H. Physiological and Biochemical Basis of Faba Bean Breeding for Drought Adaptation—A Review. Agronomy 2020, 10, 1345. [Google Scholar] [CrossRef]
- Singh, A.K.; Bharati, R.C.; Manibhushan, N.C.; Pedpati, A. An assessment of faba bean (Vicia faba L.) current status and future prospect. Afr. J. Agric. Res. 2013, 8, 6634–6641. [Google Scholar]
- Cernay, C.; Ben-Ari, T.; Pelzer, E.; Meynard, J.-M.; Makowski, D. Estimating variability in grain legume yields across Europe and the Americas. Sci. Rep. 2015, 5, 11171. [Google Scholar] [CrossRef] [PubMed]
- Loss, S.P.; Siddique, K.H.M.; Tennant, D. Adaptation of faba bean (Vicia faba L.) to dryland Mediterranean-type environments I. Seed yield and yield components. Field Crop. Res. 1997, 52, 17–28. [Google Scholar] [CrossRef]
- Link, W.; Abdelmula, A.A.; Von Kittlitz, E.; Bruns, S.; Riemer, H.; Stelling, D. Genotypic variation for drought tolerance in Vicia faba. Plant Breed. 1999, 118, 477–483. [Google Scholar] [CrossRef]
- Foti, S.; Abbate, V. Fava (Vicia faba L. o Faba vulgaris Moench). In Coltivazioni Erbacee Cereali e Proteagnose; Baldoni, R., Giardini, L., Eds.; Pàtron Editore: Bologna, Italy, 2000; pp. 307–321. [Google Scholar]
- Benakanahalli, N.; Sridhara, S.; Ramesh, N.; Olivoto, T.; Sreekantappa, G.; Tamam, N.; Abdelbacki, A.; Elansary, H.; Abdelmohsen, S. A Framework for Identification of Stable Genotypes Basedon MTSI and MGDII Indexes: An Example in Guar (Cymopsis tetragonoloba L.). Agronomy 2021, 11, 1221. [Google Scholar] [CrossRef]
- Olivoto, T.; Nardino, M.; Meira, D.; Meier, C.; Follmann, D.N.; de Souza, V.Q.; Konflanz, V.A.; Baretta, D. Multi-trait selection for mean performance and stability in maize. Agron. J. 2021, 113, 3968–3974. [Google Scholar] [CrossRef]
- Kottek, M.; Grieser, J.; Beck, C.; Rudolf, B.; Rubel, F. World map of the Köppen-Geiger climate classification updated. Meteorol. Z. 2006, 15, 259–263. [Google Scholar] [CrossRef]
- Gibbs, W.J.; Maher, J.V. Rainfall Deciles as Drought Indicators; Bureau of Meteorology: Melbourne, Australia, 1967. [Google Scholar]
- United States Department of Agriculture. Keys to Soil Taxonomy, 10th ed.; US Department of Agriculture NRCS: Washington, DC, USA, 2006. [Google Scholar]
- Dempster, A.P.; Laird, N.M.; Rubin, D.B. Maximum likelihood from incomplete data via the EM algorithm. J. R. Stat. Soc. Series B 1977, 39, 1–38. Available online: https://www.jstor.org/stable/2984875 (accessed on 26 May 2022).
- Olivoto, T.; Lúcio, A.D.; da Silva, J.A.; Marchioro, V.S.; de Souza, V.Q.; Jost, E. Mean performance and stability in multi-environment trials I: Combining features of AMMI and BLUP techniques. Agron. J. 2019, 111, 2949–2960. [Google Scholar] [CrossRef]
- Olivoto, T.; Lúcio, A.D. Metan: An R package for multi-environment trial analysis. Methods Ecol. Evol. 2020, 11, 783–789. [Google Scholar] [CrossRef]
- R Core Team. R: A Language and Environment for Statistical Computing; R Foundation for Statistical Computing: Vienna, Austria, 2013; Available online: https://www.scirp.org/(S(vtj3fa45qm1ean45vvffcz55))/reference/ReferencesPapers.aspx?ReferenceID=1742158 (accessed on 26 May 2022).
- Husson, F.; Josse, J.; Le, S.; Mazet, J. Facto Mine R: Multivariate Exploratory Data Analysis and Data Mining with R. R Package Version 1. 2014, pp. 102–123. Available online: http://factominer.free.fr/ (accessed on 26 May 2022).
- Olivoto, T.; Lúcio, A.D.C.; da Silva, J.A.G.; Sari, B.G.; Diel, M.I. Mean Performance and Stability in Multi-Environment Trials II: Selection Based on Multiple Traits. Agron. J. 2019, 111, 2961–2969. [Google Scholar] [CrossRef]
- Fikere, M.; Tadesse, T.; Letta, T. Genotype-environment interactions and stability parameters for grain yield of faba bean (Vicia faba L.) genotypes grown in South Eastern Ethiopia. Int. J. Sustain. Crop Prod. 2008, 3, 80–87. [Google Scholar]
- Temesgen, T.; Keneni, G.; Sefera, T.; Jarso, M. Yield stability and relationships among stability parameters in faba bean (Vicia faba L.) genotypes. Crop J. 2015, 3, 258–268. [Google Scholar] [CrossRef] [Green Version]
- Bidai, Y.; Beliali, N.H.; Belkhodja, M. The combined effect of drought stress and culture substrate on water nutrition, growth and yield of Vicia faba L. Int. J. Agric. Biol. 2020, 9, 11–19. [Google Scholar]
- Araújo, S.S.; Beebe, S.; Crespi, M.; Delbreil, B.; González, E.M.; Gruber, V.; Lejeune-Henaut, I.; Link, W.; Monteros, M.J.; Prats, E.; et al. Abiotic Stress Responses in Legumes: Strategies Used to Cope with Environmental Challenges. Crit. Rev. Plant Sci. 2014, 34, 237–280. [Google Scholar] [CrossRef]
- Flores, F.; Hybl, M.; Knudsen, J.; Marget, P.; Muel, F.; Nadal, S.; Narits, L.; Raffiot, B.; Sass, O.; Solis, I.; et al. Adaptation of spring faba bean types across European climates. Field Crop. Res. 2013, 145, 1–9. [Google Scholar] [CrossRef] [Green Version]
- Maalouf, F.; Nachit, M.; Ghanem, M.E.; Singh, M. Evaluation of faba bean breeding lines for spectral indices, yield traits and yield stability under diverse environments. Crop Pasture Sci. 2015, 66, 1012. [Google Scholar] [CrossRef]
- Elshafei, A.A.M.; Amer, M.A.E.; Elenany, M.A.M.; Helal, A.G.A.E. Evaluation of the genetic variability of faba bean (Vicia faba L.) genotypes using agronomic traits and molecular markers. Bull. Natl. Res. Cent. 2019, 43, 106. [Google Scholar] [CrossRef] [Green Version]
- Sellami, M.H.; Pulvento, C.; Lavini, A. Selection of Suitable Genotypes of Lentil (Lens culinaris Medik.) under Rainfed Conditions in South Italy Using Multi-Trait Stability Index (MTSI). Agronomy 2021, 11, 1807. [Google Scholar] [CrossRef]
- Sellami, M.; Lavini, A.; Pulvento, C. Phenotypic and Quality Traits of Chickpea Genotypes under Rainfed Conditions in South Italy. Agronomy 2021, 11, 962. [Google Scholar] [CrossRef]
- Zuffo, A.M.; Steiner, F.; Aguilera, J.G.; Teodoro, P.E.; Teodoro, L.P.R.; Busch, A. Multi-trait stability index: A tool for simultaneous selection of soya bean genotypes in drought and saline stress. J. Agron. Crop Sci. 2020, 206, 815–822. [Google Scholar] [CrossRef]
- Hussain, T.; Akram, Z.; Shabbir, G.; Manaf, A.; Ahmed, M. Identification of drought tolerant Chickpea genotypes through multi trait stability index. Saudi J. Biol. Sci. 2021, 28, 6818–6828. [Google Scholar] [CrossRef]
- Smith, H.F. A Discriminant Function for Plant Selection. Ann. Eugen. 1936, 7, 240–250. [Google Scholar] [CrossRef]
- Hazel, L.N. The Genetic Basis for Constructing Selection Indexes. Genetics 1943, 28, 476–490. [Google Scholar] [CrossRef] [PubMed]
- Papastylianou, P.; Vlachostergios, D.N.; Dordas, C.; Tigka, E.; Papakaloudis, P.; Kargiotidou, A.; Pratsinakis, E.; Koskosidis, A.; Pankou, C.; Kousta, A.; et al. Genotype X Environment Interaction Analysis of Faba Bean (Vicia faba L.) for Biomass and Seed Yield across Different Environments. Sustainability 2021, 13, 2586. [Google Scholar] [CrossRef]
Publisher’s Note: MDPI stays neutral with regard to jurisdictional claims in published maps and institutional affiliations. |
© 2022 by the authors. Licensee MDPI, Basel, Switzerland. This article is an open access article distributed under the terms and conditions of the Creative Commons Attribution (CC BY) license (https://creativecommons.org/licenses/by/4.0/).