Article

Comparison of Field Performance of Different Driving Systems and Forward Speed Measuring Methods for a Wet Direct Seeder of Rice

Nanjing Institute of Agricultural Mechanization, Ministry of Agriculture and Rural Affairs, Nanjing 210014, China
*
Author to whom correspondence should be addressed.
Agronomy 2022, 12(7), 1655; https://doi.org/10.3390/agronomy12071655
Submission received: 15 June 2022 / Revised: 8 July 2022 / Accepted: 8 July 2022 / Published: 11 July 2022

Abstract

:
Research on precision seeders operated in the dry field shows that an electric driving system used for a seed meter can significantly improve the planting uniformity. The measuring method for forward speed greatly affects the control accuracy of the electric driving system. However, the performance of an electric drive system for precision seeders operating in wet fields, such as paddy, is still unclear. The operating conditions of dry and wet fields are quite different, and it is necessary to study the effects of an electric driving system and corresponding speed measuring methods on a wet-field operating seeder. In this paper, field experiments were carried out by using a wet direct planter of rice under three driving methods for seed meter, including classic mechanical driving system (MDS), electric driving system with speed acquiring from an encoder (EDSE), and electric driving system with speed acquiring from the global positioning system (EDSG), at forward speeds of 4.62, 5.81, and 7.23 km·h−1. The seeding uniformity (seeding rates, coefficient of variations) and the slippage (slippage rate, broken strips) were investigated. Results showed that the EDSG exhibited more qualified operation performance compared with the MDS and the EDSE. For both the MDS and EDSE, the seeding rates significantly decreased and deviated from the desired value as the forward speed increased. The negative slippages of MDS and EDSE were 3.47–31.72% and 2.13–7.7%, respectively, and they significantly increased when the forward speeds increased from 4.62 to 7.23 km·h−1. Analysis of the seeding uniformity and slippage presented that the EDSG exhibited a more qualified operation and is recommended for the wet direct seeder of rice.

1. Introduction

Rice provides a staple food for more than half of the world′s population. Asia is by far the main producer [1], and China is the most representative country that produces 199 million tons of rice in 2019. The rice is produced under puddled transplanted conditions with prolonged periods of flooding requiring high labor input due to seedling raising and transplanting [2,3,4]. With the rapid economic transformation and the massive transfer of the rural labor force in Asian countries, it demands a major shift from puddled transplanting to direct seeding of rice (DSR) that could reduce labor inputs by approximately 25% [2]. Nowadays, direct seeding, especially wet seeding, is widely adopted in China and is spreading to other Asian countries [5].
The uniform distribution of seed is an important performance index for a rice direct seeder. At the same time, in certain small units in fields, uniform seed density has beneficial effects on grain yield per unit area [6,7,8]. This is very important to equally distribute the moisture and plant nutrition substances in the soil among the plants during the growth period. However, due to the differences in variety, climate, and management habits, the seeding rate varies greatly among rice planting areas in China [9]. This put forward the requirements for the rice direct seeder to precisely control the seeding rates.
At present, the mechanically driving system is widely used for the seed metering device in rice direct seeder in China. It consists of chains, gears, and a ground wheel. The motion of the ground wheel is transmitted to the seed metering device by the chains and gears. The instability of the seeding rate resulting from the slipping of the ground wheel was reported in many studies. Under field conditions, when the seeder is being operated, the transmission system of the machine and drive system of the seed metering units naturally push the ground wheel. As a result of this effect, the wheels lose traction or skid to some extent, and changes in the desired plant spacing occur [10]. Especially at a high forward speed, undesired situations such as spinning and slipping on the ground wheel, vibration, seizing, and jamming on the chain-sprocket systems may occur during the transfer of the motion from the ground wheel to the seed metering units. Additionally, for precision seeders with mechanical-driven systems, seeding rates were generally adjusted by changing the limited gears. The continuous seeding rate cannot be obtained and fewer or more seeds may be planted in certain units. As a result, the yields decreased, and production costs increased.
The electric driving system instead of the mechanical transmission system can improve the seed distribution uniformity by eliminating the slipping of the ground wheel [11,12]. This has been verified in many studies. For example, Aykas et al. tested four different planters for corn and three for sunflowers [13]. Negative slipping rates of up to 8.77 and 8.28% were determined, respectively, for the driving wheel of the machine. These negativities limit the operating speeds and improvement in the transmission components of planters was proposed. Kamgar et al. used an electronic transmission system to improve the performance of a conventional row crop planter and a higher percentage in quality of feed index was obtained. Additionally, studies on the comparison of the electric and mechanical driving system were also conducted [14]. Yang et al. tested the electric driving system and mechatronic transmission system in the precision seed metering of corn [15]. It was stated the electric and mechanical systems were at “insufficient” and “moderate” levels, respectively. Field experiments for corn were conducted by He et al. and Saadat et al. [14,16]. It presented that the planter equipped with the electric driving control system had significantly better planting quality compared with that using mechanical transmission driving under equivalent working conditions. The theoretical plant spacing between plants used in the classical driving system was farther and non-uniform. This is an indicator that the electric driving system is capable of providing the desired plant spacing. The electronically controlled seed metering units can address many of the inefficiencies experienced in mechanically driven seed metering units, and have the potential to increase productivity and yield rates dramatically [17].
The above research is mainly focused on the precision seeders operated in dry fields. There is very limited study on the operation performance of a precision seeder operated in wet fields, such as paddy. Wang et al. designed an electric drive system for the rice seed metering device to realize the continuous adjusting of the seeding rate, but it was only tested under laboratory conditions [18]. Zhao et al. designed an electromechanical drive system for the rice direct seeder based on a PID algorithm, and the encoder installed on the ground wheel was used to obtain the forward speed of the machine [19]. However, only the driving motor speeds were tested in field, ignoring the seeding uniformity and the negative slippage.
While the rice direct seeder is operating, the mud and water in the paddy easily result in the ground wheel slipping. To reduce the negative effects, the ground wheel is designed as the shape of gears with an amount of anti-slip teeth circularly distributed. However, this does not guarantee that no slipping will occur, especially at high operating speeds. When the electric driving system is used, the speed measuring is critical to the planting quality of seeding. The accuracy of the speed sensors is influenced by the operating environment, such as the travel speed and geographical location. The speed sensors commonly used in the electric driving system of precision seeders are commonly encoder, GPS, and Doppler radar. Doppler radar is not widely used in China and other Asian countries because its high cost is not accepted by farmers. Meng et al. compared the speed measurement accuracy of Doppler radar, encoder, and GPS in electric drive systems in dry fields [20]. The output signals of GPS and radar were relatively stable and close to the average speed of the tractor when it runs at a uniform speed. The encoder installed on the ground wheel was easy to slip, especially at a high speed, resulting in inaccurate speed values.
It is worth noting that the operating speed of a precision seeder in a paddy field is much slower than that in dry field. The operation conditions are also greatly different between the wet and dry fields. There is a lot of mud and water in the paddy field which is more likely to cause the ground wheel to slip. Therefore, the research results of the precision seeder in dry fields are not suitable for the seeder in paddy fields. From another perspective, no study was conducted to compare the operation specifications between the electric and mechanical driving system for the rice wet direct seeder, such as the seed distribution and slippage. Besides, determining the suitable speed measuring methods for the electric driving system remains an important topic to be investigated.
This study was aimed to investigate the effect of the electric and mechanical driving system on the operation specifications of a rice wet direct seeder in field conditions. In addition, to determining the suitable speed measurement methods, the encoder and GPS were used for the electric driving system.

2. Materials and Methods

2.1. Description of the Rice Direct Seeder and the Drive System
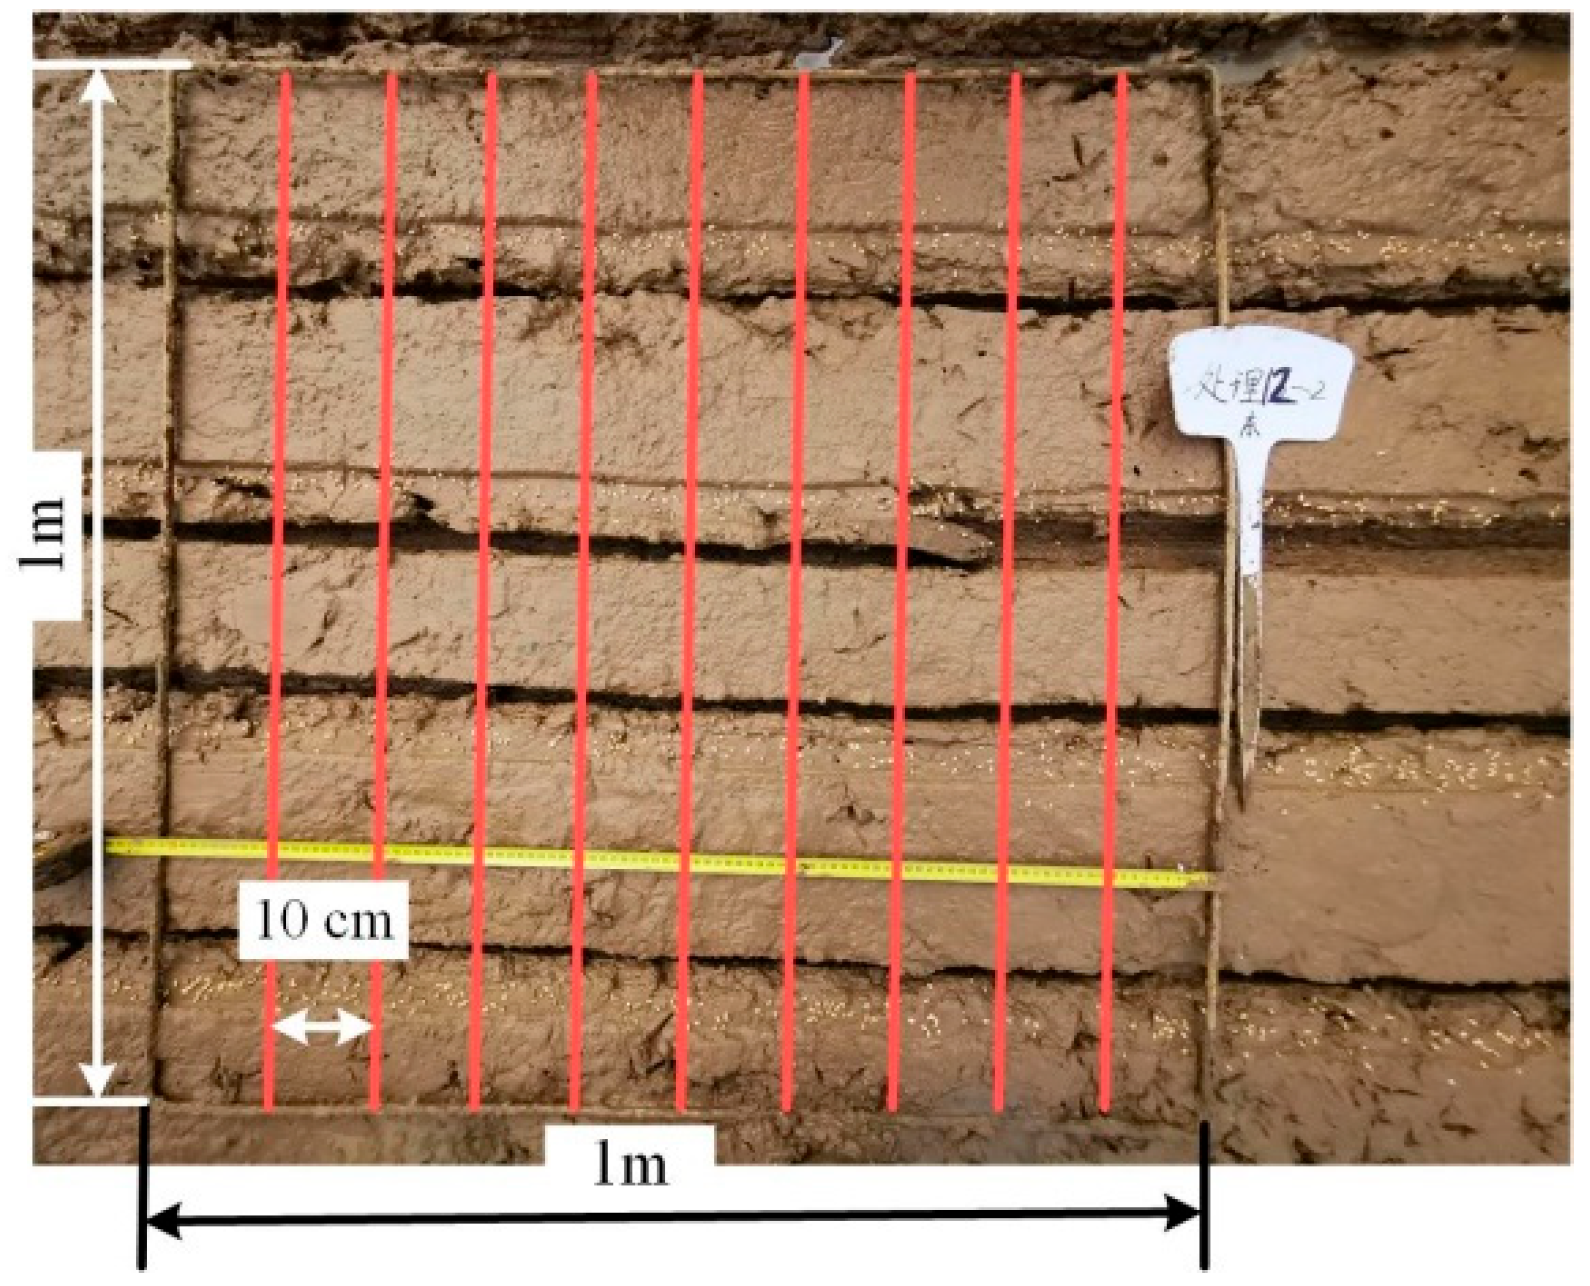
A twelve-row rice wet direct seeder (Nanjing Institute of Agriculture Mechanization, Ministry of Agriculture and Rural Affairs, China) with a mechanical seed meter in the form of staggered teeth was used for this study, as shown in Figure 1a. The seeds can be smoothly transported into the soil from the seed metering device with the help of airflow in the delivery tube. Under the action of the airflow, the variations in seed rates among rows commonly caused by the blockage of the delivery tube are reduced. Before the seeding operation, the variation coefficients of seeding rate among rows were tested within 2% at the target seeding rate of 120-kg·ha−1.
Three driving systems were designed for the seed meter in this study, which were classic mechanical driving system (MDS), electric-driven system with speed acquiring from the encoder (EDSE), and electric driving system with speed acquiring from the global positioning system (EDSG). The mechanical drive system consists of a ground wheel, gears, and chains, as shown in Figure 1b. When the seeder is operating, the motion of the ground wheel was transmitted by the chain and gear into the rotation of the seed meter. The diameter of the ground wheel is 60 cm, and the transmission ratio between the ground wheel and the gear wheel on the seeding meter is 24, which is determined by the seeding rate and the diameter of the ground wheel. The electric drive system (Figure 1c) used a motor (Times Brilliant Electrical LLC, Beijing, China) to drive the seed meter. The speed sensors are GPS receiver (Guangzhou Xingyi Electronic Technology LLC, Guangzhou, China) and encoder (Suzhou Fangyi Electrical LLC, Suzhou, China), respectively. The speed accuracy of the GPS receiver is 0.1 m.s−1 and the resolution of the encoder is 600 p.r−1 (The encoder can output 600 pulse signals per revolution). In addition to the driving motor and speed sensors, the electric system includes a controller, a touch screen (Kinco, Shanghai, China), and a motor driver (Times Brilliant Electrical LLC, Beijing, China). The hardware of the electric drive system and the main algorithms of the controller are shown in Figure 2. The touch screen is used to set the basic parameters such as seeding rate, working width of machines, etc. The motor driver is used to accurately control the speed of the motor by a proportion integration differentiation (PID) algorithm. The PID algorithm referred to the study of He et al. [16]. All the programs were written in Keil uVision5 (5.18 MDK, ARM, Cambridge, UK) software.
As shown in Figure 2, while the electric drive system is working, the controller first obtains the basic parameters and the selection of the speed measurement devices (encoder or GPS) from the touch screen. Then, the controller performs the following steps: getting the speed from the selected measuring device, calculating the desired rational speed of the driving motor according to the forward speed, and finally sending the instructions to the motor driver to control the rational speed of the driving motor. According to the relationship between the travel speed and the seeding rate and width of the seeder established in the study of Qi et al. [21], the rotational speeds of the motor using the two kinds of speed measuring devices are calculated as Equations (1)–(3). GPS directly provides the travel speeds, and the rational speeds were calculated as Equation (1); the encoder provides pulse signal, and the rational speeds are calculated as Equations (2) and (3).
n_current = 2398.80 × Q_aim × B × GPS_speed q_calibt
n_current = 2398.8 × Q_aim × B × code_speed q_calibt
code_speed = 3.14 × 3.6 × N × D M × t
where, n_current is the rotational speed of the driving motor, r/min; Q_aim is the total seeding rate, kg/hm2; B is the width of the seeder, m; q_calibt is the seeding rate per circle of the seed meter, g/r; GPS_speed is the travel speed acquired from the GPS, km·h1; code_speed is the operating speed acquired from the encoder, km·h1; N is the pulse number of the encoder in one detection period; D is the diameter of the ground wheel, m; M is the resolution of the encoder, p·r1; and t is the detection period, s.

2.2. Field Test

Field tests were conducted in the research station of Nanjing Institute of Agriculture Mechanization Ministry of Agriculture and Rural Affairs, on loam soil. The rice direct seeder was operated by the mechanical and electric driving systems at three travel speeds: 4.62, 5.81, and 7.27 km·h1, respectively In the electric driving system, the GPS and encoder were used for speed measuring, respectively. Before the tests, soil tillage was carried out to level the soil surface. The depths of mud were 20–22 cm. A Levol M1200 model 120 HP tractor, and Nangeng5055 rice that are widely planted in the Yangtze river were used in this test [22]. The total seeding rate is 120 kg·ha1 as suggested for this variety. The trials were conducted in slip-slip plot design for 3 repetitions for each application on a 250 m2 (5 × 50 m) area.
Performance indicators for seeding uniformity are the mean value and variation coefficient of the seeding rate. After the operation, the seeding rate was recorded according to the China National Standard GB/T 9478-2005 (2005) [23]. For each treatment, six rows (two on the left, two in the middle, and two on the right of the seeder) were selected for data collection. As shown in Figure 3, a 1 m × 1 m four-frame and a steel ruler were used to circle the two rows. Along the ruler, each row is divided into 10 strips with a length of 10 cm. The seeding rate in each strip was counted. With this operation for 3 replications, 30 strips are obtained in one row. The mean values and the coefficient of variation among the 30 strips were calculated as Equations (4)–(6). According to the study of Qi et al. [21], when the total seeding rate and row spacing of the rice seeder are 120 kg·ha−1 and 0.25 m, respectively, the theoretical seeding rate in one strip is 13, which was used to be compared with the real value to determine the operation accuracy.
S = 1 n X x ¯ 2
x ¯ = n i x n i
a = 100 S x ¯
where S is the standard deviation of seeding rates, X is the seeding rate in one strip, x ¯ is the mean value of the seeding rate, a is the variation coefficients of seeding rates, and n i is the number of strips.
It is not clear whether negative slippage exists in the wet-operated precision seeder and affects the seeding uniformity. In this paper, the negative slippage was assumed to exist and tested in the MDS and EDSE. That is because in the MDS the ground wheel is used in the transition system to drive the seed meter, and in EDSE the ground wheel was used for speed measuring. Performance indicators for the negative slippage were the slipping rates and broken strips with seeding rates of zero. The slippage of the ground wheel will cause the seeding rate to be lower than the target value or even zero. The slipping rates are the rate between the theoretical distance the machine should cover and the real distance covered by the wheel [12]. While the seeder was operating, the real distance of the ground wheel with 10 turns was marked manually, and the theoretical distance was calculated according to the diameter of the ground wheel. The slippage rate was calculated as Equation (7). The broken strips were counted as the total number of strips in the six rows with a seed rate of 0.
δ = 2 π R n L 2 π R n × 100
where, δ is the slipping rate, %; R is the radius of the ground wheel, m; n is the number of turns of the ground wheel; L is the actual distance the ground wheel cover after n turns, m.

2.3. Data Analysis

The probability density functions and cumulative functions were fitted to the data from the treatments to compare the deviation of the seeding rates from the target rate. Analysis of variance (ANOVA) was conducted using statistical software (IBM SPASS Statistics 21, IBM, New York, NY, USA) to examine the effects of the experimental factors on the seeding rates and slippage rates. Means of the measured variables were compared using the least significant difference (LSD). Statistical significance was evaluated at p < 0.05.

3. Results and Discussion

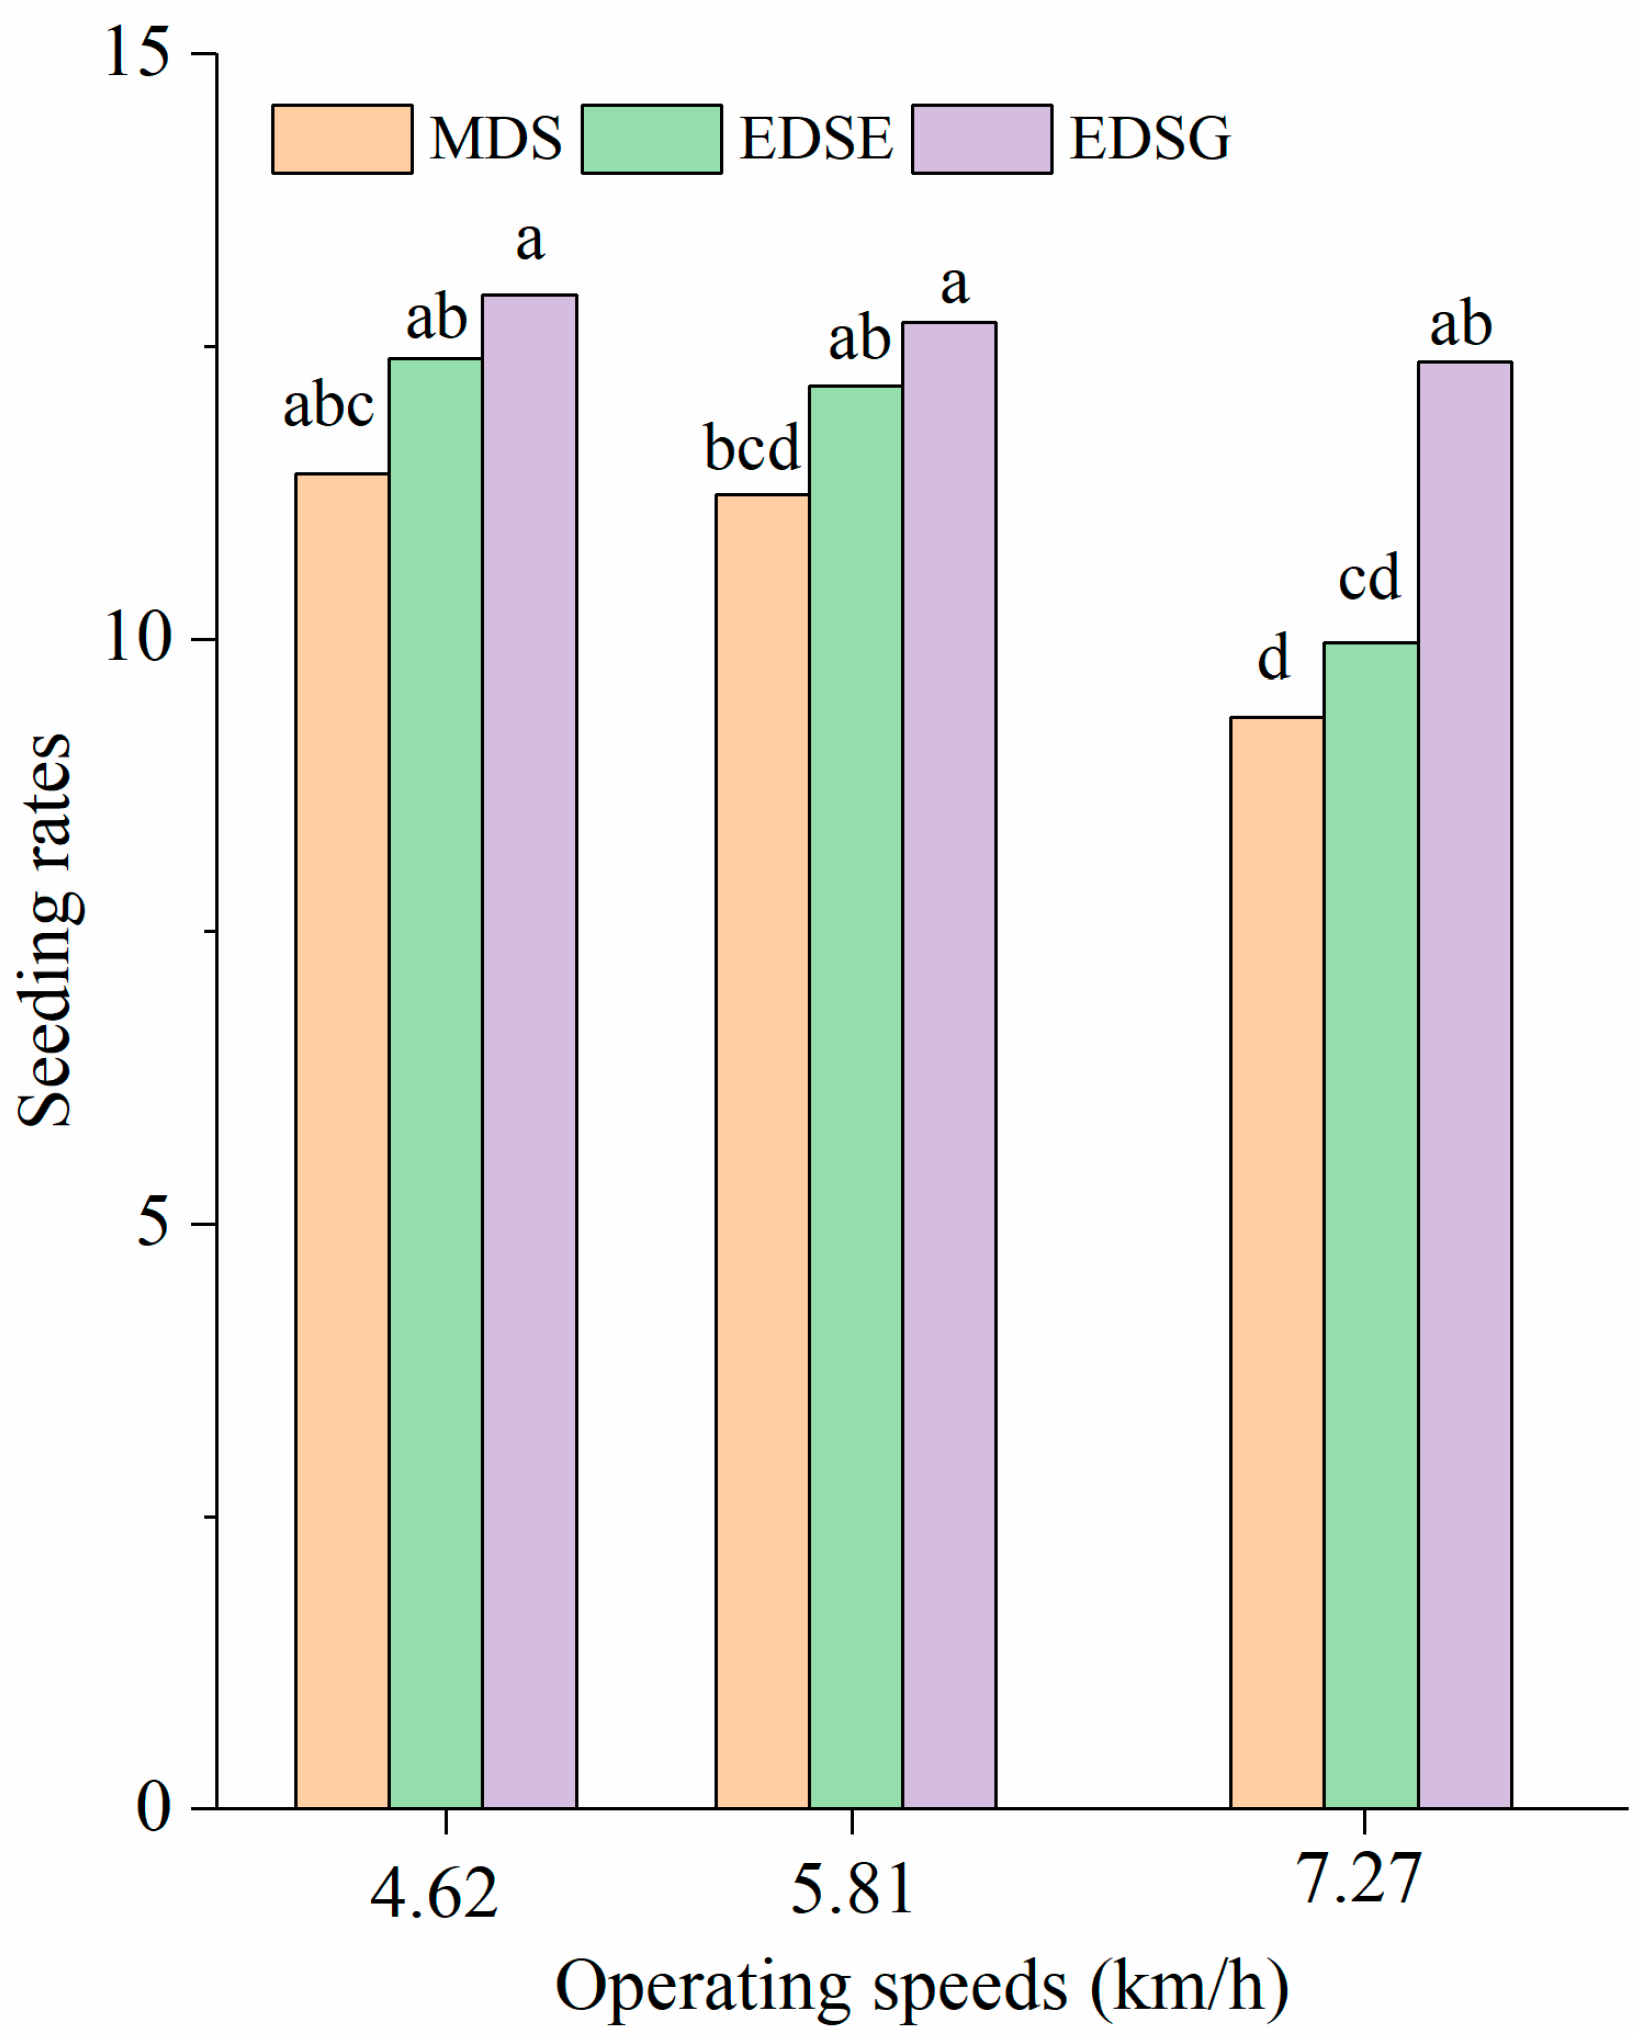
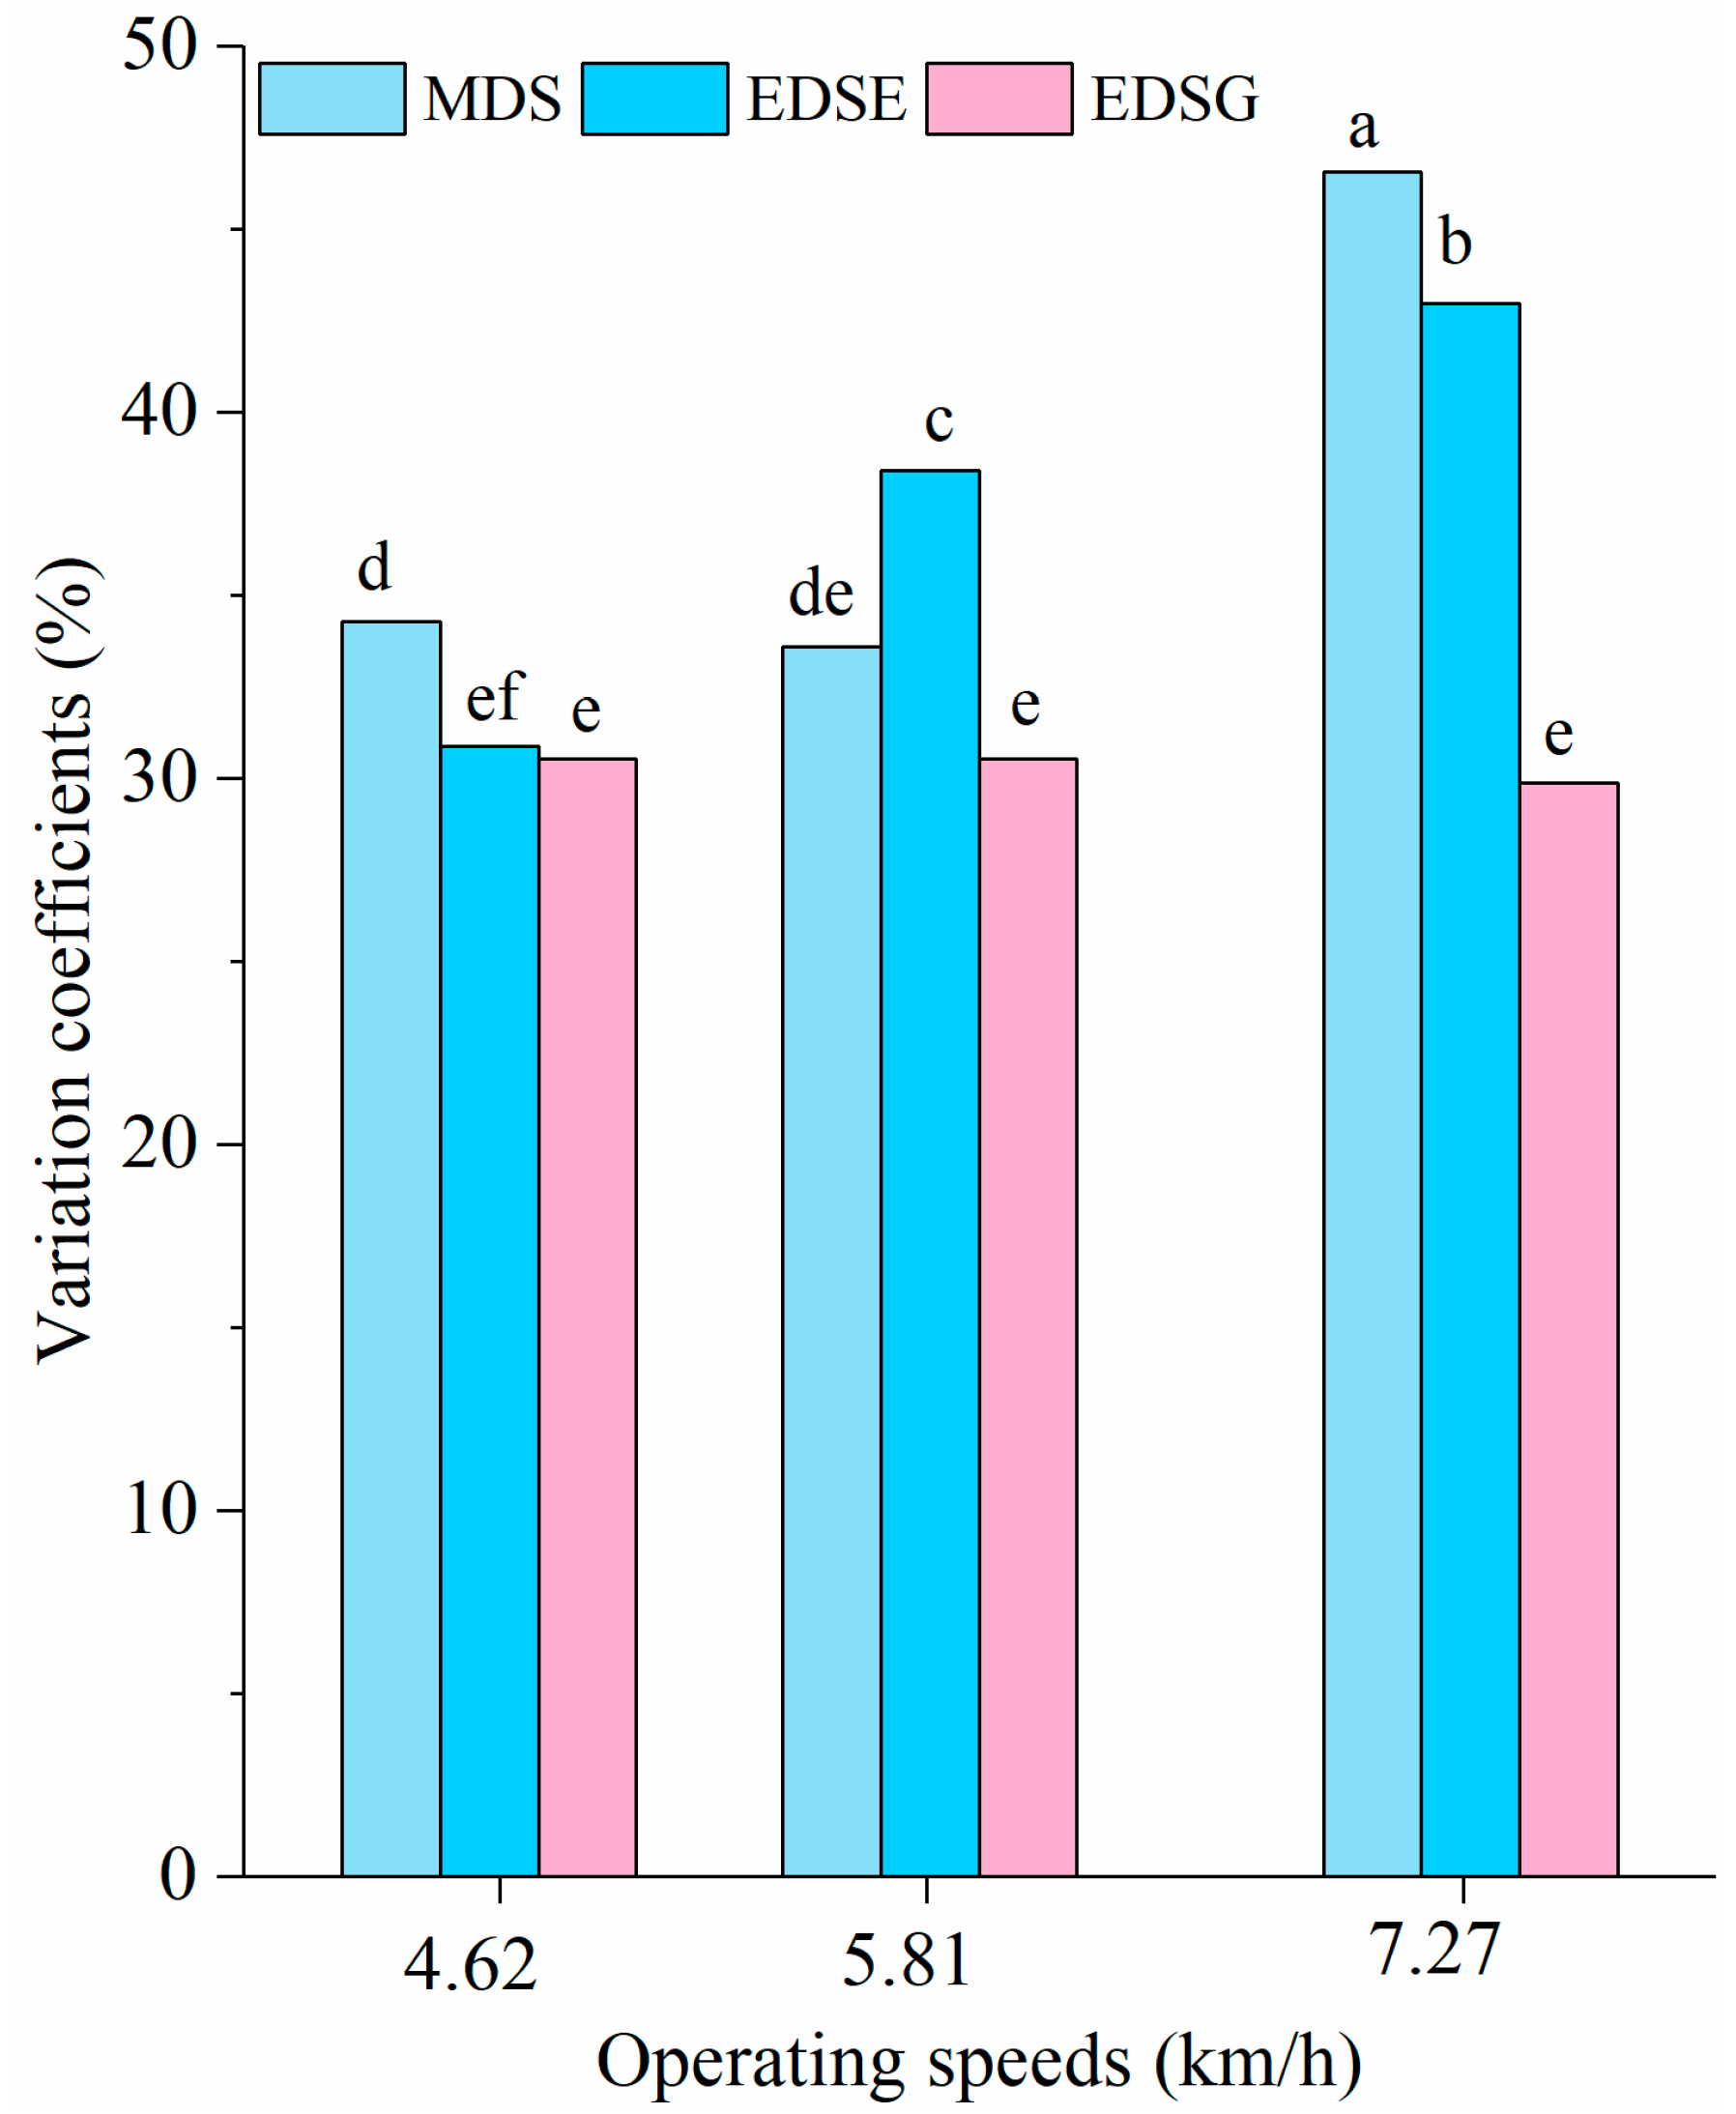
3.1. Seeding Uniformity
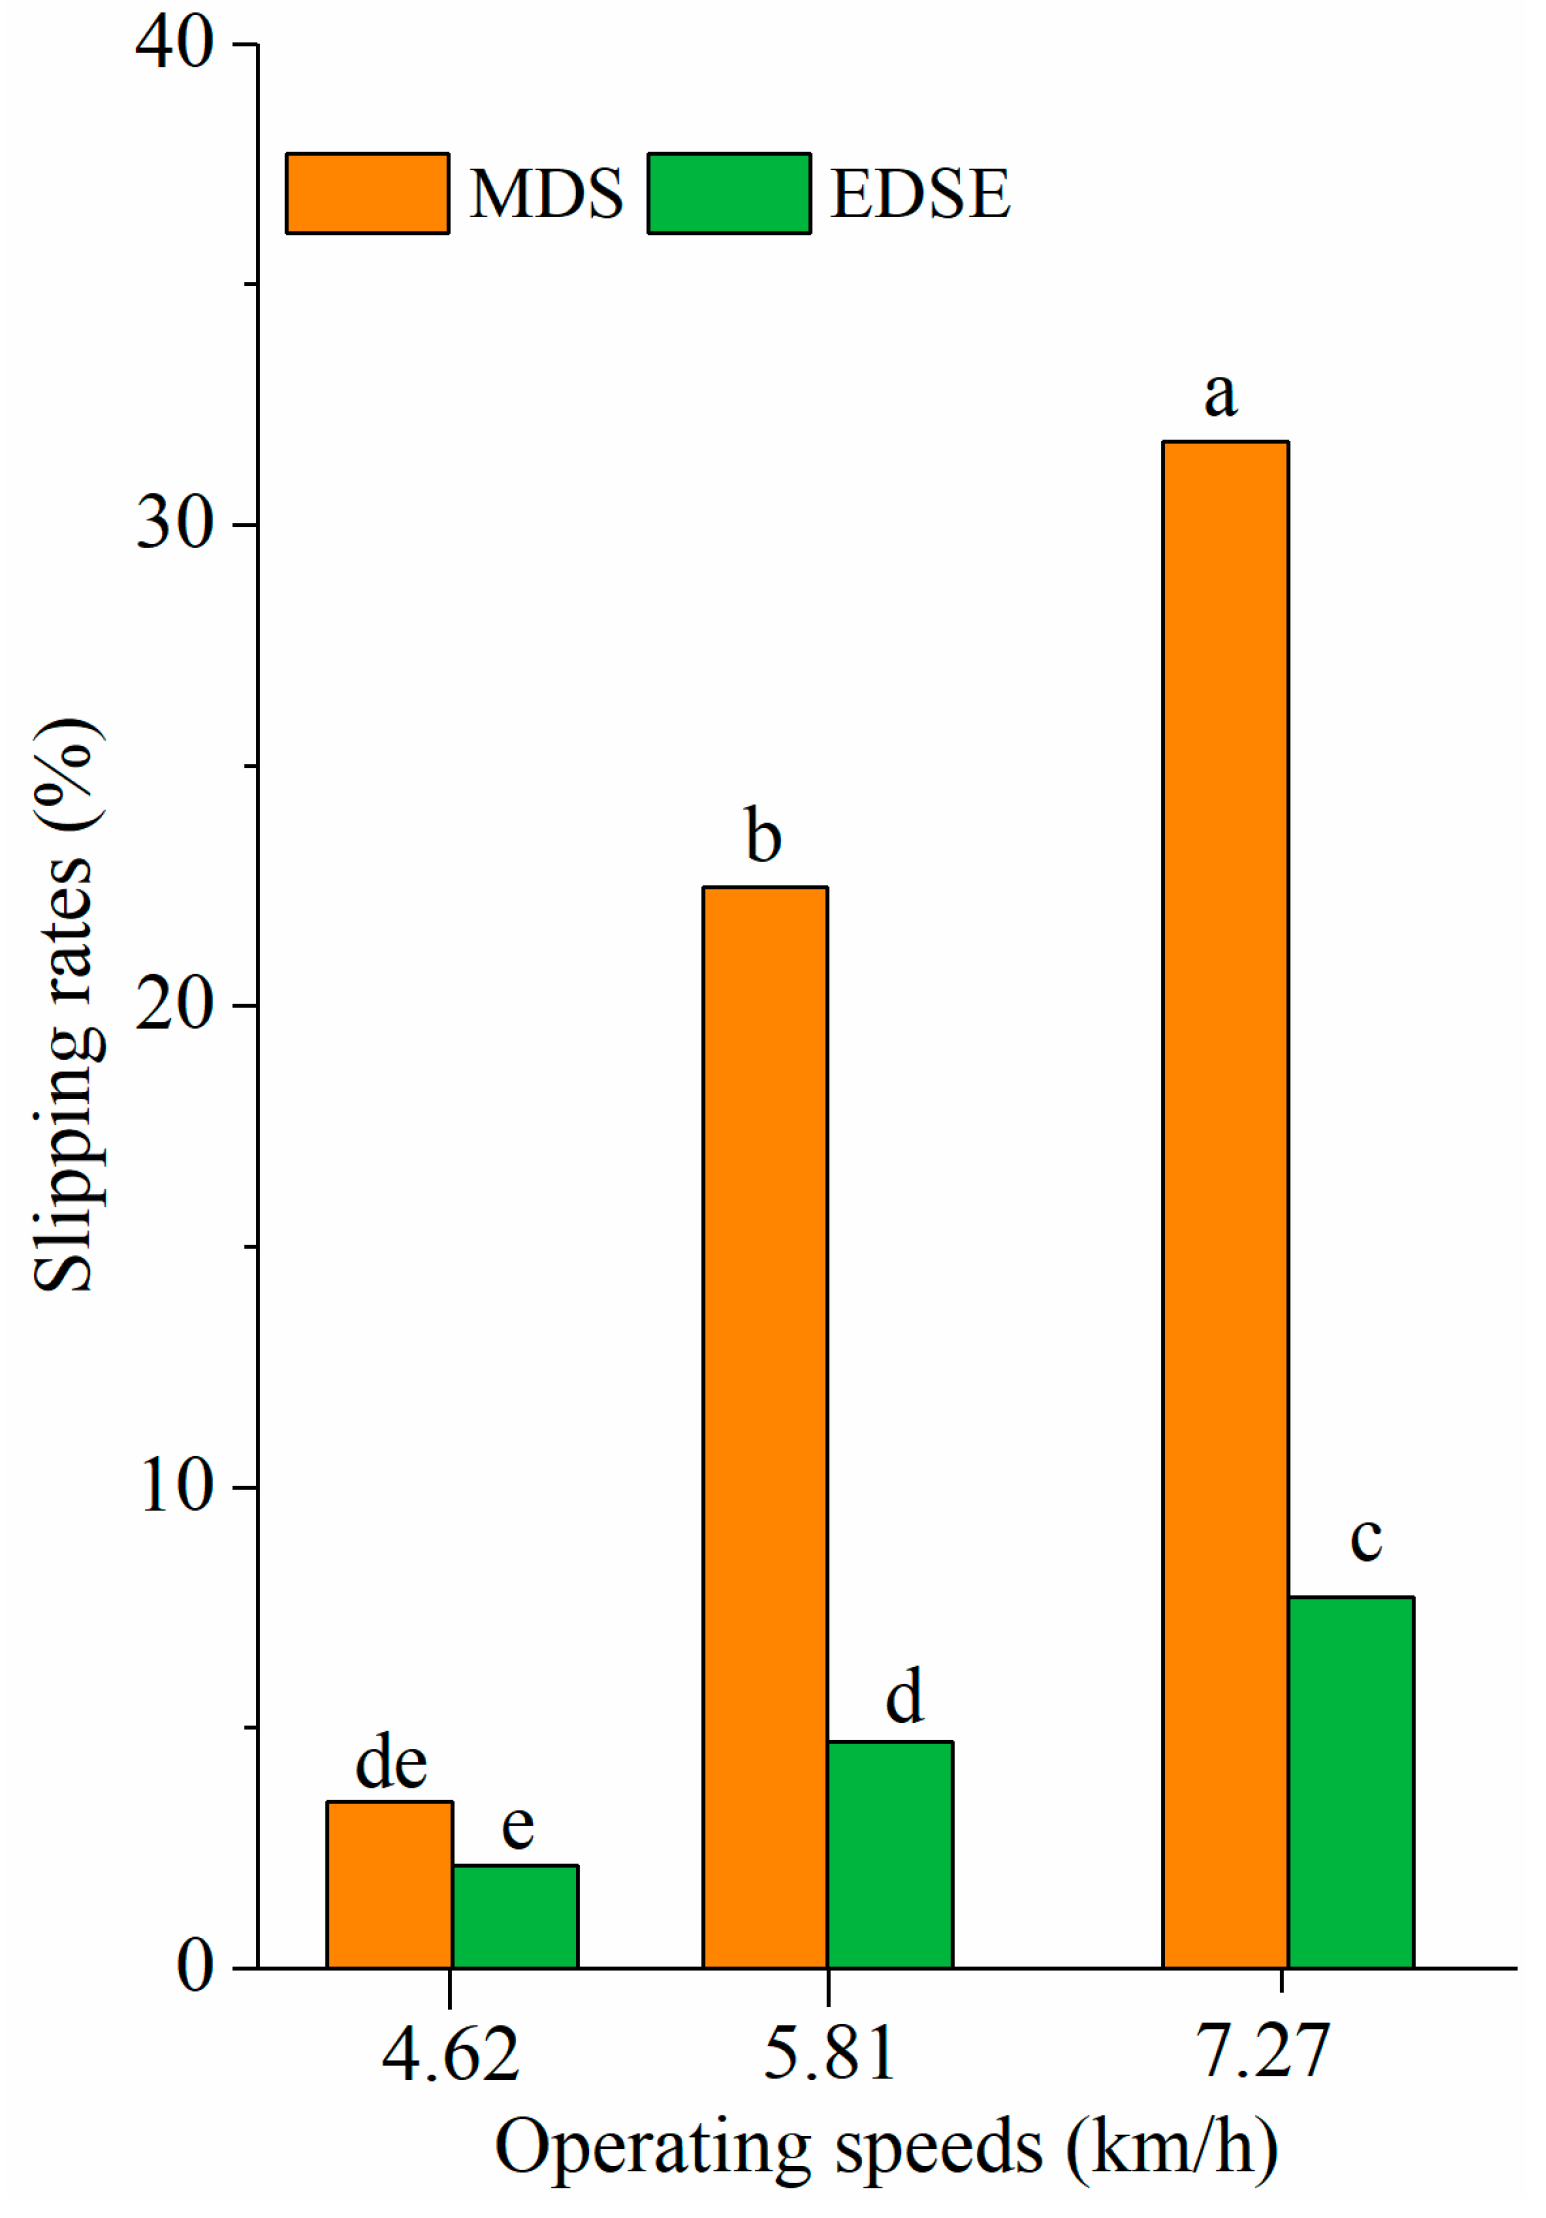
The analysis of variance in the mean seeding rate is shown in Figure 4. The mean seeding rates of the three driving systems exhibit a similar trend at three operating speeds: EDSG > EDSE > MDS. With the increase in travel speed, this trend becomes more obvious. The mean seeding rates of EDSG, EDSE, and MDS were 12.94, 12.40, 11.41, respectively, at the travel speed of 4.62 km·h1. No significant difference was observed. When the travel speed was 5.81 km·h1, the 11.23 seeding rate of MDS is significantly lower than that of EDSG and greatly deviated from the target value. With the further increase in travel speed, there was no significant difference between the MDS and EDSE, with a seeding rate of 9.33, 9.97, respectively. The EDSG was 12.37, which was significantly higher than that of the other two treatments. It was observed that the mean seeding rate of MDS and EDSE decreased significantly with the increase in travel speeds, while the difference in the EDSG was not significant. Yang et al. stated the planting quality deteriorated with increasing planter travel speed, making mechanical ground wheel driving systems unsuitable for high-speed planting [11]. But they only compared the mechanical and electric drive systems in a corn seeder in the dry fields. From the data of this paper, the seeding rates of motor driving are more desirable than that of mechanical driving, which is consistent with their conclusions. More importantly, it was found that during operating in the wet fields, the electric drive system using GPS to obtain the travel speed was beneficial to obtain the desired seeding rates.
The variation coefficients are related to the seeding rates among strips. The greater the variation coefficient was, the worse the uniformity of seeds rates. The minimum standard set by China Machinery Industry Standard JB/T 6274.1-2001 is not greater than 45% [24]. The variation coefficients of the three driving systems are shown in Figure 5. When the operating speed was 4.62 km·h1, the variation coefficient was as follows: MDS > EDSE > EDSG. The MDS was significantly higher than the other two treatments. It was EDSE > MDS > EDSG and MDS > EDSE > EDSG at travel speeds of 5.81 and 7.27 km·h1, respectively. At the operating speed of 7.27 km·h1, for MDS the seeding operation was considered to be unqualified because the variation coefficient was more than 45%. The variation coefficients of MDS and EDSE were greatly affected by the operating speeds, and they increased significantly. The variation coefficients of the EDSG were less affected by the operating speed, and no significant difference was observed with the further increase in operating speeds. This indicated that the electric driving system using GPS to measure travel speeds had a better ability to guarantee the operating quality at a high travel speed.
The probability density functions fitted to Gaussian were generated to show the distribution of seeding rates with the MDS, EDSE, and EDSG for the three operational speeds (Figure 6). The standard deviation (SD) was calculated to show the dispersion content of the seeding rates. The vertical red line represents the target seed rate of 13. The vertical dotted lines are the mean value (u) of the function, respectively. The confidence interval [u − SD, u + SD] at the probability of 68% and [u − 2SD, u + 2SD] at the probability of 95% were displayed. For example, at an operating speed of 4.62 km·h1, the mean value of the MDS is 11.41. The confidence interval at a probability of 68% and 95% are [7.48, 15.34] and [3.55, 19.27], respectively, indicating that 68% of the seeding rates in the statistical data are distributed within the confidence interval of [7.48, 15.34] and 95% of the seeding rates in the statistical data are distributed within the confidence interval of [3.55, 19.27]. Treatments, which had a mean value close to the theoretical seeding rate and a small SD, exhibit uniformity seeding rates. Uniform seeding rates are beneficial to reduce competition among crops, further increasing crop yields. For the agricultural sector, the use of electric-driven systems in rice planters to replace traditional mechanical-driven systems is worth promoting because of its potential to increase rice yields and profitability.
Figure 6 shows that the mean seeding rates of MDS, EDSE, and EDSG are 11.41, 12.40, 12.94, respectively, at an operating speed of 4.62 km·h1. The mean seeding rates of EDSE and EDSG were more close to the target values, compared to MDS. In addition, the probability density functions indicate that the seeding rates of the EDSE and EDSG were concentrated on their mean values. The confidence intervals of 68% probability were [8.42, 16.38] and [8.84, 17.04], respectively. The confidence intervals of 95% probability were [4.44, 20.36] and [4.74, 21.14], respectively. At the operating speed of 5.81 km·h1, the mean seeding rates of MDS, EDSE, and EDSG were 11.23, 12.16, and 12.71, respectively. The seeding rate of the MDS still had a large deviation from the target value, when compared with EDSE and EDSG. The confidence intervals of 68% probability of EDSE and EDSG were [7.48, 16.84] and [8.76, 16.66]. The confidence intervals of 95% probability were [2.80, 21.52] and [4.81, 20.61]. There was no significant difference between them. When the operating speed increased to 7.27 km·h1, the mean seeding rate of MDS and EDSE were 9.32 and 9.97, which was lower than the target value. The mean seeding rate of EDSG was 12.37, which was closed to the target value. For the MDS and EDSE, the confidence intervals of 68% probability were [5.00, 13.64] and [5.65, 14.29], and that of 95% probability were [0.68, 17.96] and [1.33, 18.61]. This indicated that most of the seeding rates of the two treatments were distributed at low values. The confidence interval of 68% and 95% probability for EDSG were [8.73, 16.01] and [5.09, 19.65], indicating more seeding rates distributed near the target value.
To summarize, at a relatively low speed, the EDSE and EDSG were recommended for better performance, while the MSD was not recommended because of the large deviation of the mean seeding rate from the target value. While working at high speed, EDSG was recommended for good seeding quality. EDSE and EDSG with significantly lower seeding rates are not recommended. In the mechanical driving system, the seed meter driven by the ground wheel lost movement when the ground wheel slipped, resulting in a reduction in the seeding rate. In the electric drive system, the ground wheel installed with an encoder for measuring speed eliminated the slipping induced by driving the seed meter. Therefore, the seeding rate of the EDSE is more uniform than that of the MDS. However, naturally slipping still existed on the ground wheel when supporting the machine. The measured speed using an encoder was calculated according to the turns of the ground wheel. In the case of ground wheel slipping, the inaccurate speed single will led to non-uniform seeds distribution. Ding et al. tested an electric drive system in a corn seeder to compare the speed measurement of encoder and GPS [25]. It was concluded that when using GPS to measure travel speeds, the inaccurate speed caused by the ground wheel slipping was eliminated. The speed measurement using GPS was more suitable for the electronic driving system especially operating at high travel speeds.
The cumulative probability functions of the deviation of seeding rates from the target value (13) were generated (Figure 7). For example, at 90% cumulative probability, the deviations of seeding rates of the EDSG at 4.62, 5.81, and 7.23 km·h1 were 6.53, 6.13, and 5.85, respectively, and these of the EDSE were 6.51, 7.51, and 8.33, respectively. The high deviations indicated poor planting uniformity.
Figure 7 showed that travel speed measurement using GPS in an electric drive system had a good performance, as the seeding rate deviated less from the target value for all three travel speeds. In particular, from the local magnification in Figure 7, it can be concluded that at 90% cumulative probability, the deviations of seeding rate of EDSG were in the range of 5–7 at three travel speeds, which were relatively small compared with MDS and EDSE. This implied that GPS used for speed measuring could achieve better planting quality. The following were EDSE and MDS at a travel speed of 4.62 km·h1. However, with the further increase in travel speeds, the deviations of EDSE and MDS increased significantly. On the contrary, the deviation of EDSG had a decreased trend, indicating that the speed measurement using GPS in an electric driving system was beneficial for planting uniformity even at high a travel speed.

3.2. Slippage

The slipping rates of the MDS and EDSE are shown in Figure 8. At the three operating speeds, they were 3.47%, 22.46%, and 31.72% for MDS, respectively, which increased significantly as the speed increased. At the travel speeds of 4.62–7.27 km·h1, the slipping rates of the EDSE were at the range of 2.13–7.7%, much less than that of MDS, but also increased significantly. When the ground wheel was used, negative effects of the friction, slipping or tire pressure that is created between the ground wheel and the soil became inevitable. The slipping rates of precision planters were tested in many studies. For example, Saadat et al. pointed out a slipping rate between 6.08% and 8.77% for different precision planters and expressed the necessity to improve the transmission components of planters [17]. At an operating speed of 6 km·h1 for corn planters, using the planter’s mechanical transmission system, there was a 6.79% slipping in the planter’s wheel. When the electro-mechanic drive system was used, there was a 1.33% slipping in the planter’s wheel. Additionally, slipping rates between 6.08 and 8.28% were reported in similar studies using three different precision planters for sunflower planting. Due to the variation in the test environment and precision planter, the slippage rates were tested to be different. However, similar conclusions were obtained that slipping of the ground wheel was the main reason to affect the seeding uniformity in a mechanical driving system. This paper tested the slipping rates of a rice direct seeder in wet fields, and results showed that although there were anti-skid teeth on the ground wheel, slipping still existed. The slipping rates of the EDSE were lower than that of the MDS. When using the electric drive system, the seeding plates were rotated by electric motors and the transmission system which is straining to the machine’s wheel was disabled. As result, the planter’s ground wheel was only carrying out the transport wheel function, the negative slippage occurred at very low rates.
The broken strips with 0 seeding rate were counted for the six rows of the planter, as shown in Table 1. Analysis of the reasons for broken strips from the driving system, in the mechanical drive system, the immobility of the seeding plate caused by the ground wheel slipping or the jump of the chain resulted in the non-sowing. In the electric drive system using an encoder to measure the travel speed, the slipping of the ground wheel caused the speed signal to be 0, which caused the driving motor to stop. In addition to the driving system, the non-uniformity of the seeding rates can be also caused by the blockage of the tube mouth during the seeds transporting to the soil. By comparing the three driving systems, it was concluded that the slipping of the ground wheel was the main reason for broken strips. The broken strips of MDS and EDSE were significantly higher than that of EDSG and greatly increased with the increase in the operating speed. At a high travel speed, it was suspected that the intensified slipping of the ground wheel created more transmission failure in MDS and inaccurate speed measuring in EDSE, then followed by an increase in the broken strips. For the EDSG, the broken strips had a decreased trend with the increase in operation speed, which indicates that the EDSG had better operating performance under the high-speed operation.

4. Conclusions

This paper compared the field performance of mechanical and electric driving systems used in a rice direct seeder in a wet field. In particular, the encoder and GPS were tested separately in the electric drive system to determine the suitable speed measurement method. The test results of the three drive systems (MDS, EDSE, and EDSG) showed that the planting uniformity of the electric driving systems was better than that of the mechanical driving system, and the speed measuring using GPS was more suitable for the electric drive system. The mean seeding rates of EDSG were close to the target values. The seeding rates of EDSG were concentrated near the target values. The EDSG exhibited better planting uniformity.
Slipping existed in MDS and EDSE, and increased significantly with the increase in the travel speeds. The slipping rates of MDS were significantly more than that of EDSE. The broken strips for MDS and EDSE also increased significantly. Due to the slipping of the ground wheel, the mechanical driving system and the electric driving system that used an encoder installed on the ground wheel to measure the travel speed had uneven seeding rates. The broken strips of EDSG decreased when the operation speeds increased; this indicated that GPS is more suitable for the electric driving system. Therefore, the electric driving system using GPS for travel speeds measuring is recommended for the rice direct seeding.

Author Contributions

Conceptualization, Y.W. and B.Q.; methodology, Y.W.; software, Q.X.; validation, Y.W., B.Q. and Q.X.; formal analysis, W.Z.; investigation, W.Z.; resources, W.Z.; data curation, Y.W.; writing—original draft preparation, Y.W.; writing—review and editing, B.Q.; visualization, Q.X.; supervision, W.Z.; project administration, W.Z.; funding acquisition, W.Z. All authors have read and agreed to the published version of the manuscript.

Funding

This research was funded by the National Key Research and Development Program of China (Grant No. 2021YFD2000402), the Jiangsu Provincial Natural Science Foundation of China (Grant No. BK20211021), the Jiangsu Province Agricultural Science and Technology Independent Innovation Fund (Grant No. CX(21)3143), the Basic research Funds of Chinese Academy of Agricultural Sciences (S202121), and Jiangsu Provincial Key Research and Development Program (Grant no. BE2021308).

Data Availability Statement

The data presented in this study are available on request from the authors.

Acknowledgments

The authors thank the editor and anonymous reviewers for providing helpful suggestions for improving the quality of this manuscript. All individuals included in this section have consented to the acknowledgement.

Conflicts of Interest

The authors declare no conflict of interest.

References

  1. Khush, G.S.; Gupta, P. Strategies for increasing the yield potential of cereals: Case of rice as an example. Plant Breed. 2013, 132, 433–436. [Google Scholar] [CrossRef]
  2. Liu, T.Q.; Fan, D.J.; Zhang, X.X.; Chen, J.; Li, C.F.; Cao, C.G. Deep placement of nitrogen fertilizer reduces ammonia volatilization and increases nitrogen utilization efficiency in no-tillage paddy fields in central China. Field Crops Res. 2015, 184, 80–90. [Google Scholar] [CrossRef]
  3. Peng, S.B. Reflection on China’s rice production strategies during the transition period. Sci. Sin. 2014, 44, 845–850. [Google Scholar] [CrossRef]
  4. Sun, L.; Hussain, S.; Liu, H.; Peng, S.; Huang, J.; Cui, K.; Nie, L. Implications of low sowing rate for hybrid rice varieties under dry direct-seeded rice system in Central China. Field Crops Res. 2015, 175, 87–95. [Google Scholar] [CrossRef]
  5. Peng, S.; Tang, Q.; Zou, Y. Current status and challenges of rice production in china. Plant Prod. Sci. 2019, 12, 3–8. [Google Scholar] [CrossRef] [Green Version]
  6. Liang, Z.; Zhang, D.; Yang, L.; Cui, T.; Hao, Y. Experimental study on motor driven pneumatic precision seed-metering device for maize. In Proceedings of the 2015 ASABE Annual International Meeting, New Orleans, LO, USA, 26–29 July 2015. [Google Scholar] [CrossRef]
  7. Miller, E.A.; Rascon, J.; Koller, A.; Porter, W.M.; Taylor, R.K.; Raun, W.R.; Kochenower, R. Evaluation of corn seed vacuum metering systems. In Proceedings of the 2015 ASABE Annual International Meeting, Dallas, Texas, 29 July–1 August 2012. [Google Scholar] [CrossRef]
  8. Zhan, Z.; Yaoming, L.; Jin, C.; Lizhang, X. Numerical analysis and laboratory testing of seed spacing uniformity performance for vacuum-cylinder precision seeder. Biosyst. Eng. 2010, 106, 344–351. [Google Scholar] [CrossRef]
  9. Sanusan, S.; Polthanee, A.; Audebert, A.; Seripong, S.; Mouret, J.C. Growth and yield of rice (Oryza sativa) as affected by varieties, seeding depth and water deficits at vegetative stage. Asian J. Plant Sci. 2010, 9, 36–43. [Google Scholar] [CrossRef] [Green Version]
  10. Cay, A.; Kocabiyik, H.; May, S. Development of an electro-mechanic control system for seed-metering unit of single seed corn planters Part I: Design and laboratory simulation. Comput. Electron. Agric. 2018, 144, 71–79. [Google Scholar] [CrossRef]
  11. Yang, L.; Yan, B.; Cui, T.; Yu, Y.; He, X.; Liu, Q.; Liang, Z.; Yin, X.; Zhang, D. Global overview of research progress and development of precision maize planters. Int. Agric. Biol. Eng. 2016, 9, 9–26. [Google Scholar] [CrossRef]
  12. Cay, A.; Kocabiyik, H.; May, S. Development of an electro-mechanic control system for seed-metering unit of single seed corn planters part II: Field performance. Comput. Electron. Agric. 2018, 145, 11–17. [Google Scholar] [CrossRef]
  13. Aykas, E.; Yalçin, H.; Yazgi, A. Balta Tipi Gömücü Ayağa Sahip Tek Dane Ekim Makinalarının Farklı Bölgelerde Mısır Ekiminde Ekim Performanslarının Karşılaştırılması. J. Agric. Mach. Sci. 2013, 9, 67–72. [Google Scholar]
  14. Kamgar, S.; Eslami, M.J.; Mehdi, M.M. Design, development and evaluation of a mechatronic transmission system to improve the performance of a conventional row crop planter. Int. J. Agron. Plant Prod. 2013, 4, 480–487. [Google Scholar]
  15. Yang, L.; He, X.; Cui, T.; Zhang, D.; Shi, S.; Rui, Z.; Mantao, W. Development of mechatronic driving system for seed meters equipped on conventional precision corn planter. Int. J. Agric. Biol. Eng. 2015, 8, 1–9. [Google Scholar]
  16. He, X.; Cui, T.; Zhang, D.; Wei, J.; Wang, M.; Yu, Y.; Liu, Q.; Yan, B.; Zhao, D.; Yang, L. Development of an electric-driving control system for a precision planter based on a closed-loop PID algorithm. Comput. Electron. Agric. 2017, 136, 184–192. [Google Scholar] [CrossRef]
  17. Iacomi, C.; Popescu, O. A new concept for seed precision planting. Agric. Agric. Sci. Proc. 2015, 6, 38–43. [Google Scholar] [CrossRef] [Green Version]
  18. Wang, Z.; Huang, Y.; Wang, B.; Zhang, M.; Ma, Y.; Ke, X.; Luo, X. Design and experiment of rice precision metering device with sowing amountstepless adjusting. Trans. Chin. Soc. Agric. Eng. 2018, 34, 9–16. [Google Scholar] [CrossRef]
  19. Zhao, T.; Yu, H.; Hao, X.; He, L.; He, R.; Li, X.; Dou, X. Design and experiment of sowing control system for rice direct seeder based on PID algorithm. J. South China Agric. Univ. 2019, 40, 118–125. [Google Scholar] [CrossRef]
  20. Meng, Z.; Liu, H.; Fu, W.; Huang, W.; Wang, X. Evaluation of ground speed measurements for agricultural machinery. Trans. Chin. Soc. Agric. Eng. 2010, 26, 141–145. [Google Scholar]
  21. Qi, B.; Zhang, W.; Yu, S.; Ji, Y.; Li, K.; Zhang, S. Establishment of Seeding Amount Control Model for Centralized Pneumatic Metering System for Rice. Trans. Chin. Soc. Agric. Eng. 2018, 48, 125–131. [Google Scholar]
  22. Chen, S.; Ge, Q.; Chu, G.; Xu, C.; Yan, J.; Zhang, X.; Wang, D. Seasonal differences in the rice grain yield and nitrogen use efficiency response to seedling establishment methods in the middle and lower reaches of the yangtze river in China. Field Crops Res. 2017, 205, 157–169. [Google Scholar] [CrossRef]
  23. GB/T 9478-2005; General Administration of Quality Supervision, Inspection and Quarantine of the PR China: Testing Methods of Sowing in Line. Standardization Administration of the PR China: Beijing, China, 2005.
  24. JB/T 6274.1–2001; Specifications for Grain Drills. Ministry of Industry and Information Technology of PR China: Beijing, China, 2001.
  25. Ding, Y.; Yang, L.; Zhang, D.; Cui, T.; He, X.; Zhong, X. Control system of motor-driving maize precision planter based on GPS speed measurement. Trans. Chin. Soc. Agric. Mec. 2018, 49, 42–49. [Google Scholar] [CrossRef]
Figure 1. The seeder and its driving system for field tests. (a) the seeder; (b) The mechanical driving system with chains and gears; (c) The electric drive system consists of a motor to drive the seed meter and the encoder or GPS to measure the travel speed.
Agronomy 12 01655 g001
Figure 2. The component of the electric drive system and the flow diagram of the controller.
Agronomy 12 01655 g002
Figure 3. Using a 1 m × 1 m four-frame and a steel ruler to collect the seeding rates in each strip.
Agronomy 12 01655 g003
Figure 4. Mean seeding rates of MDS, EDSE, and EDSG at travel speeds of 4.62, 5.81, and 7.27 km·h−1. Different lowercase letters mean significant difference at the 0.05 level.
Agronomy 12 01655 g004
Figure 5. Variation coefficient of seeding rates of MDS, EDSE, and EDSG at travel speeds of 4.62, 5.81, and 7.27 km·h1. Different lowercase letters mean significant difference at the 0.05 level.
Agronomy 12 01655 g005
Figure 6. Probability density functions of the seeding rates with the MDS, EDSE, and EDSG for the three operating speeds. SD is the standard deviation. The vertical red line represents the target value of 13. The vertical dotted lines are the mean value (u) of the function. The confidence interval [u − SD, u + SD] and at a probability of 68% and [u − 2SD, u + 2SD] at the probability of 95% were displayed. The columnar represents the proportion of the seeding rate against the corresponding confidence interval on the horizontal axis.
Agronomy 12 01655 g006
Figure 7. The cumulative probability functions of deviation of seeding rates against confidence intervals with MDS, EDSE, and EDSG, for the three different operational speeds.
Agronomy 12 01655 g007
Figure 8. The slipping rates of the three driving systems at speeds of 4.62, 5.81, and 7.27 km·h1.. Different lowercase letters mean significant difference at the 0.05 level.
Agronomy 12 01655 g008
Table 1. The number of broken strips for six rows of the direct seeder under the three driving systems (there were 180 measuring strips in total for each treatment).
Forward Speed (km·h1) Drive System
MDSEDSEEDSG
4.62755
5.811385
7.2716123
Publisher’s Note: MDPI stays neutral with regard to jurisdictional claims in published maps and institutional affiliations.

