Article

Genome-Wide Association Mapping Revealed SNP Alleles Associated with Spike Traits in Wheat

1
Department of Plant Biotechnology, Genetic Engineering and Biotechnology Research Institute (GEBRI), University of Sadat City (USC), Sadat City 32897, Egypt
2
Resources Genetics and Reproduction, Department Genebank, Leibniz Institute of Plant Genetics and Crop Plant Research (IPK), Corrensstr. 3, OT Gatersleben, D-06466 Stadt Seeland, Germany
3
Department of Genetics, Faculty of Agriculture, Assiut University, Assiut 71526, Egypt
4
Department of Biology, College of Science and Humanitarian Studies, Shaqra University, Qwaieah 15273, Saudi Arabia
5
Department of Agronomy & Horticulture, University of Nebraska-Lincoln, Lincoln, NE 68583, USA
6
Department of Agronomy, Faculty of Agriculture, Assiut University, Assiut 71526, Egypt
*
Authors to whom correspondence should be addressed.
Agronomy 2022, 12(6), 1469; https://doi.org/10.3390/agronomy12061469
Submission received: 16 April 2022 / Revised: 9 June 2022 / Accepted: 9 June 2022 / Published: 18 June 2022
(This article belongs to the Special Issue Modern Biotechnologies and Improvement Breeding for Cereals Crop)

Abstract

:
Wheat (Triticum aestivum L.) is one of the most important crops in the world. Four spike-related traits, namely, spike weight (SW), spike length (SL), the total number of spikelets per spike (TSNS), total kernels per spike (TKNS), and thousand-kernel weight (TKW), were evaluated in 270 F3:6 Nebraska winter wheat lines in two environments (Lincoln and North Platte, NE, USA). All genotypes in both locations exhibited high genetic variation for all yield traits. High positive correlations were observed among all yield-related traits in each location separately. No or low correlation in yield-related traits was observed between the two environments. The broad-sense heritability estimates were 72.6, 72.3, 71.2, 72.3, and 56.1% for SW, SL, TSNS, TKNS, and TKW, respectively. A genome-wide association study (GWAS) was used to identify SNPs associated with yield traits. In the Lincoln environment, 44 markers were found to be significantly associated with spike-related traits (SW, SL, TSNS, TKNS, and TKW), while 41 were detected in North Platte. Due to the strong significant genotype x environment, no common SNP markers were found between the two locations. Gene annotation of the significant markers revealed candidate genes encoded for important proteins that are associated directly or indirectly with yield traits. Such high genetic variation among genotypes is very useful for selection to improve yield traits in each location separately.

1. Introduction

Bread wheat (Triticum aestivum L.) is one of the most important crops worldwide. Wheat has the fourth-highest global production of all grains and the second-highest net production value of any crop. Global wheat production in the marketing year 2019/2020 was over 765 million metric tons. In comparison to the previous marketing year, this was an improvement of over 30 million tonnes [1]. Due to the diverse genetic architecture and low heritability of wheat grain yield (GY), improving GY is one of the most difficult goals in wheat breeding, and improving GY is usually the most important breeding goal [2]. Wheat yield is considered to have three main components: spikes per unit area, kernel number per spike (KNS), and thousand kernel wheat (TKW). Other traits that affect grain yield include spike length (SL), spike weight (SW), and total spikelet number per spike (TSNS). All of these yield-related traits are a little more heritable (h2) than GY, making them simpler to select in small plots early in breeding programmers [3,4,5]. Only a few yield-related trait results have been used in the selection of wheat lines in ongoing wheat breeding programs. This is due to the great effort and higher labor costs necessary to collect these types of data.
Marker-assisted selection (MAS) is thought to be a crucial strategy for helping to break through the GY bottleneck and increase wheat GY potential [2]. The number and diversity of available alleles and closely related molecular markers determine the potential applications of MAS [6,7]. A better understanding of yield-related traits combined with marker-assisted selection is thought to be the most effective way to increase GY potential [7]. Approximately 65 genes in wheat have been cloned to date, with 40 of them linked to GY and its components [1,7,8,9,10,11]. About 150 functional markers have been converted to kompetitive allele-specific PCR (KASP) formats, which are useful for low-cost, high-throughput genotyping for many of the cloned genes [10].
QTL mapping has been widely utilized to unravel the genetic architecture of agronomically important traits, as most are likely controlled by a large number of genes [12,13,14,15,16,17]. However, there are significant disadvantages to QTL mapping, including poor resolution and a restricted number of alleles that may be examined in each study. By producing high-resolution linkage maps, high-throughput genotyping methods that provide a large number of single nucleotide polymorphism (SNP) data have dramatically enhanced the resolution of QTL mapping [7,9,18,19,20]. GWAS data analysis is focused on linkage disequilibrium (LD), which has a far higher precision than conventional QTL mapping using biparental populations for capturing insights into the genetic architecture of complex traits [7,21,22]. Sallam et al. [22] contrast QTL mapping using biparental populations, GWAS, which makes use of readily available germplasm and avoids the time spent developing segregating populations. There have been multiple publications on quantitative trait loci (QTL) mapping and genome-wide association studies (GWAS) of GY and its related traits, such as [9,11,13,14,23,24,25,26,27,28]. We now believe it has had little impact on breeding programs, and additional research is needed to clarify the function of yield-related traits in the development of new cultivars.
In large genome species, novel genotyping approaches based on next-generation sequencing (NGS) have recently been developed as a viable tool for producing high-density genome-wide markers at a cheap cost per sample [29,30]. Poland et al. [31] developed a GBS methodology that employs two restriction enzymes (PstI and MspI) to significantly reduce genome complexity and provide more uniform libraries for sequencing than the single enzyme protocol [30]. The GBS approach offers several benefits, including low cost, ease of sample handling, and fewer purification processes [29,31,32].
A single nucleotide polymorphism (SNP) can induce genetic variation in crop traits, but it is more likely that many SNPs within a haplotype block are responsible [33]. As a result, SNP-GWAS and haplotype-GWAS are both used to classify genes that regulate complex traits. SNP-GWAS is often used in crop genetic experiments, while Haplotype-GWAS is often used in cross-pollinated crops to identify heterozygous chromosome fragments [34,35]. The plant material in this study has successfully been applied for the GWAS to identify the significant SNP markers associated with grain yield [18] and stem rust resistance [18,36]. The present study aimed to study the genetic variation among GY and its related traits in two different locations, and identify alleles associated with increased GY-related traits for future application in MAS.

2. Materials and Methods

2.1. Plant Materials

In this study, 270 winter wheat genotypes were selected from 2017 F3:6 nurseries (the preliminary yield trial, referred to as the Nebraska Duplicate Nursery; DUP2017,). These genotypes are the progeny of selections from segregating populations derived from 800 to 1000 crosses primarily among genotypes adapted to the American Great Plains, with an emphasis on genotypes adapted to Nebraska [18,29]. Pedigree information for F3:6 Nebraska Duplicate Nursery winter wheat is presented in (Supplementary Table S1).

2.2. Experimental Design and Layout

The 270 genotypes investigated in this study were cultivated in two environments in Nebraska: Lincoln (latitude 40.8136° N, longitude 96.7026° W) and North Platte (latitude 41.1403° N, longitude 100.7601° W). The experimental design was an augmented incomplete block design with a single replication and ten incomplete blocks in each location. Each incomplete block included three check cultivars (Goodstreak, Freeman, and Camelot) and 27 experimental lines (a total of 30 lines per incomplete block). As such, the experiment had 300 plots, 270 experimental lines, and the three check cultivars were ten times to provide an estimate of error and spatial variability. Each plot consisted of five 3 m long rows and 0.23 m between rows in each location. The seedling rate was 54 kg ha−1. At the end of the growing season, the GY of each genotype was harvested by a Wintersteiger Classic combine harvester (Wintersteiger Inc., Ankeny, IA, USA), bagged, and stored at room temperature before weighing. The GY was converted to kg ha−1.

2.3. Yield Related Traits

Six spikes from six different single plants were randomly selected from each plot, and the following traits were measured: spike weight (SW, g; measured after physiological maturity by measuring the weight of each individual spike), spike length (SL, cm; measured from the base of the spike to the tip, excluding awns if any), total spikelet number per spike (TSNS; measured by counting the number of spikelets per spike), the total number of kernels per spike (TNKS; was measured by threshing each spike and counting the number of kernels), and 1000-kernel weight (TKW, g; was measured by weighing 1000 randomly selected kernels from each plot). Eltaher et al. [18] previously evaluated grain yield (kg ha−1) for all genotypes in nine locations, including North Platte and Lincoln. We used the grain yield data scores in these two locations with the other data scores in this study to analyze the correlations between spike traits and the grain yield in depth.

2.4. Statistical Analysis of the Studied Yield Components

For each studied trait, data from all the tested two environments were combined and analyzed using the lmerTest R package. The analysis of variance model was:
Y = Check + Environment + Iblock (Environment) + Genotype + G × E + Error
All factors except checks were fitted as random effects in this model, whereas the check was fitted as a fixed effect. The variance component was also used to estimate broad sense heritability using the following formula:
H2 = Var(G)/[(Var(G) + Var(G × E)/E + Var(E)/(E × R)]
The R software package “maten” was used to calculate Pearson’s correlations among all GY-related traits based on the genotype performance of each experimental genotype in both environments.

2.5. DNA Extraction, Genotyping-By-Sequencing and SNP Calling

Following the manufacturer’s instructions, DNA was extracted and purified from the 2–3 wheat leaves of two-week old seedlings using BioSprint 96 DNA Plant Kits (Qiagen, Valencia, CA, USA). The GBS method was performed as described by Poland et al. [31]. The SNPs were called using Tassel v5.2.40 software [37]. SNPs were called using the reference genome v1.0 of the “Chinese Spring” genome assembly from the International Wheat Genome Sequencing Consortium (IWGSC). To increase genome coverage and read depth, the raw sequences of the 270 genotypes in this investigation, as well as 6791 other genotypes previously genotyped in our method, were combined and analyzed together [38,39]. The GBS methods identified 206,620 SNPs, which were filtered according to the following criteria: minor allele frequency (MAF > 0.05), maximum missing sites per SNP <20% and maximum missing sites per genotype <20% [38,40]. To avoid miscalculation of allele effects, heterozygous loci were treated as missing [41,42]. As a result of these filters, 28,568 SNPs remained and were used for GWAS in this study.

2.6. Genome-Wide Association Study (GWAS) for the Studied Yield Components

Genome-wide association mapping analysis between all the studied yield components and the filtered SNPs was carried out using TASSEL v5.0 software [37]. The mixed linear model (MLM) with population structure and kinship coefficients was used. The threshold for the p-value (1.98 × 10⁻⁵) was calculated based on the number of markers (P = 1/n, where n is the total number of SNPs used) according to the method reported by Eltaher et al. [18]. For multiple comparison adjustments, the marker-trait associations (MTAs) were tested against Bonferroni corrections (BC) at a significance level of 5%. For all significant MTAs, the percentage of explained phenotypic variation (R2), major and allelic effects were reported. Manhattan plots for yield-related traits were visualized using http://www.bioinformatics.com.cn/en (accessed on 10 June 2022), an online platform for data analysis and visualization. Linkage disequilibrium (r2) was estimated using TASSEL 5.0 between each pair of significant SNPs located on the same chromosome.

2.7. Candidate Genes and Gene Annotation for Yield Component Traits

All significant SNP markers were detected by GWAS in the Ensemble Plants genomic database (http://plants.ensembl.org/Triticum_aestivum/Info/Index (accessed on 10 June 2022) to see if they are located within gene models using the reference genome assembly (IWGSC Ref Seq v2.0). The physical position of each significant SNP was used to find the gene model associated with the target significant SNP. The expression of the candidate genes was tested through the Wheat eFP browser at http://bar.utoronto.ca/efp_wheat/cgi-bin/efpWeb.cgi (accessed on 10 June 2022).

3. Results

3.1. Analysis of Variance for the Yield Components Traits

The analysis of variance results for the 2017 growing season for SW, SL, TSNS, TKNS, and TKW (Table 1) revealed significant differences among genotypes, between environments Lincoln and North Platte, and the GEI were significant for all five traits: SW, SL, TSNS, TNKS, and TKW. The broad-sense heritability estimates were 72.6, 72.3, 71.2, 72.3, and 56.1% for SW, SL, TSNS, TKNS, and TKW, respectively.

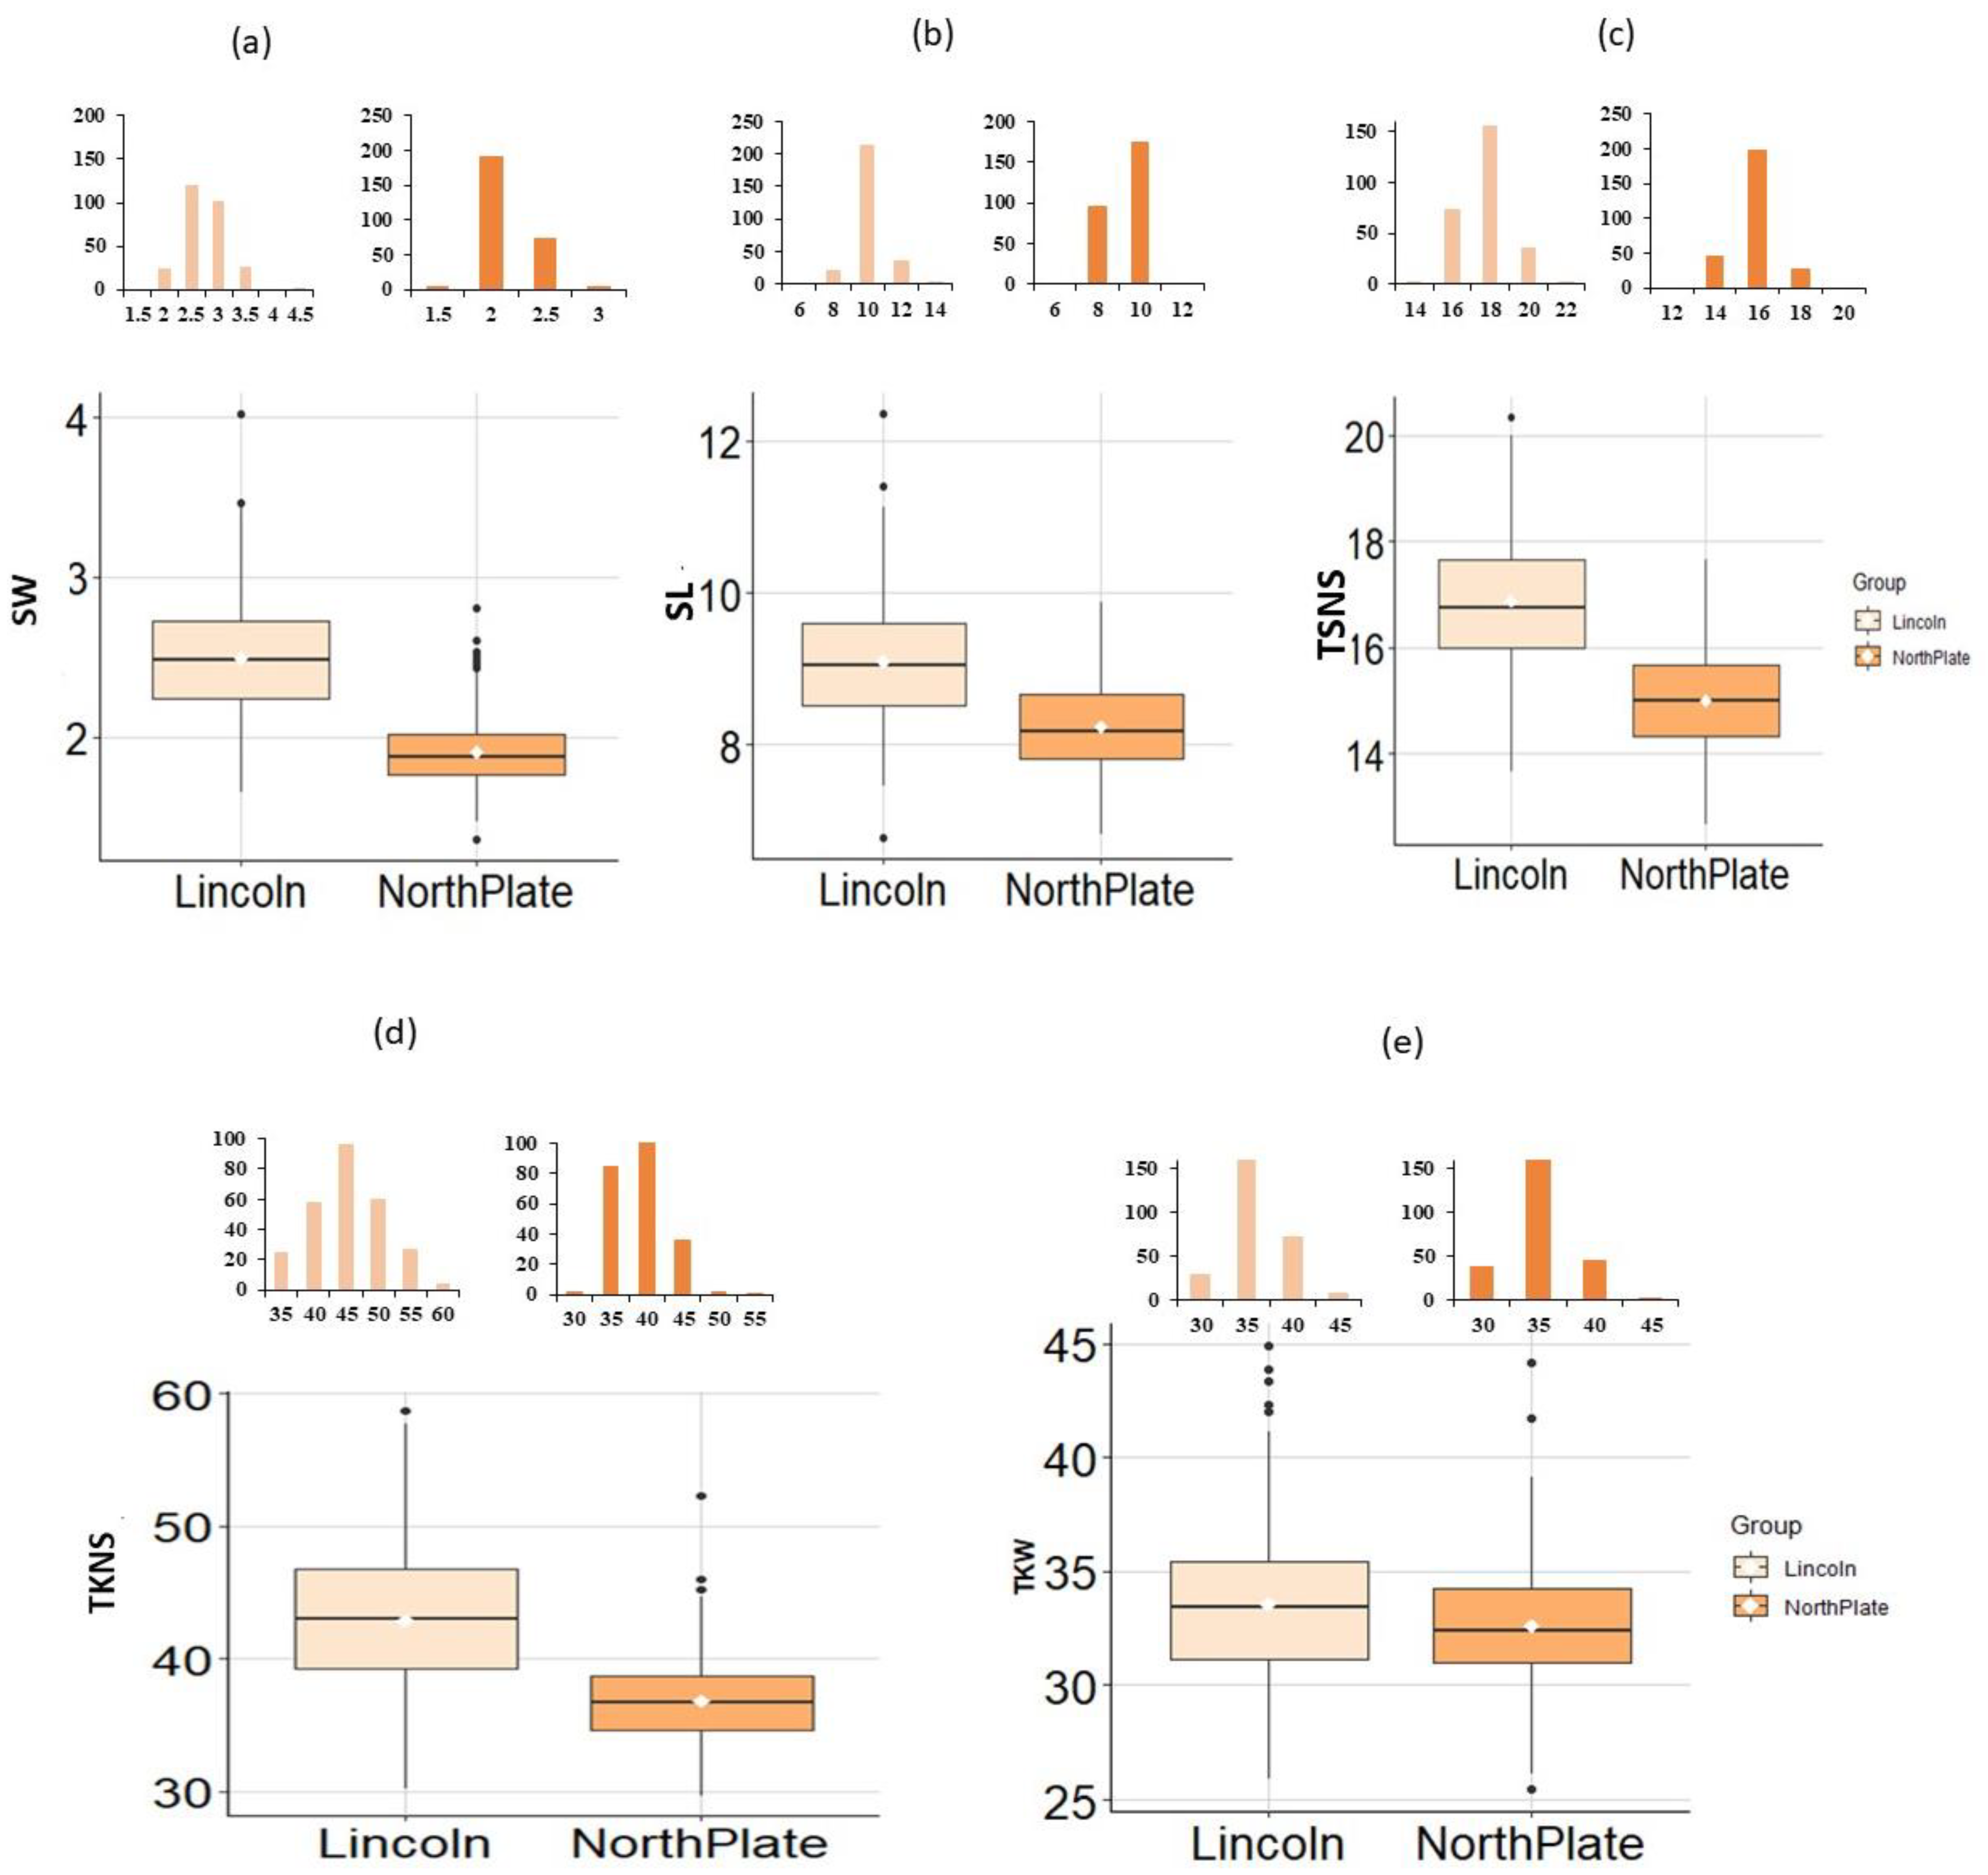
3.2. Phenotypic Analysis for the Yield Related Traits

The phenotypic distribution was analyzed and presented using boxplots and histograms for all yield-related traits in both environments, Lincoln, and North Platte (Figure 1). The individual genotypic values for GY-related traits in Lincoln and North Platte can be found in (Supplementary Table S2). Continuous and wide-ranging distributions were detected in all yield-related traits under investigation, as one would expect for QTLs. The continuous distributions indicated that the characters are likely polygenic in nature, quantitatively inherited, and measured with some variability. In Lincoln, the highest spike weight of 4.02 g was found in NE17464, and the lowest spike weight of 1.65 g was found for NE17550 with an average of 2.50 g. In North Platte, the highest spike weight of 2.81 g was found in NE17532, and the lowest spike weight of 1.36 g was found in NE17487. For spike length, the longest spike, 12.35 cm, was found in NE17464, and the shortest spike, 6.78 cm, was found in NE17617, with an average of 9.10 cm in the Lincoln, while in the North Platte, the longest spike of 9.88 cm was found in NE17532, and the shortest spike length of 6.81 cm was found in NE17660, with a mean of 8.17 cm. For TSNS, the maximum number of spikelets of 20.33 was found in NE17566, and the minimum number of spikelets of 13.67 was found in NE17563, with an average of 16.87 in the Lincoln. In North Platte, the highest number of spikelets, 17.67, was found in NE17598, and the lowest number of spikelets, 12.66, was found in NE17660, with a mean of 14.97. For TKNS, in Lincoln, the maximum number of TKNS of 58.67 kernels was found in NE17431, and the minimum number of TKNS of 30.17 kernels was found in NE17425, with an average of 42.87 kernels. In North Platte, the highest number of kernels per spike of 52.33 kernels was detected in NE17665, and the lowest number of kernels per spike of 29.66 kernels was noticed in NE17487, with a mean of 36.66 kernels. In Lincoln, the highest value of TKW, 44.87 g, was weighted in the genotype NE17438, and the lowest value of thousand kernel weight, 25.91 g, was detected in genotype NE17609 with a mean of 34.29 g. In North Platte, the greatest value of the thousand kernels weight, 44.17 g, was found in the genotype NE17404, and the smallest value of the thousand kernels weight, 25.46 g, was found in genotype NE17623, with a mean of 32.77 g. Overall, the box plot analysis revealed that all genotypes had higher yield attributes in Lincoln than in North Platte.

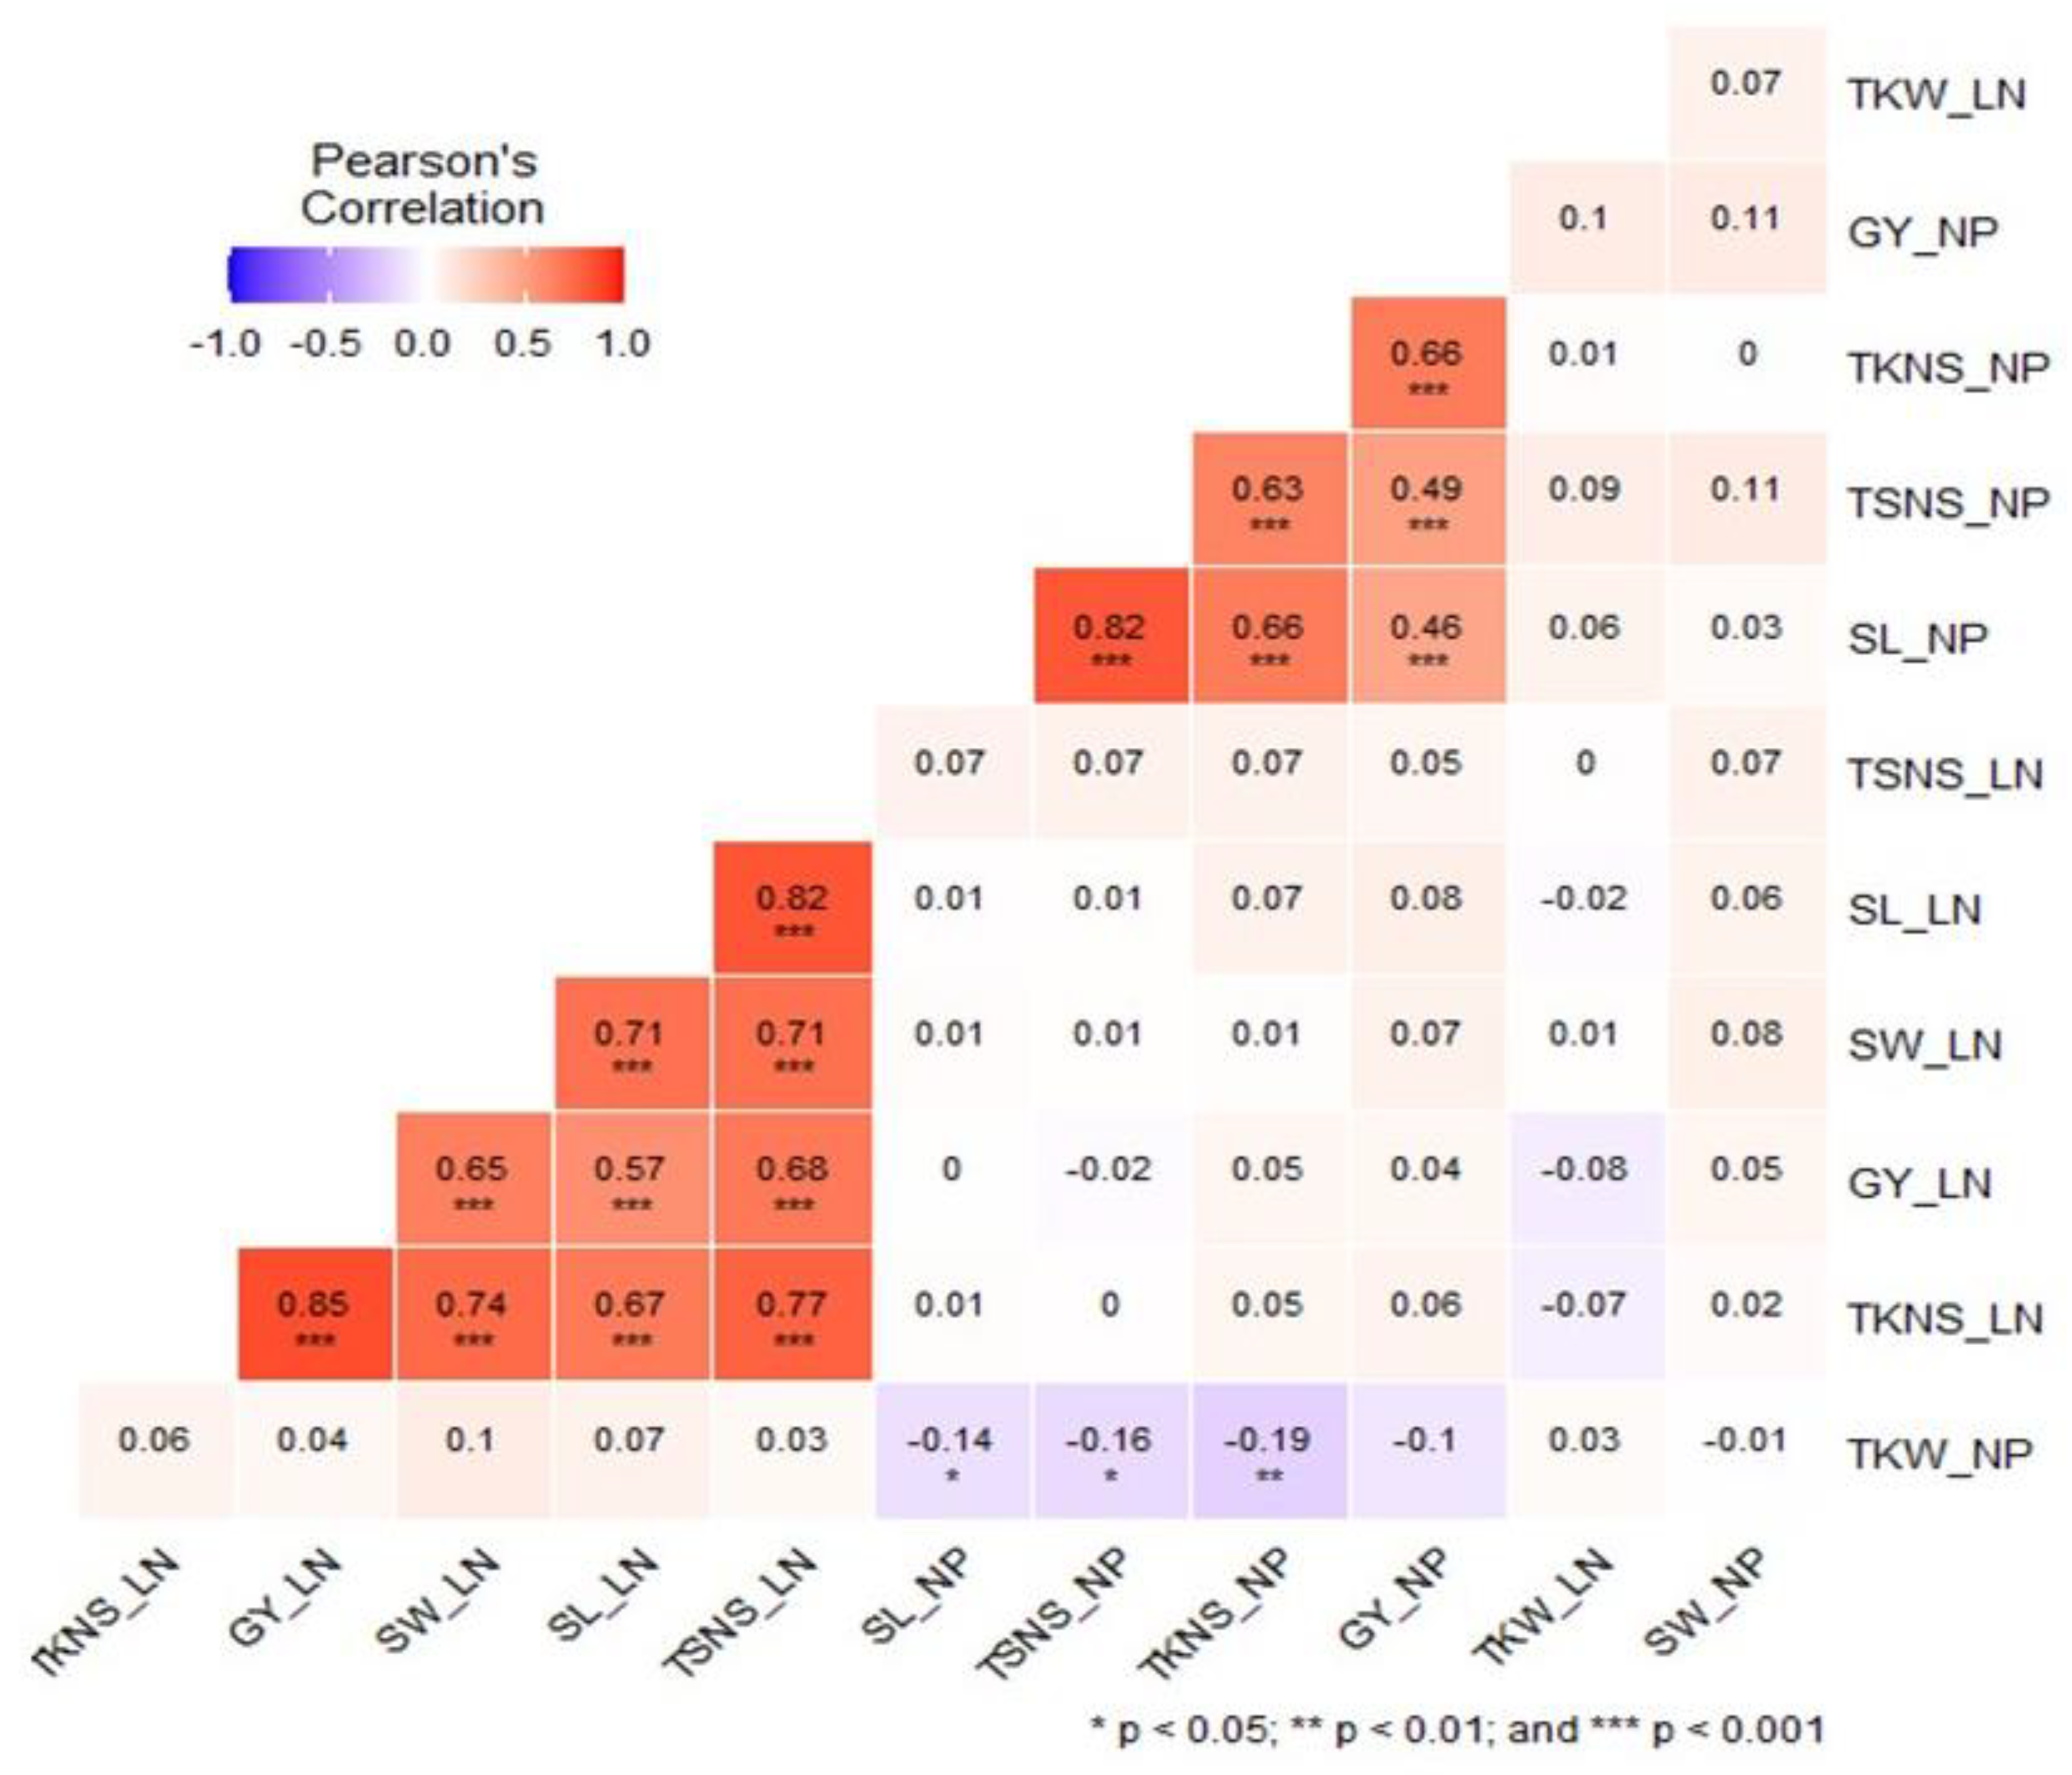
3.3. Correlation Coefficients for Yield-Related Traits

Eltaher et al. [18] previously investigated the grain yield of 270 F3:6 Nebraska winter wheat genotypes in eight Nebraska and one Kansas environment. In each environment, for each trait (Figure 2), there was no significant correlation in the yield-related traits between the two environments. In each environment, highly positive and significant correlations were found among spike-related traits. In Lincoln, the highest positive significant correlation was found between GY and TKNS (r = 0.85 **), while the correlation between SL and TSNS was the highest with r of 0.82 ** in North Platte. GY was significantly correlated with all traits in Lincoln, while, in North Platte, it was significantly correlated with SL, TSNS, and TKNS. Notably, TKW was not significantly correlated with any trait in Lincoln, while it was negatively correlated with TKNS, TSNS, and SL in North Platte.

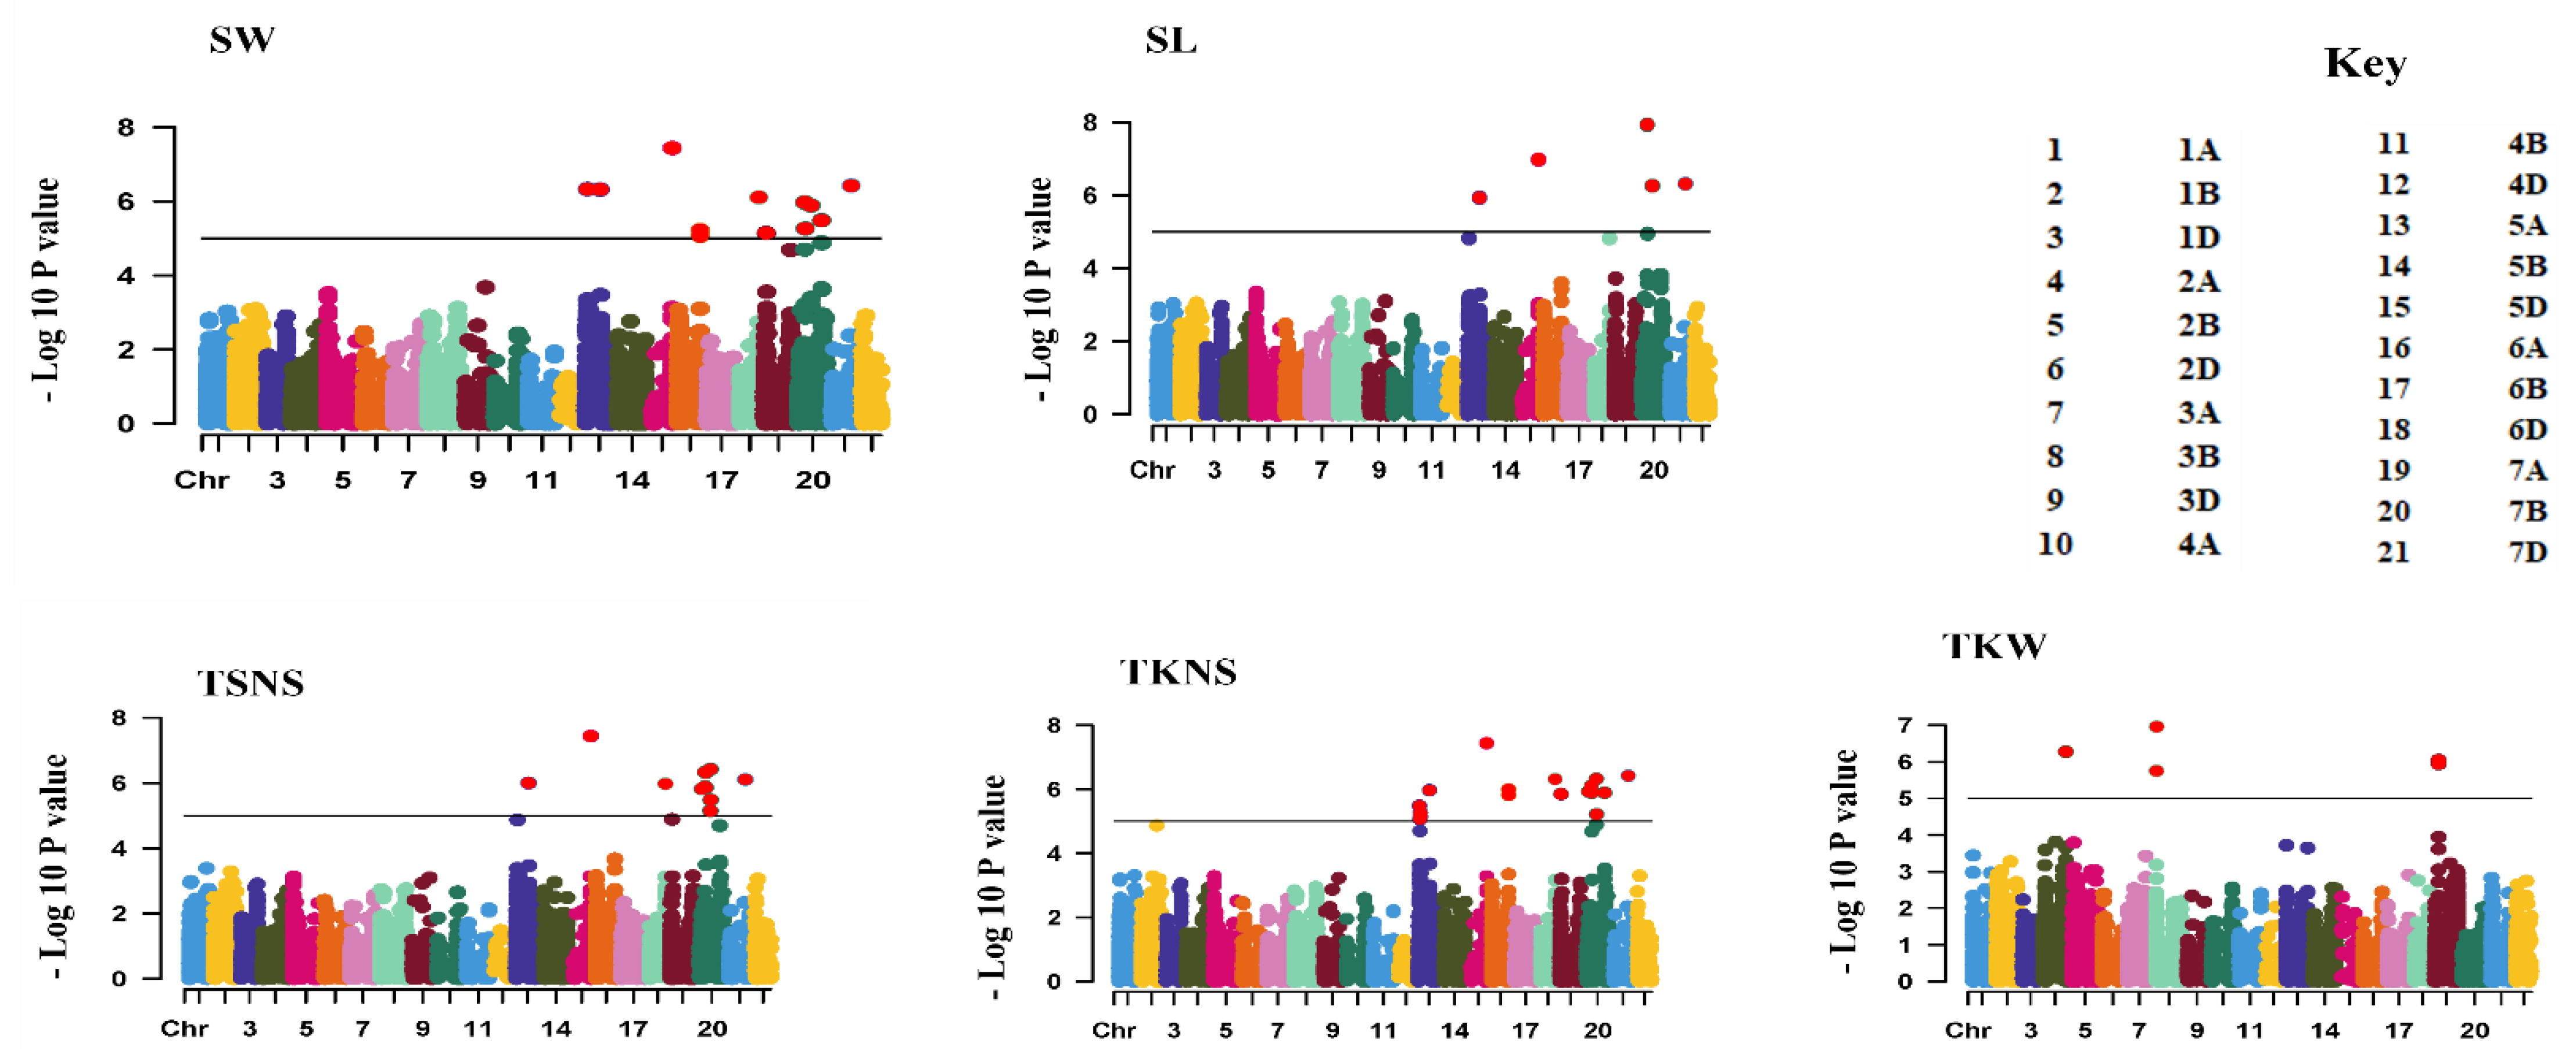
3.4. Genome Wide Association Studies for Yield-Related Traits

The analysis of GWAS revealed 44 significant SNPs associated with yield-related traits in Lincoln and 41 in North Platte (Figure 3a). SW, TKNS, and TSNS had higher QTL in Lincoln than in North Platte, while SL and TKW had a higher number of QTL in North Platte than in Lincoln (Figure 3b). There were no common markers between the two environments (Lincoln and North Platte), as shown in Figure 3c.
In Lincoln, 44 markers were identified as being significantly associated with yield-related traits SW, SL, TSNS, TKNS, and TKW (Supplementary Table S3). Additionally, the summarized GWAS analysis for yield-related traits is presented in Table 2. Manhattan plots for yield-related traits are presented in Figure 4. Significant markers were found on nine different chromosomes, including 2A, 3B, 5A, 5D, 6A, 6D, 7A, 7B, and 7D. SL had the fewest significant SNPs for yield-related traits, while TSNS had the most significant SNPs. The −log 10 p value varied from 1.161 × 10⁻⁷ to 3.27 × 10⁻⁵ for markers S7B_165529101 and S5A_47458032, respectively. The phenotypic variation R2 varied from 5.69 to 9.01%. The three significant markers S5A_46628103, S7B_607427421, and S5A_380823821 were found to be significantly associated with SW. The lowest allele effect was accounted for in marker S6D_469537865, which was significantly associated with TNKS. The maximal allele effect (A) of 6.71 was observed.
In North Platte, 41 markers were found to be significantly associated with yield-related traits SW, SL, TSNS, TKNS, and TKW, as described in (Supplementary Table S3). Additionally, the summarized GWAS analysis for yield-related traits is presented in (Table 3). Manhattan plots for yield-related traits are presented in Figure 5. All these significant markers were distributed on nine different chromosomes: 1A, 2A, 3B, 4A, 5D, 6A, 6B, 7A, and 7B. The lowest number of significant SNPs, 5 SNPs for yield-related traits, was detected in SL, while the highest number of SNPs, 15, was observed in TKNS. The −log 10 p value ranged from 3.72 × 10⁻⁷ to 3.0618 × 10⁻⁵ for markers S5D_61792984 and S3B_60737182, respectively. The R2 ranged from 5.45 to 13.36% for marker S5D_62479367 and marker S3B_62315382, respectively. The minimum allele effect (T) of 0.12 was observed in four markers, S3B_60737182, S6A_19036296, S7A_610993044, and S3B_64172577, which were significantly associated with SL. However, the maximum allele effect (C) of 3.06 was found in both markers S5D_72377429 and S5D_61792984, which were significantly associated with TNKS.

3.5. Common Markers Associated with Yield-Related Traits

Table 4 describes ten common markers found to be significantly associated with yield-related traits SW, SL, TSNS, and TKNS in Lincoln. Chromosome 3B had four comment markers associated with more than one trait. Five common markers, S5A_380823821, S5D_548379143, S7B_165529101, S7B_329792071, and S7D_485517060, were found to be significantly associated with all yield-related traits, except TKW. Two markers were on chromosome 7B, and one marker was on each of chromosomes 5A, 5D, and 7D. The R2 ranged from 5.78% in marker S7B_165529101 with trait SL, to 9.11% in marker S5D_548379143 with trait SW. Two markers, S5A_46628103 and S7B_607427421, were found to be significantly associated with SW and TNKS. Three markers, S6D_469537865, S7B_164151731, and S7B_181032630, were found to be significantly associated with TNKS and TSNS.
Ten markers were also found to be significantly associated with yield-related traits SW, SL, TSNS, and TKNS in North Platte (Table 5). Chromosome 7B had a set of six markers associated with more than one trait. Four markers, S3B_62315382, S3B_62315407, S5D_61792984, and S5D_72377429, were found to be significantly associated with all yield-related traits, except TKW. Two markers, S3B_64172577 and S6B_668517613, were significantly associated with SL, TNKS, and TSNS. Three markers, S3B_60737182, S7A_61099304,4 and S7B_729441244, were associated with SL and TNKS. The marker S5D_62479367 was associated with SW and TSNS.
By considering the SNP markers associated with (GY), which were described in Eltaher et al. [18], four markers were found in common between GY and yield-related traits in Lincoln (Table 6). Four markers were significantly associated with GY and spike-related traits in Lincoln, while eight markers were common between GY and spike-related traits in North Platte. Notably, no shared markers were found on the A genome and most of the shared markers between GY and spike-related traits were located on the D and B genomes in both locations, with six markers each.

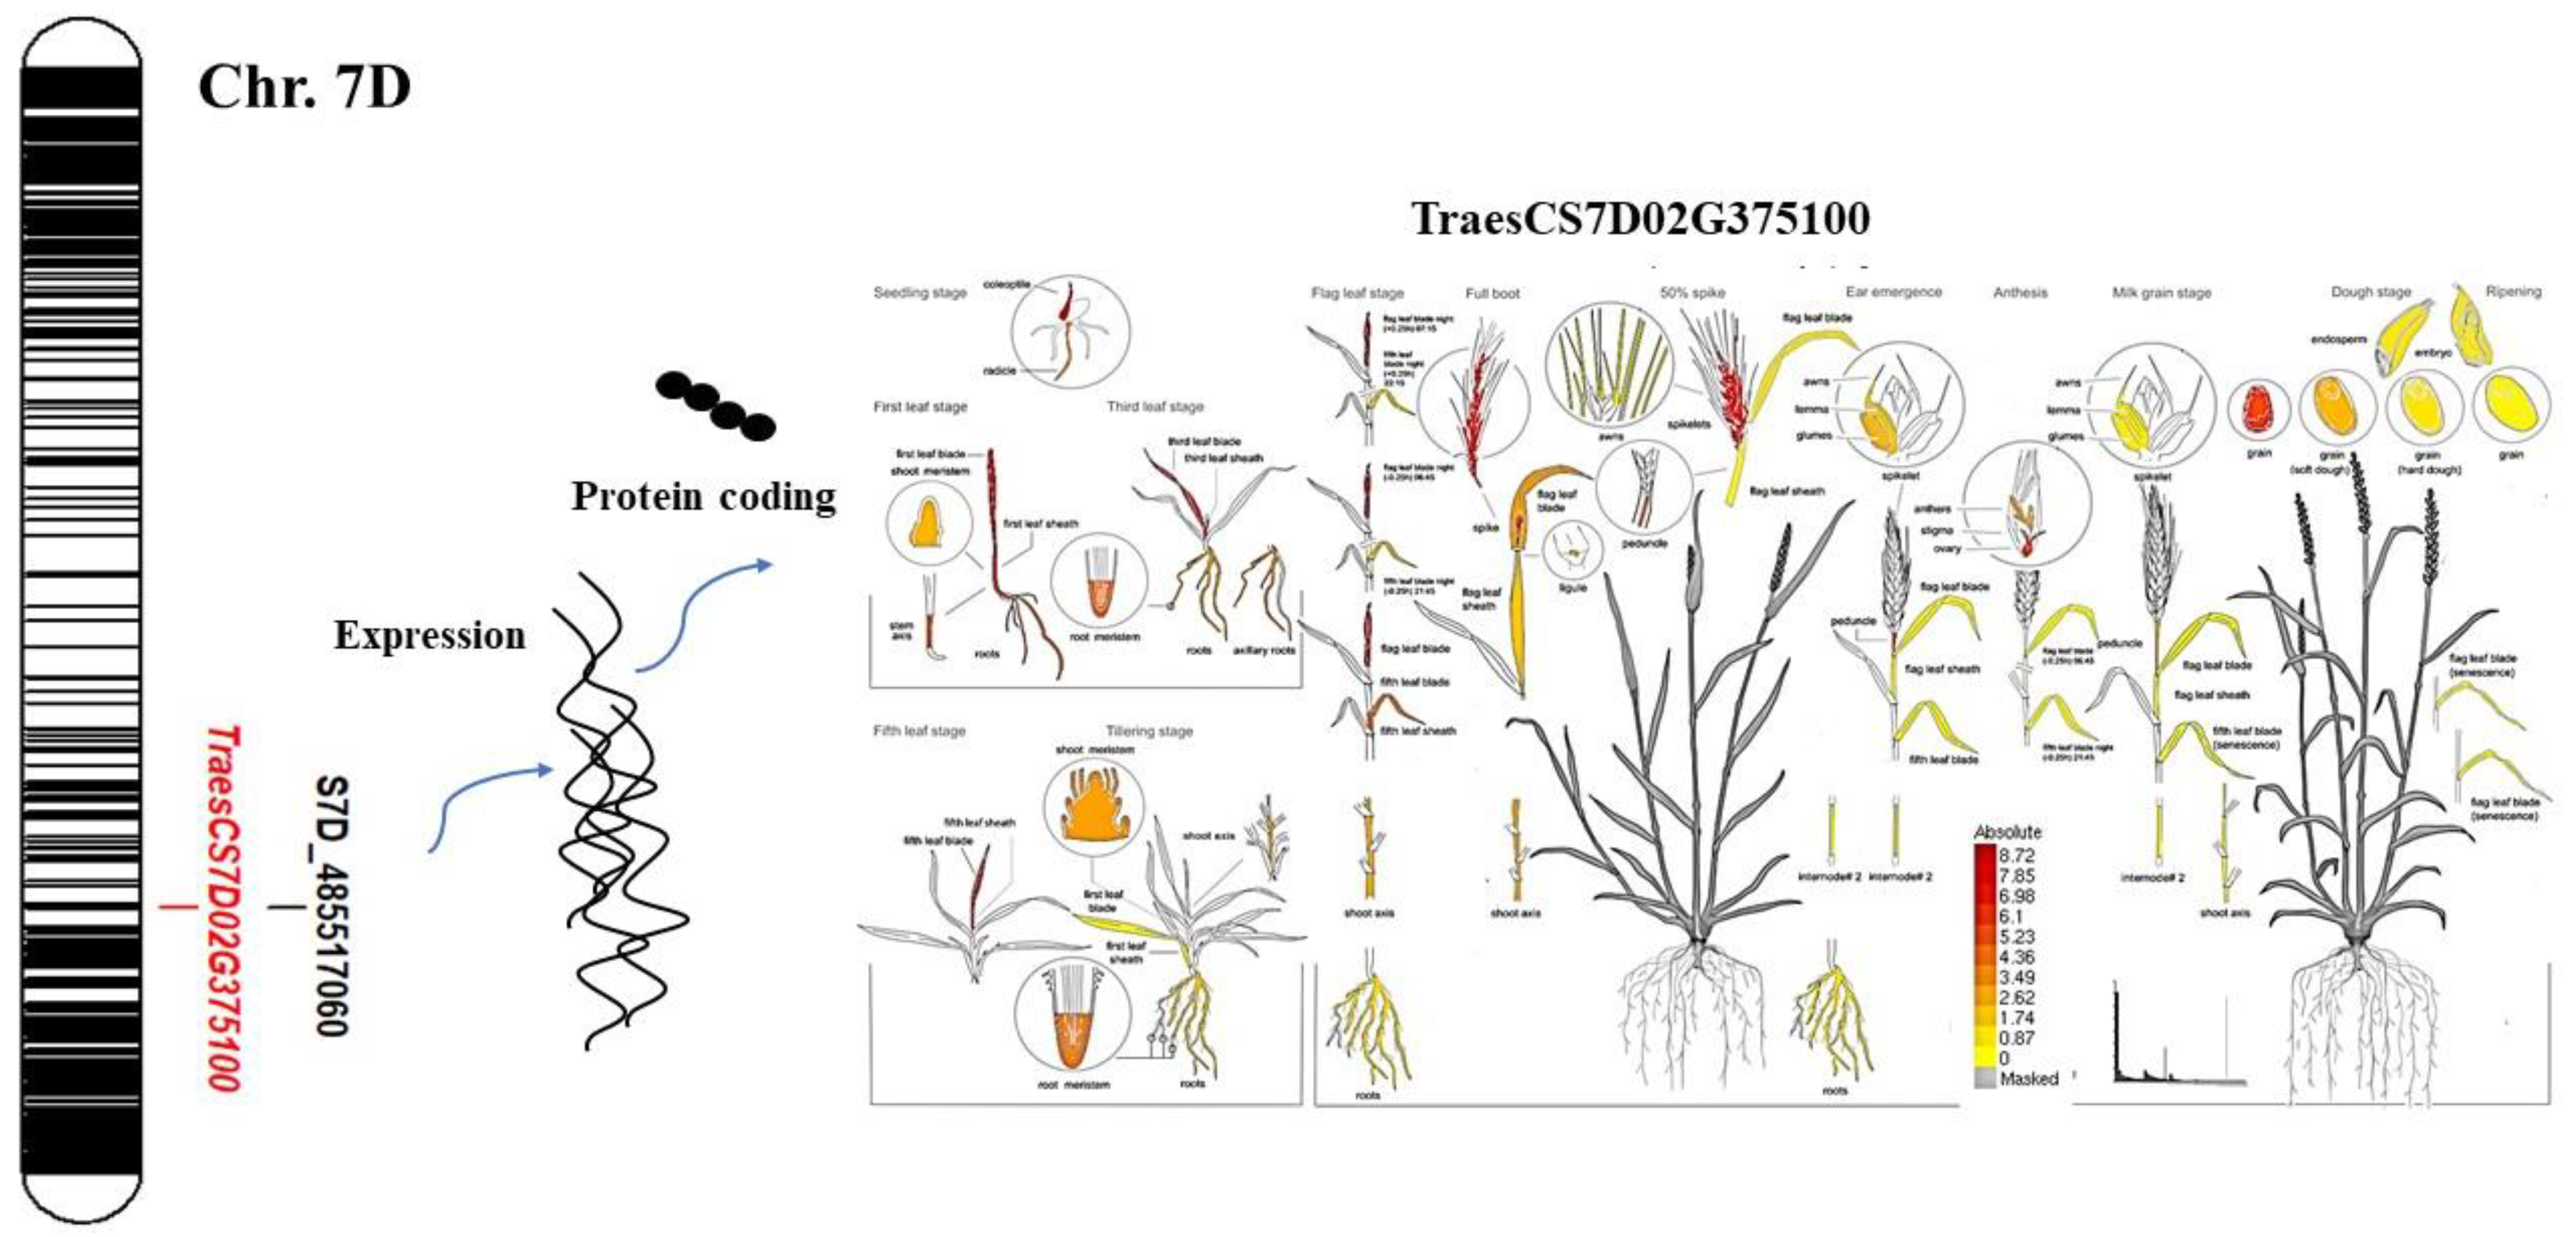
3.6. Gene Annotation for Yield-Related Traits

The candidate genes associated with the significant SNPs detected by GWAS in both locations are presented in Supplementary Table S4. The result of gene annotation revealed nineteen candidate genes.
In Lincoln, ten candidate genes were detected on different chromosomes. Out of the ten candidate genes, six were related to protein-coding with unknown function or non-translating coding sequences (CDS). The important common SNP marker S7D_485517060 (located on chromosome 7D), which was found to be significantly associated with all yield-related traits except TKW, was also found to be associated with grain yield in Lincoln by Eltaher et al. [18]. This SNP marker was annotated to TraesCS7D02G375100, and this gene had an effective value in the spike traits and was turned on in the spike (Figure 6). This gene translated to CDP-choline: 1,2-diacylglycerol cholinephosphotransfer, which plays a great role in the accumulation and deposition of triacylglycerols in the starchy endosperm of wheat grain, especially in the aleurone layers.
A set of 14 gene models were identified in North Platte. Of the 14 SNPs, nine genes were related to protein-coding with unknown function or non-translating CDs. The S3B_64172577 marker, which is associated with SL, TSNS, and TKNS, was found to be TraesCS3B02G095300.1, which encodes protein kinase-like domain superfamily.

4. Discussion

4.1. Genetic Variation for Yield-Related Traits

Analysis of genotypic responses across diverse production environments is valuable to classify suitable genotypes and test environments for enhanced breeding and cultivar development [18,19,43,44,45,46]. The analysis of variance in the present study found highly significant (p ≤ 0.001) differences among genotypes, test environments, and GEI effects. The variable genotypic response across test environments was recommended by a significant GEI in this study. Hence, identifying appropriate wheat genotypes that perform well in test environments is critical. Furthermore, environmental effects contributed much more to total variability than genotype and GEI effects, as indicated by the largest sum of squares for the traits studied. Moreover, extremely significant variation in genotypes, environments, and GEI reflected the differences in genotypes within a single environment, as well as between two environments. This result suggests that there is a high level of genetic variation, allowing plant breeders to use the full potential of genetic and environmental variation while supporting the selection process between genotypes [18,29]. The highest genotype for yield-related traits differed by environment, and the phenotypic correlation among environments varied due to the highly significant GEI interaction. As a result, the breeding program for increasing high grain yield may fluctuate depending on the environment [18,44]. All traits had high heritability estimates, except TKW, which had moderate heritability, indicating that the selection for these traits will be fruitful for the breeding program. Such high genetic variation among genotypes for each trait, in addition to high heritability, made the identification of genetic variants using GWAS feasible.
The significant GEI interaction hindered finding the most suitable genotypes for both environments, and specific breeding programs should be performed according to the environment. This notion is supported by the lack of correlation between the two environments for each trait. Significant correlations were only found among the traits within each environment separately. The same finding was observed in Eltaher et al., [18,44]. This highly significant GEI can be explained by the differences in the precipitation, snow cover, and temperature in each environment during the growing season. The high GEI is frequently interpreted as indicating that a site-specific breeding program for increasing grain yield is necessary for optimal improvement in each target environment [19,44].

4.2. Genome Wide Association Mapping for Yield-Related Traits

The most interesting SNP markers linked with yield-related traits SW, SL, TNKS, TSNS, and TKW were found on chromosomes 1A, 2A, 3A, 5A, 5D, 7B, and 7D in both environments in the present study. Environments have a major impact on grain yield and its components, and it is hard to select high-yielding lines in small plots early in a breeding program. Environments, on the other hand, have a significantly smaller impact on yield components, and some more stable QTL for these traits have been discovered, which is consistent with previous results [4,18,19,47,48,49,50,51,52,53,54].
All markers detected by GWAS in Lincoln had an R2 of 10%, indicating that these markers had minor effects on spike-related traits in Lincoln, while a set of nine markers in North Platte had a major effect on spike-related traits (R2 > 10%).
Markers with pleotropic effects, which were associated with more than one trait, were detected in each environment, separately. The non-shared markers for yield and its component traits between the two environments were due to the strong GEI. Many previous studies have found a strong relationship between grain yield and its component traits [4,51,52,55]. However, several markers for different traits were detected in the same or neighboring positions (3A, 5A, 5D, 6A, 7A, and 7B) as those identified in previous studies [56,57,58]. These results revealed the pleiotropism of markers for the GY and related traits, which may be due to the complex and often compensatory relationships among these traits [52,56,57,58,59,60].
Fifteen makers were found to be significantly associated with TKW. These SNPs were located on chromosomes 2A, 3B, and 7A in Lincoln and on 1A, 2A, 4A, 6A, and 7B in North Platte. Previous studies found QTLs associated with TKW traits were mainly distributed on chromosomes 2A, 3B, and 7A [51,61,62,63,64,65]. Significant markers for TKW were recorded on chromosome 7B, which was previously reported to have significant associations with TKW, using the markers Xwmc606, Xgwm537, wPt1715 and wPt2449 in a collection of tetraploid durum (T. durum L.) wheat genotypes [52,66].
Remarkably, significant markers were found to be associated with more than one trait, indicating that these markers have pleotropic effects. However, these markers have pleotropic effects in the specific environment due to the highly significant effects of G × E. These markers can be converted to Kompetitive-specific, allele-specific PCR for further validation in different genetic backgrounds before using them in marker-assisted selection.

4.3. Gene Annotation for Yield-Related Traits

The candidate gene TraesCS2A02G477600 was translated into the Bifunctional inhibitor/plant lipid transfer protein/seed storage helical domain superfamily for TKW. These protein families are large. The proteins are annotated as bifunctional inhibitors or cereal seed allergens that belong to the seed storage helical domain. These proteins can be found at high concentrations in the seeds of both mono-and dicotyledonous plants and are an important component of the normal human diet [67,68]. Seed storage proteins are proteins that accumulate significantly in the growing seed and serve as nitrogen, carbon, and sulfur storage reserves. These proteins are rapidly activated during seed germination and serve as the seedlings’ primary source of nutrients. After learning how important this gene is for preserving protein inside seeds, it is no surprise that it is also associated with TKW. As a result, it should be stated that selecting for this gene should increase protein storage within the grain of wheat, resulting in grains with high-quality features in terms of protein quantity and possibly quality.
The common candidate gene TraesCS6D02G398100.1 encodes the nucleic acid-binding, Oligonucleotide/Oligosaccharide-Binding (OB) Fold Proteins, Replication Factor A protein-like and winged helix DNA-binding domain superfamily. Within the Oligonucleotide/Oligosaccharide-Binding (OB) Fold Proteins, the nucleic acid-binding superfamily is the largest, and proteins with this motif are involved in practically every single-stranded DNA or RNA (ssDNA/ssRNA) that is present or needs to be manipulated [69]. DNA replication, recombination, repair, and telomere homeostasis are just a few of the biological processes that OB-fold proteins have been shown to have a role in. The common candidate gene, TraesCS7B02G135400.1, is translated into the BURP protein domain. The BURP domain is a C-terminal protein domain with four common members: BNM2, USP, RD22, and PG1. Plant-specific BURP domain-containing proteins have only been discovered so far, implying that their functions may be plant-specific [70]. BURP domain-containing proteins have been found in many species, such as rice (Oryza sativa L.), soybean (Glycine max (L.) Merr.), maize (Zea mays L.), and sorghum (Sorghum bicolor (L.) Moench) [71,72,73]. Plant BURP domain-containing proteins play a vital role in plant metabolism and development, although their expression patterns are variable, and several of their functions are unclear [74,75]. For example, VfUSP is an abundant non-storage seed protein from field beans (Vicia faba L.) with unknown activities that is expressed during zygotic embryogenesis and in vitro embryogenesis [76,77]. The two common candidate genes, TraesCS3B02G095300.1 and TraesCS3B02G095300.2, translate into the protein kinase like-domain superfamily. They play a role in diurnal and circadian regulation; cell cycle regulation; developmental processes; vesicle transport and channel activity modulation, and cellular metabolic regulation [78,79,80,81].
The common gene TraesCS7D02G375100 is associated with spike-related traits and GY in Lincoln, which is translated to CDP-choline: 1,2-diacylglycerol cholinephospho transfer. This gene plays a role in the storage of lipids inside the wheat grain [82,83]. Triacylglycerols (TAGs) are the major storage lipids in seeds, although they are only minor components in cultivated cereals (with the exception of oats, Avena sativa L.). They are abundant in the aleurone layer and scutellum of the wheat embryo, accounting for 60–80% of total lipids in these tissues [83]. On the other hand, TAGs make up around a third of the total lipids in the starchy endosperm tissue that white flour is produced from [83,84]. Their synthesis and deposition are poorly understood. Although lipid droplets have been observed in starchy endosperm cells, it is also possible that certain lipids (including TAGs) are transferred from the aleurone and embryo to the flour during milling [83,85]. This gene was found to be highly expressed in spike and grain, which agrees with the strong association between this gene and spike-related traits detected by GWAS in our study.
In conclusion, the highly significant G × E interaction found between the two locations hindered selecting the highest yielding genotypes for breeding programs, as well as sharing markers for marker-assisted selection in both locations. Therefore, it is highly recommendable that each location should have its own specific breeding program supported by promising markers to accelerate breeding programs for wheat improvement.

Supplementary Materials

The following supporting information can be downloaded at: https://www.mdpi.com/article/10.3390/agronomy12061469/s1, Table S1: Pedigree information for F3:6 Nebraska Duplicate Nersury winter wheat; Table S2: The genotypes performance for grain yield components traits in Lincoln and North Platte; Table S3: Significant SNP loci, chromosome number, posion,—Log 10 p Value and allele effect identified for yield component traits in both location Lincoln and North Platte; Table S4:- Repetitive common SNPs detected by GWAS and their chromosome number, p value, gene ID and function description information identified by Ensemblplant database; Table S4:- Repetitive common SNPs detected by GWAS and their chromosome number, p value, gene ID and function description information identified by Ensemblplant database.

Author Contributions

Conceptualization, S.E., A.S., K.F.M.S. and P.S.B.; methodology, S.E., A.M.I.M.; validation, A.A.N.; formal analysis, S.E., A.M.I.M.; investigation, S.E., A.S. and P.S.B.; writing—original draft preparation, S.E.; writing—review and editing, A.S., A.B., P.S.B. and A.M.I.M.; visualization, H.A.E., A.A.N. and K.F.M.S. All authors have read and agreed to the published version of the manuscript.

Funding

The publication of this article was partially funded by the Deutsche Forschungsgemeinschaft (DFG, German Research Foundation, grant 491250510) and by the Open Access Fund of the Leibniz Association.

Institutional Review Board Statement

Not applicable.

Informed Consent Statement

Not applicable.

Data Availability Statement

The datasets generated and/or analyzed during the current study are available in the NBCI repository, http://www.ncbi.nlm.nih.gov/bioproject/680548 (accessed on 10 June 2022).

Acknowledgments

The authors thank Jesse Poland for performing the GBS data and Sarah Blecha for extracting the DNA.

Conflicts of Interest

The authors declare no conflict of interest.

References

  1. Ward, B.P.; Brown-Guedira, G.; Kolb, F.L.; Van Sanford, D.A.; Tyagi, P.; Sneller, C.H.; Griffey, C.A. Genome-Wide Association Studies for Yield-Related Traits in Soft Red Winter Wheat Grown in Virginia. PLoS ONE 2019, 14, e0208217. [Google Scholar] [CrossRef] [PubMed] [Green Version]
  2. Mondal, S.; Sallam, A.; Sehgal, D.; Sukumaran, S.; Farhad, M.; Navaneetha Krishnan, J.; Kumar, U.; Biswal, A. Advances in Breeding for Abiotic Stress Tolerance in Wheat. In Genomic Designing for Abiotic Stress Resistant Cereal Crops; Springer: Cham, Switzerland, 2021; pp. 71–103. [Google Scholar]
  3. Mourad, A.M.I.; Alomari, D.Z.; Alqudah, A.M.; Sallam, A.; Salem, K.F.M. Recent Advances in Wheat (Triticum Spp.) Breeding. In Advances in Plant Breeding Strategies: Cereals; Springer: Cham, Switzerland, 2019; Volume 5. [Google Scholar] [CrossRef]
  4. Sun, C.; Zhang, F.; Yan, X.; Zhang, X.; Dong, Z.; Cui, D.; Chen, F. Genome-Wide Association Study for 13 Agronomic Traits Reveals Distribution of Superior Alleles in Bread Wheat from the Yellow and Huai Valley of China. Plant Biotechnol. J. 2017, 15, 953–969. [Google Scholar] [CrossRef] [PubMed] [Green Version]
  5. Sallam, A.; Hashad, M.; Hamed, E.-S.; Omara, M. Genetic Variation of Stem Characters in Wheat and Their Relation to Kernel Weight under Drought and Heat Stresses. J. Crop Sci. Biotechnol. 2015, 18, 137–146. [Google Scholar] [CrossRef]
  6. Mourad, A.M.I.; Belamkar, V.; Baenziger, P.S. Molecular Genetic Analysis of Spring Wheat Core Collection Using Genetic Diversity, Population Structure, and Linkage Disequilibrium. BMC Genom. 2020, 21, 434. [Google Scholar] [CrossRef]
  7. Li, F.; Wen, W.; Liu, J.; Zhang, Y.; Cao, S.; He, Z.; Rasheed, A.; Jin, H.; Zhang, C.; Yan, J.; et al. Genetic Architecture of Grain Yield in Bread Wheat Based on Genome-Wide Association Studies. BMC Plant Biol. 2019, 19, 168. [Google Scholar] [CrossRef] [PubMed]
  8. Nadolska-Orczyk, A.; Rajchel, I.K.; Orczyk, W.; Gasparis, S. Major Genes Determining Yield-Related Traits in Wheat and Barley. Theor. Appl. Genet. 2017, 130, 1081–1098. [Google Scholar] [CrossRef] [Green Version]
  9. Li, F.; Wen, W.; He, Z.; Liu, J.; Jin, H.; Cao, S.; Geng, H.; Yan, J.; Zhang, P.; Wan, Y.; et al. Genome-Wide Linkage Mapping of Yield-Related Traits in Three Chinese Bread Wheat Populations Using High-Density SNP Markers. Theor. Appl. Genet. 2018, 131, 1903–1924. [Google Scholar] [CrossRef]
  10. Rasheed, A.; Wen, W.; Gao, F.; Zhai, S.; Jin, H.; Liu, J.; Guo, Q.; Zhang, Y.; Dreisigacker, S.; Xia, X.; et al. Development and Validation of KASP Assays for Genes Underpinning Key Economic Traits in Bread Wheat. Theor. Appl. Genet. 2016, 129, 1843–1860. [Google Scholar] [CrossRef]
  11. Gao, F.; Wen, W.; Liu, J.; Rasheed, A.; Yin, G.; Xia, X.; Wu, X.; He, Z. Genome-Wide Linkage Mapping of QTL for Yield Components, Plant Height and Yield-Related Physiological Traits in the Chinese Wheat Cross Zhou 8425B/Chinese Spring. Front. Plant Sci. 2015, 6, 1099. [Google Scholar] [CrossRef] [Green Version]
  12. Cuthbert, J.L.; Somers, D.J.; Brûlé-Babel, A.L.; Brown, P.D.; Crow, G.H.; Liu, J.; He, Z.; Rasheed, A.; Wen, W.; Yan, J.; et al. A Multiparental Cross Population for Mapping QTL for Agronomic Traits in Durum Wheat (T Riticum Turgidum Ssp. Durum). Theor. Appl. Genet. 2016, 130, 803–807. [Google Scholar]
  13. Cui, F.; Zhao, C.; Ding, A.; Li, J.; Wang, L.; Li, X.; Bao, Y.; Li, J.; Wang, H. Construction of an Integrative Linkage Map and QTL Mapping of Grain Yield-Related Traits Using Three Related Wheat RIL Populations. Theor. Appl. Genet. 2014, 127, 659–675. [Google Scholar] [CrossRef] [PubMed]
  14. Cui, F.; Li, J.; Ding, A.; Zhao, C.; Wang, L.; Wang, X.; Li, S.; Bao, Y.; Li, X.; Feng, D.; et al. Conditional QTL Mapping for Plant Height with Respect to the Length of the Spike and Internode in Two Mapping Populations of Wheat. Theor. Appl. Genet. 2011, 122, 1517–1536. [Google Scholar] [CrossRef] [PubMed]
  15. Buerstmayr, H.; Ban, T.; Anderson, J.A. QTL Mapping and Marker-Assisted Selection for Fusarium Head Blight Resistance in Wheat: A Review. Plant Breed. 2009, 128, 1–26. [Google Scholar] [CrossRef]
  16. Collard, B.C.Y.; Jahufer, M.Z.Z.; Brouwer, J.B.; Pang, E.C.K. An Introduction to Markers, Quantitative Trait Loci (QTL) Mapping and Marker-Assisted Selection for Crop Improvement: The Basic Concepts. Euphytica 2005, 142, 169–196. [Google Scholar] [CrossRef]
  17. Brondani, C.; Rangel, P.; Brondani, R.; Ferreira, M. QTL Mapping, and Introgression of Yield-Related Traits from Oryza Glumaepatula to Cultivated Rice (Oryza Sativa) Using Microsatellite Markers. Theor. Appl. Genet. 2002, 104, 1192–1203. [Google Scholar] [CrossRef] [PubMed]
  18. Eltaher, S.; Baenziger, P.S.; Belamkar, V.; Emara, H.A.; Nower, A.A.; Salem, K.F.M.; Alqudah, A.M.; Sallam, A. GWAS Revealed Effect of Genotype × Environment Interactions for Grain Yield of Nebraska Winter Wheat. BMC Genom. 2021, 22, 2. [Google Scholar] [CrossRef]
  19. Sallam, A.; Amro, A.; Elakhdar, A.; Dawood, M.F.A.; Moursi, Y.S.; Baenziger, P.S. Marker--Trait Association for Grain Weight of Spring Barley in Well-Watered and Drought Environments. Mol. Biol. Rep. 2019, 46, 2907–2918. [Google Scholar] [CrossRef] [PubMed]
  20. Huang, C.; Nie, X.; Shen, C.; You, C.; Li, W.; Zhao, W.; Zhang, X.; Lin, Z. Population Structure and Genetic Basis of the Agronomic Traits of Upland Cotton in China Revealed by a Genome-Wide Association Study Using High-Density SNP S. Plant Biotechnol. J. 2017, 15, 1374–1386. [Google Scholar] [CrossRef]
  21. Sallam, A.; Eltaher, S.; Alqudah, A.M.; Belamkar, V.; Baenziger, P.S. Combined GWAS and QTL Mapping Revealed Candidate Genes and SNP Network Controlling Recovery and Tolerance Traits Associated with Drought Tolerance in Seedling Winter Wheat. Genomics 2022, 114, 110358. [Google Scholar] [CrossRef]
  22. Scherer, A.; Christensen, G.B. Concepts and Relevance of Genome-Wide Association Studies. Sci. Prog. 2016, 99, 59–67. [Google Scholar] [CrossRef]
  23. Bajgain, P.; Zhang, X.; Anderson, J.A. Genome-Wide Association Study of Yield Component Traits in Intermediate Wheatgrass and Implications in Genomic Selection and Breeding. G3 Genes Genomes Genet. 2019, 9, 2429–2439. [Google Scholar] [CrossRef] [PubMed] [Green Version]
  24. Gahlaut, V.; Jaiswal, V.; Singh, S.; Balyan, H.S.; Gupta, P.K. Multi-Locus Genome Wide Association Mapping for Yield and Its Contributing Traits in Hexaploid Wheat under Different Water Regimes. Sci. Rep. 2019, 9, 19486. [Google Scholar] [CrossRef]
  25. Milner, S.G.; Maccaferri, M.; Huang, B.E.; Mantovani, P.; Massi, A.; Frascaroli, E.; Tuberosa, R.; Salvi, S. A Multiparental Cross Population for Mapping QTL for Agronomic Traits in Durum Wheat (T Riticum Turgidum Ssp. Durum). Plant Biotechnol. J. 2016, 14, 735–748. [Google Scholar] [CrossRef] [Green Version]
  26. Jia, H.; Wan, H.; Yang, S.; Zhang, Z.; Kong, Z.; Xue, S.; Zhang, L.; Ma, Z. Genetic Dissection of Yield-Related Traits in a Recombinant Inbred Line Population Created Using a Key Breeding Parent in China’s Wheat Breeding. Theor. Appl. Genet. 2013, 126, 2123–2139. [Google Scholar] [CrossRef]
  27. Azadi, A.; Mardi, M.; Hervan, E.M.; Mohammadi, S.A.; Moradi, F.; Tabatabaee, M.T.; Pirseyedi, S.M.; Ebrahimi, M.; Fayaz, F.; Kazemi, M.; et al. QTL Mapping of Yield and Yield Components under Normal and Salt-Stress Conditions in Bread Wheat (Triticum Aestivum L.). Plant Mol. Biol. Report. 2015, 33, 102–120. [Google Scholar] [CrossRef]
  28. Cuthbert, J.L.; Somers, D.J.; Brûlé-Babel, A.L.; Brown, P.D.; Crow, G.H. Molecular Mapping of Quantitative Trait Loci for Yield and Yield Components in Spring Wheat (Triticum Aestivum L.). Theor. Appl. Genet. 2008, 117, 595–608. [Google Scholar] [CrossRef] [PubMed]
  29. Eltaher, S.; Sallam, A.; Belamkar, V.; Emara, H.A.; Nower, A.A.; Salem, K.F.M.; Poland, J.; Baenziger, P.S. Genetic Diversity and Population Structure of F3:6 Nebraska Winter Wheat Genotypes Using Genotyping-By-Sequencing. Front. Genet. 2018, 9, 76. [Google Scholar] [CrossRef]
  30. Elshire, R.J.; Glaubitz, J.C.; Sun, Q.; Poland, J.A.; Kawamoto, K.; Buckler, E.S.; Mitchell, S.E. A Robust, Simple Genotyping-by-Sequencing (GBS) Approach for High Diversity Species. PLoS ONE 2011, 6, e19379. [Google Scholar] [CrossRef] [Green Version]
  31. Poland, J.A.; Brown, P.J.; Sorrells, M.E.; Jannink, J.-L. Development of High-Density Genetic Maps for Barley and Wheat Using a Novel Two-Enzyme Genotyping-by-Sequencing Approach. PLoS ONE 2012, 7, e32253. [Google Scholar] [CrossRef] [Green Version]
  32. Poland, J.; Endelman, J.; Dawson, J.; Rutkoski, J.; Wu, S.; Manes, Y.; Dreisigacker, S.; Crossa, J.; Sánchez-Villeda, H.; Sorrells, M.; et al. Genomic Selection in Wheat Breeding Using Genotyping-by-Sequencing. Plant Genome 2012, 5, 103–113. [Google Scholar] [CrossRef] [Green Version]
  33. Lorenz, A.J.; Hamblin, M.T.; Jannink, J.-L. Performance of Single Nucleotide Polymorphisms versus Haplotypes for Genome-Wide Association Analysis in Barley. PLoS ONE 2010, 5, e14079. [Google Scholar] [CrossRef] [PubMed] [Green Version]
  34. Chia, J.-M.; Song, C.; Bradbury, P.J.; Costich, D.; De Leon, N.; Doebley, J.; Elshire, R.J.; Gaut, B.; Geller, L.; Glaubitz, J.C.; et al. Maize HapMap2 Identifies Extant Variation from a Genome in Flux. Nat. Genet. 2012, 44, 803–807. [Google Scholar] [CrossRef] [PubMed]
  35. Thomson, M.J. High-Throughput SNP Genotyping to Accelerate Crop Improvement. Plant Breed. Biotechnol. 2014, 2, 195–212. [Google Scholar] [CrossRef]
  36. Eltaher, S.; Mourad, A.M.I.; Baenziger, P.S.; Wegulo, S.; Belamkar, V.; Sallam, A. Identification and Validation of High LD Hotspot Genomic Regions Harboring Stem Rust Resistant Genes on 1B, 2A (Sr38), and 7B Chromosomes in Wheat. Front. Genet. 2021, 1875. [Google Scholar] [CrossRef] [PubMed]
  37. Bradbury, P.J.; Zhang, Z.; Kroon, D.E.; Casstevens, T.M.; Ramdoss, Y.; Buckler, E.S. TASSEL: Software for Association Mapping of Complex Traits in Diverse Samples. Bioinformatics 2007, 23, 2633–2635. [Google Scholar] [CrossRef]
  38. Zhang, X.; Pérez-Rodríguez, P.; Semagn, K.; Beyene, Y.; Babu, R.; López-Cruz, M.A.; San Vicente, F.; Olsen, M.; Buckler, E.; Jannink, J.-L.; et al. Genomic Prediction in Biparental Tropical Maize Populations in Water-Stressed and Well-Watered Environments Using Low-Density and GBS SNPs. Heredity 2015, 114, 291–299. [Google Scholar] [CrossRef] [PubMed] [Green Version]
  39. Belamkar, V.; Guttieri, M.J.; Hussain, W.; Jarquin, D.; El-basyoni, I.; Poland, J.; Lorenz, A.J.; Baenziger, P.S. Genomic Selection in Preliminary Yield Trials in a Winter Wheat Breeding Program. G3 Genes Genomes Genet. 2018, 8, 2735–2747. [Google Scholar] [CrossRef] [PubMed] [Green Version]
  40. Hussain, W.; Baenziger, P.S.; Belamkar, V.; Guttieri, M.J.; Venegas, J.P.; Easterly, A.; Sallam, A.; Poland, J. Genotyping-by-Sequencing Derived High-Density Linkage Map and Its Application to QTL Mapping of Flag Leaf Traits in Bread Wheat. Sci. Rep. 2017, 7, 16394. [Google Scholar] [CrossRef]
  41. Alqudaha, A.M.; Sallamb, A.; Baenzigerc, P.S.; Börnera, A. GWAS: Fast-Forwarding Gene Identification in Temperate Cereals: Barley as a Case Study-A Review. J. Adv. Res. 2019, 22, 119–135. [Google Scholar] [CrossRef]
  42. Mourad, A.M.I.; Sallam, A.; Belamkar, V.; Wegulo, S.; Bowden, R.; Jin, Y.; Mahdy, E.; Bakheit, B.; El-Wafaa, A.A.; Poland, J.; et al. Genome-Wide Association Study for Identification and Validation of Novel SNP Markers for Sr6 Stem Rust Resistance Gene in Bread Wheat. Front. Plant Sci. 2018, 9, 380. [Google Scholar] [CrossRef] [Green Version]
  43. Mohammadi, R.; Haghparast, R.; Amri, A.; Ceccarelli, S. Yield Stability of Rainfed Durum Wheat and GGE Biplot Analysis of Multi-Environment Trials. Crop Pasture Sci. 2009, 61, 92–101. [Google Scholar] [CrossRef]
  44. Mohammadi, R.; Amri, A. Genotype × Environment Interaction and Genetic Improvement for Yield and Yield Stability of Rainfed Durum Wheat in Iran. Euphytica 2013, 192, 227–249. [Google Scholar] [CrossRef]
  45. Mehari, M.; Tesfay, M.; Yirga, H.; Mesele, A.; Abebe, T.; Workineh, A.; Amare, B. GGE Biplot Analysis of Genotype-by-Environment Interaction and Grain Yield Stability of Bread Wheat Genotypes in South Tigray, Ethiopia. Commun. Biometry Crop Sci. 2015, 10, 17–26. [Google Scholar]
  46. Matlala, M.; Shimelis, H.; Mashilo, J. Genotype-by-Environment Interaction of Grain Yield among Candidate Dryland Wheat Genotypes. South Afr. J. Plant Soil 2019, 36, 299–306. [Google Scholar] [CrossRef]
  47. Agrama, H.A.; Eizenga, G.C.; Yan, W. Association Mapping of Yield, and Its Components in Rice Cultivars. Mol. Breed. 2007, 19, 341–356. [Google Scholar] [CrossRef]
  48. Tsilo, T.J.; Hareland, G.A.; Simsek, S.; Chao, S.; Anderson, J.A. Genome Mapping of Kernel Characteristics in Hard Red Spring Wheat Breeding Lines. Theor. Appl. Genet. 2010, 121, 717–730. [Google Scholar] [CrossRef]
  49. Edae, E.A.; Byrne, P.F.; Haley, S.D.; Lopes, M.S.; Reynolds, M.P. Genome-Wide Association Mapping of Yield and Yield Components of Spring Wheat under Contrasting Moisture Regimes. Theor. Appl. Genet. 2014, 127, 791–807. [Google Scholar] [CrossRef]
  50. Bhusal, N.; Sarial, A.K.; Sharma, P.; Sareen, S. Mapping QTLs for Grain Yield Components in Wheat under Heat Stress. PLoS ONE 2017, 12, e0189594. [Google Scholar] [CrossRef] [Green Version]
  51. Liu, Y.; Bowman, B.C.; Hu, Y.-G.; Liang, X.; Zhao, W.; Wheeler, J.; Klassen, N.; Bockelman, H.; Bonman, J.M.; Chen, J. Evaluation of Agronomic Traits and Drought Tolerance of Winter Wheat Accessions from the USDA-ARS National Small Grains Collection. Agronomy 2017, 7, 51. [Google Scholar] [CrossRef]
  52. Mwadzingeni, L.; Shimelis, H.; Rees, D.J.G.; Tsilo, T.J. Genome-Wide Association Analysis of Agronomic Traits in Wheat under Drought-Stressed and Non-Stressed Conditions. PLoS ONE 2017, 12, e0171692. [Google Scholar] [CrossRef] [Green Version]
  53. Sallam, A.; Alqudah, A.M.; Dawood, M.F.A.; Baenziger, P.S.; Börner, A. Drought Stress Tolerance in Wheat and Barley: Advances in Physiology, Breeding and Genetics Research. Int. J. Mol. Sci. 2019, 20, 3137. [Google Scholar] [CrossRef] [PubMed] [Green Version]
  54. Dawood, M.F.A.; Moursi, Y.S.; Amro, A.; Baenziger, P.S.; Sallam, A. Investigation of Heat-Induced Changes in the Grain Yield and Grains Metabolites, with Molecular Insights on the Candidate Genes in Barley. Agronomy 2020, 10, 1730. [Google Scholar] [CrossRef]
  55. Liu, G.; Jia, L.; Lu, L.; Qin, D.; Zhang, J.; Guan, P.; Ni, Z.; Yao, Y.; Sun, Q.; Peng, H. Mapping QTLs of Yield-Related Traits Using RIL Population Derived from Common Wheat and Tibetan Semi-Wild Wheat. Theor. Appl. Genet. 2014, 127, 2415–2432. [Google Scholar] [CrossRef] [PubMed]
  56. Zanke, C.D.; Ling, J.; Plieske, J.; Kollers, S.; Ebmeyer, E.; Korzun, V.; Argillier, O.; Stiewe, G.; Hinze, M.; Neumann, K.; et al. Whole Genome Association Mapping of Plant Height in Winter Wheat (Triticum Aestivum L.). PLoS ONE 2014, 9, e113287. [Google Scholar]
  57. Zanke, C.D.; Ling, J.; Plieske, J.; Kollers, S.; Ebmeyer, E.; Korzun, V.; Argillier, O.; Stiewe, G.; Hinze, M.; Neumann, F.; et al. Analysis of Main Effect QTL for Thousand Grain Weight in European Winter Wheat (Triticum Aestivum L.) by Genome-Wide Association Mapping. Front. Plant Sci. 2015, 6, 644. [Google Scholar] [CrossRef] [PubMed] [Green Version]
  58. Chen, G.; Zhang, H.; Deng, Z.; Wu, R.; Li, D.; Wang, M.; Tian, J. Genome-Wide Association Study for Kernel Weight-Related Traits Using SNPs in a Chinese Winter Wheat Population. Euphytica 2016, 212, 173–185. [Google Scholar] [CrossRef]
  59. Lopes, M.S.; Reynolds, M.P.; McIntyre, C.L.; Mathews, K.L.; Kamali, M.R.J.; Mossad, M.; Feltaous, Y.; Tahir, I.S.A.; Chatrath, R.; Ogbonnaya, F.; et al. QTL for Yield and Associated Traits in the Seri/Babax Population Grown across Several Environments in Mexico, in the West Asia, North Africa, and South Asia Regions. Theor. Appl. Genet. 2013, 126, 971–984. [Google Scholar] [CrossRef]
  60. Wang, S.-X.; Zhu, Y.-L.; Zhang, D.-X.; Shao, H.; Liu, P.; Hu, J.-B.; Zhang, H.; Zhang, H.-P.; Chang, C.; Lu, J.; et al. Genome-Wide Association Study for Grain Yield and Related Traits in Elite Wheat Varieties and Advanced Lines Using SNP Markers. PLoS ONE 2017, 12, e0188662. [Google Scholar] [CrossRef] [Green Version]
  61. Narasimhamoorthy, B.; Gill, B.S.; Fritz, A.K.; Nelson, J.C.; Brown-Guedira, G.L. Advanced Backcross QTL Analysis of a Hard Winter Wheat × Synthetic Wheat Population. Theor. Appl. Genet. 2006, 112, 787–796. [Google Scholar] [CrossRef]
  62. Mago, R.; Tabe, L.; McIntosh, R.A.; Pretorius, Z.; Kota, R.; Paux, E.; Wicker, T.; Breen, J.; Lagudah, E.S.; Ellis, J.G.; et al. A Multiple Resistance Locus on Chromosome Arm 3BS in Wheat Confers Resistance to Stem Rust (Sr2), Leaf Rust (Lr27) and Powdery Mildew. Theor. Appl. Genet. 2011, 123, 615–623. [Google Scholar] [CrossRef]
  63. Bednarek, J.; Boulaflous, A.; Girousse, C.; Ravel, C.; Tassy, C.; Barret, P.; Bouzidi, M.F.; Mouzeyar, S. Down-Regulation of the TaGW2 Gene by RNA Interference Results in Decreased Grain Size and Weight in Wheat. J. Exp. Bot. 2012, 63, 5945–5955. [Google Scholar] [CrossRef] [PubMed] [Green Version]
  64. Ma, D.; Yan, J.; He, Z.; Wu, L.; Xia, X. Characterization of a Cell Wall Invertase Gene TaCwi-A1 on Common Wheat Chromosome 2A and Development of Functional Markers. Mol. Breed. 2012, 29, 43–52. [Google Scholar] [CrossRef]
  65. Hou, J.; Jiang, Q.; Hao, C.; Wang, Y.; Zhang, H.; Zhang, X. Global Selection on Sucrose Synthase Haplotypes during a Century of Wheat Breeding. Plant Physiol. 2014, 164, 1918–1929. [Google Scholar] [CrossRef] [PubMed] [Green Version]
  66. Laido, G.; Marone, D.; Russo, M.A.; Colecchia, S.A.; Mastrangelo, A.M.; De Vita, P.; Papa, R. Linkage Disequilibrium and Genome-Wide Association Mapping in Tetraploid Wheat (Triticum Turgidum L.). PLoS ONE 2014, 9, e95211. [Google Scholar] [CrossRef] [Green Version]
  67. Dunwell, J.M.; Purvis, A.; Khuri, S. Cupins: The Most Functionally Diverse Protein Superfamily? Phytochemistry 2004, 65, 7–17. [Google Scholar] [CrossRef]
  68. Afzal, M.; Sielaff, M.; Curella, V.; Neerukonda, M.; El Hassouni, K.; Schuppan, D.; Tenzer, S.; Longin, C.F.H. Characterization of 150 Wheat Cultivars by LC-MS-Based Label-Free Quantitative Proteomics Unravels Possibilities to Design Wheat Better for Baking Quality and Human Health. Plants 2021, 10, 424. [Google Scholar] [CrossRef]
  69. Theobald, D.L.; Mitton-Fry, R.M.; Wuttke, D.S. Nucleic Acid Recognition by OB-Fold Proteins. Annu. Rev. Biophys. Biomol. Struct. 2003, 32, 115–133. [Google Scholar] [CrossRef] [Green Version]
  70. Li, Y.; Chen, X.; Chen, Z.; Cai, R.; Zhang, H.; Xiang, Y. Identification and Expression Analysis of BURP Domain-Containing Genes in Medicago Truncatula. Front. Plant Sci. 2016, 7, 485. [Google Scholar] [CrossRef] [Green Version]
  71. Ding, X.; Hou, X.; Xie, K.; Xiong, L. Genome-Wide Identification of BURP Domain-Containing Genes in Rice Reveals a Gene Family with Diverse Structures and Responses to Abiotic Stresses. Planta 2009, 230, 149–163. [Google Scholar] [CrossRef]
  72. Xu, H.; Li, Y.; Yan, Y.; Wang, K.; Gao, Y.; Hu, Y. Genome-Scale Identification of Soybean BURP Domain-Containing Genes and Their Expression under Stress Treatments. BMC Plant Biol. 2010, 10, 197. [Google Scholar] [CrossRef] [Green Version]
  73. Gan, D.; Jiang, H.; Zhang, J.; Zhao, Y.; Zhu, S.; Cheng, B. Genome-Wide Analysis of BURP Domain-Containing Genes in Maize and Sorghum. Mol. Biol. Rep. 2011, 38, 4553–4563. [Google Scholar] [CrossRef] [PubMed]
  74. Shao, Y.; Wei, G.; Wang, L.; Dong, Q.; Zhao, Y.; Chen, B.; Xiang, Y. Genome-Wide Analysis of BURP Domain-Containing Genes in Populus Trichocarpa. J. Integr. Plant Biol. 2011, 53, 743–755. [Google Scholar] [CrossRef] [PubMed]
  75. Tang, Y.; Cao, Y.; Qiu, J.; Gao, Z.; Ou, Z.; Wang, Y.; Zheng, Y. Expression of a Vacuole-Localized BURP-Domain Protein from Soybean (SALI3-2) Enhances Tolerance to Cadmium and Copper Stresses. PLoS ONE 2014, 9, e98830. [Google Scholar] [CrossRef] [PubMed]
  76. Bassüner, R.; Bäumlein, H.; Huth, A.; Jung, R.; Wobus, U.; Rapoport, T.A.; Saalbach, G.; Müntz, K. Abundant Embryonic MRNA in Field Bean (Vicia Faba L.) Codes for a New Class of Seed Proteins: CDNA Cloning and Characterization of the Primary Translation Product. Plant Mol. Biol. 1988, 11, 321–334. [Google Scholar] [CrossRef]
  77. Chesnokov, Y.V.; Meister, A.; Manteuffel, R. A Chimeric Green Fluorescent Protein Gene as an Embryogenic Marker in Transgenic Cell Culture of Nicotiana Plumbaginifolia Viv. Plant Sci. 2002, 162, 59–77. [Google Scholar] [CrossRef]
  78. Hanks, S.K.; Hunter, T. The Eukaryotic Protein Kinase Superfamily: Kinase (Catalytic) Domain Structure and Classification 1. FASEB J. 1995, 9, 576–596. [Google Scholar] [CrossRef]
  79. Stone, J.M.; Walker, J.C. Plant Protein Kinase Families and Signal Transduction. Plant Physiol. 1995, 108, 451–457. [Google Scholar] [CrossRef] [Green Version]
  80. Lehti-Shiu, M.D.; Shiu, S.-H. Diversity, Classification and Function of the Plant Protein Kinase Superfamily. Philos. Trans. R. Soc. B Biol. Sci. 2012, 367, 2619–2639. [Google Scholar]
  81. Saidi, Y.; Hearn, T.J.; Coates, J.C. Function and Evolution of ‘green’ GSK3/Shaggy-like Kinases. Trends Plant Sci. 2012, 17, 39–46. [Google Scholar] [CrossRef]
  82. Jelsema, C.L.; Morre, D.J.; Ruddat, M. Phospholipid Metabolism of Wheat Grains: Phospholipid Composition and Terminal Enzymes of the CDP-Amine Phospholipid Biosynthetic Pathway. Bot. Gaz. 1982, 143, 26–31. [Google Scholar] [CrossRef]
  83. González-Thuillier, I.; Pellny, T.K.; Tosi, P.; Mitchell, R.A.C.; Haslam, R.; Shewry, P.R. Accumulation and Deposition of Triacylglycerols in the Starchy Endosperm of Wheat Grain. J. Cereal Sci. 2021, 98, 103167. [Google Scholar] [CrossRef] [PubMed]
  84. Gonzalez-Thuillier, I.; Salt, L.; Chope, G.; Penson, S.; Skeggs, P.; Tosi, P.; Powers, S.J.; Ward, J.L.; Wilde, P.; Shewry, P.R.; et al. Distribution of Lipids in the Grain of Wheat (Cv. Hereward) Determined by Lipidomic Analysis of Milling and Pearling Fractions. J. Agric. Food Chem. 2015, 63, 10705–10716. [Google Scholar] [CrossRef] [PubMed] [Green Version]
  85. Brock, C.J. Wheat: Production Properties and Quality; Bushuk, W., Rasper, V.F., Eds.; Blackie/Chapman and Hall: London, UK, 1994; ISBN 0-7514-0181-1. [Google Scholar]
Figure 1. Histogram showing the distribution of all genotypes in each trait and box plot analysis illustrating the minimum, maximum, and mean for each trait: (a) spike weight (SW); (b) spike length (SL); (c) total number of spikelets per spike (TSNS); (d) total kernel number per spike (TKNS) and (e) thousand kernels weight (TKW).
Agronomy 12 01469 g001
Figure 2. Phenotypic correlating analysis among GY described by Eltaher et al. [18] and yield-related traits at the two environments.
Agronomy 12 01469 g002
Figure 3. Number of SNP markers for yield traits in each location (a); number of SNP markers associated with each trait in the two locations (b); common markers between the two locations (c).
Agronomy 12 01469 g003
Figure 4. Manhattan plots displaying SNP marker-trait association identified for yield components trait in GWAS using F3:6 Nebraska winter wheat. The significant line is the threshold of 5% Bonferroni correction (BC) in the Lincoln environment.
Agronomy 12 01469 g004
Figure 5. Manhattan plots displaying SNP marker-trait association identified for yield components trait in GWAS using F3:6 Nebraska winter wheat. The significant line is threshold of 5% bonferroni correction (BC) in North Platte environment.
Agronomy 12 01469 g005
Figure 6. The SNP marker S7D_485517060 located on chromosome 7D and annotated to TraesCS7D02G375100 which had effective value in the spike traits and turned on in the spike.
Agronomy 12 01469 g006
Table 1. Analysis of variance (Mean of Square and Properties of significance for F value) and Broad sense heritability for yield-related traits in Lincoln and North Platte.
SourceSWSLTNSNTKNSTKW
Mean of SquarePr (>F)Mean of SquarePr (>F)Mean of SquarePr (>F)Mean of SquarePr (>F)Mean of SquarePr (>F)
Genotypes0.55992.2 × 10−15 ***3.0792.2 × 10−15 ***6.552.2 × 10−15 ***118.862.2 × 10−15 ***16.8196.74 × 10−5 ***
Environment18.07890.0001648 ***76.1520.000273 ***671.281.09 × 10−5 ***788.510.00824 ***39.5894.57 × 10−5 ***
Iblock (Environment)0.43710.17970821.8890.2398889.870.0765996.450.2062626.3080.372
Genotypes × Environment0.583<2.2 × 10⁻¹⁵ ***2.9862.2 × 10−15 ***6.942.2 × 10−15 ***144.162.2 × 10−15 ***16.8366.46 × 10−5 ***
Residuals0.22 1.14 2.8 55 13.145
Heritability72.672.371.272.356.1
*** Significant at p-value < 0.001.
Table 2. Significant SNP loci, phenotypic variation (R2) and allele effect identified for yield-related traits in Lincoln.
TraitsNumber of SNPsLog 10 p ValueRange of R2Range of Allele Effect
MinMaxMin R2Max R2Min Allele EffectMax Allele Effect
SW83.63 × 10−73.27 × 10−55.758.870.19 A0.42 A
SL51.16 × 10−71.17 × 10−56.079.010.43 T0.62 T
TSNS103.63 × 10−71.01 × 10−56.038.690.64 T1.44 A
TKNS153.63 × 10−73.27 × 10−55.708.962.90 G6.71 A
TKW61.1 × 10−61.77 × 10−55.928.742.40 C2.89 C
Table 3. Significant SNP loci, phenotypic variation (R2) and allele effect identified for yield-related traits in North Platte.
TraitsNumber of SNPsLog 10 p ValueRange of R2Range of Allele Effect
MinMaxMin R2Max R2Min Allele EffectMax Allele Effect
SW53.72 × 10−72.02 × 10−56.918.260.40 C0.65 C
SL103.91 × 10−73.06 × 10−55.908.360.12 T0.25 A
TSNS93.72 × 10−72.67 × 10−55.458.030.46 G1.55 C
TKNS83.91 × 10−72.11 × 10−57.0013.361.85 A3.06 C
TKW91.58 × 10−71.88 × 10−59.5412.031.44 G2.84 T
Table 4. Common marker associated with yield-related traits using the mixed linear model (MLM) at the significance level of 5% bonferroni correction (BC 5%) using 11991 SNPs in Lincoln.
TraitsMarker IDChromosomePositionLog 10 p ValueR2Target AlleleAllele Effect
SWS5A_3808238215A3808238211.17 × 10−56.06T0.43
SL4.8 × 10−65.90.19
TNKS1.06 × 10−56.323.06
TSNS1.01 × 10−56.030.64
SWS5A_466281035A466281034.68 × 10−75.82A0.19
TNKS3.27 × 10−56.473.00
SWS5D_5483791435D5483791431.05 × 10−69.11T0.50
SL3.63 × 10−78.870.23
TNKS3.63 × 10−78.963.53
TSNS3.63 × 10−78.690.74
TNKSS6D_4695378656D4695378654.8 × 10−66.53A6.71
TSNS1.06 × 10−56.561.44
TNKSS7B_1641517317B1641517311.06 × 10−55.87C3.46
TSNS1.29 × 10−56.510.78
SWS7B_1655291017B1655291011.16 × 10−76.19C0.49
SL1.06 × 10−55.780.22
TNKS7.8 × 10−66.503.52
TSNS4.68 × 10−67.120.79
TNKSS7B_1810326307B1810326301.29 × 10−56.17A3.50
TSNS4.8 × 10−66.840.79
SWS7B_3297920717B3297920715.5 × 10−66.91A0.54
SL1.29 × 10−56.560.24
TNKS4.68 × 10−66.873.80
TSNS3.77 × 10−67.790.87
SWS7B_6074274217B6074274213.27 × 10−65.70G0.19
TNKS1.29 × 10−65.702.90
SWS7D_4855170607D4855170604.83 × 10−66.67T0.62
SL3.77 × 10−66.610.28
TNKS3.77 × 10−67.014.43
TSNS7.8 × 10−66.670.92
Table 5. Common marker associated with yield-related traits using the mixed linear model (MLM) at the significance level of 5% bonferroni correction (BC 5%) using 11991 SNPs in North Platte.
TraitMarker IDChromosomePositionLog 10 p ValueR2Target AlleleAllele Effect
SLS3B_607371823B607371823.06 × 10−57.00A0.12
TNKS2.11 × 10−57.001.85
SWS3B_623153823B623153823.91 × 10−78.36C0.15
SL1.96 × 10−68.260.40
TNKS3.91 × 10−713.361.85
TSNS3.3 × 10−68.031.55
SWS3B_623154073B623154072.5 × 10−78.36T0.15
SL2.02 × 10−68.260.40
TNKS2.5 × 10−69.232.23
TSNS1.96 × 10−68.030.55
SLS3B_641725773B641725772.11 × 10−56.01T0.12
TNKS1.61 × 10−58.631.90
TSNS2.02 × 10−56.310.48
SWS5D_617929845D617929841.09 × 10−56.17C0.21
SL3.72 × 10−77.960.65
TNKS1.09 × 10−59.093.06
TSNS3.72 × 10−76.850.83
SWS5D_624793675D624793672.02 × 10−56.91G0.58
TSNS2.52 × 10−55.450.71
SWS5D_723774295D723774291.61 × 10−55.96C0.21
SL3.3 × 10−67.770.64
TNKS1.61 × 10−58.633.06
TSNS2.02 × 10−56.180.80
SLS6B_6685176136B6685176131.61 × 10−55.90A0.20
TNKS2.11 × 10−57.563.05
TSNS2.09 × 10−55.750.77
SLS7A_6109930447A6109930442.11 × 10−56.00G0.12
TSNS2.67 × 10−55.870.46
SLS7B_7294412447B7294412442.11 × 10−56.62A0.25
TSNS1.87 × 10−56.600.94
Table 6. Repetitive SNPs and their chromosome revealed by GWAS identified in GY described by Eltaher et al. [18] and yield-related traits of the investigated environments (Lincoln and North Platte).
Grain YieldPolygenic MarkerChromosomeYield-Related Traits
LincolnS5D_5483791435D(SL, SW, TNKS and TSNS)
S6D_4695378656D(SW, TNKS and TSNS)
S7B_3297920717B(SL, SW, TNKS and TSNS)
S7D_4855170607D(SL, SW, TNKS and TSNS)
North PlattS3B_607371823B(SL and TNKS)
S3B_623153823B(SL, SW, TNKS and TSNS)
S3B_623154073B(SL, SW, TNKS and TSNS)
S3B_641725773B(SL TNKS and TSNS)
S5D_617929845D(SL, SW, TNKS and TSNS)
S5D_624793675D(SW and TSNS)
S5D_723774295D(SL, SW, TNKS and TSNS)
S7B_7294412447B(SL and TSNS)
Publisher’s Note: MDPI stays neutral with regard to jurisdictional claims in published maps and institutional affiliations.

