Article

Identification of SNP Markers Associated with Grain Quality Traits in a Barley Collection (Hordeum vulgare L.) Harvested in Kazakhstan

1
Laboratory of Molecular Genetics, Institute of Plant Biology and Biotechnology, Almaty 050040, Kazakhstan
2
Faculty of Biology and Biotechnology, Al-Farabi Kazakh National University, Almaty 050040, Kazakhstan
3
Karabalyk Agricultural Experimental Station, Nauchnoe 110908, Kazakhstan
4
Department of Plant Sciences and Plant Pathology, Montana State University, Bozeman, MT 59717, USA
5
Kazakh Research Institute of Agriculture and Plant Growing, Almalybak 040909, Kazakhstan
*
Author to whom correspondence should be addressed.
Agronomy 2022, 12(10), 2431; https://doi.org/10.3390/agronomy12102431
Submission received: 13 September 2022 / Revised: 29 September 2022 / Accepted: 6 October 2022 / Published: 7 October 2022
(This article belongs to the Special Issue Modern Biotechnologies and Improvement Breeding for Cereals Crop)

Abstract

:
Barley (Hordeum vulgare L.) is a cereal crop traditionally used in animal feed, malting, and food production. In this study, a collection of barley was analyzed according to key grain quality traits, including protein content (GPC), starch content (GSC), extractivity (EX), and grain test weight per liter (TWL). A genome-wide association study (GWAS) was conducted to identify the quantitative trait loci (QTLs) associated with GPC, GSC, EX, and TWL using a collection of 658 barley accessions from the USA and Kazakhstan. The collection was grown at three breeding organizations in Kazakhstan in 2010 and 2011 and genotyped using the 9K SNP Illumina chip. As a result, 18 marker-trait associations (MTAs) for GPC, 19 MTAs for GSC, 12 MTAs for EX, and 27 MTAs for TWL were detected, resulting in 30 identified QTLs. It was shown that the genetic locations of 25 of these 30 QTLs were in similar positions to the QTLs and genes previously reported in the scientific literature, suggesting that the 5 remaining QTLs are novel putative genetic factors for the studied grain quality traits. Five of the most significant SNP markers (p < 2.6 × 10⁻⁵) for the studied quality traits identified in the GWAS were used for the development of reliable and informative competitive allele-specific PCR (KASP) genotyping assays. The effectiveness of two assays (ipbb_hv_6 and ipbb_hv_128) was confirmed via validation in a separate collection of barley breeding lines grown in large field plots in northern Kazakhstan. Therefore, these KASP assays can be efficiently used in a marker-assisted selection of grain quality traits in barley breeding.

1. Introduction

Barley (Hordeum vulgare L.) is the fourth main cereal produced in the world after corn, wheat, and rice, with a total production of 157 million metric tons of grain in 2021/22 (www.statista.com, accessed on 12 July 2022). In Kazakhstan, barley is the second most important cereal after wheat (www.stat.gov.kz, accessed on 12 July 2022). Currently, Kazakhstan provides 0.8 million metric tons of barley to the international market, and the country is the seventh-largest exporter of this commodity in the world (www.statista.com, accessed on 12 July 2022).
Globally, the cultivation of barley is mostly oriented toward its production for use in animal feed (approximately 70%), malting (20–25%), and food (5–10%) [1]. The requirements for raw barley grain differ significantly depending on the usage. For example, a high grain protein content (GPC) would result in high food and feed quality. At the same time, in malting processes, a high GPC results in a slow and uneven water uptake during germination, lowering the amount of malt extract, clouding the final product, and reducing the shelf life of the resulting beer [2]. However, grain protein is needed for the yeast to grow during fermentation, which means that high-quality barley grain for malting should contain suitably low or moderate amounts of protein, with the optimum range being from 9.5% to 12.5% [3]. Previously, it was determined that two important homologs of the well-studied wheat gene NAM-B1HvNAM-1 (chromosome 6H) and HvNAM-2 (chromosome 2H)—are associated with GPC in barley [4,5]. The loss of functionality of the HvNAM-1 gene in barley is related to lower GPC [4]. However, it has been shown that HvNAM-1 and HvNAM-2 are not highly polymorphic and that their variations have a limited impact on GPC in barley [6]. Hence, this indicates the existence of other genetic factors regulating protein content in barley grain. The second quality trait important for malting is the grain starch content (GSC). Starch is the main constituent of barley grain, comprising 51–64% of the total grain weight [7,8]. The process of starch synthesis in the grain is multistage and regulated by several starch synthases, starch-branching enzymes, starch-debranching enzymes, and limited dextrinase [9]. The malting process includes the germination of barley grain. This process involves the hydrolysis of starch into small oligosaccharides and glucose [9]. The complete transformation of starch into glucose involves α-amylase (Amy), β-amylase (Bmy), isoamylase, limit dextrinase, and α-glucosidase [9]. Together with β-glucan, arabinoxylan, fructan, and other carbohydrates, during mashing, starch is converted into fermentable sugars (mostly glucose), which are used by yeast for fermentation [10]. GSC is closely linked with extractivity (EX), which is the number of organic components that can pass into an aqueous solution during the mashing process. EX is highly dependent on starch content since it is the main component of the endosperm, and a level of 80–82% is considered optimal for the beer-making industry [11]. The term EX is usually found in Russian-language literature, while in English-language literature, EX is simply a part of mashing. The three abovementioned traits are biochemical quality traits. Another trait that is important in barley production is grain test weight per liter (TWL) (or per hectoliter in some methods), which is a physical quality trait. It is a measure of a grain’s density and has traditionally been used as an indicator of quality for many years [12]. High grain density is also associated with a high starch content [13] and should be at the level of 600–750 g/L for malting [11]. Since both EX and TWL are directly linked to GSC, they are also regulated by genes involved in starch metabolism [13].
These four traits (GPC, GSC, EX, and TWL) are complex and controlled not only by the genotype but also by the environment and combination of genotype × environment interactions [14,15,16]. Nevertheless, the impact of genotype on GPC, GSC, EX, and TWL is significant, and the search for the genes that are associated with these traits is an important research direction in barley genetics. Most of the agronomically and economically important traits of cereals, including grain quality traits, are complex and controlled by quantitative trait loci (QTLs). By identifying the genome regions that control the traits of interest, it is easier to understand the overall genetic architecture of traits, which may help in grain quality–oriented breeding projects. QTLs can be mapped using two main approaches: linkage mapping and genome-wide association studies (GWAS). Linkage mapping is a powerful methodology for the identification of QTLs and has been effective in mapping QTLs for protein content [17,18,19], starch and fiber content [19], grain test weight [20,21], and other malting quality traits [22]. However, the efficiency of linkage mapping is limited by the genetic diversity of parental lines and by a small number of recombination events that occur per chromosome per generation [23]. GWAS, on the opposite, takes advantage of a large number of recombination events in natural populations with larger genetic diversity considering haplotype segregation and linkage disequilibrium (LD) [24]. With the development of new single nucleotide polymorphism (SNP) genotyping tools, such as Illumina [25] and Affymetrix [26] arrays, along with the ability to register higher allelic diversity and to consider ancestral recombination events in a population, GWAS is used now as a highly efficient tool in the exploration of marker-trait associations (MTAs) [27]. For instance, one of the most interesting examples of a large-scale barley GWAS was the Barley CAP (coordinated agricultural project), designed for association mapping within breeding program materials provided by public and private US breeding programs [28]. The project succeeded in the identification of 41 significant MTAs, including 10 novel associations for grain yield, plant height, heading date, grain plumpness, test weight, and protein content. GWAS has been successfully used worldwide for exploring associations with important barley grain quality traits, such as protein [5,29,30], starch [29,30,31,32], β-glucan [33], and test weight [34].
The main objectives of GWAS are the identification of causative factors for the trait and/or the determination of the genetic architecture of the trait. Recently, many barley germplasm populations, including accessions from different regions of the world [35,36,37,38,39], were genotyped using the 9K SNP (single nucleotide polymorphism) Illumina Infinium iSelect array [40]. This array contains 7842 SNPs, of which 6094 SNPs have known physical positions, and it was also used in the current study. SNPs are attractive for the marker-assisted selection (MAS) of barley because of their high abundance, widespread distribution throughout the barley genome, and high-throughput genotyping potential [25,41].
Several SNPs from the barley oligonucleotide pool assay (BOPA) [22,25] were reported to be associated with malting quality-related genes, such as Aglu (α-glucosidase), Bmy (β-amylase), CAT1 (catalase 1), and SS1 (sucrose synthase 1) [22]. An important advantage of SNP markers is the possibility of converting them into markers for KASP (competitive allele-specific PCR), which is a high-throughput assay for the rapid validation of QTLs and the selection of promising germplasms. Generally, KASP is a technology belonging to LGC Genomics (www.biosearchtech.com, accessed on 29 August 2022) and is based on competitive allele-specific PCR using two allele-specific forward primers and one common reverse primer for the bi-allelic scoring of SNPs. Using KASP genotyping, it is possible to rapidly determine accessions carrying alleles of interest for a particular SNP. Many KASP assays have been developed for wheat, including SNPs associated with the resistance to disease [42,43] and abiotic stresses [44,45], in addition to examination of yield-related [46,47] and grain quality [45] traits. As for barley, KASP assays have been developed for the Rph13 resistance gene (leaf rust) [48], greenbug resistance Rsg2 locus [49], barley mild mosaic virus (BaMMV) resistance gene rym15 [50], and seed dormancy regulatory genes Qsd1 and Qsd2 [51]. The official website of the National Institute of Agricultural Botany (NIAB) (www.niab.com/mas/species/type/3/Barley, accessed on 29 August 2022) provides information on 25 KASP assays for spike row number, grain pigmentation, seasonal type, plant height, lodicule disposition, and other important barley traits in addition to genotyping data for many barley accessions. As for the grain/malting quality traits of barley, KASP assays have been described for diastatic power [52], α-amylase activity [53], and β-glucan content [33], suggesting a shortage of studies on the identification of MTAs for other malting quality traits.
In Kazakhstan, barley is cultivated under varied environmental conditions. Therefore, it is important to identify specific QTLs for the yield components and grain quality traits in each of the main barley-growing environments. Previously, in Kazakhstan, several GWAS studies in barley collections were performed for the identification of QTLs associated with yield-related traits [54,55] and stem rust resistance [56]. Thus, the main purpose of this study was to identify QTLs associated with important grain quality traits based on GWAS. In particular, we focused on identifying QTLs controlling the four quality traits GPC, GSC, EX, and TWL, which play essential roles in malting, feed, and food production. In addition, we tested the significance of SNP markers in the identified MTAs by transforming them into KASP assays and assessing the importance of those markers using the grain quality traits of local breeding lines.

2. Materials and Methods

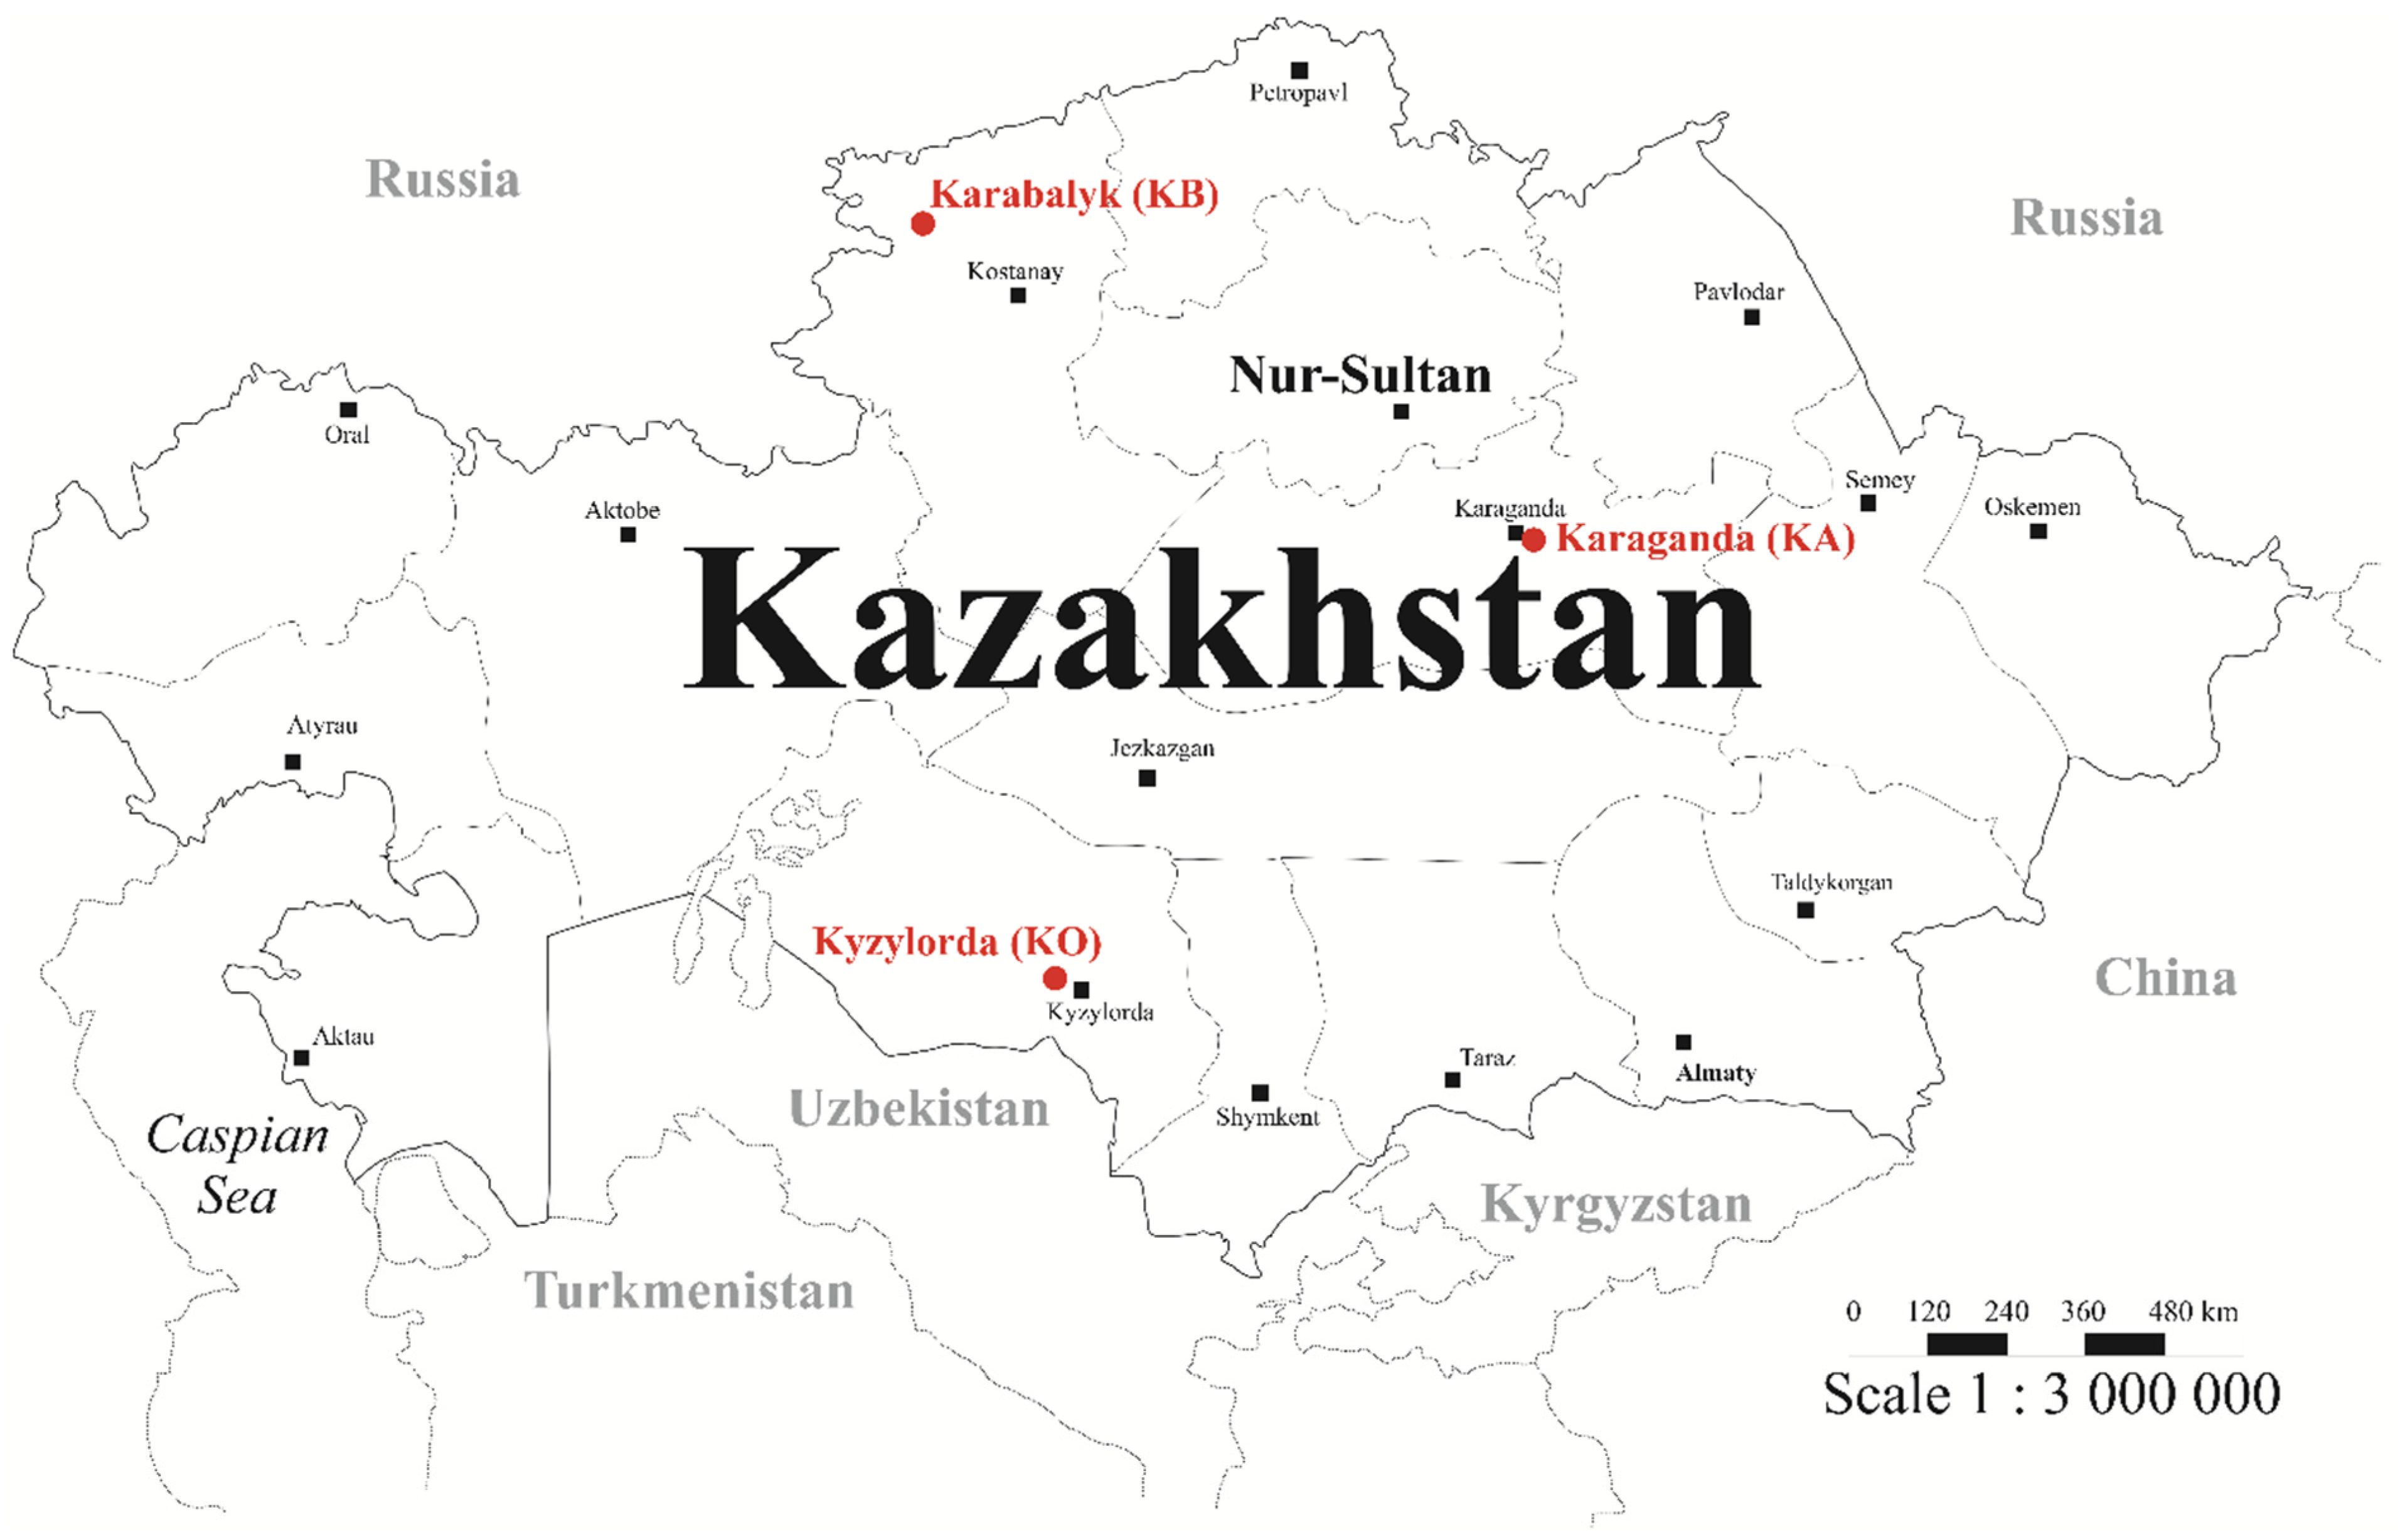
2.1. Plant Material and Grain Quality Traits Assessment

A collection of 658 spring barley accessions from Kazakhstan and the USA (Table S1 in Supplementary Materials) was grown at three agricultural stations in Kazakhstan in 2010 and 2011. The collection included two large groups of cultivars and breeding lines: two-row (2-R) barley from Kazakhstan (n = 102) and the USA (n = 279) and six-row (6-R) barley from the USA (n = 277). These two groups have been previously described and studied separately in a GWAS on yield-related traits [54,55]. The American part of the collection has also previously been analyzed in a GWAS [28].
The full collection was planted at three sites: Karabalyk Agricultural Experimental Station (KB, Karabalyk village, northern Kazakhstan, 53°51′07″ N 62°06′12″ E), Karaganda Agricultural Experimental Station (KA, Karaganda city, central Kazakhstan, 50°10′44″ N 72°44′26″ E), and I. Zhakhaev Kazakh Research Institute of Rice Growing (KO, Kyzylorda city, southern Kazakhstan, 44°49′50″ N 65°30′41″ E) (Figure 1). The weather, climate condition, and soil type at three experimental stations were previously described by Turuspekov et al. [57]. The experiment design was standardized for all the experimental stations during both seasons. Each accession was grown in the field in 1 m2 individual plots with 15 cm between neighboring plots. At all three experimental sites, barley accessions were grown under natural, uncontrolled conditions without any treatment (no fertilizers, herbicides, etc.). In the KB and KA fields, barley cultivation was performed under non-irrigated conditions, while at KO, it was carried out under irrigated conditions. The seeds of each accession were collected at all three experimental stations and sent to the laboratory of grain quality at the LLP “Kazakh Research Institute of Agriculture and Plant growing” (Almaty region, Kazakhstan). The grains were studied for four traits associated with grain quality: the raw protein content in the grain (GPC, %), the content of raw starch in the grain (GSC, %), grain extractivity (EX, %), and the grain test weight per liter (TWL, g/L). The GPC, GSC, and EX were measured using the NIRS DS2500 Grain Analyzer (FOSS, Hillerød, Denmark), with the calibration supplied by the manufacturer. TWL was determined according to the guide provided by Canadian Grain Commission (https://www.grainscanada.gc.ca/en/grain-quality/official-grain-grading-guide/01-determining-test-weight/determining-test-weight.html, accessed on 2 May 2022) and converted into g/L. For a better understanding of relations between quality- and yield-related traits, barley collection was also studied for the number of grains per spike (NGS, pcs.), thousand-grain weight (TGW, g), and grain yield per m2 (YM2, g/m2). The cleaned grains from one spike were counted for NGS; the grain from 1 m2 individual plot was weighed in g for YM2, and TGW was recorded in g by counting and weighing 1000 grains. A Pearson correlation analysis and determination of variance were performed using R statistical software (www.R-project.org, accessed on 12 July 2022). SPSS Statistics V. 26.0 software (www.ibm.com/products/spss-statistics, accessed on 12 July 2022) was used for the construction of histograms.
A collection of 34 promising barley lines (F8–11) from the industrial seed trials at KB was used for the validation of the KASP assays (Table S2). The collection was grown at the KB station using three randomized replicated 20 m blocks in 2020 and 2021. Furthermore, the same grain quality traits were studied in the harvested grain material.

2.2. Genotyping, Population Structure, and GWAS Analysis

Total DNA was extracted from individual 5-day-old barley seedlings using the cetyltrimethylammonium bromide (CTAB) protocol [58]. The Kazakhstan part of the collection was genotyped using the Illumina GoldenGate 9K SNP chip at the TraitGenetics company (TraitGenetics GmbH, Gatersleben, Germany). The genotyping data for the accessions from the USA (Barley CAP collection) provided by Dr. T. Blake were obtained through the Triticeae Toolbox (https://barley.triticeaetoolbox.org, accessed on 3 July 2022). The SNP genotyping results for the accessions from Kazakhstan and the USA were merged and filtered according to minor allele frequency (MAF) and SNP call rate. SNP with MAF < 0.05 and accessions with SNP call rate < 0.1 were removed. In total, 1920 SNP were selected for further analysis. The SNP positions of the Illumina iSelect2013 (cM) and barley 50k (bp) map sets for comparison with other QTLs and genes from the literature were obtained from the Triticeae toolbox.
The population structure was determined using three methods: an individual similarity matrix (kinship or K-matrix), visualized as a heat map; principal component analysis (PCA), resulting as a covariance matrix (Q-matrix); and clustering with a Bayesian Markov chain Monte Carlo (MCMC) approach based on admixture and correlated allele frequency models. The heat map and PCA plot were generated using the GAPIT package [59] for R statistical software. MCMC clustering was performed using STRUCTURE v2.3.4 software [60] with the K-value set from 1 to 10; the burn-in period was set to 100,000 and the number of MCMC replications after each burn to 100,000; and the iteration number was set to 3. For the determination of the optimal K-value, the ΔK method was used [61] in the STRUCTURE HARVESTER v0.6.94 web-based program [62]. In order to correct the effect of population substructure, both K and Q matrices were used in the mixed linear model (MLM) for the GWAS, also by GAPIT. p < 0.001 was chosen as the threshold to determine all SNP markers associated with grain quality traits. A false discovery rate (FDR) at p < 0.05 and Bonferroni correction at p < 2.6 × 10⁻⁵ were used to identify the most significant marker-trait associations (MTAs). LD decay plots were constructed using the R statistical software.

2.3. Development of KASP Assays and Their Assessment

The most significant SNPs in the MTAs identified for the studied grain quality traits were selected for the development of KASP assays (Table S3) for further validation using an additional set of promising barley accessions (Table S2). The SNP sequences were obtained from the Triticeae Toolbox, and two allele-specific primers (forward) and one common (reverse) primer were designed using a tool provided by LGC Genomics (www.biosearchtech.com, accessed on 12 July 2022) based on the SNP sequence. Sequence information for five KASP assays is provided in Table S3. The KASP assays were designed by LGC Genomics and carried out according to the manufacturer’s protocol. KlusterCaller software (https://www.biosearchtech.com, accessed on 12 July 2022) was used for the visualization of the KASP genotyping results. A t-test was applied to determine the significant differences between the means of the grain quality traits in two allelic groups for each KASP assay. t-tests were performed using R statistical software.

3. Results

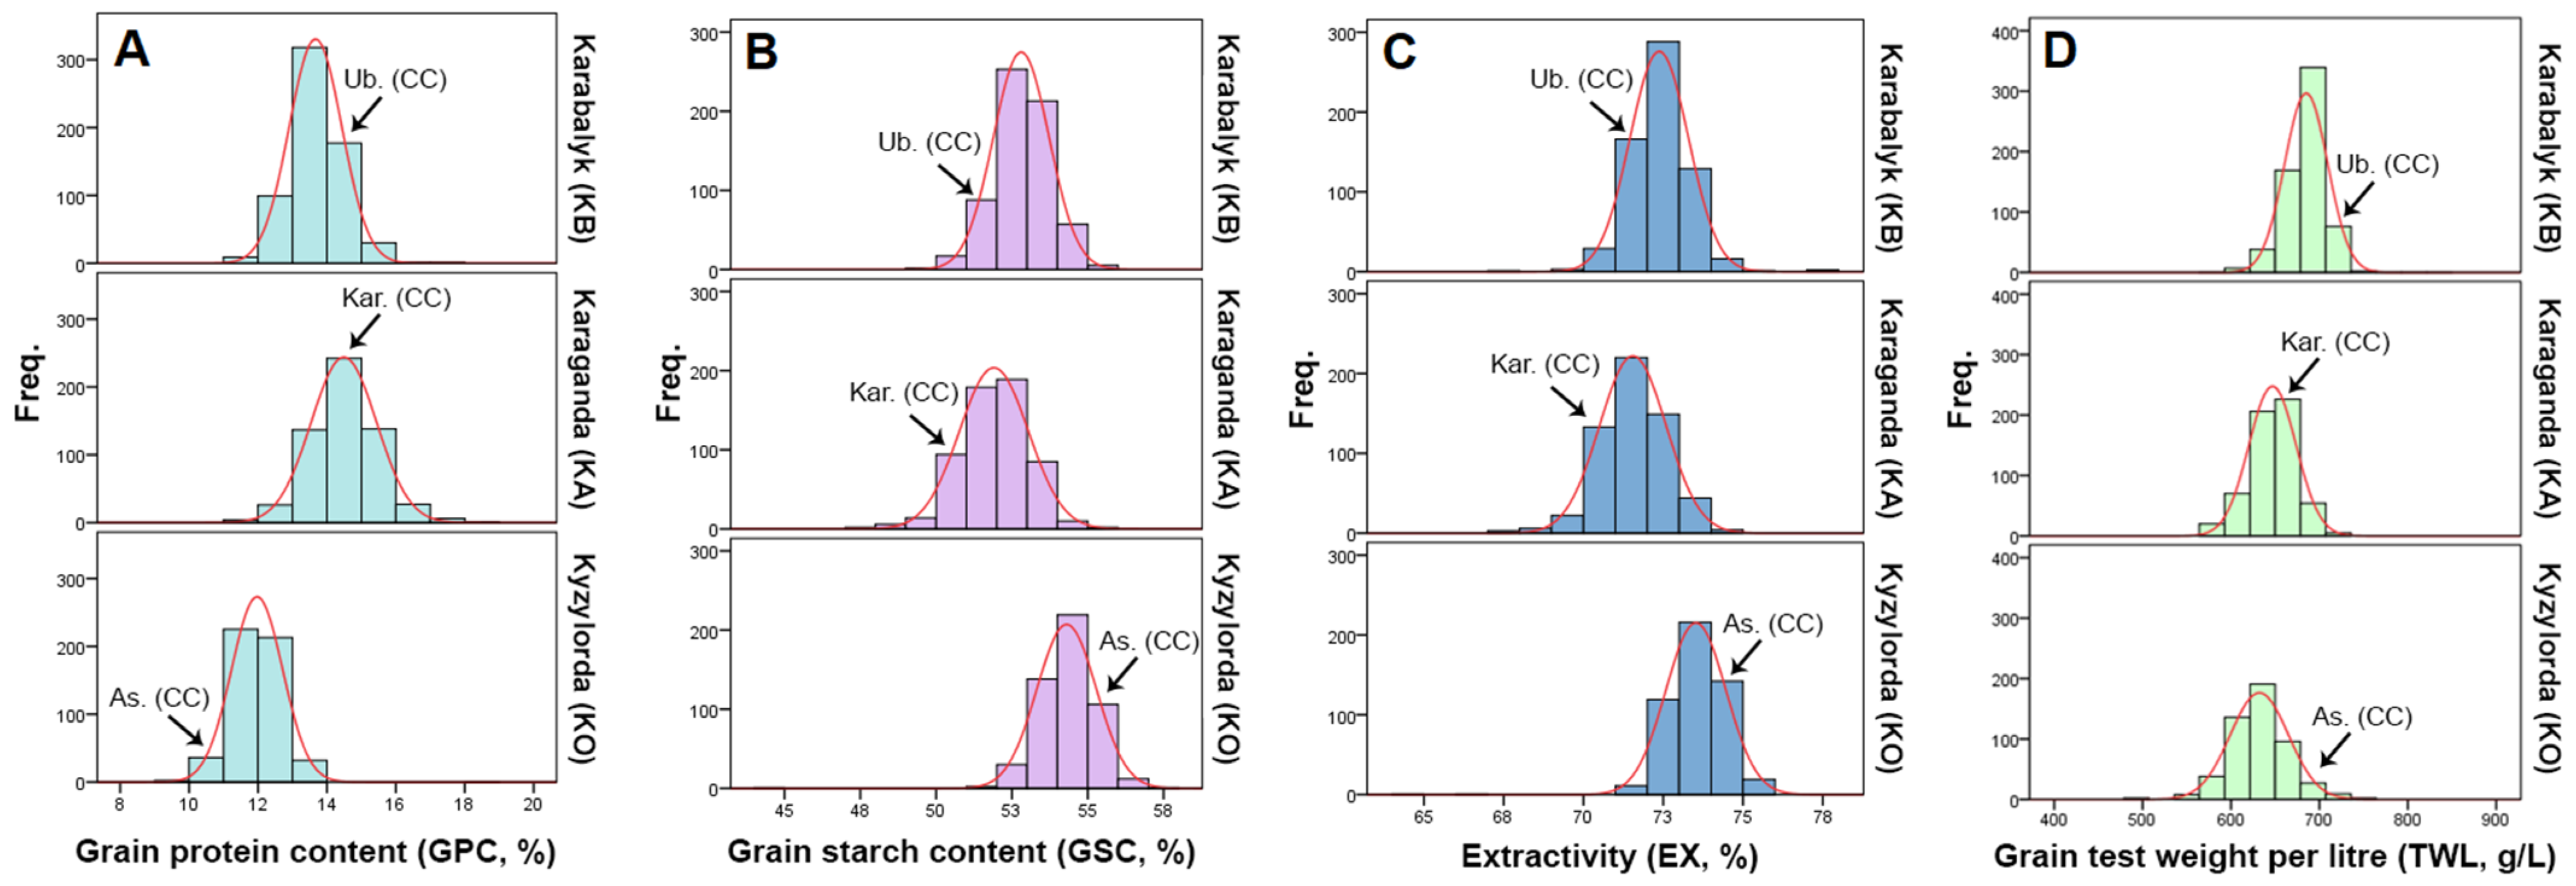
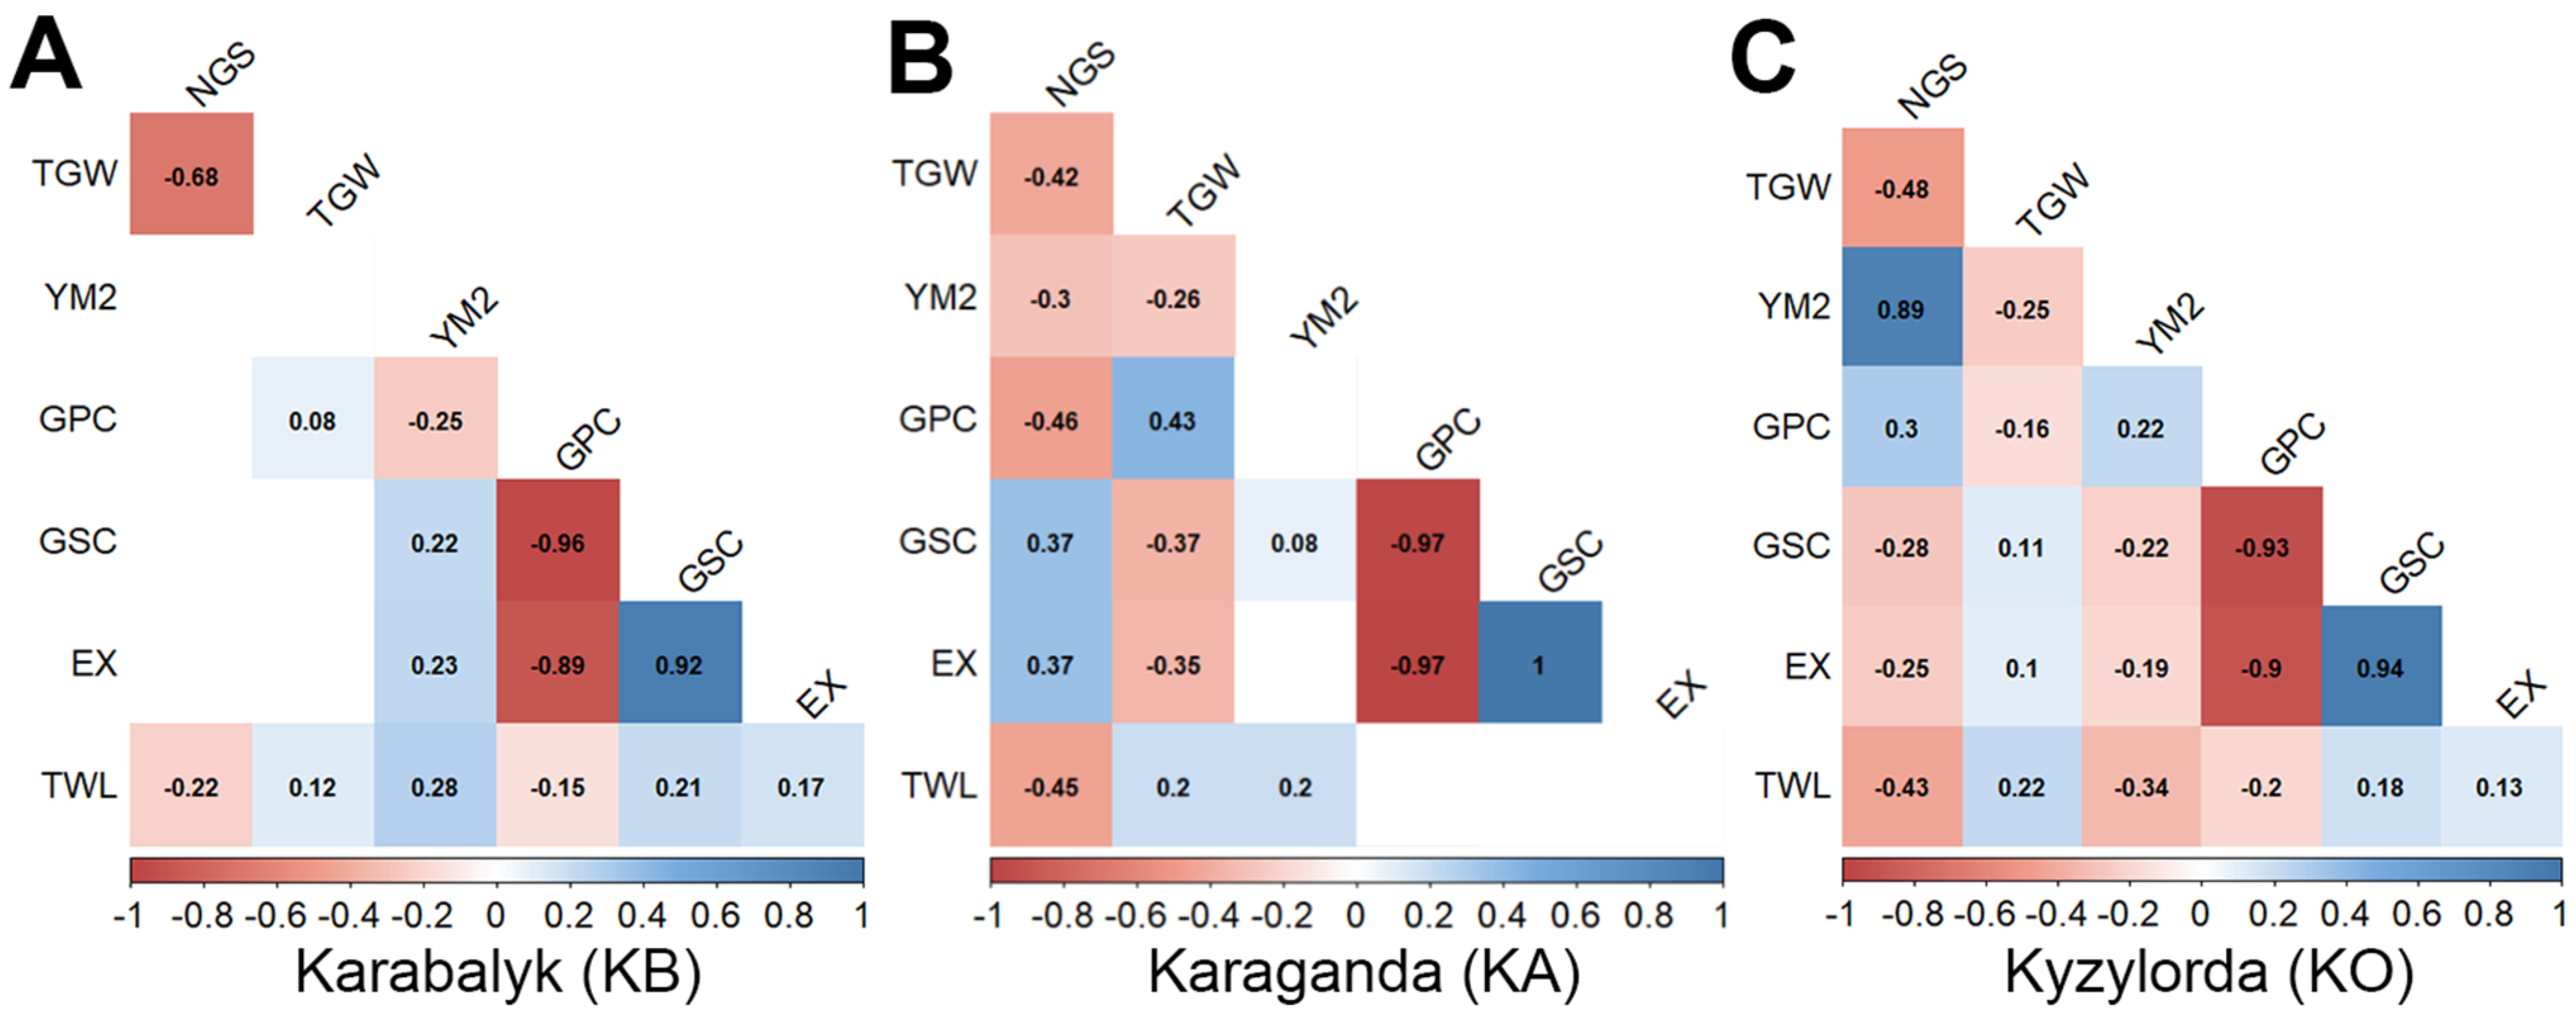
3.1. Variation in Grain Quality Traits in the Collection

A barley collection that included 658 accessions and checks cultivars for each region was grown at three agricultural stations in 2010 and 2011. The mean values of the two years for four grain-quality traits (GPC, GSC, EX, and TWL) obtained from each agricultural station were used in comparative analysis (Figure 2). Normal distribution was observed for all four traits at all stations.
Among the three agricultural stations, the lowest mean GPC was observed at KO (12.1 ± 0.7%), a moderate mean was seen at KB (13.7 ± 0.8%), and the highest mean at KA (14.5 ± 1.0%). Generally, at KO, the barley collection demonstrated lower protein levels in the range of 9.9–14.1% in comparison with KB and KA, where the GPC ranges were 10.6–17.2% and 11.5–18.2%, respectively. However, at KO, the GPC in the majority of the studied collection was higher than in the check cultivar for this region, while at KB and KA, the GPC of the check cultivars was close to the mean value of the collection. The highest mean levels of GSC and EX (as they are closely associated with each other) were also detected at KO: 54.2 ± 0.9% and 73.5 ± 0.9%, respectively. Nevertheless, for both traits at KO, the mean values of GSC and EX in the collection were lower than those in the check cultivar. The GSC mean values at KB and KO were similar (52.8 ± 0.9% and 51.9 ± 1.1%, respectively), as were the EX mean values (72.4 ± 0.9% at KB and 71.5 ± 1.1% at KA). The GSC and EX values for the check cultivars at KB and KA were slightly lower than the corresponding mean values for the collection. As for TWL, the lowest mean value was observed at KO (631.7 ± 33.4 g/L) and was lower than that for the check cultivar for this region. The TWL at KO ranged from 479 to 749 g/L. Similar values of TWL were found at KA: mean of 647.6 ± 28.0 g/L and ranging from 546 to 790 g/L. At KB, the mean TWL was higher at 685.4 ± 24.2 g/L and ranged from 565.5 to 824.0 g/L. The TWL of the check cultivars at KB and KA was close to the mean value of the collection.
The mean values of TWL were significantly positively correlated among the three locations (p < 0.001, Figure S1). A significant positive correlation (p < 0.001) was also observed for GPC, GSC, and EX between KB and KO and between KB and KA. A positive correlation (p < 0.01) was detected between KA and KO for GPC, and weaker positive correlations were observed between KA and KB for GSC and EX. Still, the environment demonstrated the highest impact on GPC (55.44%) and TWL (49.23%), as for GSC and EX, the highest impact was observed for genotype × environment—41.2% and 46.08%, respectively (Table 1). The genotype explained 15.48%, 18.02%, 19.09%, and 20.03% of the total variance of GPC, GSC, EX, and TWL, respectively (Table 1).
The combination of optimal grain quality traits and high yield is one of the main goals for barley breeders. In this study, correlations were detected not only among quality traits but also with yield-associated traits, including the number of grains per spike (NGS), the thousand-grain weight (TGW), and the grain yield per m2 (YM2) (Figure 3).
Among the studied quality traits, the strongest negative correlations were observed between GPC and GSC/EX at all three stations (r from −0.89 to −0.97, p < 0.001). At the same time, GSC and EX, as tightly associated traits, demonstrated a strong positive correlation with each other (r from 0.92 to 1.00, p < 0.001). TWL showed a moderate positive correlation with GSC/EX (r from 0.13 to 0.28, p < 0.001) and a negative correlation with GPC (r from −0.15 to −0.2, p < 0.01) at KB and KO. At KA, there were no correlations between TWL and other quality traits. Regarding grain yield traits, TGW showed positive correlations with TWL at all three stations, negative correlations with GSC/EX at KA and with GPC at KO, and positive correlations with GSC/EX at KO and with GPC at KB and KA. NGS was negatively correlated with TWL at all three stations, with GPC at KA, and with GSC/EX at KO. At KA, NGS demonstrated positive correlations with both GSC/EX and GPC at KO. YM2 was negatively correlated with TWL and GSC/EX and positively correlated with GPC at KO. The opposite situation was observed at KB, where YM2 was positively correlated with TWL and GSC/EX and negatively correlated with GPC. Positive correlations were also recorded between YM2 and GSC and between YM2 and TWL at KA.
The grain quality traits (GPC, GSC, EX, and TWL) and their averages from each environment for two years were used as phenotypic data for the GWAS.

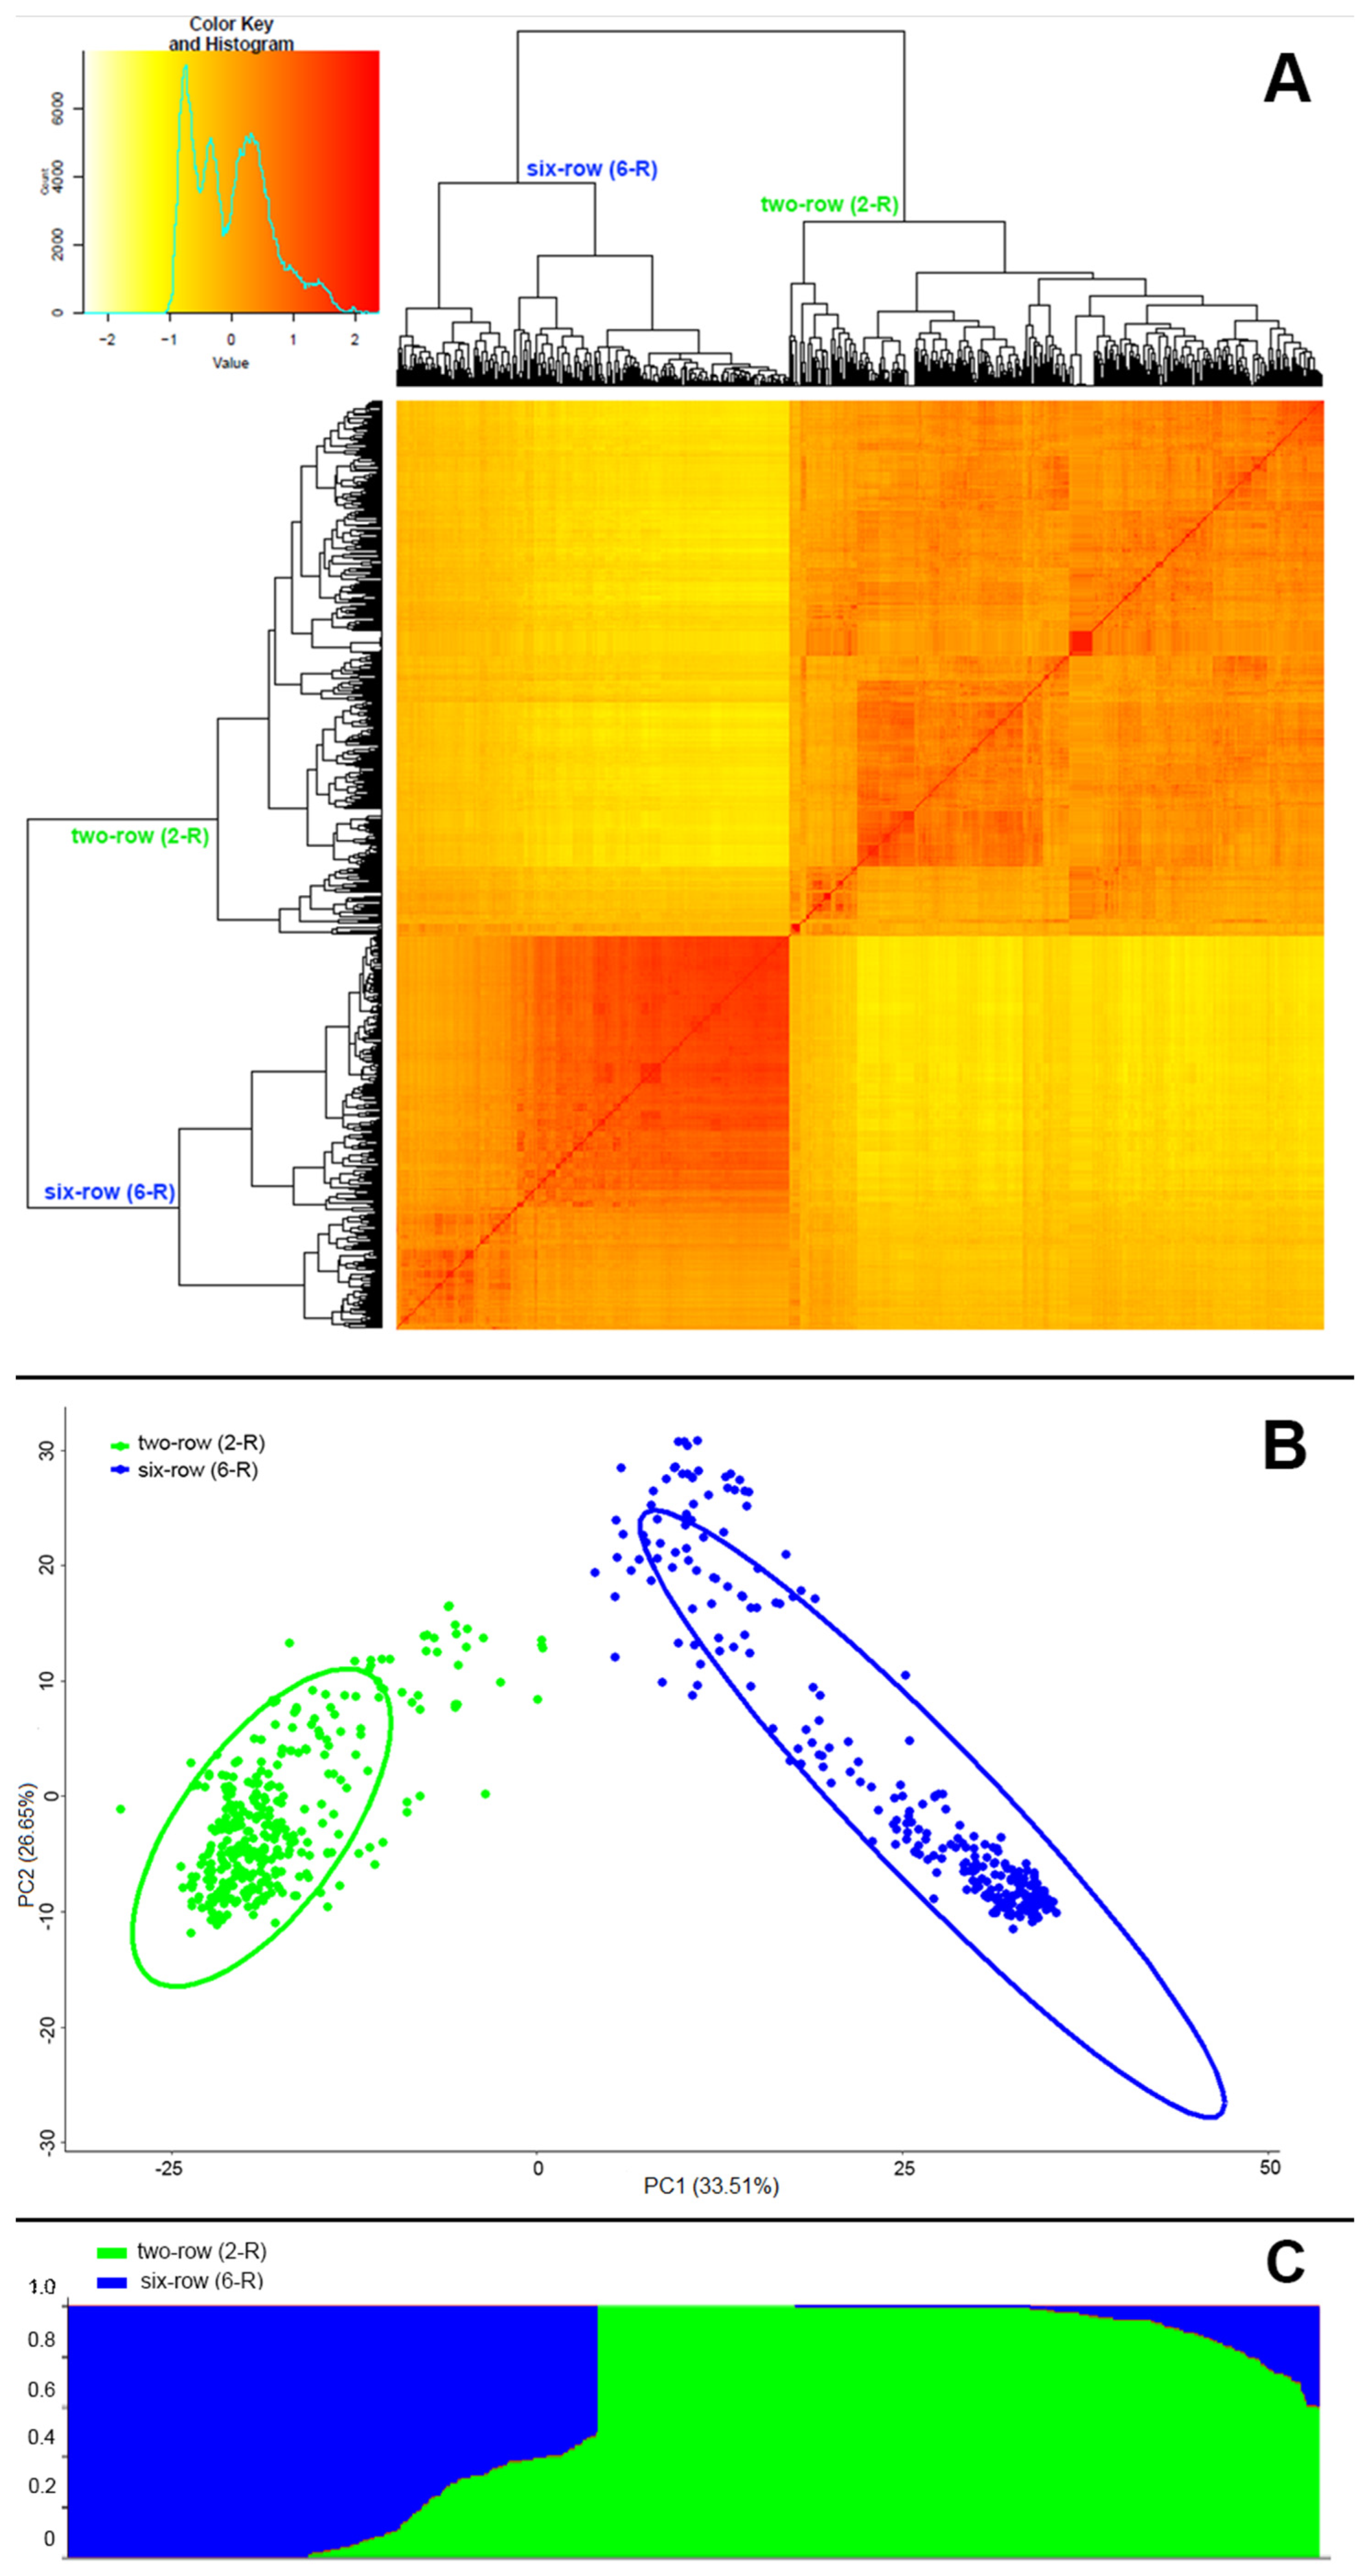
3.2. Population Structure in the Collection of Two- and Six-Rowed Barley Accessions

Two clusters associated with row type were identified after the assessment of population structure using SNP genotyping (Figure 4). The relationship between individuals is shown in Figure 4A as a heat map of the kinship matrix (K-matrix), with a dendrogram produced using hierarchical clustering. All accessions from Kazakhstan were of a 2-R type and were grouped with 2-R accessions from the USA without forming a separate cluster. A similar population structure was observed on a PCA plot (Figure 4B) and on a STRUCTURE barplot (Figure 4C) for the same SNP dataset. The results of the population clustering analysis, the covariance matrix (PC1 and PC2) together with the K-matrix, were used in the MLM for the control of the population structure effect in the GWAS.

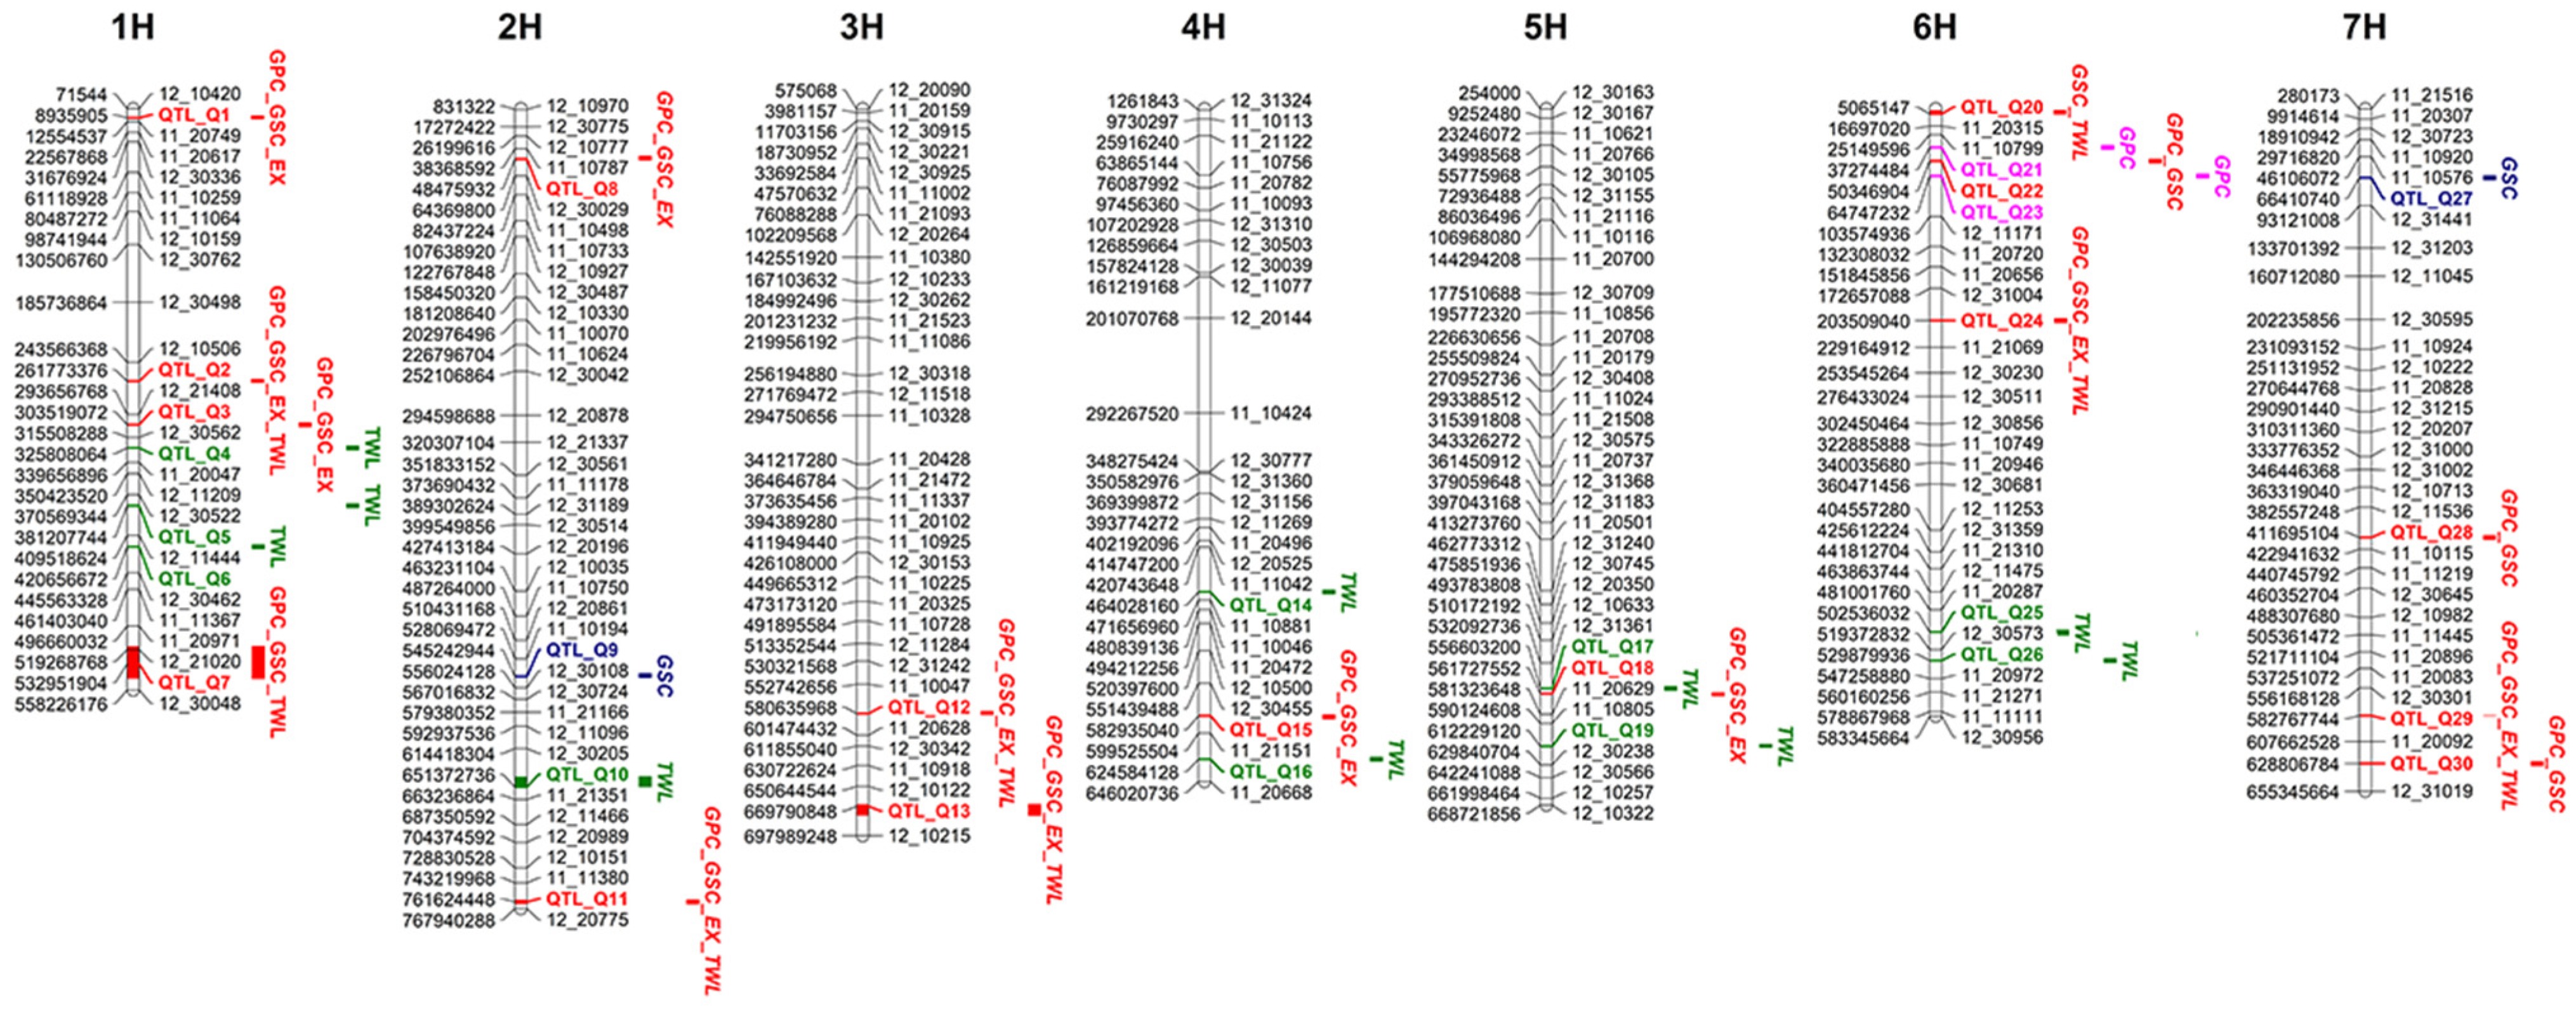
3.3. Identification of Marker-Trait Associations for Grain Quality Traits Using GWAS

As a result of the GWAS analysis, 76 associations between grain quality traits and SNP markers were detected on all seven chromosomes. The distribution by traits was as follows: GPC—18 MTAs; GSC—19 MTAs; EX—12 MTAs; and TWL—27 MTAs. Quantile–quantile (QQ) plots, Manhattan plots, and a full list of the MTAs are provided in Table S4. Among the 76 MTAs, there were 16 SNP markers with a pleiotropic effect associated with two or more traits, as well as six marker groups with SNPs positioned closely to each other. The maximal distance between markers considered as linked was determined for each chromosome at LD (r2) = 0.1 (Figure S2). The linked MTAs were grouped together, resulting in 30 QTLs in total (Figure 5). Two QTLs were identified for GPC, two QTLs were associated with GSC only, and 10 QTLs with TWL. Three QTLs were found together for GPC and GSC, one QTL was discovered for GSC and TWL, and one for three traits (GPC, GSC, and TWL). Five QTLs were detected for three biochemical traits (GPC, GSC, and EX). Six QTLs were found to be associated with all four quality traits (Figure 5). The genetic and physical positions of 30 QTLs were compared with positions of known malting quality genes [22], and with QTLs for GPC, GSC, and TWL from the literature (Table 2). For 25 out of 30 QTLs, possible candidate genes and/or QTLs were found. SNP markers with high significance were chosen for further validation. Seven of the most significant markers were detected using a cutoff FDR rate of p < 0.05 and Bonferroni correction at p < 2.6 × 10⁻⁵ (Table 3).

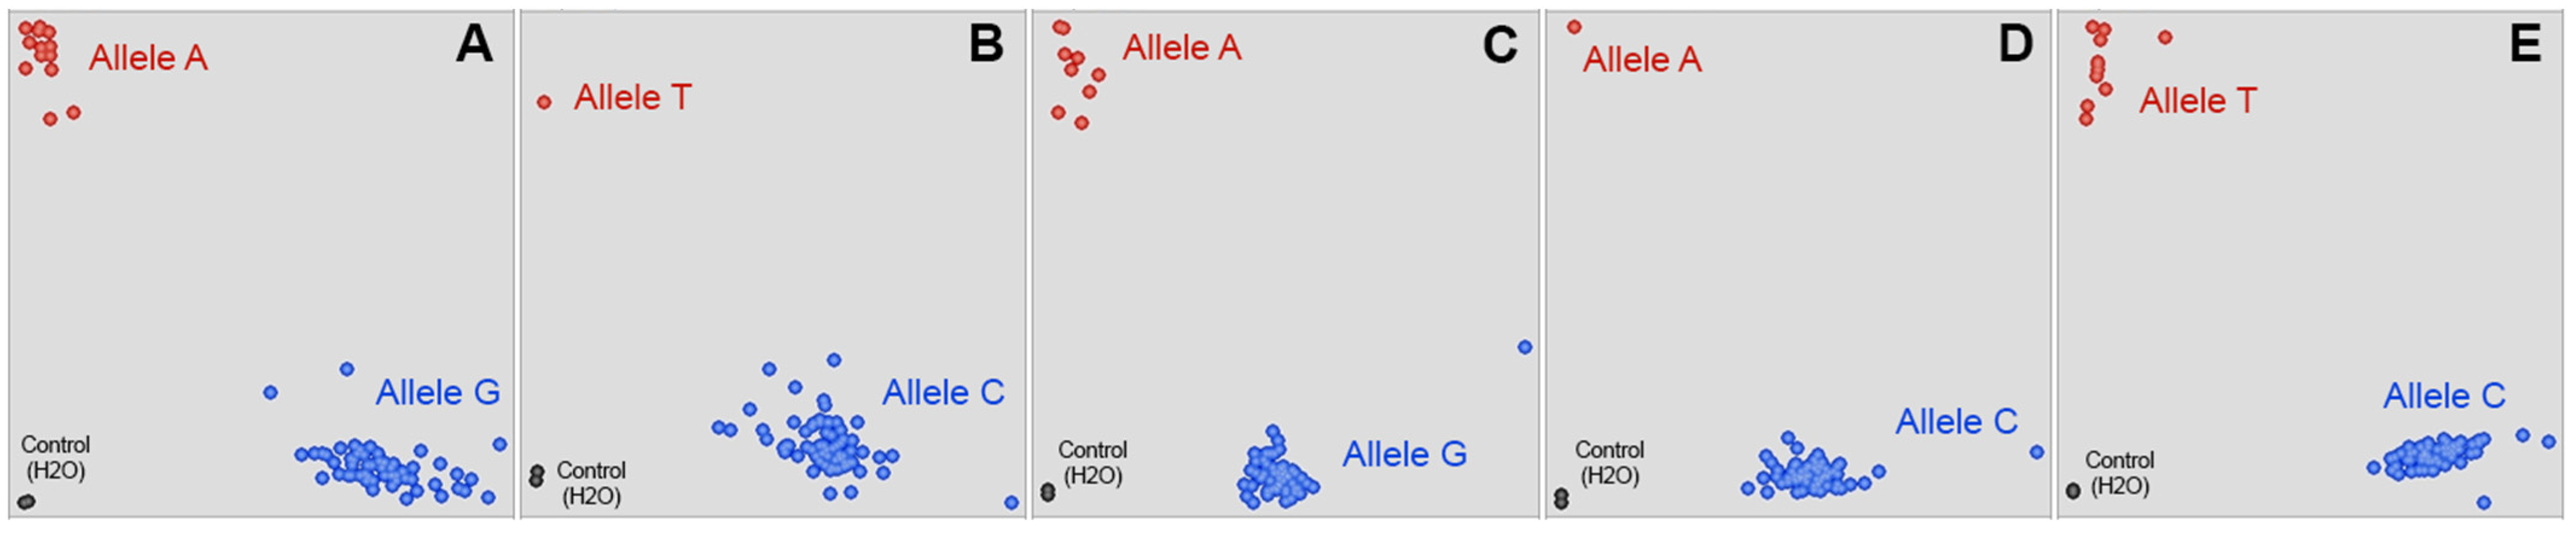
3.4. The significance of KASP Assays for SNP Markers in identified MTAs for Grain Quality Traits

In order to validate the QTLs identified by the GWAS, the most significant SNPs in MTAs for each identified QTL were used in developing KASP assays. In total, five KASP assays (Table S3) were designed for five of the most significant QTLs with pleiotropic effects (Table 3). The promising barley lines (n = 34) grown at KB (2020–2021) were assessed using GPC, GSC, EX, and TWL (Table S2). The genotyping of these lines (Table S2) suggested that three out of five KASP assays (ipbb_hv_6, ipbb_hv_116, and ipbb_hv_128) had a sufficient level of polymorphism (Figure 6), and two KASPs (ipbb_hv_7 and ipbb_hv_119) were insignificantly polymorphic, as only one accession was characterized by minor alleles for each of those two markers.
The genotyping and phenotypic data were used for the validation of the KASP assays’ significance based on the t-test (Table 4). The assessment of the KASP assay ipbb_hv_6 showed highly significant associations with GPC, GSC, and EX over the two years based on their mean values (p < 0.001), as the genotype “A:A” increased the GSC/EX and decreased the GPC values (Table 5). The assay ipbb_hv_128 showed an association with GPC (p < 0.01) and with GSC (p < 0.05) in 2020, and with GSC (p < 0.05) using mean values with the genotype “T:T” that increased the GSC and decreased the GPC values. There were no associations for the assay ipbb_hv_116, and a possible association with TWL was not confirmed in any of the studied KASP assays.

4. Discussion

4.1. The Variability Ranges in the Quality Traits of the Barley Collection Harvested in Three Regions of Kazakhstan

For application in malting, barley should ideally have a GPC in the range of 9.5% to 12.5% [3] and a GSC between 60% and 64%, which corresponds to an EX of approximately 78–82% [11]. In addition, barley bred both for malting and for food production should have a high TWL (650–730 g/L). These quantitative traits are complex and are controlled by many genetic factors [4,5,9]. As has been shown in many studies, GPC, GSC, EX, and TWL are also influenced by environmental factors [14,15,16]. In the current study, the phenotyping of the diverse barley panel provided valuable information about the range and distribution of GPC, GSC, EX, and TWL in barley, as the geographic locations and climate conditions were variable (Figure 1) [57]. Positive correlations among the three sites for each studied trait (Figure S1) indicated a sufficient significance level for the importance of the “genotype” for these experiments. However, observed correlations between the sites were not high (r < 0.31), particularly for GSC and EX. Therefore, it can be speculated that environmental factors also affect quality traits, indicating the necessity for a separate GWAS for the collection harvested in Kazakhstan. In addition, the contribution of the environment was the largest for GPC and TWL, while the variance of GSC and TWL was mostly affected by the genotype × environment interaction (Table 1). Here, the largest number of barley accessions with a low GPC, as well as a higher GSC and EX, was observed in South Kazakhstan at the KO site (Figure 2), which was unlike the other two sites in that the experiment was conducted on irrigated plots [57]. The correlation results at the KB site suggest that GPC is positively correlated with TKW and negatively with YM2 (Figure 3). Interestingly, at the KO site, GPC was negatively correlated with TKW and positively with YM2. Stable and highly significant negative correlations between GPC and GSC/EX were observed at all three stations, confirming the results reported in other works [30]. TWL was negatively correlated with GPC and positively with GSC/EX at both the KB and KO sites. All of the abovementioned strong correlations among quality traits can be explained by their physiological relatedness in barley [63]; still, a calibration model of near-infrared reflectance (NIR) used to estimate quality traits might influence the strength of correlation as well [64,65]. Generally, the collection demonstrated a wide range for all four quality traits and provided promising phenotypic data for the GWAS at all three stations.

4.2. Identification of QTLs Associated with Quality Traits Based on GWAS

The results of the heat map and PCA using 1920 SNPs revealed a clear distinction between the two groups of barley with different row types (Figure 4), which served as confirmation of similar results obtained in previous studies, including the use of the same CAP collection from the USA [28,66]. Therefore, accounting for the grouping of samples, the K- and Q-matrices were generated to avoid the GWAS errors associated with the population structure. The other constraint in the identification of MTAs, as was suggested by the correlation of agronomic traits in different locations and years (Figure S1), is the impact of the environment [67], which was strong for studied traits (Table 1). Usually, to avoid causal associations in genotype × environment interactions and to identify major associations, a stringent threshold is applied in association mapping. However, stringent criteria may potentially lead to the suppression of weak but important minor associations that also contribute to trait manifestation. In this study, we used a rather relaxed threshold (p < 0.001) to allow the detection of the largest possible number of MTAs for the four analyzed quality traits. Nevertheless, an FDR rate of 0.05 and Bonferroni correction at p < 2.6 × 10⁻⁵ were used to select the most significant MTAs for further assessment using KASP assays. As a result, 76 MTAs in total were identified in the studied environments (Table S4), including sixteen MTAs that had the best-fitted FDR and Bonferroni correction (Table 3). More than half of the total associations (n = 43), as well as the largest number of the most significant MTAs (n = 11), were detected at KB. The largest number of the most significant MTAs were observed at KA in 2011 and at KO in 2010. Apparently, the abundance of MTAs at KB is associated with the wide ranges of GPC, GSC, and EX at this location. For instance, all the most significant MTAs for TWL were detected at KO, where the range of this trait was the widest.
A review of genes and QTLs from published GWASs or from linkage mapping studies resulted in identified matches for 25 out of the 30 QTLs (Table 2). Four malting genes were located in close proximity to the QTLs for TWL and GSC. These four genes include Aglu3 (α-glucosidase), which matched with the genetic position of QTL_Q6 for TWL on chromosome 1H; DTDP (d-TDP-glucose dehydratase)/PDI (protein disulfide isomerase), which matched QTL_Q14 for TWL on chromosome 4H; and SS1 (sucrose synthase 1), which matched QTL_Q27 for GSC on chromosome 7H (Table 2). It is known that Aglu3, DTDP, and SS1 are involved in the metabolism of starch in barley grain [68,69,70]. Interestingly, identified QTLs for GPC were positioned far from the HvNAM-1 and HvNAM-2 genes that are associated with protein content in the grain [5,71]. Nevertheless, the genetic location of QTLs associated with the location of genes and QTLs from previously published reports confirms the high reliability of the data in the current study. Therefore, it is expected that the data will be informative for future breeding projects targeting the selection of promising barley cultivars with high grain quality. The remaining five QTLs included QTL_Q1 on chromosome 1H, QTL_Q8 and QTL_Q11 on chromosome 2H, QTL_Q12 on chromosome 3H, and QTL_Q29 on chromosome 7H (Table 2). These five listed QTLs are multi-trait loci with pleiotropic effects, as they are associated with several analyzed traits. As there were no matching genetic positions between these five QTLs and QTLs for the same studied traits in the literature, these loci can likely be considered novel genetic factors for controlling grain quality traits.

4.3. The Significance of KASP Assays for Evaluation of Grain Quality Traits

One of the recent priorities in molecular breeding is the validation of the importance of variances in GWAS-associated regions using modern types of DNA markers and diverse genetic panels [72], including collections of promising lines that will potentially be released in the near future in particular environments. The validation of such genotype-phenotype associations is an essential step for the implementation of marker-assisted selection in practice. From a technical point of view, it is very important to test these associations by using cost-effective, informative, and reliable types of DNA markers, such as KASP assays. Therefore, in this study, the SNPs in the five most significant QTLs for the four studied grain quality traits (GPC, GSC, EX, and TWL) (Table 3) were converted to KASP assays (Table S3) and tested using 34 promising breeding lines from state commission trials grown in field plots (20 m blocks in three repeats). The collection was also tested for the same four quality traits. The list of analyzed QTLs included QTL_Q2 (SNP 11_11336), QTL_Q12 (SNP 11_21505), QTL_Q13 (SNP 11_10935), QTL_Q24 (SNP 12_31509), and QTL_Q29 (SNP 11_21103). Two of the five KASP assays (ipbb_hv_7 and ipbb_hv_119) were monomorphic in the tested barley collection (Figure 6). The other three (ipbb_hv_6, ipbb_hv_116, and ipbb_hv_128) demonstrated good segregation and MAF > 0.05 (Figure 6, Table 4). There were no heterozygotes among the studied breeding lines, which means they were all genetically pure. The 2020 and 2021 phenotypic data used for validation were obtained from KB—the originator of the breeding lines. According to the t-test, KASP assay ipbb_hv_116 was not significantly associated with any of the quality traits in the promising breeding lines. However, the association identified in the GWAS between QTL_Q12 (ipbb_hv_6) and GPC, GSC, and EX was confirmed in 2020 and 2021, and mean values (p-values varied from 5.38 × 10⁻⁸ to 3.47 × 10⁻⁴) (Table 4). Genotype “A:A” of ipbb_hv_6 provided an average 1.88% increase in GSC, a 1.02% increase in EX, and a 1.87% decrease in GPC (Table 5), and the latter effect can be efficiently used in breeding barley for malting, food production, and animal feed. The t-test using grain quality performance in the studied collection validated the association between KASP assay ipbb_hv_128 and GPC and GSC (Table 4) and therefore confirmed the significance of QTL_Q29 (Table 5). Thus, KASP assays ipbb_hv_6 (QTL_Q12) and ipbb_hv_128 (QTL_Q29) showed their significance in the studied local collection of barley, having never been described before, and are presumably novel genetic factors that can be successfully used in breeding for grain quality.

5. Conclusions

In the present study, GWAS of grain quality traits was performed using a barley collection that included 658 accessions from the USA and Kazakhstan grown in three regions of Kazakhstan in 2010 and 2011. Four important grain quality traits (GPC, GSC, EX, and TWL) demonstrating high variability were studied in the collection, which was genotyped using the 9K SNP chip. The GWAS enabled the discovery of 76 genotype-phenotype associations, including 18 MTAs for GPC, 19 MTAs for GSC, 12 MTAs for EX, and 27 MTAs for TWL, resulting in the identification of 30 QTLs for these four important grain quality traits. In the assessment of 25 of those 30 QTLs, putative candidate genes and/or QTLs were found, while the remaining five loci can be considered as possible novel factors for the studied grain quality traits. Furthermore, the SNP markers for the five most significant QTLs (p < 2.6 × 10⁻⁵) associated with several of the quality traits were converted into KASP assays. These five KASP assays were analyzed using 34 barley breeding lines grown in large field plots. A t-test conducted using the segregation in the KASP assays, and the grain quality traits in the 34 barley breeding lines confirmed the significant effect of QTL_Q12 (ipbb_hv_6) and QTL_Q29 (ipbb_hv_128) identified in the GWAS for GPC, GSC, and EX. The diagnostic ability of these markers and the high-throughput KASP platform used in the present study can be potentially applied in a marker-assisted selection of grain quality traits in barley breeding.

Supplementary Materials

The following supporting information can be downloaded at: https://www.mdpi.com/article/10.3390/agronomy12102431/s1. Table S1: Information on 658 barley accessions used for GWAS analysis. Table S2: Information on pedigree of 34 barley promising lines used for KASP assays validation and the results of their genotyping. Table S3: The list of KASP assays for selected SNP markers of studied grain quality traits. Table S4: Full results of GWAS by environments including QQ plots and Manhattan plots. Figure S1: Results of Pearson correlation analysis for grain quality traits among breeding institutions participated in the study. Figure S2: Linkage disequilibrium (LD) decay plots by chromosomes.

Author Contributions

Conceptualization, S.A. (Shyryn Almerekova), A.A. and Y.T.; Data Curation, Y.G., V.C., S.A. (Saule Abugalieva) and A.A.; Formal Analysis, Y.G., V.C. and S.A. (Shyryn Almerekova); Funding Acquisition, S.A. (Shyryn Almerekova) and T.B.; Investigation, Y.G., S.A. (Shyryn Almerekova) and V.C.; Methodology, T.B. and Y.T.; Project Administration, S.A. (Shyryn Almerekova) and Y.T.; Resources, T.B., S.A. (Saule Abugalieva) and A.A.; Supervision, S.A. (Shyryn Almerekova) and Y.T.; Validation, Y.G. and S.A. (Saule Abugalieva); Writing—Original Draft Preparation, Y.G. and Y.T.; Writing—Review and Editing, Y.G., S.A. (Shyryn Almerekova), S.A. (Saule Abugalieva) and Y.T. All authors have read and agreed to the published version of the manuscript.

Funding

The study was supported by the grant AP08052804 “Development and validation of KASP arrays efficiency for key productivity and grain quality traits in two-rowed spring barley” from the Ministry of Education and Science of the Republic of Kazakhstan.

Institutional Review Board Statement

Not applicable.

Informed Consent Statement

Not applicable.

Data Availability Statement

The datasets generated and/or analyzed during the current study are available in the manuscript text and/or Supplementary Materials.

Acknowledgments

The authors are acknowledging the technical assistance for barley grain quality analysis of the staff from the Biochemistry and Grain Quality Laboratory at the Kazakh Research Institute of Agriculture and Plant Growing, Almaty region, Kazakhstan.

Conflicts of Interest

The authors declare no conflict of interest.

References

  1. Langridge, P. Economic and Academic Importance of Barley. In The Barley Genome. Compendium of Plant Genomes; Stein, N., Muehlbauer, G.J., Eds.; Springer International Publishing: Cham, Switzerland, 2018; pp. 1–10. [Google Scholar]
  2. Briggs, D.E. Malts and Malting; Springer Science & Business Media: Berlin/Heidelberg, Germany, 1998. [Google Scholar]
  3. Emebiri, L.C.; Moody, D.B.; Horsley, R.; Panozzo, J.; Read, B.J. The genetic control of grain protein content variation in a doubled haploid population derived from a cross between Australian and North American two-rowed barley lines. J. Cereal Sci. 2015, 41, 107–114. [Google Scholar] [CrossRef]
  4. Jamar, C.; Loffet, F.; Frettinger, P.; Ramsay, L.; Fauconnier, M.L.; Du Jardin, P. NAM-1 gene polymorphism and grain protein content in Hordeum. J. Plant Physiol. 2010, 167, 497–501. [Google Scholar] [CrossRef] [PubMed]
  5. Cai, S.; Yu, G.; Chen, X.; Huang, Y.; Jiang, X.; Zhang, G.; Jin, X. Grain protein content variation and its association analysis in barley. BMC Plant Biol. 2013, 13, 35. [Google Scholar] [CrossRef] [Green Version]
  6. Hagenblad, J.; Vanhala, T.; Madhavan, S.; Leino, M.W. Protein content and HvNAM alleles in Nordic barley (Hordeum vulgare) during a century of breeding. Hereditas 2022, 159, 12. [Google Scholar] [CrossRef]
  7. Holtekjølen, A.K.; Uhlen, A.K.; Bråthen, E.; Sahlstrøm, S.; Knutsen, S.H. Contents of starch and non-starch polysaccharides in barley varieties of different origin. Food Chem. 2006, 94, 348–358. [Google Scholar] [CrossRef]
  8. Langenaeken, N.A.; De Schepper, C.F.; De Schutter, D.P.; Courtin, C.M. Carbohydrate content and structure during malting and brewing: A mass balance study. J. Inst. Brew. 2020, 126, 253–262. [Google Scholar] [CrossRef]
  9. Collins, H.M.; Betts, N.S.; Dockter, C.; Berkowitz, O.; Braumann, I.; Cuesta-Seijo, J.A.; Skadhauge, B.; Whelan, J.; Bulone, V.; Fincher, G.B. Genes that mediate starch metabolism in developing and germinated barley grain. Front. Plant Sci. 2021, 12, 208. [Google Scholar] [CrossRef]
  10. Li, M.; Du, J.; Zhang, K. Profiling of carbohydrates in commercial beers and their influence on beer quality. J. Sci. Food Agric. 2020, 100, 3062–3070. [Google Scholar] [CrossRef] [PubMed]
  11. Titova, Y.M.; Vnukova, M.A. Productivity and quality of malting barley varieties. Bull. Oryol State Agrar. Univ. 2008, 3, 5–8. (In Russian) [Google Scholar]
  12. Hunt, C.W. Factors affecting the feeding quality of barley for ruminants. Anim. Feed Sci. Technol. 1996, 62, 37–48. [Google Scholar] [CrossRef]
  13. Campbell, L.D.; Boila, R.J.; Stothers, S.C. Variation in the chemical composition and test weight of barley and wheat grain grown at selected locations throughout Manitoba. Can. J. Anim. Sci. 1995, 75, 239–246. [Google Scholar] [CrossRef]
  14. Romagosa, I.; Fox, P.N. Genotype×environment interaction and adaptation. In Plant Breeding: Principles and Prospects; Hayward, M.D., Bosemark, N.O., Romagosa, I., Eds.; Chapman & Hall: London, UK, 1993; pp. 373–390. [Google Scholar]
  15. Molina-Cano, J.L.; Francesch, M.; Perez-Vendrell, A.M.; Ramo, T.; Voltas, J.; Brufau, J. Genetic and environmental variation in malting and feed quality of barley. J. Cereal Sci. 1997, 25, 37–47. [Google Scholar] [CrossRef]
  16. Kaczmarek, Z.; Adamski, T.; Surma, M.; Jezowsk, S.; Leśniewska-Frątczak, M. Genotype-environment interaction of barley doubled haploids with regard to malting quality. Plant Breed. 1999, 118, 243–247. [Google Scholar] [CrossRef]
  17. Emebiri, L.C.; Moody, D.B.; Panozzo, J.F.; Chalmers, K.J.; Kretschmer, J.M.; Ablett, G.A. Identification of QTLs associated with variations in grain protein concentration in two-row barley. Aust. J. Agric. Res. 2003, 54, 1211–1221. [Google Scholar] [CrossRef]
  18. Fan, C.; Zhai, H.; Wang, H.; Yue, Y.; Zhang, M.; Li, J.; Wen, S.; Guo, G.; Zeng, Y.; Ni, Z.; et al. Identification of QTLs controlling grain protein concentration using a high-density SNP and SSR linkage map in barley (Hordeum vulgare L.). BMC Plant Biol. 2017, 17, 122. [Google Scholar] [CrossRef] [Green Version]
  19. Abdel-Haleem, H.; Bowman, J.; Giroux, M.; Kanazin, V.; Talbert, H.; Surber, L.; Blake, T. Quantitative trait loci of acid detergent fiber and grain chemical composition in hulled×hull-less barley population. Euphytica 2010, 172, 405–418. [Google Scholar] [CrossRef]
  20. Tinker, N.A.; Mather, D.E.; Rossnagel, B.G.; Kasha, K.J.; Kleinhofs, A.; Hayes, P.M.; Falk, D.E.; Ferguson, T.; Shugar, L.P.; Legge, W.G.; et al. Regions of the genome that affect agronomic performance in two-row barley. Crop Sci. 1996, 36, 1053–1062. [Google Scholar] [CrossRef]
  21. Marquez-Cedillo, L.A.; Hayes, P.M.; Kleinhofs, A.; Legge, W.G.; Rossnagel, B.G.; Sato, K.; Ullrich, S.E.; Wesenberg, D.M. QTL analysis of agronomic traits in barley based on the doubled haploid progeny of two elite North American varieties representing different germplasm groups. Theor. Appl. Genet. 2001, 103, 625–637. [Google Scholar] [CrossRef]
  22. Szucs, P.; Blake, V.C.; Bhat, P.R.; Chao, S.; Close, T.J.; Cuesta-Marcos, A.; Muehlbauer, G.J.; Ramsay, L.; Waugh, R.; Hayes, P.M. An integrated resource for barley linkage map and malting quality QTL alignment. Plant Genome 2009, 2, 134–140. [Google Scholar] [CrossRef] [Green Version]
  23. Peñalba, J.V.; Wolf, J.B. From molecules to populations: Appreciating and estimating recombination rate variation. Nat. Rev. Genet. 2020, 21, 476–492. [Google Scholar] [CrossRef]
  24. Stumpf, M.P.; McVean, G.A. Estimating recombination rates from population-genetic data. Nat. Rev. Genet. 2003, 4, 959–968. [Google Scholar] [CrossRef] [PubMed]
  25. Close, T.J.; Bhat, P.R.; Lonardi, S.; Wu, Y.H.; Rostoks, N.; Ramsay, L.; Druka, A.; Stein, N.; Svensson, J.T.; Wanamaker, S.; et al. Development and implementation of high-throughput SNP genotyping in barley. BMC Genom. 2009, 10, 582. [Google Scholar] [CrossRef] [PubMed] [Green Version]
  26. Close, T.J.; Wanamaker, S.I.; Caldo, R.A.; Turner, S.M.; Ashlock, D.A.; Dickerson, J.A.; Wing, R.A.; Muehlbauer, G.J.; Kleinhofs, A.; Wise, R.P. A new resource for cereal genomics: 22K barley genechip comes of age. Plant Physiol. 2004, 134, 960–968. [Google Scholar] [CrossRef] [Green Version]
  27. Korte, A.; Farlow, A. The advantages and limitations of trait analysis with GWAS: A review. Plant Methods 2013, 9, 29. [Google Scholar] [CrossRef] [PubMed] [Green Version]
  28. Pauli, D.; Muehlbauer, G.J.; Smith, K.P.; Cooper, B.; Hole, D.; Obert, D.E.; Ullrich, S.E.; Blake, T.K. Association mapping of agronomic QTLs in US spring barley breeding germplasm. Plant Genome 2014, 7, 11. [Google Scholar] [CrossRef] [Green Version]
  29. Tsai, H.Y.; Janss, L.L.; Andersen, J.R.; Orabi, J.; Jensen, J.D.; Jahoor, A.; Jensen, J. Genomic prediction and GWAS of yield, quality and disease-related traits in spring barley and winter wheat. Sci. Rep. 2020, 10, 3347. [Google Scholar] [CrossRef] [Green Version]
  30. Pasam, R.K.; Sharma, R.; Malosetti, M.; van Eeuwijk, F.A.; Haseneyer, G.; Kilian, B.; Graner, A. Genome-wide association studies for agronomical traits in a world wide spring barley collection. BMC Plant Biol. 2012, 12, 1–22. [Google Scholar] [CrossRef] [PubMed] [Green Version]
  31. Li, M.; Geng, L.; Xie, S.; Wu, D.; Ye, L.; Zhang, G. Genome-wide association study on total starch, amylose and amylopectin in barley grain reveals novel putative alleles. Int. J. Mol. Sci. 2021, 22, 553. [Google Scholar] [CrossRef]
  32. Zhang, Y.; Luan, H.; Zang, H.; Yang, H.; Xu, X.; Chen, H.; Qiao, H.; Shen, H. Identification of molecular markers for starch content in barley (Hordeum vulgare L.) by genome-wide association studies based on bulked samples. Plant Genet. Resour. 2020, 18, 111–119. [Google Scholar] [CrossRef]
  33. Houston, K.; Russell, J.; Schreiber, M.; Halpin, C.; Oakey, H.; Washington, J.M.; Booth, A.; Shirley, N.; Burton, R.A.; Fincher, G.B. A genome wide association scan for (1, 3; 1, 4)-β-glucan content in the grain of contemporary 2-row Spring and Winter barleys. BMC Genom. 2014, 15, 907. [Google Scholar] [CrossRef] [PubMed] [Green Version]
  34. Berger, G.L.; Liu, S.; Hall, M.D.; Brooks, W.S.; Chao, S.; Muehlbauer, G.J.; Baik, B.K.; Steffenson, B.; Griffey, C.A. Marker-trait associations in Virginia Tech winter barley identified using genome-wide mapping. Theor. Appl. Genet. 2013, 126, 693–710. [Google Scholar] [CrossRef]
  35. Alqudah, A.M.; Sharma, R.; Pasam, R.K.; Graner, A.; Kilian, B.; Schnurbusch, T. Genetic dissection of photoperiod response based on GWAS of pre-anthesis phase duration in spring barley. PLoS ONE 2014, 9, e113120. [Google Scholar] [CrossRef] [Green Version]
  36. Thabet, S.G.; Moursi, Y.S.; Sallam, A.; Karam, M.A.; Alqudah, A.M. Genetic associations uncover candidate SNP markers and genes associated with salt tolerance during seedling developmental phase in barley. Environ. Exp. Bot. 2021, 188, 104499. [Google Scholar] [CrossRef]
  37. Al-Sayaydeh, R.; Al-Bawalize, A.; Al-Ajlouni, Z.; Akash, M.W.; Abu-Elenein, J.; Al-Abdallat, A.M. Agronomic evaluation and yield performance of selected barley (Hordeum vulgare L.) landraces from Jordan. Int. J. Agron. 2019, 2019, 9575081. [Google Scholar] [CrossRef] [Green Version]
  38. Gyawali, S.; Mamidi, S.; Chao, S.; Bhardwaj, S.C.; Shekhawat, P.S.; Selvakumar, R.; Gangwar, O.P.; Singh Verma, R.P. Genome-wide association studies revealed novel stripe rust resistance QTL in barley at seedling and adult-plant stages. Euphytica 2021, 217, 3. [Google Scholar] [CrossRef]
  39. Mitterbauer, E.; Enders, M.; Bender, J.; Erbs, M.; Habekuß, A.; Kilian, B.; Ordon, F.; Weigel, H.-J. Growth response of 98 barley (Hordeum vulgare L.) genotypes to elevated CO 2 and identification of related quantitative trait loci using genome-wide association studies. Plant Breed. 2017, 136, 483–497. [Google Scholar] [CrossRef]
  40. Comadran, J.; Kilian, B.; Russell, J.; Ramsay, L.; Stein, N.; Ganal, M.; Shaw, P.; Bayer, M.; Thomas, W.; Marshall, D. Natural variation in a homolog of Antirrhinum CENTRORADIALIS contributed to spring growth habit and environmental adaptation in cultivated barley. Nat. Genet. 2012, 44, 1388–1392. [Google Scholar] [CrossRef]
  41. Bayer, M.M.; Rapazote-Flores, P.; Ganal, M.; Hedley, P.E.; Macaulay, M.; Plieske, J.; Ramsay, L.; Russell, J.; Shaw, P.D.; Thomas, W.; et al. Development and Evaluation of a Barley 50k iSelect SNP Array. Front. Plant Sci. 2017, 8, 1792. [Google Scholar] [CrossRef] [PubMed] [Green Version]
  42. Yu, M.E.; Chao, S.; Singh, R.P.; Sorrells, M.E. Validation of single nucleotide polymorphic markers linked to Ug99 stem rust resistance in spring wheat. PLoS ONE 2017, 12, e0171963. [Google Scholar] [CrossRef] [Green Version]
  43. Tan, C.T.; Assanga, S.; Zhang, G.; Rudd, J.C.; Haley, S.D.; Xue, Q.; Ibrahim, A.; Bai, G.; Zhang, X.; Byrne, P.; et al. Development and validation of KASP markers for wheat streak mosaic virus resistance gene Wsm2. Crop Sci. 2017, 57, 340–349. [Google Scholar] [CrossRef] [Green Version]
  44. Khalid, M.; Afzal, F.; Gul, A.; Amir, R.; Subhani, A.; Ahmed, Z.; Mahmood, Z.; Xia, X.; Rasheed, A.; He, Z. Molecular characterization of 87 functional genes in wheat diversity panel and their association with phenotypes under well-watered and water-limited conditions. Front. Plant Sci. 2019, 10, 717. [Google Scholar] [CrossRef]
  45. Comastri, A.; Janni, M.; Simmonds, J.; Uauy, C.; Pignone, D.; Nguyen, H.T. Marmiroli, N. Heat in wheat: Exploit reverse genetic techniques to discover new alleles within the Triticum durum sHsp26 family. Front. Plant Sci. 2018, 9, 1337. [Google Scholar] [CrossRef] [Green Version]
  46. Rasheed, A.; Wen, W.; Gao, F.; Zhai, S.; Jin, H.; Liu, J.; Guo, Q.; Zhang, Y.; Dreisigacker, S.; Xia, X.; et al. Development and validation of KASP assays for genes underpinning key economic traits in bread wheat. Theor. Appl. Genet. 2016, 129, 1843–1860. [Google Scholar] [CrossRef] [PubMed]
  47. Ma, J.; Zhang, H.; Li, S.; Zou, Y.; Li, T.; Liu, J.; Ding, P.; Mu, Y.; Tang, H.; Deng, M.; et al. Identification of quantitative trait loci for kernel traits in a wheat cultivar Chuannong16. BMC Genet. 2019, 20, 77. [Google Scholar] [CrossRef] [PubMed] [Green Version]
  48. Jost, M.; Singh, D.; Lagudah, E.; Park, R.F.; Dracatos, P. Fine mapping of leaf rust resistance gene Rph13 from wild barley. Theor. Appl. Genet. 2020, 133, 1887–1895. [Google Scholar] [CrossRef] [PubMed]
  49. Xu, X.; Mornhinweg, D.; Bernardo, A.; Li, G.; Bian, R.; Bai, G. Characterization of Rsg2.a3: A new greenbug resistance allele at the Rsg2 locus from wild barley (Hordeum vulgare ssp. spontaneum). Crop J. 2022, in press. [Google Scholar] [CrossRef]
  50. Wang, Y.; Habekuß, A.; Snowdon, R.J.; Ordon, F.; Perovic, D. Delineating the elusive BaMMV resistance gene rym15 in barley by medium-resolution mapping. Mol. Breed. 2021, 41, 76. [Google Scholar] [CrossRef]
  51. Yan, L.; Jiang, C.; Cai, Y.; Pan, Y.; Xu, R.; Luan, H.; Shen, H.; Ahmar, S.; Zhang, J.; Yang, P.; et al. Evaluating the genetic effects of seed dormancy regulatory genes Qsd1 and Qsd2 in a global collection of cultivated barley (Hordeum vulgare ssp. vulgare) with functional kompetitive allele-specific PCR markers. Plant Breed. 2021, 140, 827–834. [Google Scholar]
  52. Looseley, M.E.; Bayer, M.; Bul, H.; Ramsay, L.; Thomas, W.; Booth, A.; De La Fuente Canto, C.; Morris, J.; Hedley, P.E.; Russell, J. Association mapping of diastatic power in UK winter and spring barley by exome sequencing of phenotypically contrasting variety sets. Front. Plant Sci. 2017, 8, 1566. [Google Scholar] [CrossRef] [Green Version]
  53. Cu, S.T.; March, T.J.; Degner, S.; Eglinton, J.K. Identification of novel alleles from wild barley for the improvement of alpha-amylase and related malt quality traits. Plant Breed. 2016, 135, 663–670. [Google Scholar] [CrossRef]
  54. Genievskaya, Y.; Almerekova, S.; Sariev, B.; Chudinov, V.; Tokhetova, L.; Sereda, G.; Ortaev, A.; Tsygankov, V.; Blake, T.; Chao, S.; et al. Marker–trait associations in two–rowed spring barley accessions from Kazakhstan and the USA. PLoS ONE 2018, 3, e0205421. [Google Scholar] [CrossRef] [Green Version]
  55. Almerekova, S.; Sariev, B.; Abugalieva, A.; Chudinov, V.; Sereda, G.; Tokhetova, L.; Ortaev, A.; Tsygankov, V.; Blake, T.; Chao, S.; et al. Association mapping for agronomic traits in six–rowed spring barley from the USA harvested in Kazakhstan. PLoS ONE 2019, 14, e0221064. [Google Scholar] [CrossRef]
  56. Turuspekov, Y.; Ormanbekova, D.; Rsaliev, A.; Abugalieva, S. Genome-wide association study on stem rust resistance in Kazakh spring barley lines. BMC Plant Biol. 2016, 16, 13–21. [Google Scholar] [CrossRef] [Green Version]
  57. Turuspekov, Y.; Sariev, B.; Chudinov, V.; Sereda, G.; Tokhetova, L.; Doszhanov, M.; Volis, S.; Abugalieva, S. Genotype × environment interaction patterns for grain yield of spring barley in different regions of Kazakhstan. Russ. J. Genet. 2013, 49, 196–205. [Google Scholar] [CrossRef]
  58. Doyle, J.J.; Doyle, J.L. A rapid DNA isolation procedure for small quantities of fresh leaf tissue. Phytochem. Bull. 1987, 19, 11–15. [Google Scholar]
  59. Yu, J.; Pressoir, G.; Briggs, W.H.; Vroh Bi, I.; Yamasaki, M.; Doebley, J.F.; McMullen, M.D.; Gaut, B.S.; Nielsen, D.M.; Holland, J.B.; et al. A unified mixed-model method for association mapping that accounts for multiple levels of relatedness. Nat. Genet. 2006, 38, 203–208. [Google Scholar] [CrossRef]
  60. Falush, D.; Wirth, T.; Linz, B.; Pritchard, J.K.; Stephens, M.; Kidd, M.; Blaser, M.J.; Graham, D.Y.; Vacher, S.; Perez-Perez, G.I.; et al. Traces of human migrations in Helicobacter pylori populations. Science 2003, 299, 1582–1585. [Google Scholar] [CrossRef] [Green Version]
  61. Evanno, G.; Regnaut, S.; Goudet, J. Detecting the number of clusters of individuals using the software STRUCTURE: A simulation study. Mol. Ecol. 2005, 14, 2611–2620. [Google Scholar] [CrossRef] [Green Version]
  62. Earl, D.A.; von Holdt, B.M. Structure Harvester: A website and program for visualizing STRUCTURE output and implementing the Evanno method. Conserv. Genet. Resour. 2012, 4, 359–361. [Google Scholar] [CrossRef]
  63. Bosnes, M.; Weideman, F.; Olsen, O.-A. Endosperm differentiation in barley wild-type and sex mutants. Plant J. 1992, 2, 661–674. [Google Scholar] [CrossRef]
  64. Maertens, K.; Reyns, P.; De Baerdemaeker, J. On-line measurement of grain quality with NIR technology. Trans. ASABE 2004, 47, 1135. [Google Scholar] [CrossRef]
  65. Kahriman, F.; Egesel, C.Ö. Development of a calibration model to estimate quality traits in wheat flour using NIR (Near Infrared Reflectance) spectroscopy. Res. J. Agric. Sci. 2011, 43, 392–400. [Google Scholar]
  66. Wang, H.; Smith, K.P.; Combs, E.; Blake, T.; Horsley, R.D.; Muehlbauer, G.J. Effect of population size and unbalanced data sets on QTL detection using genome-wide association mapping in barley breeding germplasm. Theor. Appl. Genet. 2012, 124, 111–124. [Google Scholar] [CrossRef]
  67. Liu, Y.J.; Papasian, C.J.; Liu, J.F.; Hamilton, J.; Deng, H.W. Is replication the gold standard for validating genome-wide association findings? PLoS ONE 2008, 3, e4037. [Google Scholar] [CrossRef]
  68. Stanley, D.; Rejzek, M.; Naested, H.; Smedley, M.; Otero, S.; Fahy, B.; Thorpe, F.; Nash, R.J.; Harwood, W.; Svensson, B.; et al. The role of α-glucosidase in germinating barley grains. Plant Physiol. 2011, 155, 932–943. [Google Scholar] [CrossRef] [Green Version]
  69. Zhang, Z.; Zhao, H.; Tang, J.; Li, Z.; Li, Z.; Chen, D.; Lin, W. A proteomic study on molecular mechanism of poor grain-filling of rice (Oryza sativa L.) inferior spikelets. PLoS ONE 2014, 9, e89140. [Google Scholar] [CrossRef] [Green Version]
  70. Barrero-Sicilia, C.; Hernando-Amado, S.; González-Melendi, P.; Carbonero, P. Structure, expression profile and subcellular localisation of four different sucrose synthase genes from barley. Planta 2011, 234, 391–403. [Google Scholar] [CrossRef] [Green Version]
  71. See, D.; Kanazin, V.; Kephart, K.; Blake, T. Mapping genes controlling variation in barley grain protein concentration. Crop Sci. 2002, 42, 680–685. [Google Scholar] [CrossRef]
  72. Riaz, A.; Kanwal, F.; Börner, A.; Pillen, K.; Dai, F.; Alqudah, A.M. Advances in genomics-based breeding of barley: Molecular tools and genomic databases. Agronomy 2021, 11, 894. [Google Scholar] [CrossRef]
Figure 1. Geographical locations of three experimental stations. KB—Karabalyk Agricultural Experimental Station; KA—Karaganda Agricultural Experimental Station; KO—I. Zhakhaev Kazakh Research Institute of Rice Growing (Kyzylorda).
Agronomy 12 02431 g001
Figure 2. Average values over two years of grain quality traits of the collection harvested in three regions. (A) Grain protein content (GPC,%). (B) Grain starch content (GSC,%). (C) Extractivity (EX,%). (D) Grain test weight per liter (TWL, g/L). Freq.—frequency; CC—check cultivar; Ub.—Ubagan—check cultivar of KB; Kar.—Karagandinsky 5—check cultivar of KA; As.—Assem—check cultivar of KO.
Agronomy 12 02431 g002
Figure 3. Correlation coefficients (r) among grain quality and yield-related traits. (A) Karabalyk or KB. (B) Karaganda or KA. (C) Kyzylorda or KO. GPC—grain protein content (%); GSC—grain starch content (%); EX—extractivity (%); TWL—grain test weight per liter (%); NGS—number of grains per spike (pcs.); TGW—thousand-grain weight (g); YM2—yield per m2 (g/m2). Cells with significance at p < 0.05 are highlighted in color: the directions of correlations are denoted in color, with red indicating negative and blue indicating positive. Color intensity increases with the decrease in p.
Agronomy 12 02431 g003
Figure 4. Population structure in studied barley collection. (A) Heat map of the kinship matrix (K-matrix) with dendrogram. (B) PCA plot. (C) STRUCTURE barplot.
Agronomy 12 02431 g004
Figure 5. The location of QTLs associated with barley grain quality traits on the genetic map. The names of SNPs and QTLs are shown on the right, and the positions of the loci are shown on the left of the linkage maps as base pairs (bp). The QTLs identified in this study are highlighted in blue for grain starch content, pink for grain protein content, green for grain test weight, and red for multi-trait QTLs. GPC—grain protein content; GSC—grain starch content; EX—extractivity; TWL—grain test weight.
Agronomy 12 02431 g005
Figure 6. KASP plots of five SNPs associated with grain quality traits. (A) ipbb_hv_6. (B) ipbb_hv_7. (C) ipbb_hv_116. (D) ipbb_hv_119. (E) ipbb_hv_128. Red and blue dots denote genotypes and black dots are negative control (H2O).
Agronomy 12 02431 g006
Table 1. The impact of genotype, environment, and genotype × environment on the variance of grain quality traits.
GPC
dfSSMSVar.% of Total Var.
Geno657133620.372315.48
Env54781956.21.332555.44
Geno x Env291325080.90.699029.08
Total Var. 2.4038100.00
GSC
dfSSMSVar.% of total Var.
Geno65719152.90.533718.02
Env54333866.51.207640.78
Geno x Env291343781.51.220241.20
Total Var. 2.9615100.00
EX
dfSSMSVar.% of total Var.
Geno65717072.60.475819.09
Env531156230.868234.83
Geno x Env291341211.41.148646.08
Total Var. 2.4925100.00
TWL
dfSSMSVar.% of total Var.
Geno6571,666,7352510464.530420.03
Env54,097,2498194501141.93149.23
Geno x Env29132,558,541877713.082830.74
Total Var. 2319.544100.00
GPC, grain protein content (%); GSC, grain starch content (%); EX, extractivity (%); TWL, grain test weight per liter (g/L); Geno, genotype; Env, environment; df, degree of freedom; SS, sum of squares; MS, mean square; Var., variance.
Table 2. List of identified QTLs for grain quality traits and their candidate loci. Novel QTLs are highlighted in bold.
QTLTraitMarkerChr.Pos. (bp)Pos. (cM)Candidate Malting Quality GenesGPC Candidate QTLGSC Candidate QTLTWL Candidate QTL
QTL_Q1GPC/GSC/EX12_309181H8,935,90512.78
QTL_Q2GPC/GSC/EX/TWL11_113361H261,773,37750 QTl1_CPC
(55.49 cM) [30]
QTL2_SC
(51.23 cM) [30]
QTL_Q3GPC/GSC/EX11_104381H303,519,07150 QTl1_CPC
(55.49 cM) [30]
QTL2_SC
(51.23 cM) [30]
QTL_Q4TWL12_313811H325,808,05650 QTl1_CPC
(55.49 cM) [30]
QTL2_SC
(51.23 cM) [30]
QTL_Q5TWL12_304781H381,207,73050.99 QTl1_CPC
(55.49 cM) [30]
QTL2_SC
(51.23 cM) [30]
TWL12_304991H381,209,23050.99
QTL_Q6TWL11_101761H420,656,68659.01Aglu3 (12_30820, 419012101 bp) α-glucosidase [22]QTl1_CPC
(55.49 cM) [30]
QTL_Q7TWL11_201691H516,153,70697.98 QTL5_SC
(126.01 cM) [30];
qTS-1.2 (534442471 bp) [31]
QTw1H.101
(98.56 cM) [28]
GPC/GSC/TWL12_301911H522,448,103107.18
TWL11_103381H532,951,913121.6
TWL12_313871H542,673,808131.46
TWL11_203831H547,250,913136.65
QTL_Q8GPC/GSC/EX11_101782H48,475,93152.96
QTL_Q9GSC11_109092H545,242,93969.55 QTL5_CPC
(74.37 cM) [30];
QGpc2H.54
(66.11 cM) [28]
QTL7_SC
(64.24 cM) [30]; QTl8_SC
(71.12 cM) [30]
QTL_Q10TWL12_312932H641,328,11784.69 QGpc.ZiSc-2H.1 (90.64 cM) [18]; QGpc2H.86
(90.99 cM) [28]
QTL9_SC
(90.1 cM) [30]
QTwt-2H.89
(81.26 cM) [28]; QTw2H.86
(90.99 cM) [28]
TWL11_102872H651,372,75590.99
TWL12_309012H652,031,87090.99
QTL_Q11GPC/GSC/EX/TWL11_214142H761,624,420-
QTL_Q12GPC/GSC/EX/TWL11_215053H580,635,99479.13
QTL_Q13TWL12_311613H667,790,880- qAP-3.2 (667803604 bp) [31]
GPC/GSC/EX/TWL11_109353H678,512,385149.85
QTL_Q14TWL11_213034H464,028,16953.87DTDP (12_30839, 54.95 cM)
d-TDP-glucose dehydratase [22];
PDI (12_30878, 53.87 cM) protein disulfide isomerase [22]
QBgsg.StMo-4H (54.4 cM) [22]
QTL_Q15GPC/GSC/EX11_100904H582,935,04369.08 QTL12_SC (65.05 cM) [30]
QTL_Q16TWL12_311394H624,584,147102.38 QGpc.ZiSc-4H.2 (102.38 cM) [18]; QTL13_CPC (101.62 cM) [30]
QTL_Q17TWL12_100775H556,603,18587.71 QGpc.ZiSc-5H.3 (85.58 cM) [18]; QTL14_CP
(85.93 cM) [30]; QGp-5H.96
(87.71 cM) [34]
qAP-5.2 (551372936 bp) [31]
QTL_Q18GPC/GSC/EX12_308525H560,732,04087.71 QGpc.ZiSc-5H.3 (85.58 cM) [18]; QTL14_CP
(85.93 cM) [30]; QGp-5H.96
(87.71 cM) [34]
qAP-5.2 (551372936 bp) [31]
GPC/GSC/EX12_307055H561,727,55090.22
QTL_Q19TWL11_200085H612,229,115134.67 QGpc5H.137 (127.52 cM) [28] QTwt-5H.131 (131.64 cM) [28]
QTL_Q20GSC11_202326H1,578,9510 qAP-6.1
(4816646 bp) [31]
TWL11_204936H5,065,1470.5
TWL11_208866H5,362,4081.4
QTL_Q21GPC12_305166H37,274,48451.74 QGpc6H.45
(54.7 cM) [28]
QTL_Q22GPC/GSC12_306586H50,346,90454.14 QGpc6H.45
(54.7 cM) [28];
Qcp6a
(57.91 cM) [19];
QTL_Q23GPC12_312746H64,747,23055.28 QGpc6H.45
(54.7 cM) [28];
Qcp6a
(57.91 cM) [19];
qAC-6.1
(70242665 bp) [31]
QTL_Q24GPC/GSC/EX/TWL12_315096H203,509,03458.91 QGpc6H.45
(54.7 cM) [28];
Qcp6a
(57.91 cM) [19];
QTL_Q25TWL11_206736H502,536,02574.18 QGpc.ZiSc-6H.1 (73.83 cM) [18];QTL18_SC
(71.08 cM) [30]
QTw6H.75
(77.7 cM) [28]
QTL_Q26TWL11_101856H529,879,93781.48 QTw6H.75
(77.7 cM) [28]
QTL_Q27GSC12_305767H66,410,73961.13SS1
(12_30879, 67729209 bp) sucrose synthase 1 [22]
QGpc.ZiSc-7H.2 (59.48 cM) [18]; QGpc.ZiSc-7H.3 (63.19 cM) [18]; QTL20_CPC
(61.32 cM) [30]
QBgnm.StMo-7H.1 (60.9 cM) [22]; QDp.StMo-2H.3 (60.9 cM) [22]
QTL_Q28GPC/GSC12_311407H411,695,09378.07 QTL21_CPC (80.94 cM) [30]; QGpc6H.86 [28]
(83.23 cM)
QTL22_SC
(78.22 cM) [30]
QTwt-7H.91-94 (84.86 cM) [28]
QTL_Q29GPC/GSC/EX/TWL11_211037H582,767,743-
QTL_Q30GPC/GSC11_101827H628,806,795133.92 QGpc7H.130 [28] (135.99 cM)
Chr., chromosome; Pos., position; GPC, grain protein content; GSC, grain starch content; EX, extractivity; TWL, grain test weight per liter.
Table 3. List of significant marker–trait associations for grain quality traits. MTAs with p < 2.6 × 10⁻⁵ and FDR-adjusted p < 0.05 are listed. Novel QTLs are indicated in bold.
# of MTAQTLTraitSNPChr.Pos. (bp)p-ValueFDR Adjusted p-ValueR2AlleleEffect
1QTL_Q2GPC11_113361H261,773,3776.37 × 10−60.00390.023A0.495
2GSC1.03 × 10−40.03960.019G0.565
3QTL_Q8GSC11_101782H48,475,9317.64 × 10−50.03670.020G0.455
4QTL_Q12GPC11_215053H580,635,9942.14 × 10−60.00210.026A0.590
5TWL1.15 × 10−70.00020.035A20.275
6GSC6.01 × 10−50.03670.021G0.647
7QTL_Q13GPC11_109353H678,512,3851.25 × 10−40.04820.017C0.391
8TWL2.75 × 10−70.00030.033C16.244
9QTL_Q20TWL11_208866H53,62,4084.96 × 10−50.01900.020A8.744
10QTL_Q24EX12_315096H203,509,0347.21 × 10−60.01380.027A0.656
11GPC9.10 × 10−80.00020.033G0.664
12TWL3.53 × 10−60.00170.027G17.627
13GSC2.40 × 10−60.00460.029A0.759
14QTL_Q29GPC11_211037H582,767,7438.17 × 10−60.00390.023A0.494
15TWL1.85 × 10−60.00120.028A16.331
16GSC5.26 × 10−50.03670.021G0.591
Chr., chromosome; Pos., physical position on the chromosome; FDR, false discovery rate; R2, phenotypic variation explained by the MTA; GPC, grain protein content (%); GSC, grain starch content (%); EX, extractivity (%); TWL, grain test weight per liter (%).
Table 4. The significance of SNP markers associated with grain quality traits using the collection of 34 promising breeding lines. p-values obtained in the t-test are shown.
Traits (GWAS)KASPChr.MAF20202021MEAN
TWLGPCEXGSCTWLGPCEXGSCTWLGPCEXGSC
GPC/GSC/TWLipbb_hv_63H0.180.6843.47 × 10−42.88 × 10−41.23 × 10−50.2839.16 × 10−55.89 × 10−51.14 × 10−50.7034.69 × 10−64.85 × 10−55.38 × 10−8
GPC/GSC/
EX/TWL
ipbb_hv_76H0 (mono)------------
GPC/GSCipbb_hv_1161H0.120.4440.4950.8750.5250.1520.7680.1050.9940.3080.9060.5310.718
GPC/TWLipbb_hv_1193H0 (mono)------------
GPC/GSC/TWLipbb_hv_1287H0.170.4970.0050.6470.0160.9660.2640.6490.0920.6420.1230.6650.037
Chr., chromosome. MAF, minor allele frequency. MEAN, mean values of 2020 and 2021. GPC, grain protein content (%). GSC, grain starch content (%). EX, extractivity (%). TWL, grain test weight per liter (%).
Table 5. Effect of genotypes on grain quality traits in the 34 tested barley breeding lines.
2020
ipbb_hv_6 (chromosome 3H; 580,635,994 bp)GenotypeNMeanSDEffect
Grain protein content (GPC,%)A:A611.450.23−1.15%
G:G2812.601.44+1.15%
Grain starch content (GSC,%)A:A661.270.45+1.71%
G:G2859.561.19−1.71%
Extractivity (EX,%)A:A678.320.42+1.10%
G:G2877.220.84−1.10%
ipbb_hv_128 (chromosome 7H; 582,767,743 bp)GenotypeNMeanSDEffect
Grain protein content (GPC,%)T:T511.640.25−0.89%
C:C2912.531.45+0.89%
Grain starch content (GSC,%)T:T560.950.76+1.26%
C:C2959.691.27−1.26%
2021
ipbb_hv_6 (chromosome 3H; 580,635,994 bp)GenotypeNMeanSDEffect
Grain protein content (GPC,%)A:A612.600.83−2.60%
G:G2815.201.10+2.60%
Grain starch content (GSC,%)A:A662.130.53+2.05%
G:G2860.080.78−2.05%
Extractivity (EX,%)A:A678.650.30+0.93%
A:A2877.720.69−0.93%
MEAN
ipbb_hv_6 (chromosome 3H; 580,635,994 bp)GenotypeNMeanSDEffect
Grain protein content (GPC,%)A:A612.0319.80−1.87%
G:G2813.9031.69+1.87%
Grain starch content (GSC,%)A:A661.700.36+1.87%
G:G2859.830.81−1.87%
Extractivity (EX,%)A:A678.480.33+0.99%
G:G2877.490.68−0.99%
ipbb_hv_128 (chromosome 7H; 582,767,743 bp)GenotypeNMeanSDEffect
Grain starch content (GSC,%)T:T561.240.96+1.27%
C:C2959.970.94−1.27%
N, number of barley lines with a particular genotype. SD, standard deviation. MEAN, mean values of 2020 and 2021.
Publisher’s Note: MDPI stays neutral with regard to jurisdictional claims in published maps and institutional affiliations.

