
Cleaved Amplified Polymorphic Sequences (CAPS) Markers for Characterization of the LuFAD3A Gene from Various Flax (Linum usitatissimum L.) Cultivars

 , , ,
, , ,  and
and
Abstract
:1. Introduction
2. Materials and Methods
2.1. Plant Material
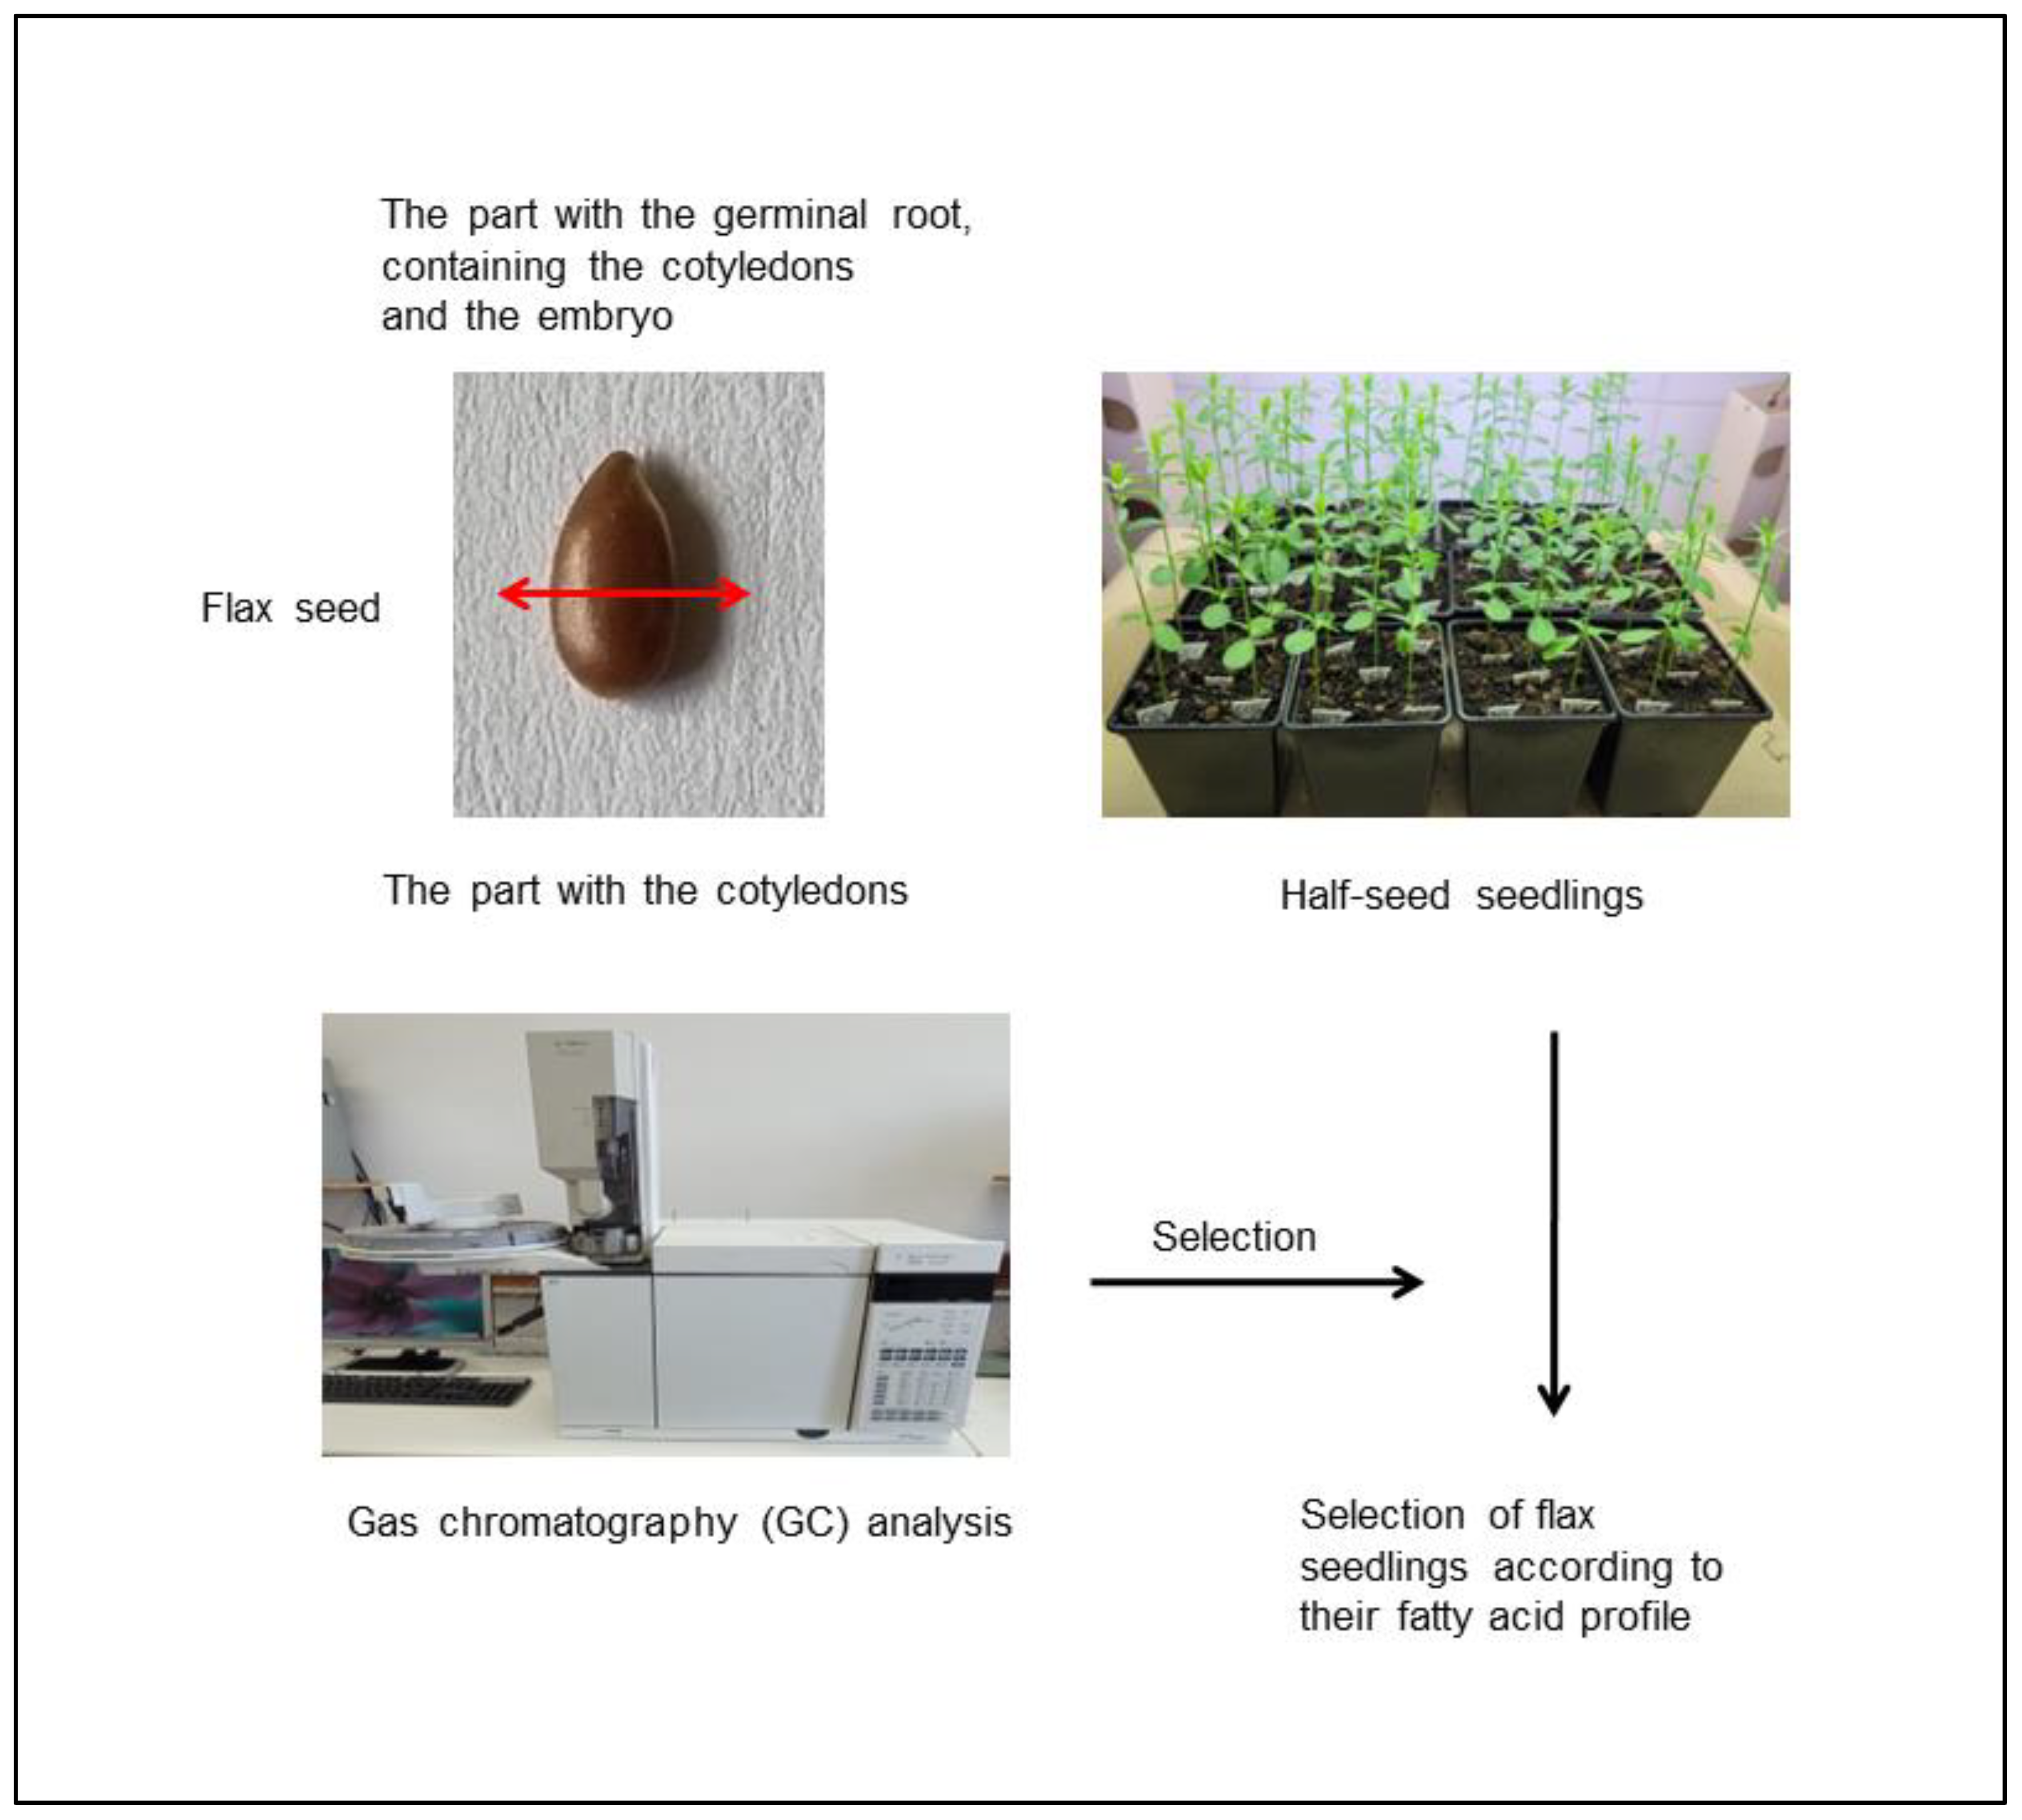
2.2. Half-Seed Method
2.3. Biochemical Analyses (Fatty Acids Composition)
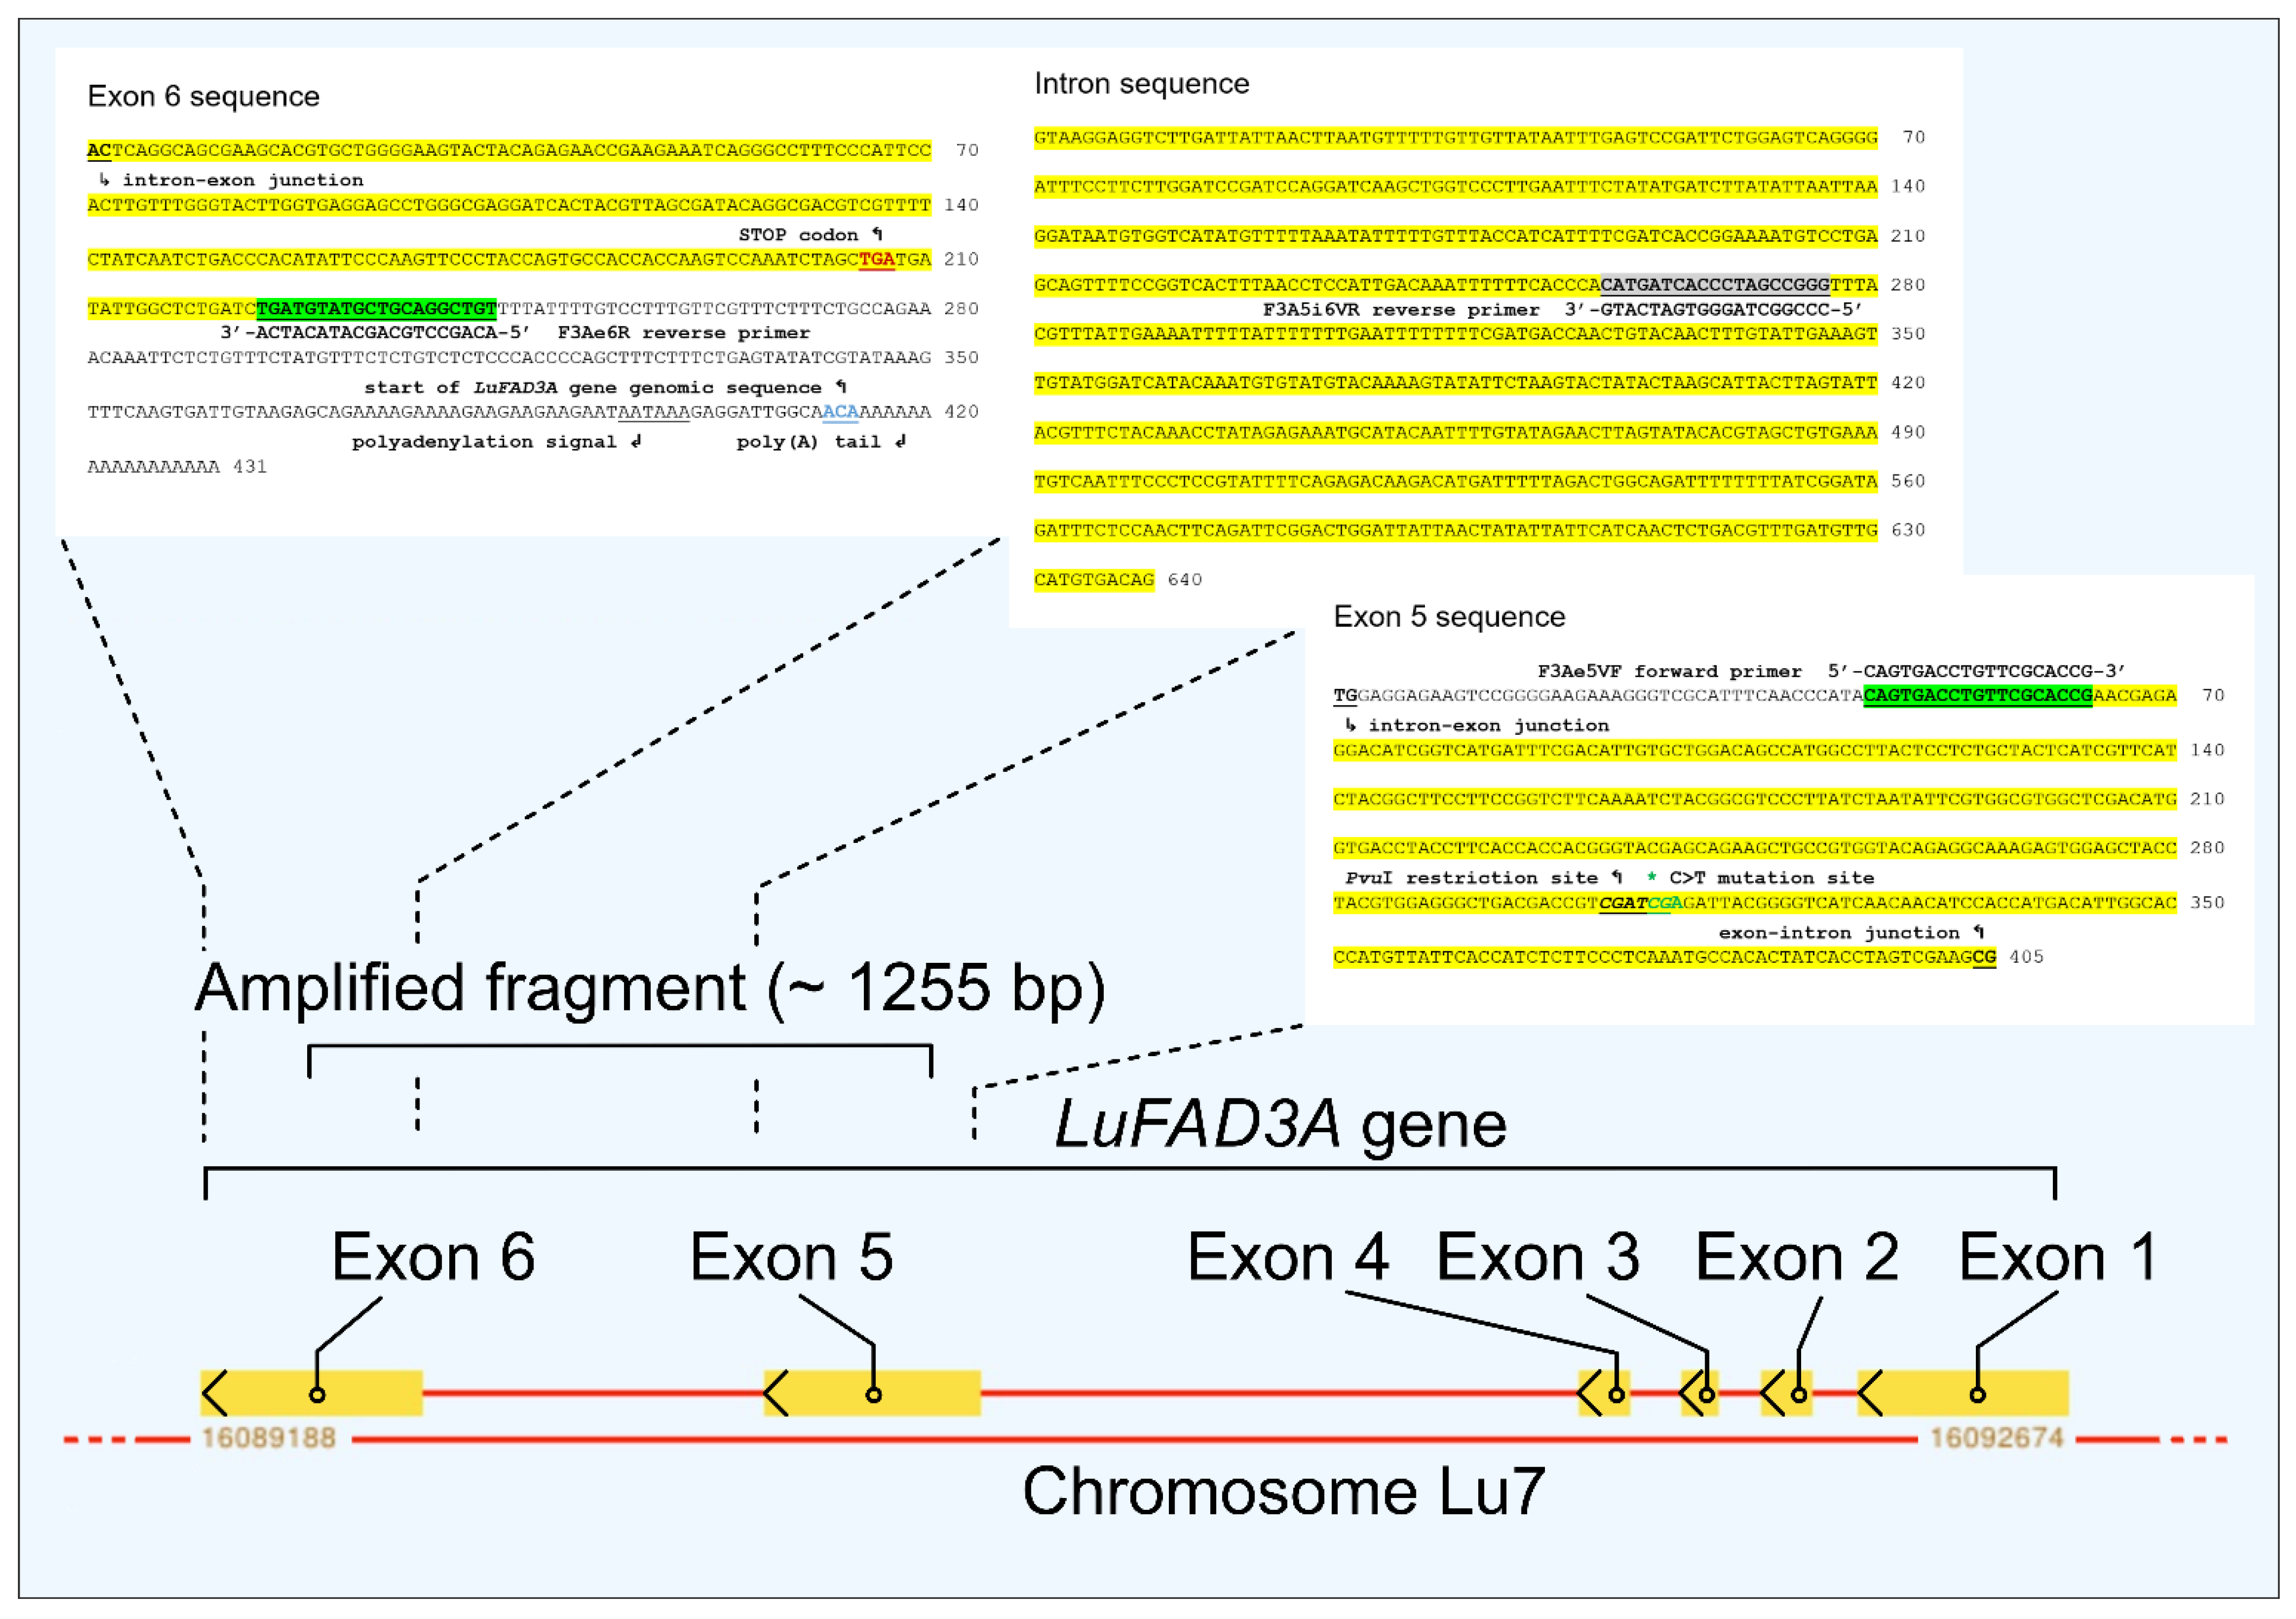
2.4. Molecular Marker Analyses
2.4.1. Extraction of DNA
2.4.2. CAPS Analyses
3. Results and Discussion
4. Conclusions
- Based on the present results, we can say that the previously described procedure for the CAPS marker can be used to analyze desaturase genes in flax.
- The presented markers can be successfully used to identify the Szafir cultivar and to distinguish this variety from the other five flax forms. Therefore, breeders may potentially use these CAPS markers for assurance of the Szafir cultivar or its offspring’s purity.
- Our results suggest that the previously identified mutation in the LuFAD3A gene resulting in inactive desaturase was absent in both forms of low linolenic flax that we studied (namely Linola KLA and Linola KLB), as well as in four other flax cultivars. Therefore, it must be noted that none of the CAPS markers described in this article can be used as an effective selection tool for breeding flax with low linolenic acid content in seeds.
Author Contributions
Funding
Institutional Review Board Statement
Informed Consent Statement
Data Availability Statement
Acknowledgments
Conflicts of Interest
References
- Coskuner, Y.; Karababa, E. Some physical properties of flaxseed (Linum usitatissimum L.). J. Food Eng. 2007, 78, 1067–1073. [Google Scholar] [CrossRef]
- Mueller, K.; Eisner, P.; Yoshie-Stark, Y.; Nakada, R.; Kirchhoff, E. Functional properties and chemical composition of fractionated brown and yellow linseed meal (Linum usitatissimum L.). J. Food Eng. 2010, 98, 453–460. [Google Scholar] [CrossRef]
- Bickert, C.; Lühs, W.; Friedt, W. Variation for fatty acid content and triacylglycerol composition in different Linum species. Ind. Crops Prod. 1994, 2, 229–237. [Google Scholar] [CrossRef]
- Bhatty, R.S. Nutrient composition of whole flaxseed and flaxseed meal. In Flaxseed in Human Nutrition; Cunnane, S.C., Thompson, L.U., Eds.; AOCS Press: Champaign, IL, USA, 1995; pp. 22–42. [Google Scholar]
- Morris, D.H. Flax—A Health and Nutrition Primer, 4th ed.; Flax Council of Canada: Winnipeg, MB, Canada, 2007; pp. 1–140. [Google Scholar]
- Heller, K.; Andruszewska, A.; Wielgusz, K. The cultivation of linseed by ecological methods. J. Res. Appl. Agric. Eng. 2010, 3, 112–116. [Google Scholar]
- Spasibionek, S. Genetic and breeding study of winter oilseed rape mutants (Brassica napus L.) with changed fatty acid composition. PBAI-NRI. Monogr. Diss. 2013, 47, 7–106. [Google Scholar]
- Vrinten, P.; Hu, Z.; Munchinsky, M.A.; Rowland, G.; Qiu, X. Two FAD3 desaturase genes control the level of linolenic acid in flax seed. Plant Physiol. 2005, 139, 79–87. [Google Scholar] [CrossRef] [PubMed] [Green Version]
- Konieczny, A.; Ausubel, F.M. A procedure for mapping Arabidopsis mutations using co-dominant ecotype-specific PCR-based markers. Plant J. 1993, 4, 403–410. [Google Scholar] [CrossRef]
- Rowland, G.G. An EMS-induced low-linolenic-acid mutant in McGregor flax (Linum usitatissimum L.). Can. J. Plant Sci. 1991, 71, 393–396. [Google Scholar] [CrossRef] [Green Version]
- Green, A.G.; Marshall, D.R. Isolation of induced mutants in linseed (Linum usitatissimum) having reduced linolenic acid content. Euphytica 1984, 33, 321–328. [Google Scholar] [CrossRef]
- Green, A.G. A mutant genotype of flax (Linum usitatissimum L.) containing very low levels of linolenic acid in its seed oil. Can. J. Plant. Sci. 1986, 66, 499–503. [Google Scholar] [CrossRef]
- Wang, Z.; Hobson, N.; Galindo, L.; Zhu, S.; Shi, D.; McDill, J.; Yang, L.; Hawkins, S.; Neutelings, G.; Datla, R.; et al. The genome of flax (Linum usitatissimum) assembled de novo from short shotgun sequence reads. Plant J. 2012, 72, 461–473. [Google Scholar] [CrossRef] [PubMed] [Green Version]
- Matuszczak, M.; Spasibionek, S.; Gacek, K.; Bartkowiak-Broda, I. Cleaved amplified polymorphic sequences (CAPS) marker for identification of two mutant alleles of the rapeseed BnaA.FAD2 gene. Mol. Biol. Rep. 2020, 47, 7607–7621. [Google Scholar] [CrossRef] [PubMed]
- Walkowiak, M.; Spasibionek, S.; Krótka, K. Variation and genetic analysis of fatty acid composition in flax (Linum usitatissimum L.). Euphytica 2022, 218, 2. [Google Scholar] [CrossRef]
- Jousse, C.; Schiltz, S.; Fournez, A.; Guillot, K.; Thomasset, B.; Gougeon, S.; Bourgaud, F.; Gontier, E. Rapid, cost-effective screening of flax genotypes to identify desirable fatty acid compositions. Electron. J. Plant Breed. 2010, 1, 1396–1404. [Google Scholar]
- Byczyńska, B.; Krzymański, J. Szybki sposób otrzymywania estrów metylowych kwasów tłuszczowych do analizy metodą chromatografii gazowej A quick way of receiving the methyl esters of fatty acids for analysis by gas chromatography). Tłuszcze Jadalne 1969, XIII, 108–114. (In Polish) [Google Scholar]
- Michalski, K.; Kołodziej, K.; Krzymański, J. Quantitative analysis of glucosinolates in seed of oilseed. Effect of sample preparation on analytical results. In Proceedings of the 9th International Rapeseed Congress, Cambridge, UK, 4–7 July 1995; Volume 1, pp. 6–8. [Google Scholar]
- Doyle, J.J.; Doyle, J.L. Isolation of plant DNA from fresh tissue. Focus 1990, 12, 13–15. [Google Scholar]
- Zhang, J.; Qi, Y.; Wang, L.; Wang, L.; Yan, X.; Dang, Z.; Li, W.; Zhao, W.; Pei, X.; Li, X.; et al. Genomic comparison and population diversity analysis provide insights into the domestication and improvement of flax. iScience 2020, 23, 100967. [Google Scholar] [CrossRef]
- Banik, M.; Duguid, S.; Cloutier, S. Transcript profiling and gene characterization of three fatty acid desaturase genes in high, moderate, and low linolenic acid genotypes of flax (Linum usitatissimum L.) and their role in linolenic acid accumulation. Genome 2011, 54, 471–483. [Google Scholar] [CrossRef]
- Thambugala, D.; Duguid, S.; Loewen, E.; Rowland, G.; Booker, H.; You, F.M.; Cloutier, S. Genetic variation of six desaturase genes in flax and their impact on fatty acid composition. Theor. Appl. Genet. 2013, 126, 2627–2641. [Google Scholar] [CrossRef] [Green Version]
- Rajwade, A.V.; Kadoo, N.Y.; Borikar, S.P.; Harsulkar, A.M.; Ghorpade, P.B.; Gupta, V.S. Differential transcriptional activity of SAD, FAD2 and FAD3 desaturase genes in developing seeds of linseed contributes to varietal variation in a-linolenic acid content. Phytochemistry 2014, 98, 41–53. [Google Scholar] [CrossRef]
- Rajwade, A.V.; Joshi, R.S.; Kadoo, N.Y.; Gupta, V.S. Sequence characterization and in silico structure prediction of fatty acid desaturases in linseed varieties with differential fatty acid composition. J. Sci. Food Agric. 2016, 96, 4896–4906. [Google Scholar] [CrossRef] [PubMed]
- Urla, R.; Kumar, P.P.; Sripadi, P.; Khareedu, V.R.; Vudem, D.R. Cloning of fatty acid desaturase-coding sequence (Lufad3) from flax and its functional validation in rice. Plant Biotechnol. Rep. 2017, 11, 259–270. [Google Scholar] [CrossRef]
- Dmitriev, A.A.; Kezimana, P.; Rozhmina, T.A.; Zhuchenko, A.A.; Povkhova, L.V.; Pushkova, E.N.; Novakovskiy, R.O.; Pavelek, M.; Vladimirov, G.N.; Nikolaev, E.N.; et al. Genetic diversity of SAD and FAD genes responsible for the fatty acid composition in flax cultivars and lines. BMC Plant Biol. 2020, 20, 301. [Google Scholar] [CrossRef] [PubMed]
- Arciga-Reyes, L.; Wootton, L.; Kieffer, M.; Davies, B. UPF1 is required for nonsense-mediated mRNA decay (NMD) and RNAi in Arabidopsis. Plant J. 2006, 47, 480–489. [Google Scholar] [CrossRef]


| Name | Type | Seed Colour | Origin |
|---|---|---|---|
| Szafir | Oil | Brown | Poland |
| Oliwin | Oil | Yellow | Poland |
| Linola KLA | Oil | Yellow | Canada |
| Linola KLB | Oil | Yellow | Canada |
| Escalina | Fiber | Brown | Netherlands |
| Modran | Fiber | Brown | Poland |
| Enzyme Name | Enzyme Source | Recognized Sequence | Buffer | Incubation Conditions |
|---|---|---|---|---|
| PvuI | New England BioLabs | 5′-CGAT↓CG-3′ | NEBuffer r3.1 | 37 °C |
| HindIII | Thermo Scientific | 5′-A↓AGCTT-3′ | R | 37 °C |
| BsuRI (=HaeIII) | Thermo Scientific | 5′-GG↓CC-3′ | R | 37 °C |
| Hin1II (=NlaIII) | Thermo Scientific | 5′-CATG↓-3′ | G | 37 °C |
| VspI (=AseI) | Thermo Scientific | 5′-AT↓TAAT-3′ | O | 37 °C |
| Tru1I (=MseI) | Thermo Scientific | 5′-T↓TAA-3′ | R | 65 °C |
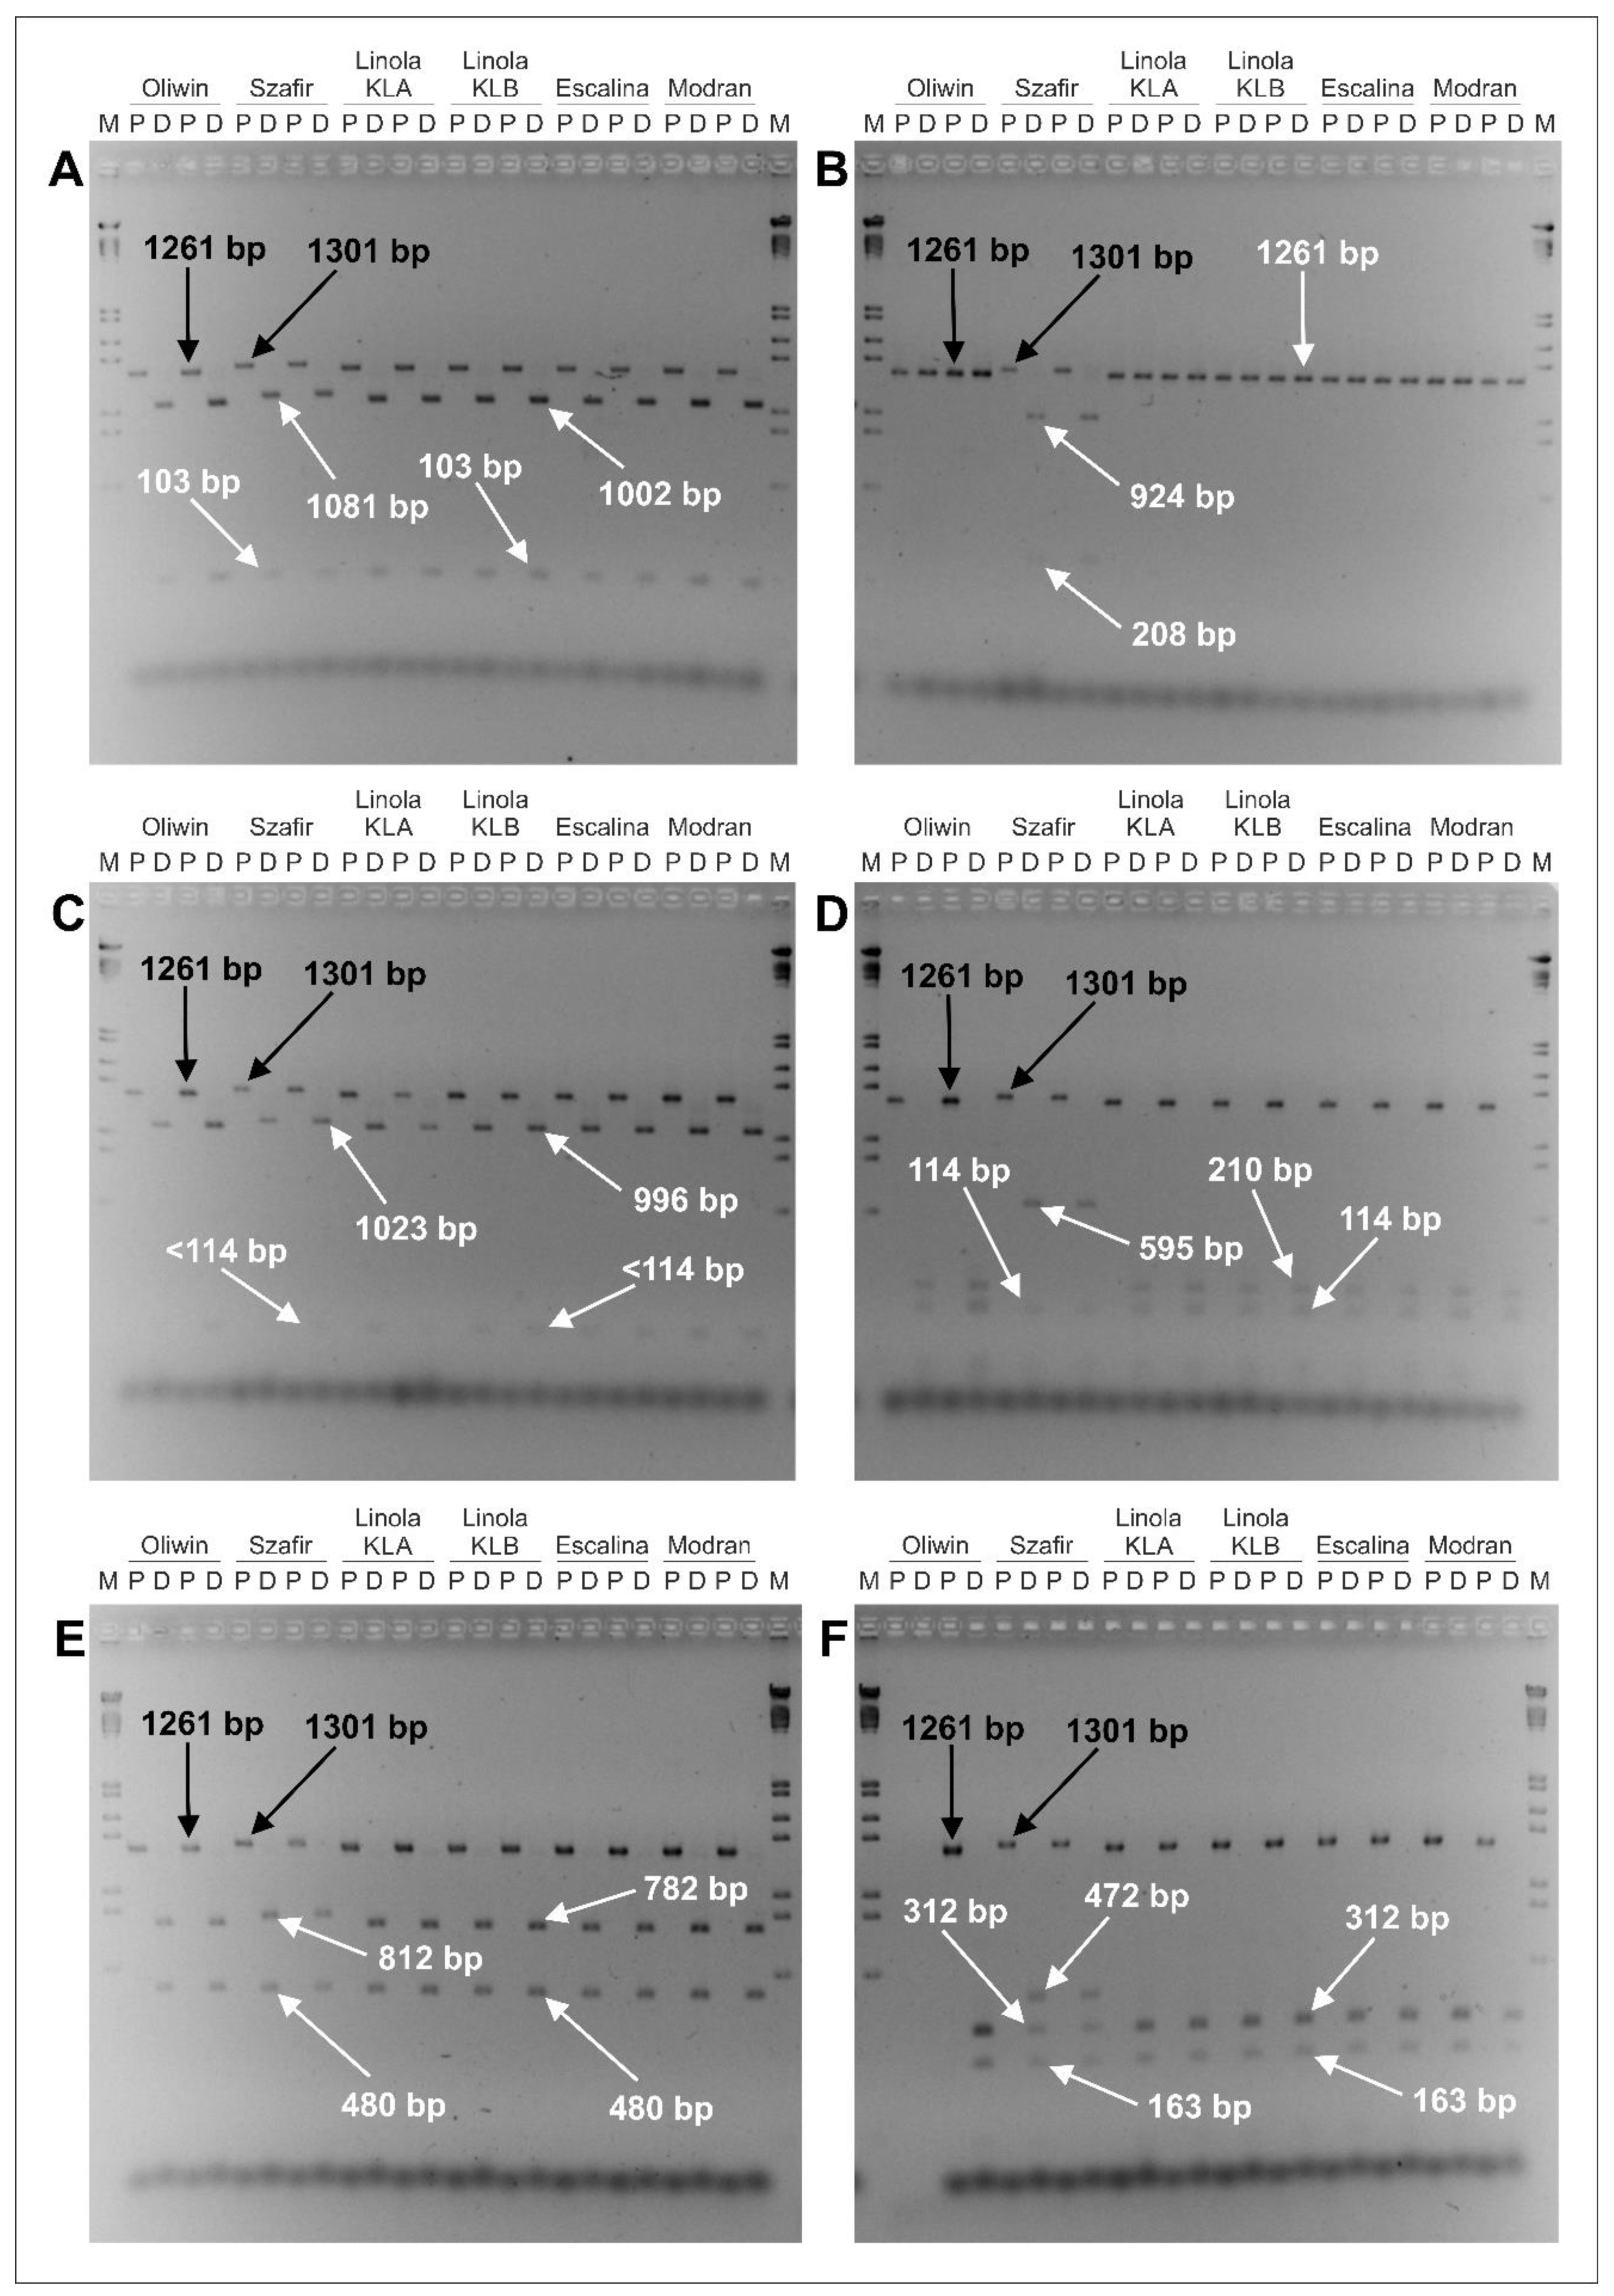
| Flax Cultivars | Estimated Size of the Amplified DNA Fragment (P Lane) | Restriction Enzyme | Estimated Sizes of DNA Fragments Obtained from the Digested Sample (D Lane) |
|---|---|---|---|
| Oliwin, Linola KLA, Linola KLB, Escalina, Modran | 1261 bp | PvuI | 1002 bp, 103 bp |
| HindIII | 1261 bp | ||
| BsuRI (=HaeIII) | 996 bp, <114 bp | ||
| Hin1II (=NlaIII) | 210 bp, 114 bp | ||
| VspI (=AseI) | 782 bp, 480 bp | ||
| Tru1I (=MseI) | 312 bp, 163 bp | ||
| Szafir | 1301 bp | PvuI | 1081 bp, 103 bp |
| HindIII | 924 bp, 208 bp | ||
| BsuRI (=HaeIII) | 1023 bp, <114 bp | ||
| Hin1II (=NlaIII) | 595 bp, 114 bp | ||
| VspI (=AseI) | 812 bp, 480 bp | ||
| Tru1I (=MseI) | 472 bp, 312 bp, 163 bp |
| Name | Oleic Acid C18:1 | Linoleic Acid C18:2 | α–Linolenic Acid C18:3 |
|---|---|---|---|
| Szafir | 24.7 | 11.0 | 54.6 |
| Oliwin | 18.8 | 14.4 | 57.6 |
| Linola KLA | 17.8 | 69.4 | 2.8 |
| Linola KLB | 18.4 | 68.7 | 2.7 |
| Escalina | 23.7 | 14.4 | 53.3 |
| Modran | 20.6 | 16.7 | 51.9 |
Publisher’s Note: MDPI stays neutral with regard to jurisdictional claims in published maps and institutional affiliations. |
© 2022 by the authors. Licensee MDPI, Basel, Switzerland. This article is an open access article distributed under the terms and conditions of the Creative Commons Attribution (CC BY) license (https://creativecommons.org/licenses/by/4.0/).
Share and Cite
Walkowiak, M.; Matuszczak, M.; Spasibionek, S.; Liersch, A.; Mikołajczyk, K. Cleaved Amplified Polymorphic Sequences (CAPS) Markers for Characterization of the LuFAD3A Gene from Various Flax (Linum usitatissimum L.) Cultivars. Agronomy 2022, 12, 1432. https://doi.org/10.3390/agronomy12061432
Walkowiak M, Matuszczak M, Spasibionek S, Liersch A, Mikołajczyk K. Cleaved Amplified Polymorphic Sequences (CAPS) Markers for Characterization of the LuFAD3A Gene from Various Flax (Linum usitatissimum L.) Cultivars. Agronomy. 2022; 12(6):1432. https://doi.org/10.3390/agronomy12061432
Chicago/Turabian StyleWalkowiak, Magdalena, Marcin Matuszczak, Stanisław Spasibionek, Alina Liersch, and Katarzyna Mikołajczyk. 2022. "Cleaved Amplified Polymorphic Sequences (CAPS) Markers for Characterization of the LuFAD3A Gene from Various Flax (Linum usitatissimum L.) Cultivars" Agronomy 12, no. 6: 1432. https://doi.org/10.3390/agronomy12061432
APA StyleWalkowiak, M., Matuszczak, M., Spasibionek, S., Liersch, A., & Mikołajczyk, K. (2022). Cleaved Amplified Polymorphic Sequences (CAPS) Markers for Characterization of the LuFAD3A Gene from Various Flax (Linum usitatissimum L.) Cultivars. Agronomy, 12(6), 1432. https://doi.org/10.3390/agronomy12061432