Article

Profiling the Diversity of Sweet Pepper ‘Peperone Cornetto di Pontecorvo’ PDO (Capsicum annuum) through Multi-Phenomic Approaches and Sequencing-Based Genotyping

1
CREA Research Centre for Vegetable and Ornamental Crops, Via Cavalleggeri 25, 84098 Pontecagnano, Italy
2
ARSIAL, Regional Agency for the Development and the Innovation of Lazio Agriculture, Via Rodolfo Lanciani 38, 00162 Roma, Italy
*
Author to whom correspondence should be addressed.
Agronomy 2022, 12(6), 1433; https://doi.org/10.3390/agronomy12061433
Submission received: 28 May 2022 / Revised: 13 June 2022 / Accepted: 14 June 2022 / Published: 15 June 2022
(This article belongs to the Special Issue Crop Landraces: Resources, Conservation, and Utilization)

Abstract

:
The sweet pepper (Capsicum annuum) ‘Peperone Cornetto di Pontecorvo’ is a prominent local variety at risk of genetic erosion cultivated in the Latium region (Italy). This horn-shaped landrace is recognized for its high digestibility due to the thinness of the skin and has been granted the Protected Designation of Origin (PDO) mark since 2010. Nowadays, different accessions are claimed as ‘Peperone Cornetto di Pontecorvo’ and no assay has been conducted to determine authenticity. In this study, 14 ‘Peperone Cornetto di Pontecorvo’ accessions and 7 similar horn-type peppers were investigated for their morpho-agronomic performance and chemical composition. Digital fruit imaging was implemented as a tool to pinpoint with high accuracy the morphometric parameters of berries. In total, 52 traits were scored. The multivariate analysis revealed different clusters that separated ‘Peperone Cornetto di Pontecorvo’ from similar types. The weight and size of fruits, as well as the content of soluble solids, were the most discriminating factors among the cultivars studied. Genomic fingerprinting was performed using ddRAD sequencing, yielding a total of a total of 120 million raw sequences and 2196 high-quality SNPs. Both Bayesian and hierarchical clustering analyses confirmed the existence of two different (K = 2) sub-populations separating ‘Peperone Cornetto di Pontecorvo’ accessions from similar types, thus highlighting a high membership (qi > 0.97) coefficient for accessions cultivated in the Pontecorvo area (Frosinone district). In addition, a direct relationship was found between the genetic diversity of cultivars and their geographical provenance, providing hints on the breeding history of local varieties in diverse rural areas. Genomic markers are revealed as a valuable tool to establish the uniqueness and distinctness of this local variety. This information will be very helpful for recovery, enhancement, and protection from possible imitations.

1. Introduction

Pepper (Capsicum spp.) is one of the most important vegetables in the world, widely recognized as an excellent source of bioactive compounds. Thanks to its broad phenotypic variability this crop is extremely versatile for several uses a as food and non-food product [1]. Originating in Mesoamerica, it is nowadays grown in all continental and tropical world areas on a total surface of 3.68 million hectares [2]. On a global scale, its production has continuously grown over the last two decades, with increases of 73% from 23.34 million tons in 2000 up to 40.29 million tons in 2021 (Chillies and peppers, dry and green) [2]. In Italy, the heterogeneity of agroclimatic conditions has favoured the establishment of landraces carefully selected for long centuries by expert farmers for the specific adaptation to local environments and according to cultural preferences. Thanks to policies for the promotion of sustainable use for agricultural resources and the attention given to the link between agro-food products and territory, there has been observed a growing incentive to rediscover, grow, and preserve traditional varieties [3].
Among the many Italian local varieties of pepper, ‘Peperone Cornetto di Pontecorvo’ (C. annuum) is a sweet variety native to the Latium area and characterized by an elongated-horn fruit shape, consistent pulp, and thinness of the skin, providing high digestibility as well as excellent organoleptic and cooking qualities [4,5,6]. This landrace has been recognised as an autochthonous genetic resource of the Latium region at risk of genetic erosion, following the Regional Law (1 March 2000, n° 15) issued to protect the local genetic resources of agricultural interest [7]. Since 2006, it has been registered in the Regional Voluntary Register, an official repertory managed by the ‘Regional Agency for the Development and Innovation of Agriculture of Lazio’, where the protected plant genetic resources are registered after obtaining favourable opinion by a Technical Scientific Commission [8]. The local variety is mostly grown in situ by farmers in the district of Frosinone, in the southern part of the region, and in 2010, the berries produced by the ‘Peperone Cornetto di Pontecorvo’ have obtained the Protected Designation of Origin (PDO) by the European Commission of Agriculture and Rural Development.
The PDO is a European mark aimed at preserving products that only originate in a specific place and whose quality and features are related to the environment in which they are cultivated [9]. The designation of PDO products, therefore, aims at preserving the origin, linking it to all processes occurring in a specific geographical area (e.g., cultivation, development, production), and using the know-how of local farmers [10,11]. To date, the area of production for ‘Peperone Cornetto di Pontecorvo’ mostly falls within the entire territory of the municipality of Pontecorvo and in part surrounding municipalities (e.g., Esperia, Piedimonte S. Germano, S. Giorgio a Liri, Pignataro Interamna, Villa S. Lucia, Aquino, Castrocielo, Roccasecca, and San Giovanni Incarico) of the Frosinone district of Latium. Although interest from farmers is extending the cultivation to other areas, there is a risk of genetic erosion due to the development of novel selections that could replace the original landrace and/or impact its genetic makeup. Therefore, there are actions ongoing aimed at recovering, characterizing, and preserving the existing varieties in the growing areas. So far, efforts to study the pepper ‘Peperone Cornetto di Pontecorvo’ have been performed at the biochemical level [4,5,6], whereas no investigations for its genomic fingerprinting are reported.
The availability of cutting-edge NGS (next-generation sequencing) platforms and the release of whole-genome sequences for crops accelerated the development of high-throughput genotyping methods [12]. Double-digest restriction-site-associated DNA (ddRAD-seq)—a genome complexity reduction method—allows discovery of thousands of single nucleotide polymorphisms (SNP), offering a valid option for the precise analysis of sequence variation in germplasm collections [13,14]. Sequencing-based genotyping allows the overcoming of pitfalls occurring with PCR-based marker systems (e.g., SSR) related to any constraints and artefacts in the ‘wet-lab’ procedures (e.g., missed amplification, inaccurate allele sizing, etc.) [15]. The potential of ddRAD-seq technology has been successfully confirmed in many species [13,14,16].
In this study, we profiled at the genomic and phenotypic levels, the existing panel of the ‘Peperone Cornetto di Pontecorvo’ landrace comparing it with highly spread similar landraces. A broad range of agronomic and morphological traits, including digital imaging were considered, whereas ddRAD-Seq was applied for SNP discovery. The approach presented in this study provides an opportunity for precisely assessing ‘Peperone Cornetto di Pontecorvo’ PDO, and thus for the enhancement and protection of landrace materials.

2. Materials and Methods

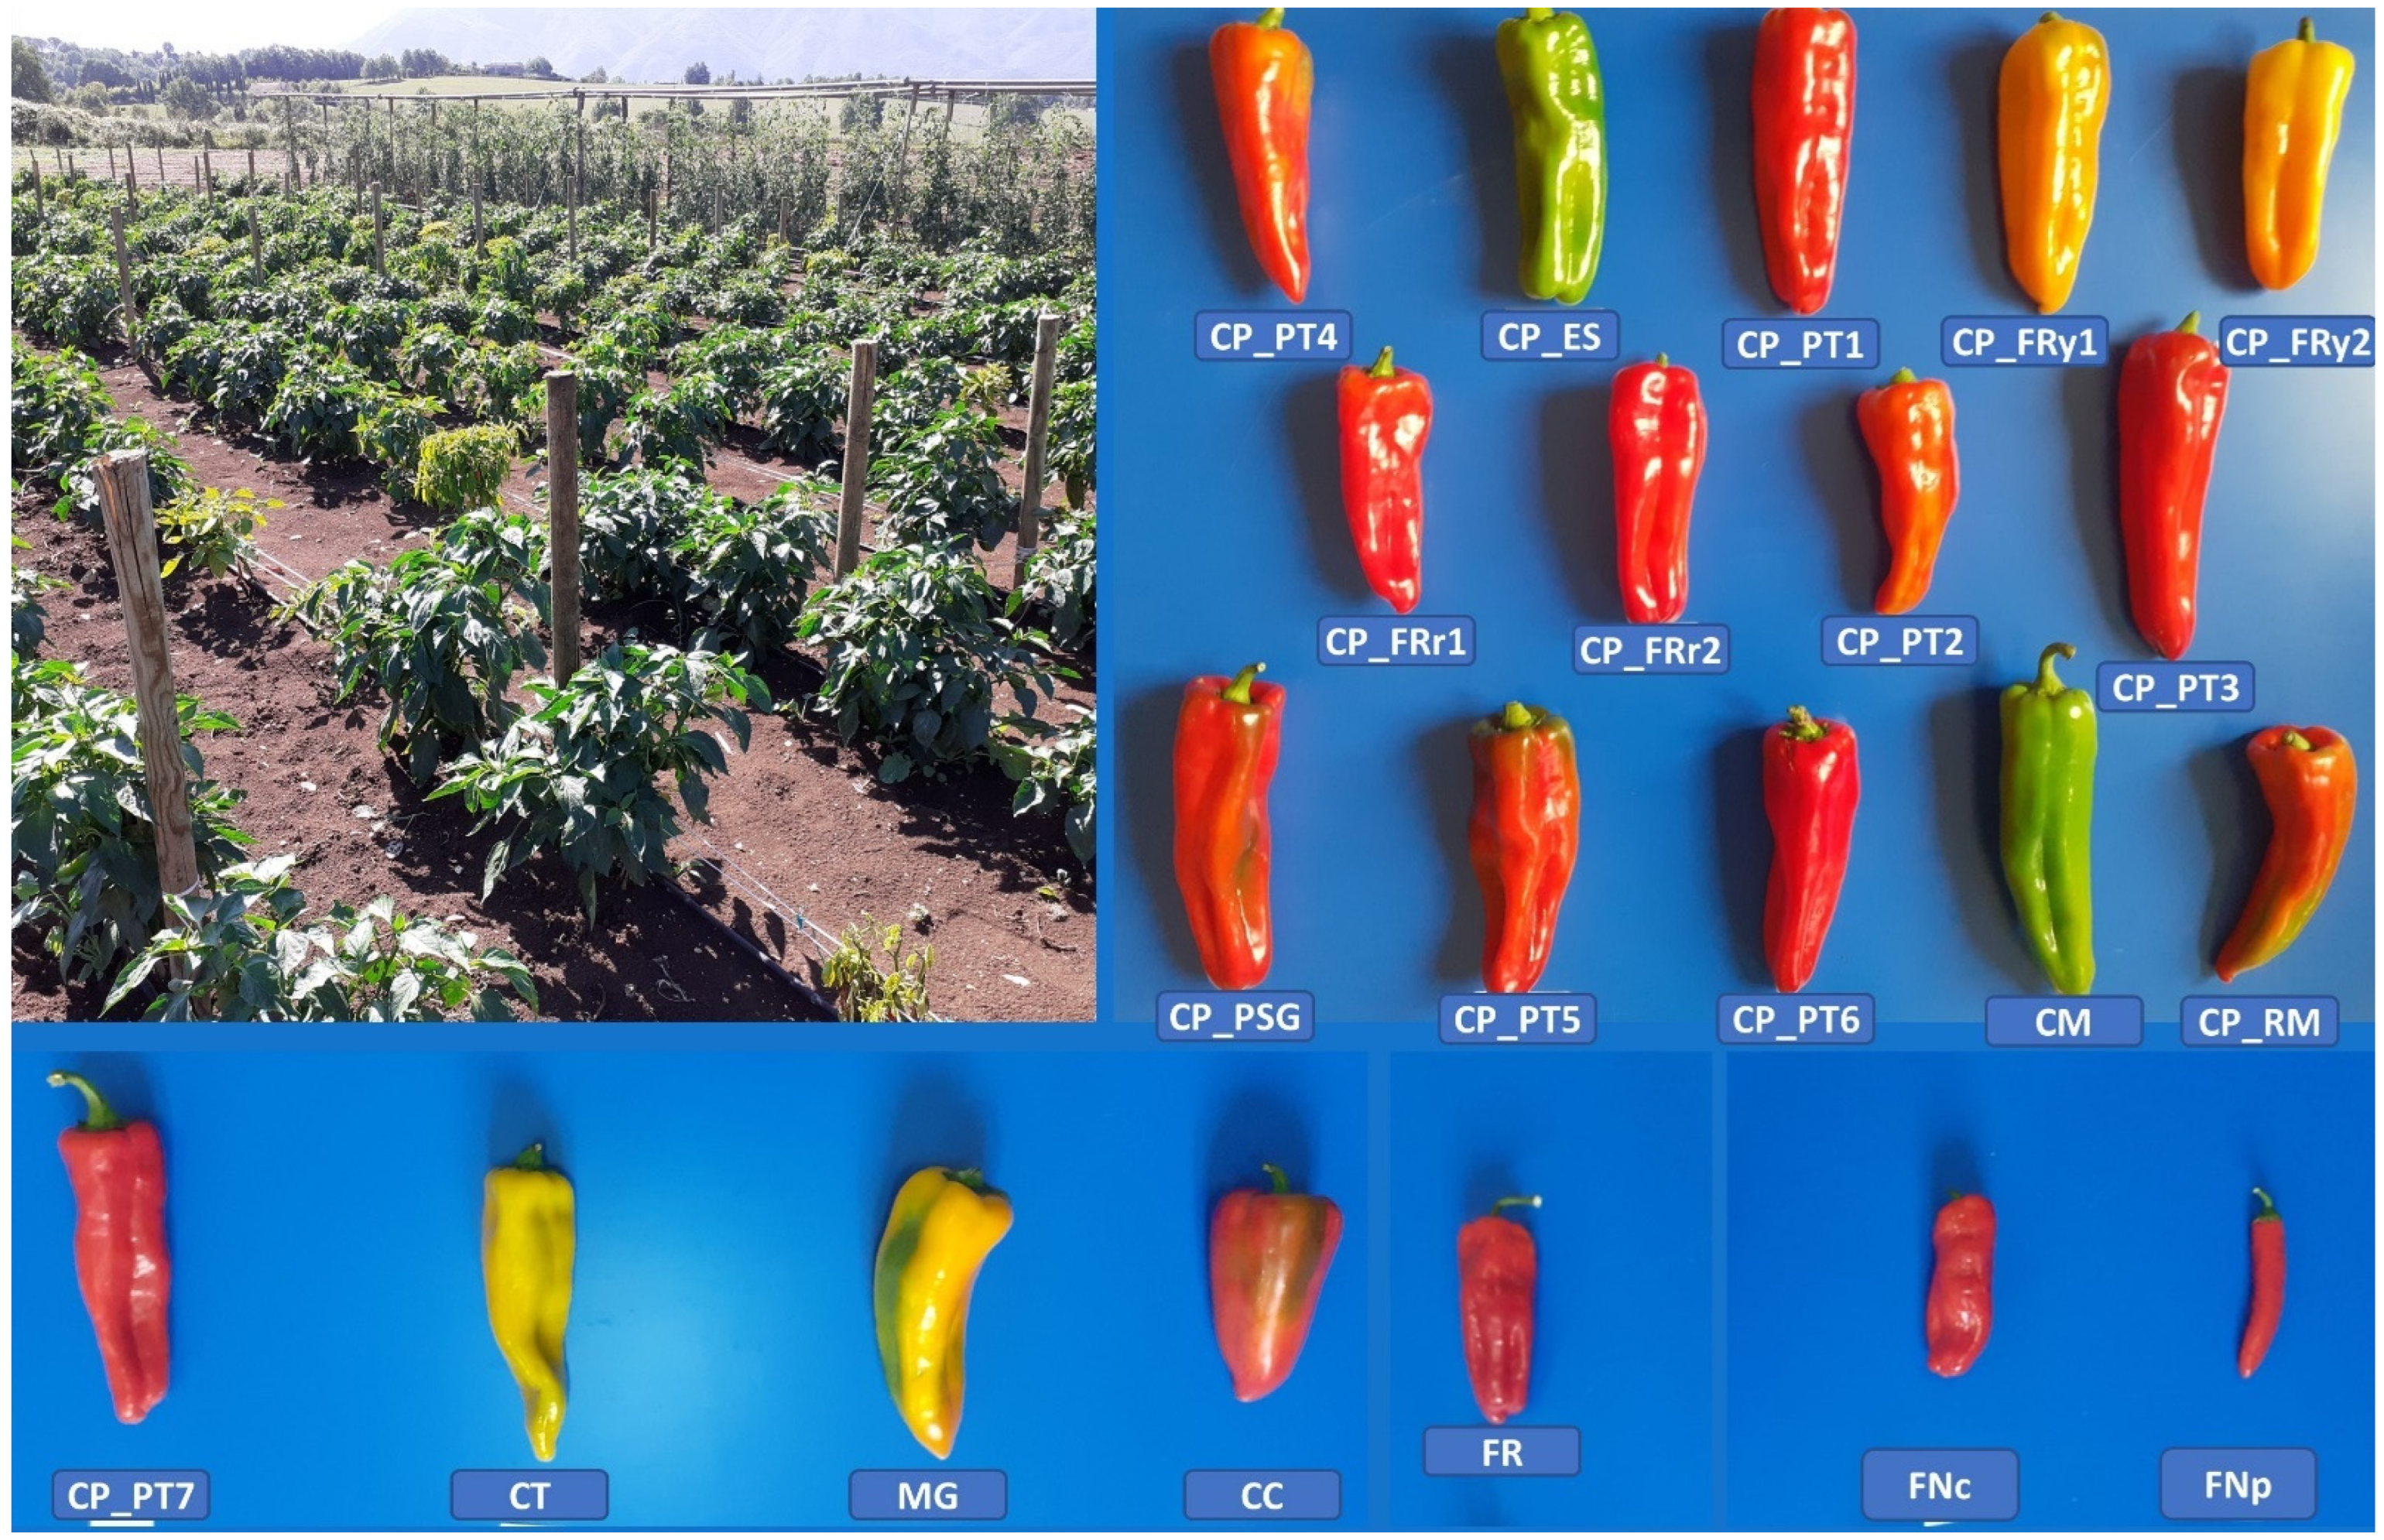
2.1. Plant Material and Field Trial

Plant material consisted of 14 accessions of the horn-shaped local variety ‘Peperone Cornetto di Pontecorvo’ (also known as ‘Peperone di Pontecorvo’ or ‘Cornetto di Pontecorvo’) (hereafter CP) retrieved from the main districts of the Latium (Lazio) Region (Central Italy) in the Frosinone, Latina, and Roma areas and representing the whole existing variability for the PDO. ARSIAL technicians collected seed samples offered by local farmers, who cultivate CP accessions and participate in the Conservation and Safety Network (established on 1 March 2000, n° 15) [8]: a tool for support in situ/on farm conservation, coordinated by ARSIAL. Seven similar sweet pepper types with horn shapes retrieved from the Campania and Piedmont (Piemonte) regions were also included for comparative analysis. All genetic materials provided by local consortiums and producer associations are maintained in long-term storage conditions by ARSIAL as part of the regional Conservation and Safety Network. Details of the accessions studied, and the area of cultivation are shown in Table 1.
Plants were grown in open field at the experimental research farm of the ARSIAL (Regional Agency for the Development and Innovation of Agriculture of Lazio) located in Alvito (Frosinone District) (41°41′ N 13°44′ E; 480 m above sea level) during spring–summer 2021 (Figure 1). Seeds were sown in April and seedlings transplanted in May in single rows, adopting distances of 100 cm between the rows and 50 cm along the rows. A full randomized experimental design with six replicates (viz. plants) for each genotype was used. Cultivation was managed according to standard agronomic practices; plants were irrigated throughout the entire cultivation period using a drip irrigation system and according to crop evapotranspiration. Basic fertilization and subsequent fertigation treatments were performed until fruit maturity.

2.2. Morpho-Agronomic Characterization

Two harvests were conducted in September and October. The agronomic and morphological traits scored were the following: total yield (grams) [TY], assessed as the total weight of fruits taken from each plant at full ripening and commercial status; average fruit weight (g) [FW], obtained by dividing the total yield by the number of fruits harvested for each plant; fruit length (cm) [FL], fruit width (cm) [FD], and pericarp thickness (cm) (PT), scored on a sample of 20 representative fruits/accessions using a caliper; fruit shape index [FS], as length/width ratio; and locule number (LN), counted visually after cutting fruits longitudinally.

2.3. Chemical and Fruit Colour Traits

For each accession, a bulk of 24 representative fruits (4 fruit plants) were sampled then washed and dried. Soluble solid content was measured using 0.5 mL of liquid extract with a digital refractometer (Refracto 30 PX, Mettler-Toledo, Novate Milanese, Italy). Titratable acidity and pH were measured with a pH-Matic 23 analyser titroprocessor equipped with a pH electrode including a temperature sensor (model 5011T) (Crison Instruments, Barcelona, Spain), using 10% (w/v) aqueous tomato extract and NaOH 0.1 M as titrating reagent. Titratable acidity was expressed as g citric acid/L juice. Fruit colour coordinates were measured by a CR-210 Chroma Meter (Minolta Corp., Osaka, Japan) on a sample of five fruits/accession/block. Measurement was conducted at the midpoint between the distal and the basal ends of the fruit and expressed as CIELAB (L, a*, b*) values. L indicates lightness/darkness (0 = black, 100 = white), a* describes intensity in green−red (where a positive number indicates redness and a negative number indicates greenness), and b* describes the intensity in blue−yellow (where a positive number indicates yellowness and a negative number indicates blueness). Chroma (C) was estimated by the a* and b* values following the formula [(a*)2 + (b*)2]0.5. Chroma indicates colour saturation.

2.4. Digital Imaging for Fruit Morphological Features

Fruit morphological features were measured by cutting fruits longitudinally and then scanning sections with a flatbed CanoScan LiDE 210 photo scanner (Canon, Tokyo, Japan) following the protocol previously described [17]. Thirty-eight quantitative descriptors, categorized into: fruit size (7), shape index (3), blockiness (3), homogeneity (3), proximal fruit end-shape (4), distal fruit end-shape (4), asymmetry (6), internal eccentricity (5), and latitudinal section (3), were automatically recorded. Points were adjusted manually when the software was unable to accurately identify the outline of a trait.

2.5. DNA Isolation

From each accession, four young leaves (100 mg) were harvested and lyophilized in 2 mL microcentrifuge tubes. Tissue disruption was carried out by adding 2 tungsten balls in each tube then placing them in grinding racks and grinding until fine powder using the Tissue Lyser II (Qiagen, Hilden, Germany) at 30 strokes per second for 30 s. Nucleic acid isolation was then performed using a NucleoSpin Plant II Mini kit (Macherey-Nagel GmbH & Co. KG., Düren, Germany). DNA concentration and quality were measured by absorbance at 260 and 280 nm, respectively, using both a UV-Vis spectrophotometer (ND-1000; NanoDrop, Thermo Scientific, Wilmington, DE, USA) and a Qubit 2.0 Fluorometer based on the Qubit dsDNA HS Assay (Thermo Fisher Scientific, Waltham, MA, USA). The DNA solution was then diluted to a working concentration with distilled water.

2.6. Double-Digest Restriction-Site-Associated (ddRad) DNA Sequencing

ddRAD was performed using 2 micrograms of genomic DNA following the pipeline developed at IGA technology services s.r.l (Udine, Italy). Briefly DNA was double digested using the MboI and SphI enzyme pair and incubated at 37 °C for 16–20 h. Fragmented DNA was then purified with AMPureXP beads (Agencourt) and ligated to barcoded adapters. Samples were pooled on multiplexing batches and bead purified. For each pool, targeted fragment distribution was collected on a BluePippin instrument (Sage Science Inc., Beverly, MA, USA). The gel-eluted fraction was amplified with oligo primers that introduced TruSeq indexes and subsequently bead purified. The resulting libraries were checked with both a Qubit 2.0 Fluorometer (Invitrogen, Carlsbad, CA, USA) and a bioanalyser DNA assay (Agilent Technologies, Santa Clara, CA, USA). Libraries were finally processed with Illumina cBot for cluster generation on the flow cell, following the manufacturer’s instructions and sequenced with V4 chemistry paired-end 2 × 125 bp mode on a HiSeq2500 instrument (Illumina, San Diego, CA, USA).

2.7. Alignment, Variant Calling, and SNP Filtering

Illumina reads were demultiplexed using the process_radtags utility included in the Stacks v2.0 software [18]. Trimming was then performed to remove low-quality adapters and bases. Alignment to the C. annuum CM334 reference genome (NCBI GCA_000512255.2) was conducted with Minimap2 software [19], while Sambamba software [20] was used to remove duplicates. Detection and genotyping of all the loci from the aligned reads was conducted using Freebayes [21] considering a mapping quality  > 10 and coverage = 6. A total of 23,405 SNPs were detected. Markers were then filtered using VCFtools [22], after applying a MAF 0.01 retaining loci that were represented in at least 80% of the population we selected 2196 high-quality SNPs that were used for downstream analysis.

2.8. Genomic Diversity Analysis

Population structure was determined using the parametric Bayesian model-based clustering method implemented in STRUCTURE v.2.4 [23]. We used admixture model analysis, assuming correlation among allele frequencies and the Markov chain Monte Carlo (MCMC) method for allele frequency estimation and identification of the best number of population (K). Runs were conducted using 50,000 burn-in cycles followed by 100,000 MCMC iterations, the number of sub-populations (K) ranging between 1 and 10 with five independent runs for each K. The most probable numbers of sub-populations were determined according to Evanno’s method using Structure Harvester [24]. Accessions were considered to belong to a specific sub-population if its membership coefficient (qi) was ≥0.50, whereas the genotypes with qi lower than 0.5 at each assigned K were considered as admixed. A maximum likelihood phylogenetic tree was built using the Tamura–Nei model with 1000 bootstraps. Analyses were conducted in MEGA X software [25]. Principal component analysis was performed in Tassel 5.0 and the biplot was drawn using the ggplot2 R package [26].

2.9. Data Analysis

All traits were subjected to multivariate analysis of variance (MANOVA) using IBM SPSS Statistics, version 25.0 (IBM Corp: Armonk, NY, USA) to determine the overall differences between accessions. Wilk’s lambda (unexplained variance rate) was applied for testing the significance of MANOVA. The normality of the residuals and residuals standardised was determined using both Kolmogorov–Smirnov and Shapiro–Wilk’s tests. The homogeneity of variances was checked by computing Bartlett’s test in R version 3.0.2 (R Development Core Team) [27]. For traits showing homogeneity of variance, means were compared using Tukey’s honestly significant difference test (p ≤ 0.05) using JMP version 7.0 (SAS Institute, Cary, NC, USA) in accordance with a completely randomised design. If the homogeneity of variance was violated, we separated groups by the Games–Howell post hoc test to reduce the Type I error in the case of heteroscedasticity. Coefficient of variation (CV) in percentage was expressed as the ratio of the standard deviation to the mean value multiplied by 100. Correlations across the genotypes for phenotypic traits were calculated using the Pearson test at p < 0.05 after Bonferroni’s correction for multiple comparisons. The correlogram was constructed and visualized using the Corrplot package implemented in R version 3.0.2 [28]. The relationship between phenotypic and molecular data matrices was computed by the Mantel test using Pearson’s r-value [29]. Principal component analysis (PCA) was used to determine which were the most effective descriptors in discriminating among accessions and visualizing the similarities among accessions. PCA was inferred using the computer package XLSTAT 2012.1 [30]. Hierarchical cluster analysis based on all scored traits was performed using the computer package XLSTAT 2012.1 [30]. Similarities between genotypes were estimated using Ward’s coefficient.

3. Results

3.1. Phenotypic Variability

The results of MANOVA analysis considering as factors: (a) the cultivar typology CP and similar horn types and (b) the 21 studied accessions, are reported in Table 2. In both instances, the statistical tests were significant.
In Table 3, the MANOVA results, and the parameters mean, minimum, maximum, and coefficient of variation (CV) for agronomic and qualitative related traits, specify the performance of CP and similar cultivars.
For the agronomic traits, highly significant differences (p < 0.001) between the two groups were found for the weight and length of fruits. Less stringent differences were instead found for fruit width and pericarp thickness (p < 0.01), as well as locule number (p < 0.05). Only total yield and fruit shape did not differ significantly between CP accessions and similar types. Contrary to this, for quality-related traits, highly significant differences (p < 0.001) were found only for soluble solid content, whereas the remaining traits did not show any significant statistical differences. On average, CP cultivars were characterized by elongated fruits with a higher weight and greater thickness of the pericarp compared with similar types.
On the contrary, the soluble solid content was lower on average, whereas the remaining qualitative parameters were almost similar between the two groups. A total of 10 image sections for each accession were analysed for 38 digital size and shape parameters. Highly significant differences (p < 0.001) were observed for 8 out of the 38 traits (Table 4), including all fruit size descriptors with exception of width mid-height, distal fruit blockiness and proximal angle micro.
Only internal eccentricity and latitudinal section attributes did not show any significance. Digital fruit descriptors were on average greater in CP accessions, except for fruit shape triangle and proximal angle macro. As observed for manually scored traits, CP genotypes were characterized by a larger fruit size, whereas the fruit shape parameters were almost similar between the two categories under study or showed minimal differences. Digital fruit imaging allowed a better assessment of fruit size and shape parameters by considering the most extreme points of the fruit, and by accurately determining the dimensions of both the longitudinal and transverse axes. For all traits, the normality of residuals has been calculated considering both the Kolmogorov–Smirnov and Shapiro–Wilk tests (Table S1). In total, 34 out of the 52 scored traits had a significant p-value (p < 0.05) within both tests, and 6 using only one of the two tests. The results of homogeneity test of variance using Bartlett’s test are in Table S2. Forty traits rejected the null hypothesis showing a non-homogeneity of variance. Post hoc analysis for traits showing both homogeneity and non-homogeneity of variance was performed according to Tukey’s (Table S3) and Games–Howell’s tests (Table S4), respectively. Means and standard deviations for all scored traits in the 21 pepper accessions are reported in Table S3.

3.2. Agronomic, Morphological and Qualitative Performances

In the set studied, the highest yielding accession was CP_PT7, with 2.03 Kg per plant, the remaining accessions showed a total yield lower than 2 Kg/plant (Table S3). The highest average fruit weight was found in CP_FRy1 (148.73 g), with all CP accessions exhibiting a FW above 100 g. On the contrary, the similar types had a greater variability in fruit weight, ranging from 102.56 g (MG) to values below 40 g in FNc, FNp, and FR. Fruit length and width reached the highest values in CP_PT1 (17.33 cm) and CM (5.75 cm), respectively, and the lowest for both measurements in FNp (FL 7.72 cm and FD 1.78 cm, respectively). Overall, a greater variation in the two parameters was found in the similar types, as shown by the shape index of the fruit. All CP fruits were characterized by a consistent pericarp with average values above 4 cm and peaks of 5.72 cm in CP_FRy1, whereas only CC, CM, and MG displayed values above 4 cm within the similar types. Both typologies showed a similar number of locules. Imaging analysis corroborated the manually based morphological assessment; PT1 showed the largest perimeter and fruit-height-related parameters (height mid-width, maximum height, curved height) (Table S3), whereas FNp evidenced the smallest values. The maximum values of width mid-height and maximum width were instead found for MG. The fruit shape index, as the FL/FD ratio, was always found to be higher than the fruit shape index external I, except for CP_FRr2 and CM. On the contrary, the curved fruit shape index was higher than FS in all instances with some exceptions (CP_FRr2, CP_PT3, CP_RM, and FR). Different trends have been observed for fruit shape index external II. Linear regressions between manual and digital descriptors highlighted a higher correlation between length measures compared with the width and shape ones (Figure S1), thus suggesting how imaging is more appropriate for determining these two latter fruit morphology parameters. Indeed, the manual assessment provides the overall size of berries without taking into account the curvature of the fruit and the different diameters occurring at the middle point (equidistant from apex to base) and at the apical part of fruit (see Figure 1).
Among chemical traits, the soluble solid content was on average lower than 7.0 °Brix in CP types with values ≥6.50 °Brix only in CP_FRr1 and CP_FRy2. The highest values were instead found in the similar types (Table 3 and Table S3), with a peak of 9.13 °Brix in FNp. Total acidity and pH were similar among the studied genotypes. We observed values of acidity ranging from 21% (CP_FRr1) to 11% (CP_PT3 and CT), with an average of 17%. pH values were above 5.00 in all accessions except for CM (pH = 4.84). CIELab coordinates did not reveal substantial differences between the values in the same range in the red and yellow types.

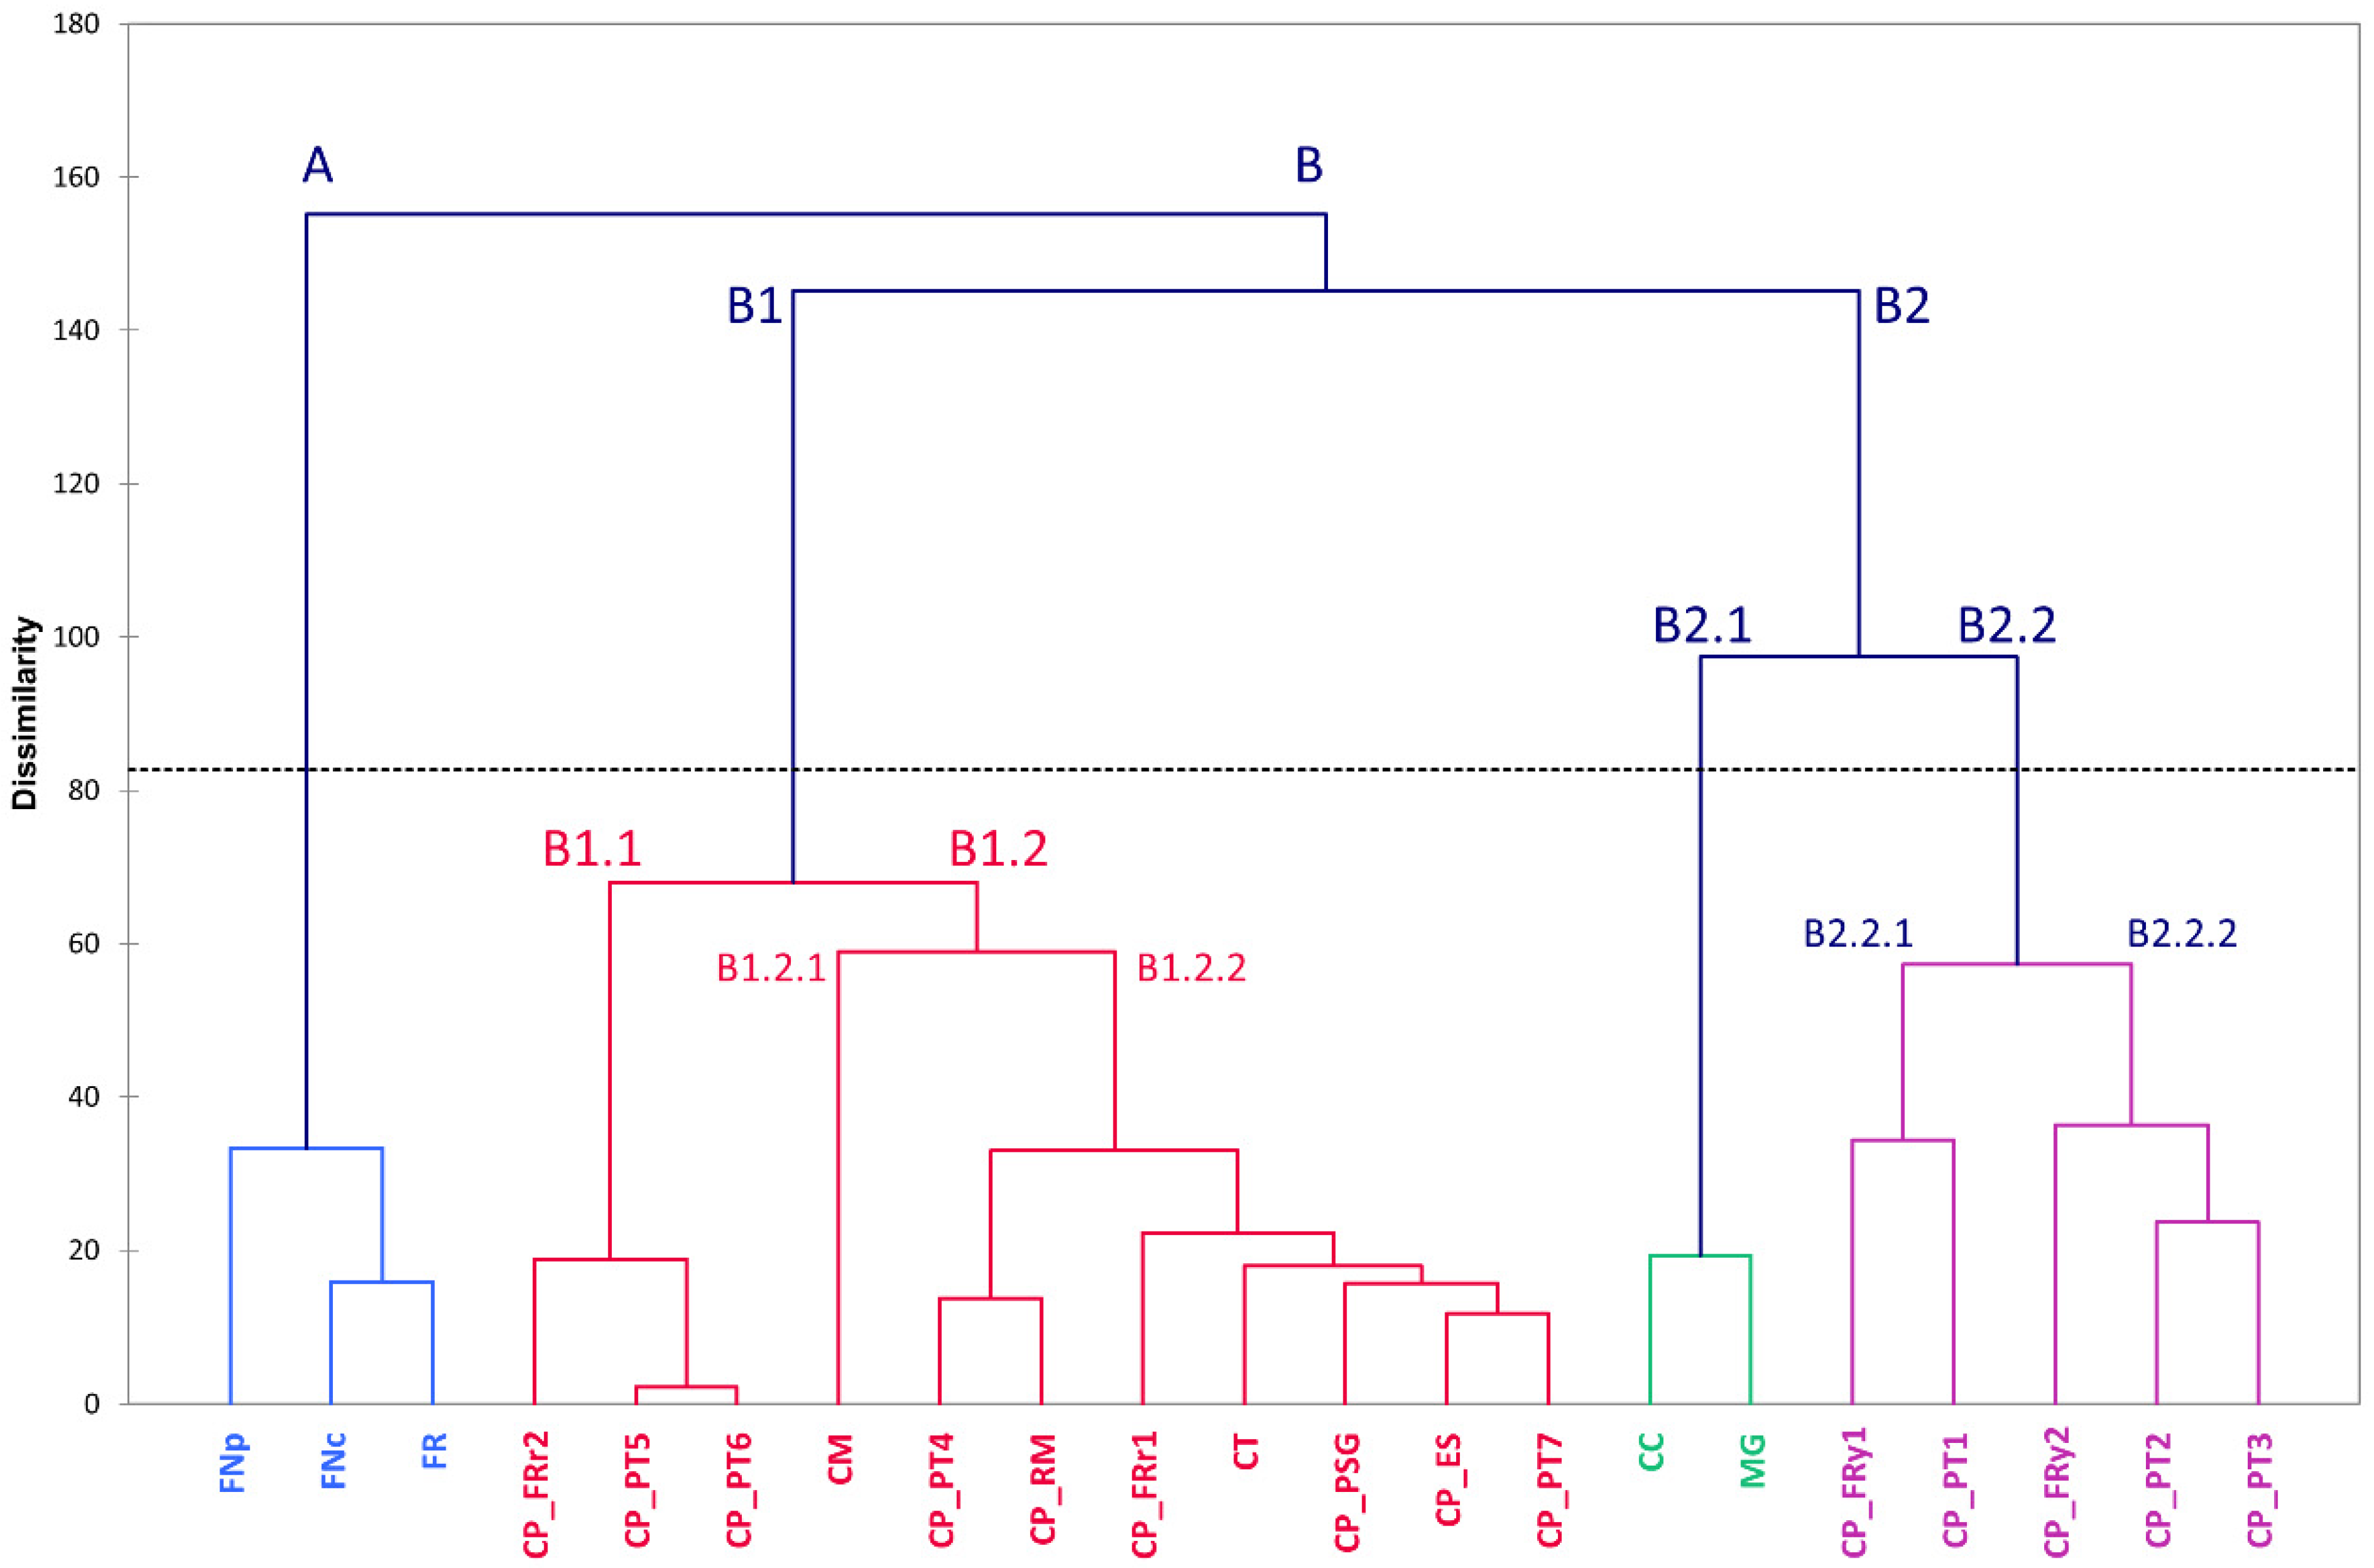
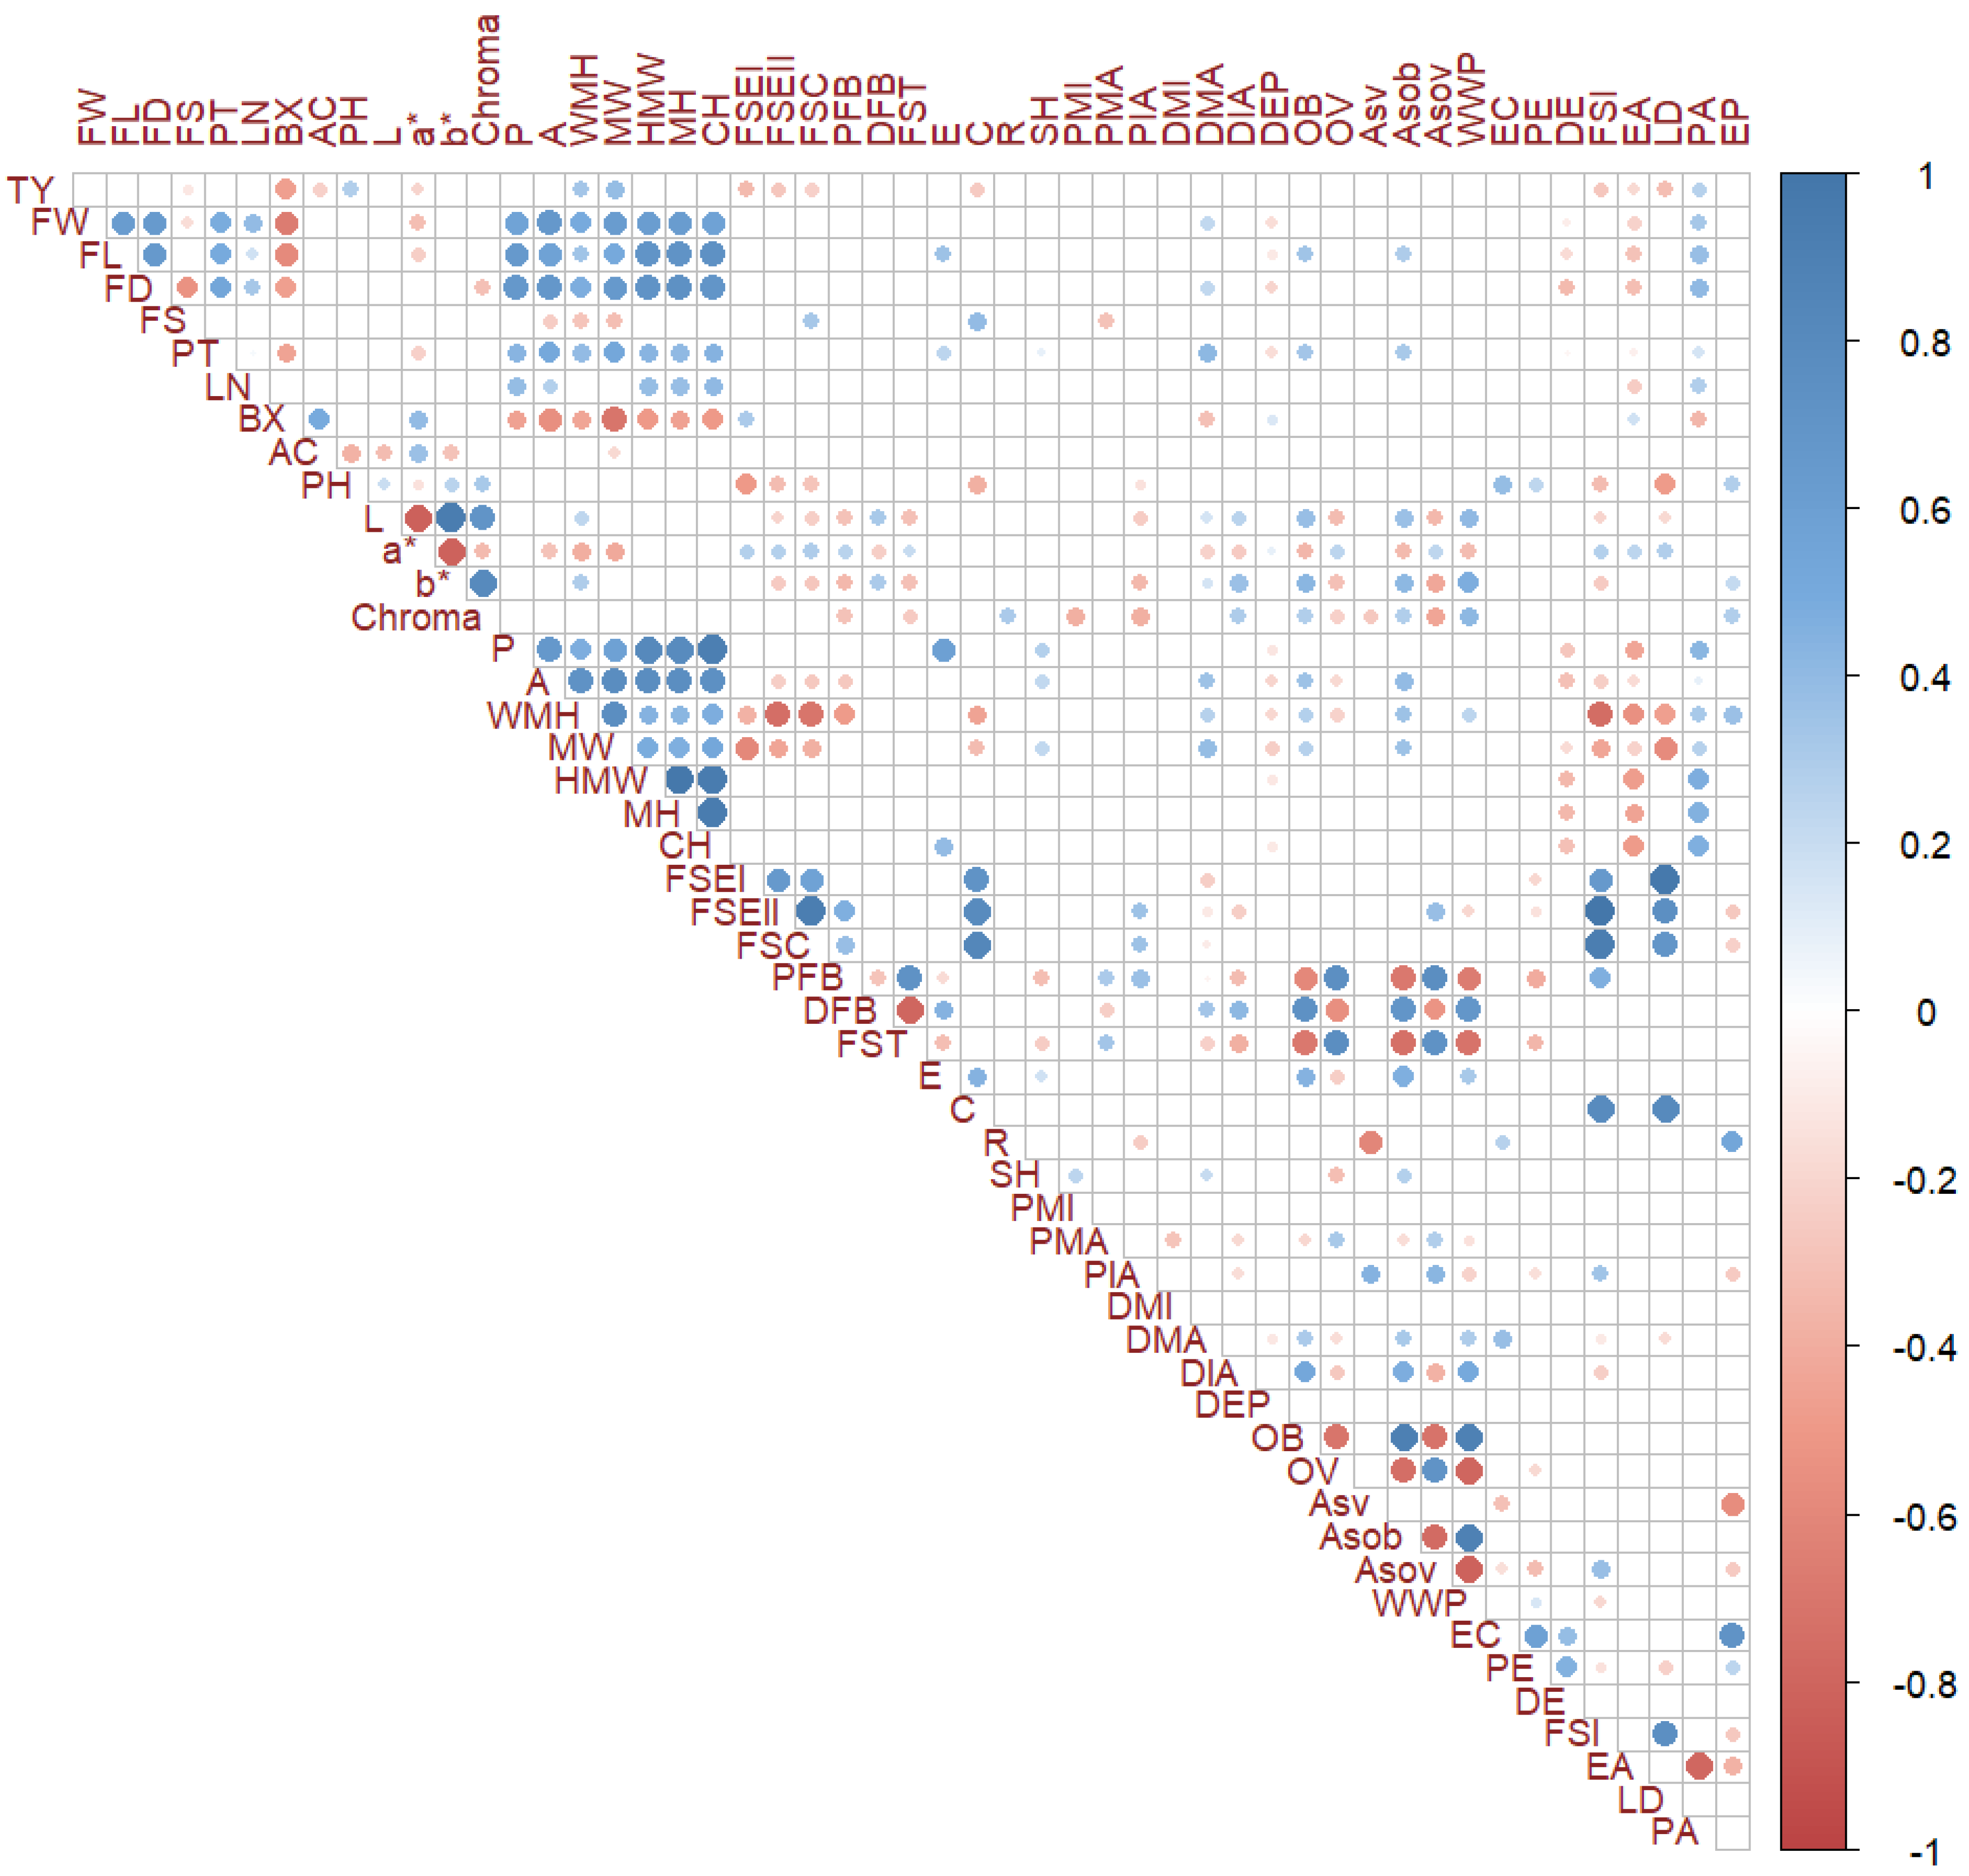
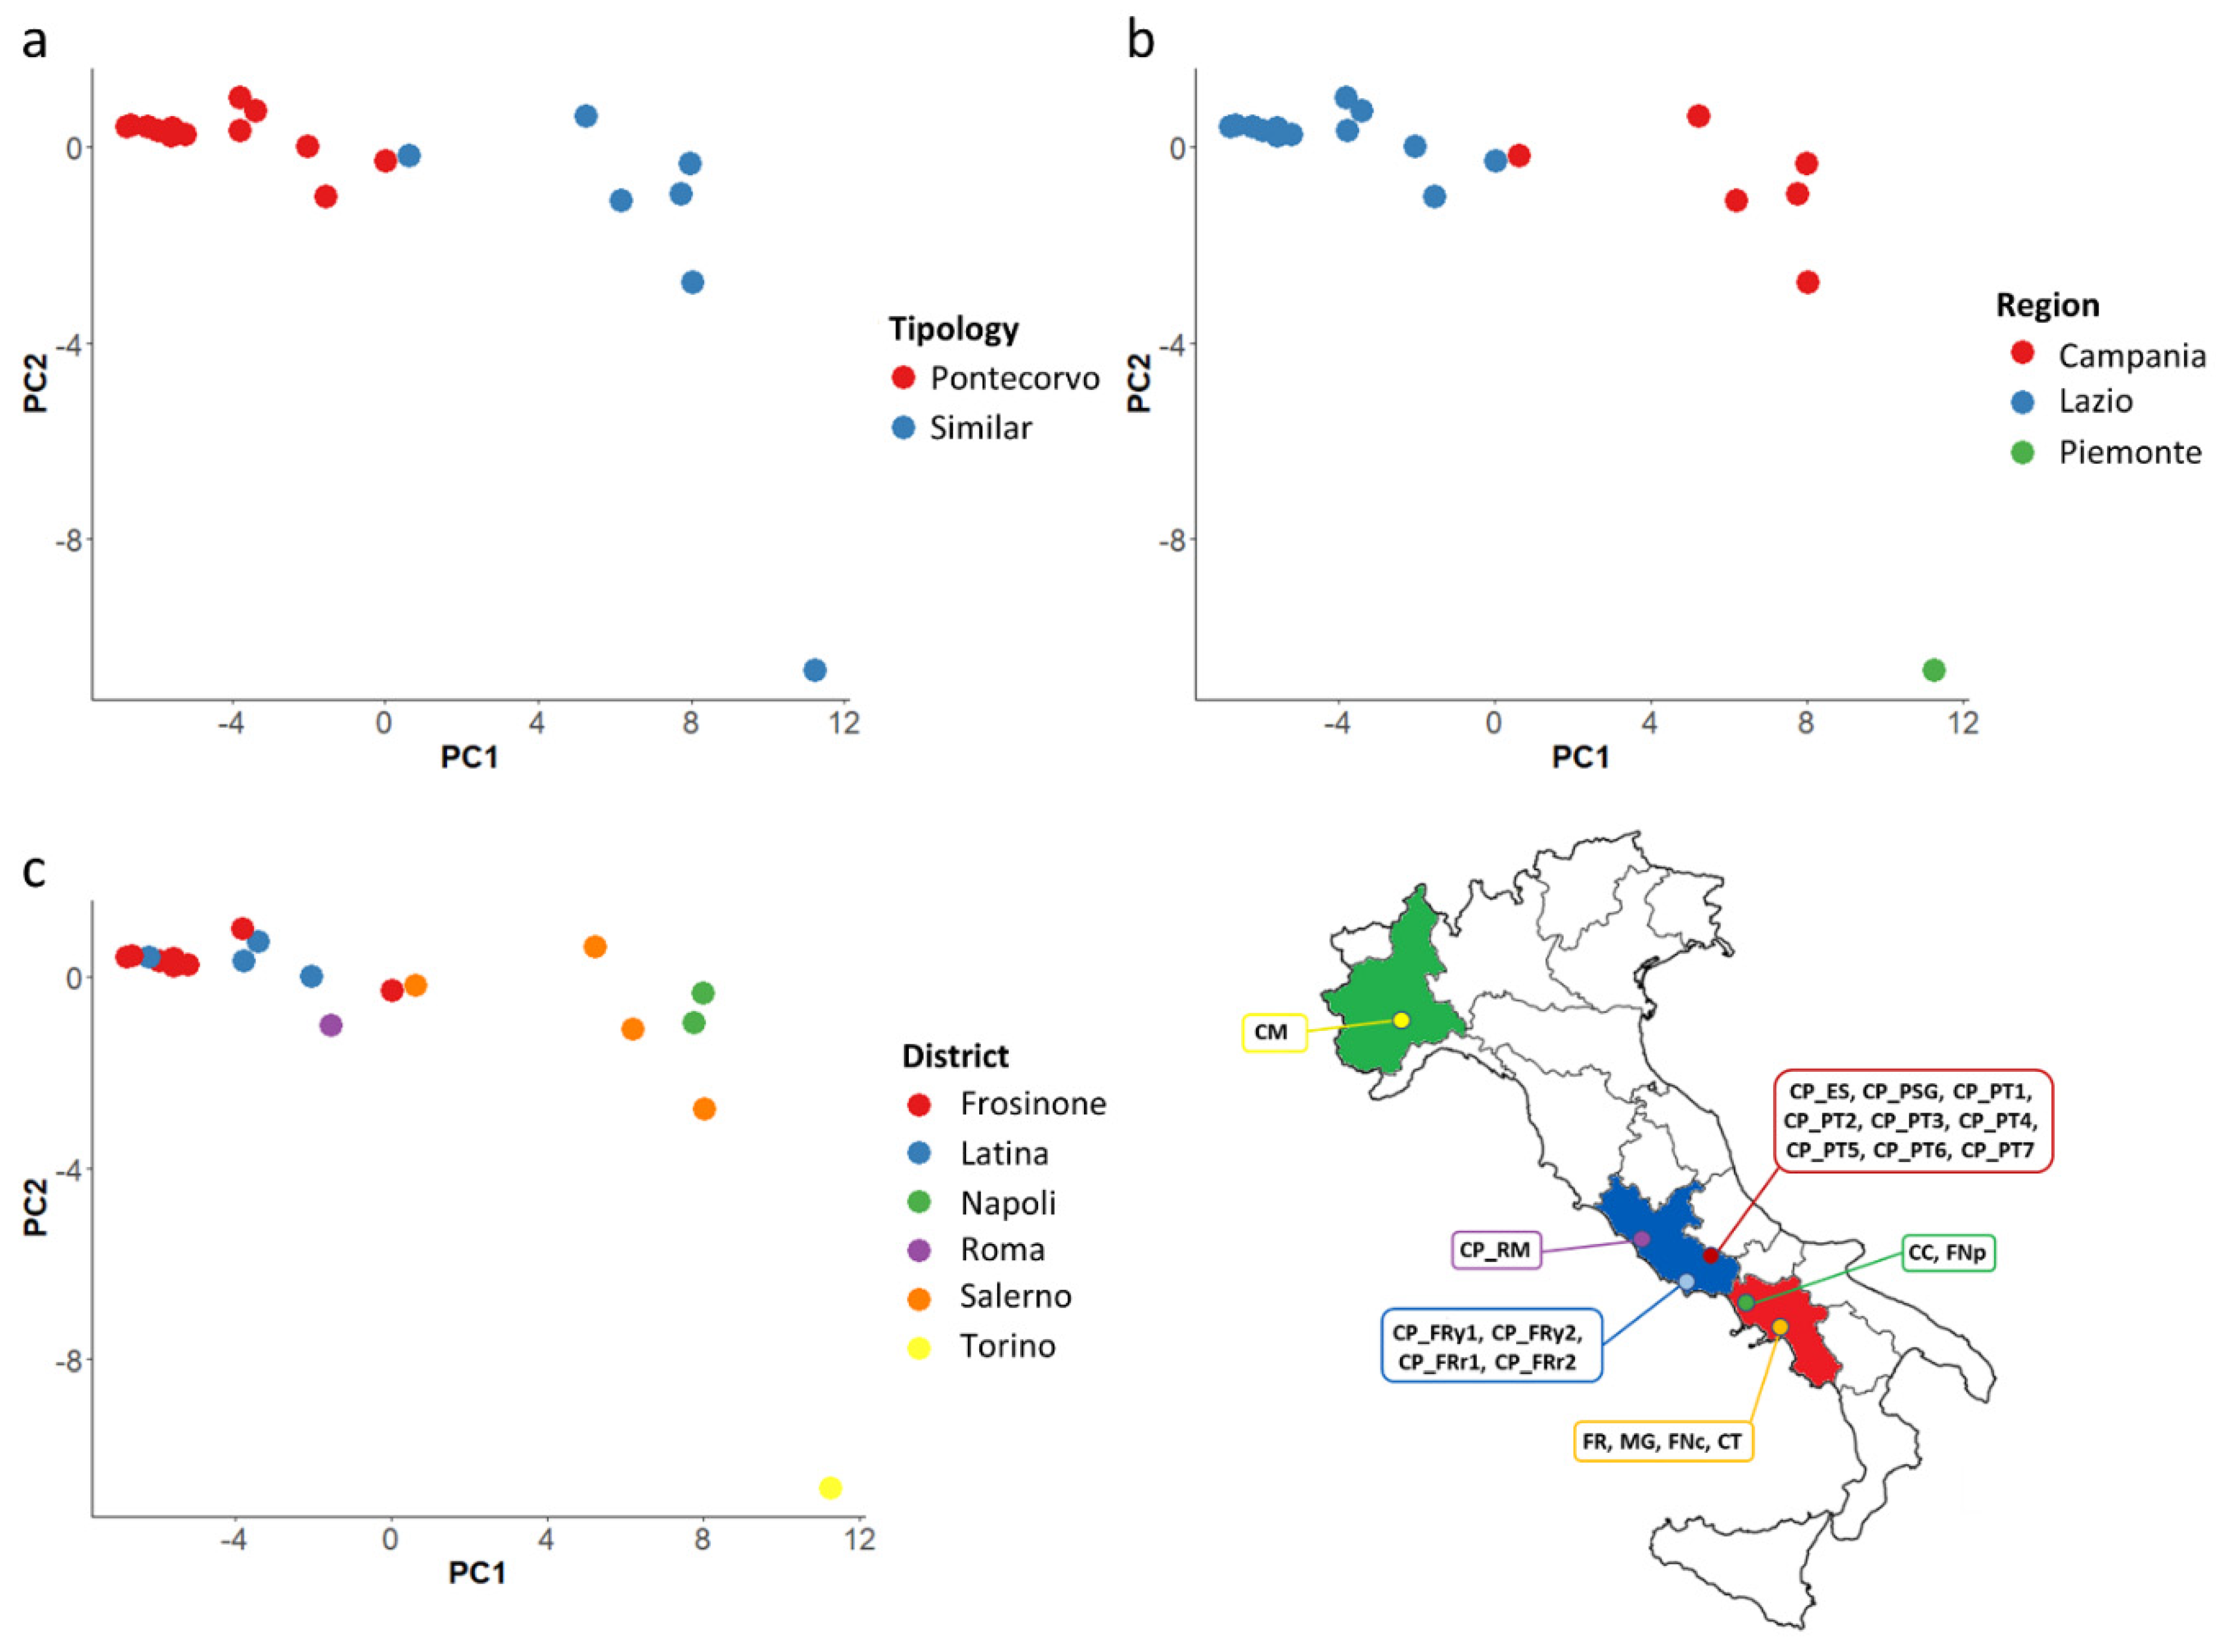
3.3. Multivariate Analysis and Correlations between Traits

The PCA in the first two dimensions for the 52 scored traits, revealed 41.54% of the total variance (Figure 2). CP accessions were evenly distributed in all parts of the graph except for the negative section of both the first and second axes. On the contrary, the similar types were not distributed on both negative and positive sections of the first and second axes (Figure 2a).
The first component, which explained the 23.21% of the total variance, was positively correlated with agronomic and morphological traits except for FS, pH, L, and b*, and negatively correlated with soluble solid content, acidity, a*, and chroma. The second component, which explained the 17.05% of the total variance, was positively correlated with manually based morphological traits excluding pericarp thickness and fruit shape, acidity, and a*, and negatively correlated with the remaining morpho-agronomic and chemical parameters. Digital fruit descriptors were mingled on both axes, among these, fruit size and homogeneity traits were placed on the positive axis of the first component, whereas fruit shape index descriptors were on the negative one. Area and H. Asymmetry.ov were the main factors discriminating the genotypes under study accounting for 5.96% and 6.11% of the total variation of the first and second component, respectively (data not shown). Hierarchical cluster analysis generated a dendrogram in which the genotypes were separated into two main groups (Figure 3): the first (A) included the two friariello types (FNp and FNc) and the friggitello (FR) from the Campania region. The second (B) was subdivided into two clusters: the former (B1), which grouped three CP accessions (CP_FR2, CP_PT5, CP_PT6) on one side (B1.1) and six (CP_PT4, CP_RM, CP_FR1, CP_PSG, CP_ES, CP_PT7) plus two similar types, CT and CM, on the other (B1.2). The second main cluster (B2) was subdivided into two subgroups: B2.1, including only the two similar types, CC and MG and B2.2, which was subdivided into B2.2.1, comprising the accessions CP_FRy1 and CP_PT1, and B2.2.2, with the genotypes CP_FRy1, CP_PT2, CP_PT3.
Significant correlation between pairs of variables mostly occurred among the same group of characters phenotyped (Figure 4). Between the different categories of traits, we found a negative correlation between soluble solid content and total yield, fruit weight, and fruit size parameters, and a positive correlation between pericarp thickness and fruit size descriptors. A slight negative correlation was also found between total yield and fruit shape traits.

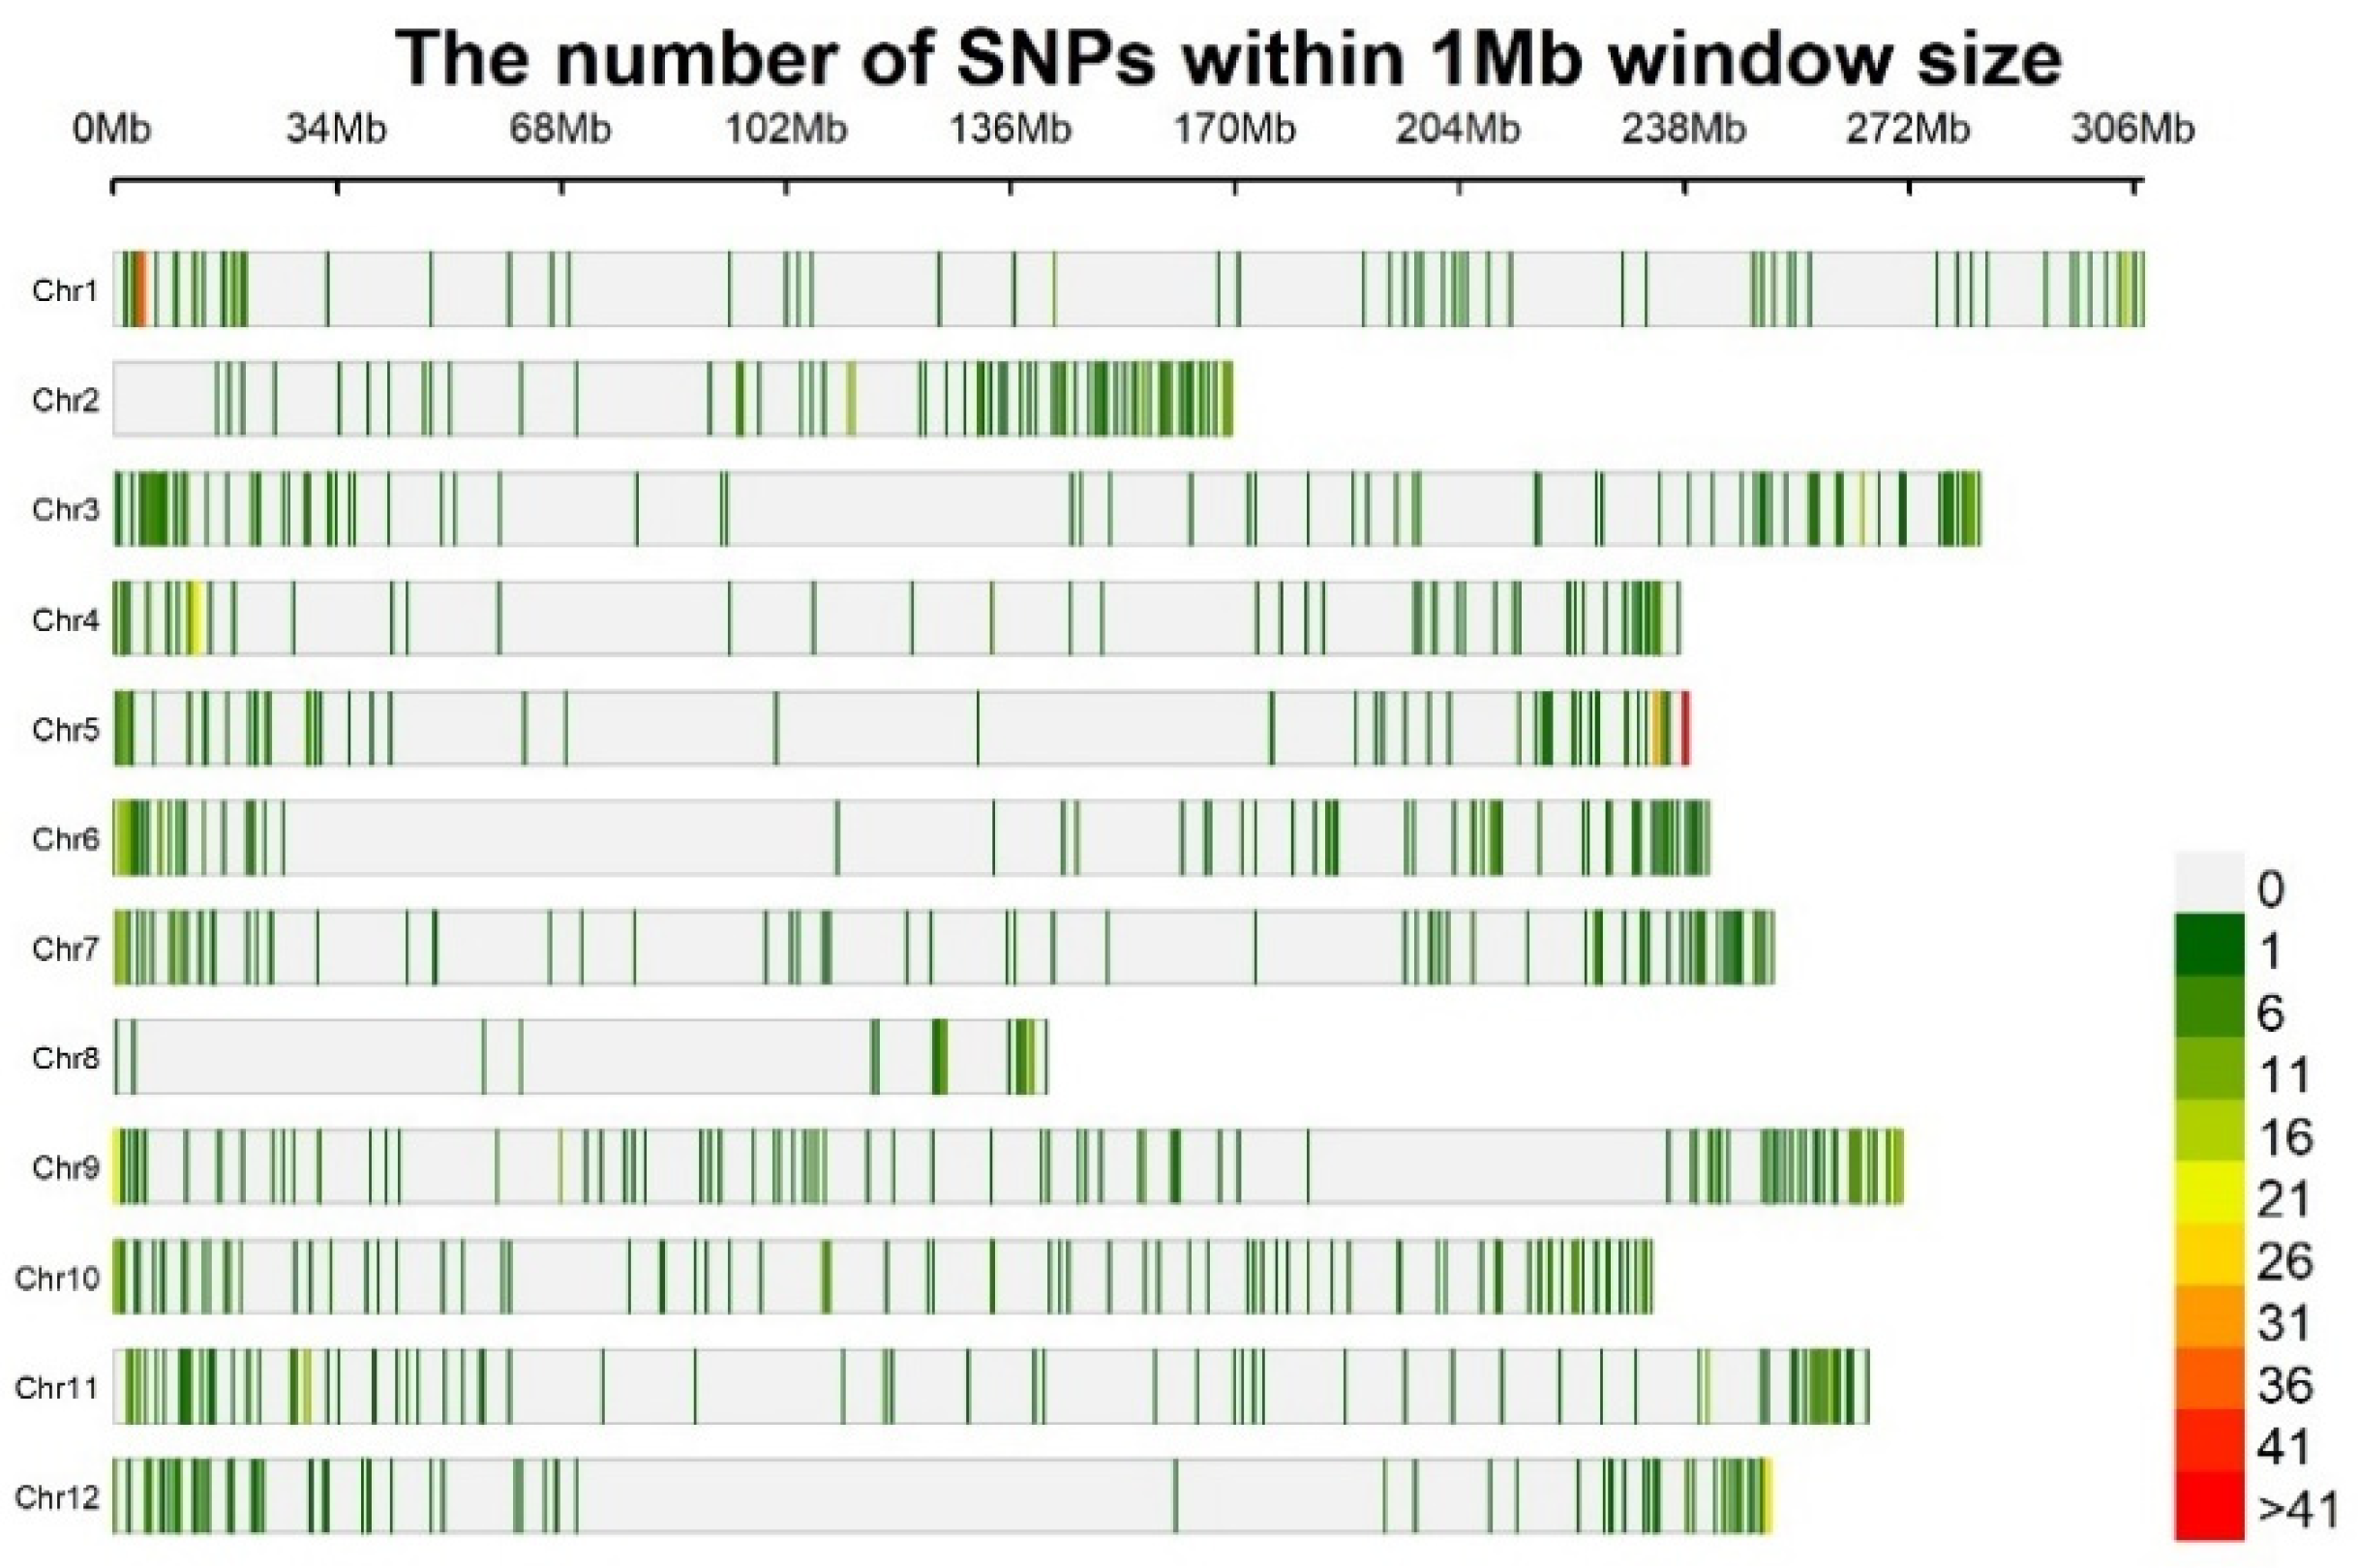
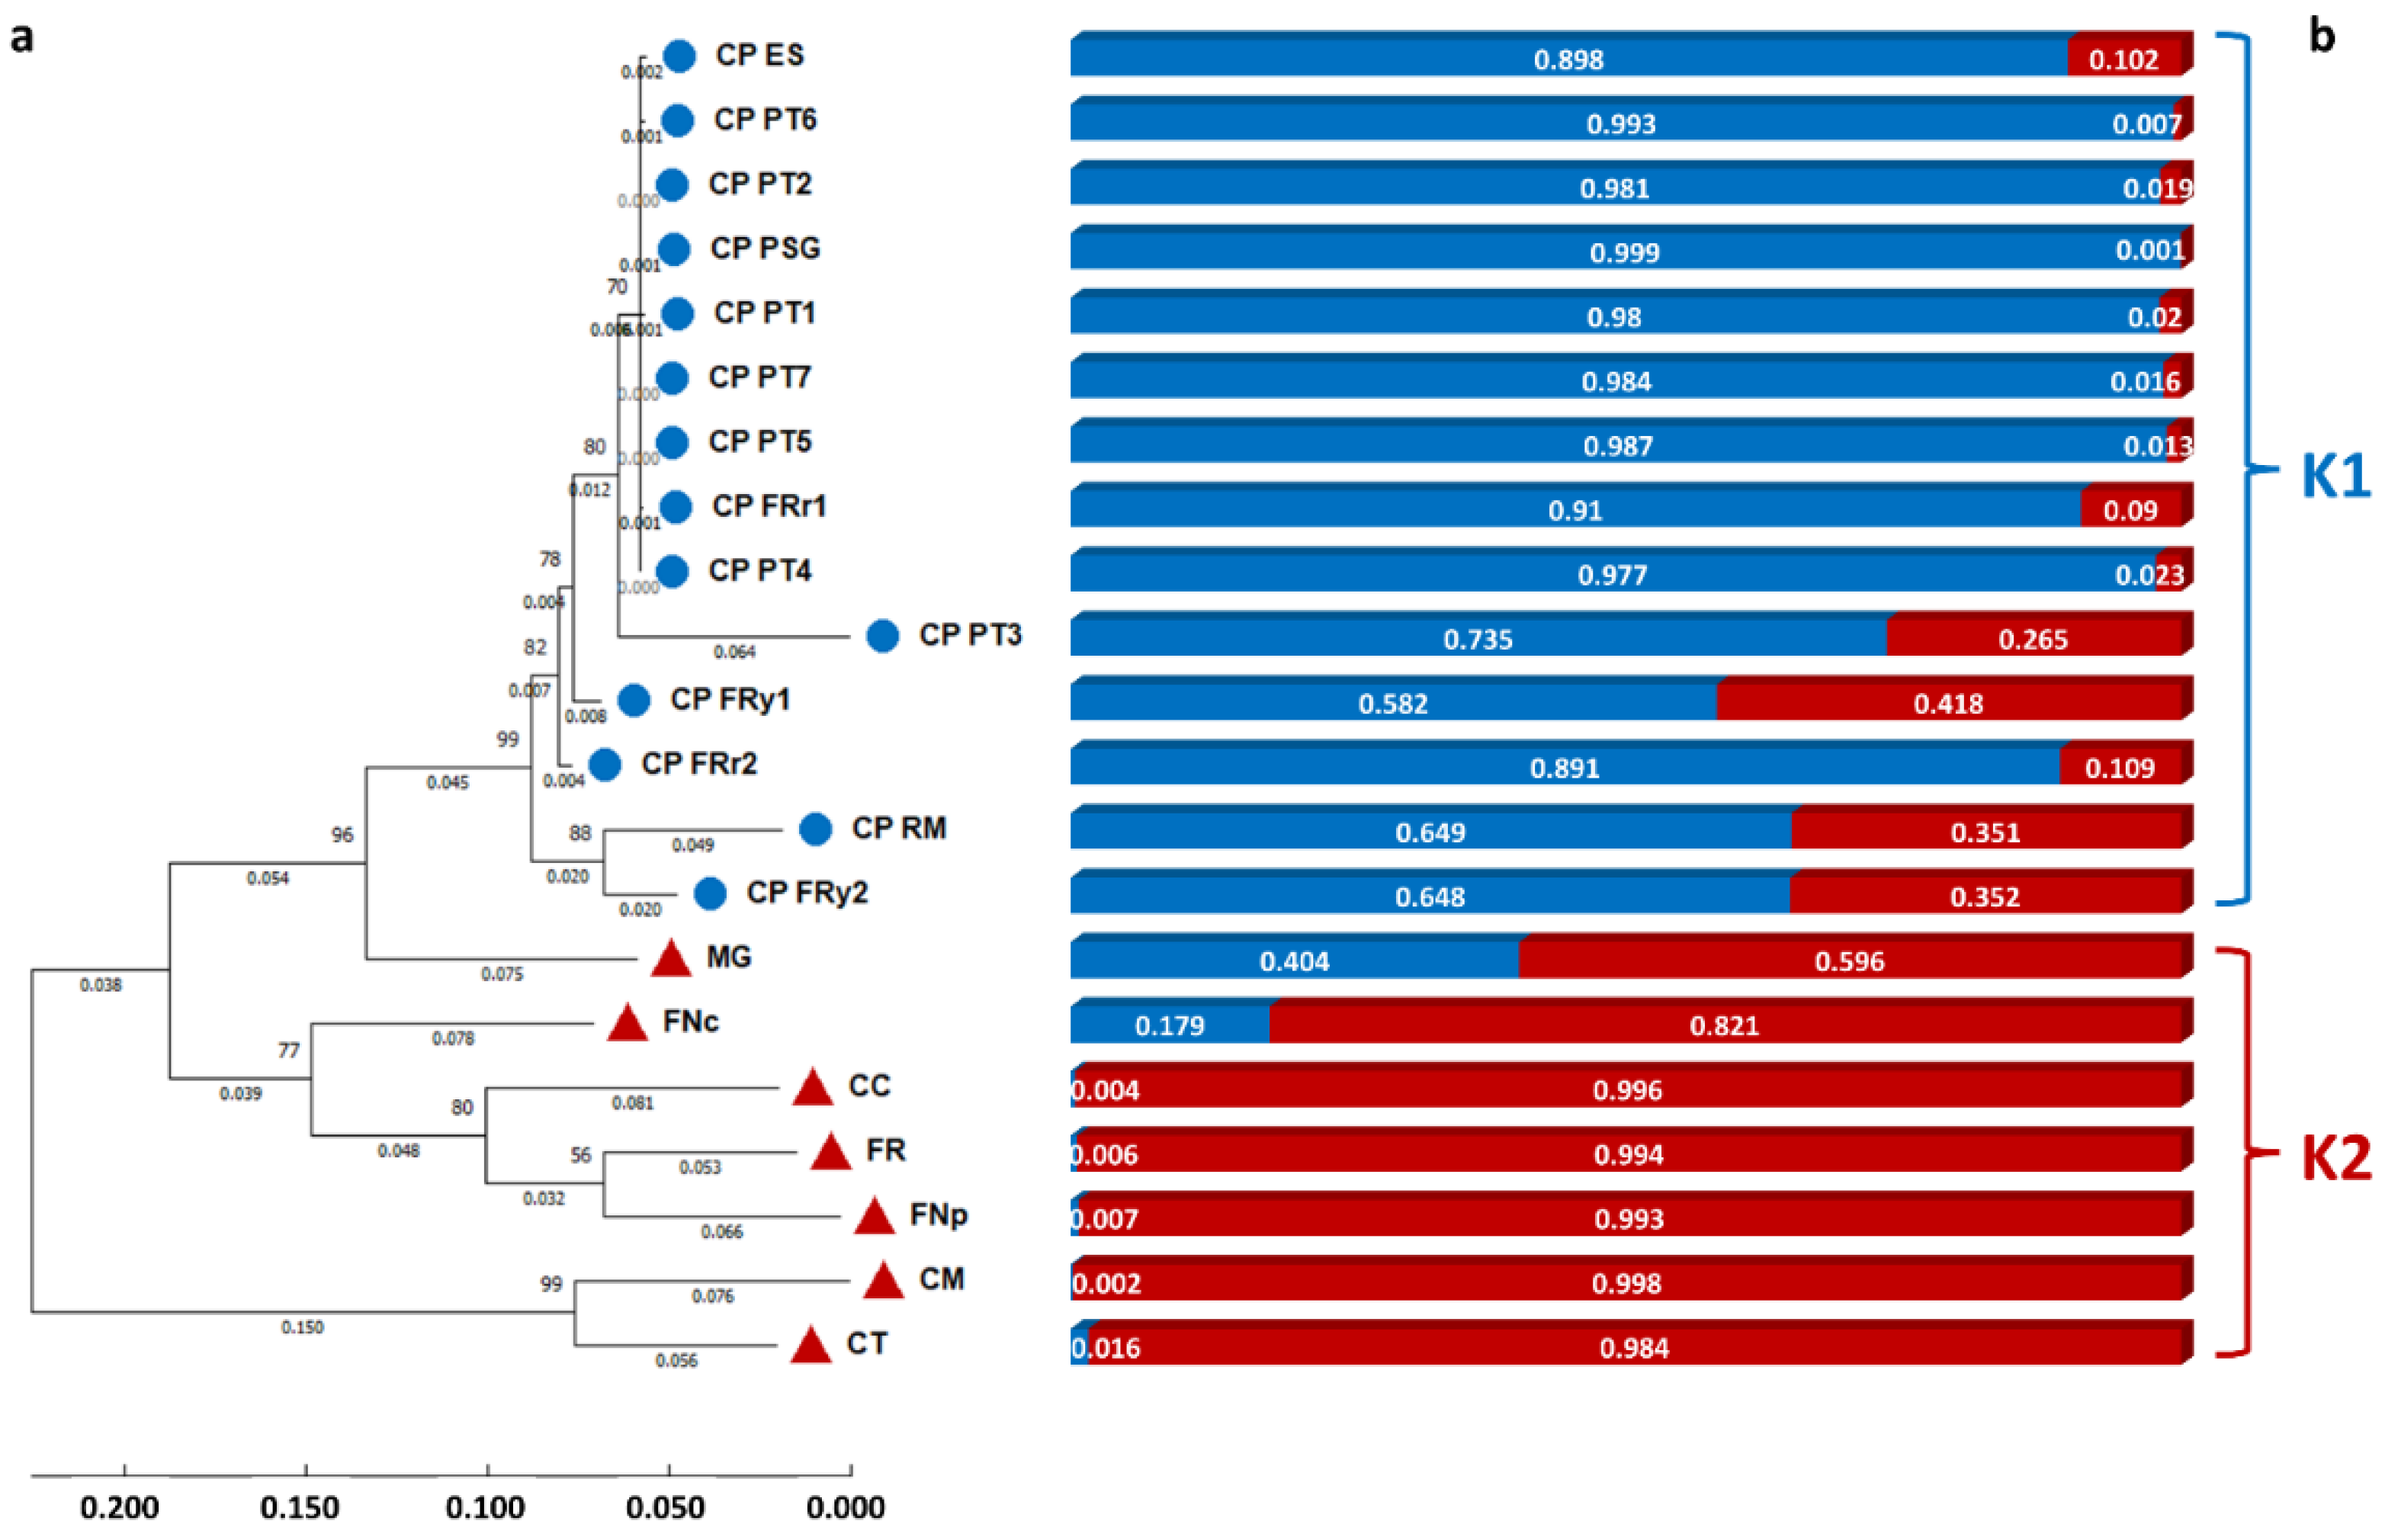
3.4. Genomic Diversity

ddRAD sequencing produced a total of ~120 million total raw sequences, corresponding to an average of 2.8 million sequences per sample. After quality and MAF filtering methods, a total of 2196 SNPs were selected to investigate the genetic diversity. The identified SNPs were located on all 12 chromosomes, with an average density of one SNP every 1.55 megabases across the twelve chromosomes and with the 53% of SNPs positioned at a distance smaller than 100 kilobases. The highest number of SNPs was found on chromosome 9 (n = 216) and the lowest on chromosome 8 (n = 46) (Figure 5). According to nucleotide substitution as either transitions (A↔G or C↔T) or transversions (C↔G, A↔C, G↔T, A↔T), we found a higher frequency of transitions (55.64%) than transversions (44.36%). The level of heterozygosity across genotypes ranged from 0.23% (CP_PT3) to 0.42% (FNp). On average, CP accessions showed a lower level of heterozygosity (0.27%) than similar types (0.34%). Based on STRUCTURE analysis (Figure 6) and results of Evanno’s test (Figure S2) as a criterion to infer the most likely number of clusters (K), the collection was divided into K = 2, the likely number of subpopulations separating all CP types (K1) from the similar ones (K2).
Seven CP accessions showed a very high cluster (K1) membership coefficient (qi) > 0.97 and included CP_PT1/2/4/5/6/7, all cultivated in the Pontecorvo area (Frosinone district). Two more accessions, CP_ES and CP_FRr1, from Esperia and Formia, both in the Frosinone area, had a qi membership of 0.89 and 0.91, respectively. Five CP genotypes, including those cultivated in the Frosinone and Roma areas showed a lower K1 qi coefficient, highlighting a higher level of genetic admixing. In the second subpopulation, 5 out of the 7 similar types showed a very high cluster (K2) membership coefficient (qi) > 0.99. The phylogenetic maximum likelihood dendrogram based on the Tamura–Nei model confirmed the presence of a single cluster including 9 of the 14 studied CP accessions (Figure 6), highlighting further the presence of specific subgroups within the similar types. A principal component analysis (PCA) recapitulated the genomic diversity based on STRUCTURE and phylogenesis analysis confirming the typology-based differentiation (Figure 7a). In addition, the PCA showed a diversity based on the geographical provenance of the studied accessions. At the regional level, genotypes from Latium, Campania, and Piedmont were separated, with a lower level of differentiation of the accessions from Centre/South Italy (Figure 7b). At the district level, further clusters of accessions from Frosinone and Latina in the Latium Region, as well as Napoli and Salerno in the Campania region, were observed (Figure 7c). The degree of relationship between the pepper accessions obtained using genomic markers was complementary to that one drawn with phenotypic data, as revealed by significant correlations between the two independent cluster analyses (r = 0.197, p = 0.004).

4. Discussion

Peppers are widely consumed in the Mediterranean region, and many varieties are cultivated for either fresh consumption or industrial processing, mostly sauce or spicy powder [31]. As a vegetable, it is a fundamental element of the Mediterranean diet pyramid, being an excellent source of bioactive compounds with antioxidant properties [6]. In the Italian peninsula, there are many local varieties that in most cases cover very limited areas and can be considered a cornerstone for boosting local economies through their cultivation and direct use. Indeed, once granted PDO certification, thanks to their unique quality characteristics these products acquire an added value in the market, as benefits small farmers. Furthermore, they represent a powerful source of diversity to explore for genetic improvement, mostly linked to the adaptation to diverse environmental conditions. Determining the genetic fingerprint and establishing the uniqueness of the ‘Peperone Cornetto di Pontecorvo’ PDO pepper is of great importance for the protection and enhancement of this landrace. The interest of the community relies on its qualitative properties. Indeed, it has been found to be rich in terms of nutraceutical compounds in the peel and substances exerting a key functional role in the control of glucosidic metabolism due to the interference with the activity of α-amylase [4]. In addition, the biochemical profile highlighted antimutagenic effects against different environmental pollutants [5].
So far, distinctness, uniformity, and stability (DUS) tests are required for the protection of plant materials [32]. These methods are based on the detection, in a qualitative and quantitative manner, of morphological characters that can be subjected to environmental variation [33] and are not useful to discriminate individuals morphologically indistinguishable. DNA markers instead offer many advantages, being ubiquitous across the genome, highly heritable, and not affected by the environment [34]. Molecular markers have been proven to be an excellent tool for discerning the uniqueness and distinctness of PDO landraces existing for different crops. In aubergines, microsatellites associated with coding (expressed sequence tags) and non-coding regions allowed the discrimination of Listada de Gandía cultivars, a landrace with intense purple stripes over a white background typical of the south-east coastal region in Spain [35]. In tomato, efforts are reported for San Marzano PDO, one of the most famous varieties, leading the market for processing, in order to distinguish it from very closely related materials [36,37]. Microsatellites combined with high-resolution melting have been also used for authenticity testing of sweet PDO cherry products [38]. These studies mostly rely on the application of PCR-based markers, mostly microsatellites, that often require laborious procedures and high costs for the development of numerous polymorphisms. Genotyping by sequencing approaches offers the possibility to implement a more robust and detailed characterization, deciphering the comprehensive variation across the entire genome by detecting catalogues of thousands of SNPs. So far, ddRAD-seq has been little exploited for the assessment of PDO vegetable products.
In this investigation, we used a multidisciplinary approach for deeply assessing the diversity existing within ‘Peperone Cornetto di Pontecorvo’ PDO and determining any relationships with similar landraces cultivated in Italy.
Morphological, agronomic, and genetic analyses allowed us to differentiate CP accessions from similar types. The two groups mostly differed in their fruit weight and size traits, suggesting how this landrace can be easily discriminated from other common horn-shaped pepper typologies grown in the Mediterranean area. The observations based on the fruit scans corroborated manual measurement, thus providing more detailed information than those indicated in the descriptors. This confirms the potential of imaging as a tool for the recognition of protected-mark products.
Based on phenomic data, Friariello pepper types (FR, FNc, FNp) were clearly distinguished. This group of accessions cultivated in the Campania region is characterized by fruits with lower weight and shape parameters compared with the others. Both PCA and clustering analysis highlighted the presence of sub-groups for the remaining accessions studied. Two main branches separated CP peppers. The yellow accessions CP_FRy1, CP_FRy2, and the three red CP_PT1, CP_PT2, and CP_PT3, were included both in the negative part of the second principal component and the B2.2 branch according to hierarchical clustering. The PCA also revealed the high similarity of CP_FRy2 to the yellow MG cultivar from the Campania Region. All the remaining red CP types were in a second group, which corresponded to the positive axis of the second component and cluster B1 of the dendrogram of similarity. Hierarchical clustering allowed a better estimation of the level of similarity between accessions.
Genomic data better inferred the diversity of the set studied. The Bayesian model to capture genetic population structure well distinguished CP and the similar types into two different (K = 2) sub-populations, shedding light on the presence of highly related CP genotypes based on ancestry coefficients. Except for CP_PT3, all accessions from the Pontecorvo area showed very similar allele frequencies. In addition, the PCA biplot based on SNP data confirmed the diversification of the two groups studied, showing a geographically based stratification that clearly distinguished the accessions both at the district and regional levels. This could be explained by the breeding history of local varieties and by the low allelic exchange between germplasms bred in different rural areas, as well as by the presence of common ancestors and inherited-based alleles shared by highly similar landraces [3,39]. Phenomic and genomic characterizations were complementary to describe the diversity of the collection studied, as revealed by the observed significant correlations between the two pairs of data. However, a more precise assessment was obtained by genomic markers, which allowed a better dissection of ‘Peperone Cornetto di Pontecorvo’ germplasm, highlighting a unique core set of accessions typical of the region where the landrace originated.

5. Conclusions

In the present study, we report the first assessment of the diversity existing for the sweet pepper local variety ‘Peperone Cornetto di Pontecorvo’ using a combination of multi-phenomic and genomic data. The approach used highlighted how this local variety was distinct from common horn-shaped types cultivated in Italy. The genomic analysis provided a more in-depth dissection, thus allowing a specific genetic fingerprint for the accessions cultivated in the typical area of this pepper PDO. Our work demonstrated how high-density SNP genotyping is a valuable tool for the identification, traceability, and thus protection of products bearing authenticity marks. These results suggest the possibility to present ‘Peperone Cornetto di Pontecorvo’ for its registration in the National Register as a conservation variety, to support in situ seed reproduction and increase its local berry production. The recovery and evaluation of local germplasms represent a key strategy for the development of cultivars adapted to specific environments. The broad phenotypic and genotyping information will contribute to defining new precision breeding programs. Furthermore, this investigation provides a step towards the establishment of the importance of traditional varieties, promoting their cultivation and consumption, thus boosting local economies.

Supplementary Materials

The following supporting information can be downloaded at: https://www.mdpi.com/article/10.3390/agronomy12061433/s1, Figure S1: Linear regressions between manual measurements and digital acquisition relative to fruit length, fruit width, and fruit shape index. Figure S2: Evaluation of the best grouping number (K) of the Bayesian clustering analysis using the Evanno’s method. (a) Plot of mean likelihood L(K) and variance for 5 independent runs for each value of K, for K = 2–10. (b) Evanno’s plot generated by STRUCTURE HARVESTER for the detection of the true number of clusters (the most likely value of K). The highest value was at K = 2, indicating that the set studied likely forms 2 sub-populations. Table S1: Test of normality of the residuals and standardized residuals. In blue font are highlighted traits violating the normality of residuals with both tests considering (p < 0.05). Table S2: Bartlett’s test for homogeneity of variance of the traits tested in 21 pepper accessions. In bold, traits rejecting the null hypothesis. Table S3: Mean values and standard deviations for agronomic, qualitative, and digital morphological traits evaluated in 21 pepper accessions for the two cultivar groups considered in this study. For traits exhibiting homogeneity of variance according to Bartlett’s test, means with different letters are significantly different (Tukey’s HSD, p < 0.05). Table S4: Multiple comparison according to Games–Howell post hoc test for traits showing non-homogeneity of variance. In each column, values indicate differences between genotypes (I–J). Significance at p < 0.05 is indicated with *.

Author Contributions

Conceptualization, P.T. (Pasquale Tripodi), R.R., P.T. (Paola Taviani); methodology, P.T. (Pasquale Tripodi), R.R.; formal analysis, P.T. (Pasquale Tripodi), R.R., R.D., G.F.; investigation, P.T. (Pasquale Tripodi), R.R., P.T. (Paola Taviani); resources, P.T. (Pasquale Tripodi), R.R.; data curation, P.T. (Pasquale Tripodi), R.D., R.R.; writing—original draft preparation, P.T. (Pasquale Tripodi); funding acquisition, P.T (Pasquale Tripodi), P.T. (Paola Taviani). All authors have read and agreed to the published version of the manuscript.

Funding

This research was funded by the Italy—2014-2020 Rural Development Programme (Regional)—Lazio, Agro-environmental Measure, T.O. 10.2.1 supporting the “conservation of plants and animals’ genetic resources in agriculture” (CUP F85B18003830009, ARSIAL-CREA project “Identificazione di polimorfismi genetici in varietà locali di peperone collezionate da ARSIAL nel Lazio”) European Union FEASR.

Data Availability Statement

Raw data from RADseq are available on request from the corresponding author.

Conflicts of Interest

The authors declare no conflict of interest. The funders had no role in the design of the study; in the collection, analyses, or interpretation of data; in the writing of the manuscript, or in the decision to publish the results.

References

  1. Jarret, R.L.; Barboza, G.E.; Costa Batista, F.; Berke, T.; Chou, Y.; Hulse-Kemp, A.; Ochoa-Alejo, N.; Tripodi, P.; Veres, A.; Garcia, C.C.; et al. Capsicum—An abbreviated compendium. J. Am. Soc. Hortic. Sci. 2019, 144, 3–22. [Google Scholar] [CrossRef] [Green Version]
  2. FAOSTAT. 2021. Available online: http://www.fao.org/faostat/en/#home (accessed on 26 May 2022).
  3. Tripodi, P.; Francese, G.; Sanajà, V.O.; di Cesare, C.; Festa, G.; D’Alessandro, A.; Mennella, G. A multi-methodological approach to study genomic footprints and environmental influence on agronomic and metabolic profiles in a panel of Italian traditional sweet pepper varieties. J. Food Compos. Anal. 2021, 103, 104116. [Google Scholar] [CrossRef]
  4. Sobolev, A.P.; Mannina, L.; Capitani, D.; Sanzò, G.; Ingallina, C.; Botta, B.; Fornarini, S.; Crestoni, M.E.; Chiavarino, B.; Carradori, S.; et al. A multi-methodological approach in the study of Italian PDO “Cornetto di Pontecorvo” red sweet pepper. Food Chem. 2018, 255, 120–131. [Google Scholar] [CrossRef] [PubMed]
  5. Di Sotto, A.; Vecchiato, M.; Abete, L.; Toniolo, C.; Giusti, A.M.; Mannina, L.; Locatelli, M.; Nicoletti, M.; Di Giacomo, S. Capsicum annuum L. var. Cornetto di Pontecorvo PDO: Polyphenolic profile and in vitro biological activities. J. Funct. Foods 2018, 40, 679–691. [Google Scholar] [CrossRef]
  6. Mennella, G.; D’Alessandro, A.; Francese, G.; Fontanella, D.; Parisi, M.; Tripodi, P. Occurrence of variable levels of health-promoting fruit compounds in horn-shaped Italian sweet pepper varieties assessed by a comprehensive approach. J. Sci. Food Agric. 2018, 98, 3280–3289. [Google Scholar] [CrossRef]
  7. Registro Volontario Regionale. Available online: https://www.arsial.it/biodiversita/registro-volontario-regionale/ (accessed on 26 May 2022).
  8. Costanza, M.T.; Miracolo, I.B.; Taviani, P.; Paoletti, S.; Rea, R.; Lelli, L.; Garzia, J.H.; Porfiri, O.; Nardi, P.; Tanca, M. On Farm Conservation of Plant Genetic Resources in Lazio Region, Italy. Implementation of the Regional Act 1st March 2000 N°15. In Agrobiodiversity Conservation: Securing the Diversity of Crop Wild Relatives and Landraces; Maxted, N., Dulloo, E.M., Ford-Lloyd, B.V., Frese, L., Iriondo, J., de Carvalho, M.A.A.P., Eds.; CABI: Wallingford, UK, 2012; Volume 365, pp. 161–172. ISBN 9781845938512. [Google Scholar]
  9. Union. The Council of the European Union. Council Regulation (EC) No 510/2006 of 20 March 2006 on the Protection of Geographical Indications and Designations of Origin for Agricultural Products and Foodstuffs. 2006. Available online: https://eur-lex.europa.eu/eli/reg/2006/510/oj (accessed on 26 May 2022).
  10. Dias, C.; Mendes, L. Protected Designation of Origin (PDO), Protected Geographical Indication (PGI) and Traditional Speciality Guaranteed (TSG): A bibiliometric analysis. Food Res. Int. 2018, 103, 492–508. [Google Scholar] [CrossRef]
  11. Arfini, F.; Bellassen, V. (Eds.) Sustainability of European Food Quality Schemes: Multi-Performance, Structure, and Governance of PDO, PGI, and Organic Agri-Food Systems; Springer Nature: Basel, Switzerland, 2019. [Google Scholar]
  12. Scheben, A.; Batley, J.; Edwards, D. Revolution in Genotyping Platforms for Crop Improvement. In Advances in Biochemical Engineering Biotechnology; Springer: Berlin/Heidelberg, Germany, 2018. [Google Scholar]
  13. D’Agostino, N.; Tripodi, P. NGS-based genotyping, high-throughput phenotyping and genome-wide association studies laid the foundations for next-generation breeding in horticultural crops. Diversity 2017, 9, 38. [Google Scholar] [CrossRef] [Green Version]
  14. Basak, M.; Uzun, B.; Yol, E. Genetic diversity and population structure of the Mediterranean sesame core collection with use of genome-wide SNPs developed by double digest RAD-Seq. PLoS ONE 2019, 14, e0223757. [Google Scholar] [CrossRef]
  15. De Woody, J.; Nason, J.D.; Hipkins, V.D. Mitigating scoring errors in microsatellite data from wild populations. Mol. Ecol. Notes 2006, 6, 951–957. [Google Scholar] [CrossRef] [Green Version]
  16. Yang, G.Q.; Chen, Y.M.; Wang, J.P.; Guo, C.; Zhao, L.; Wang, X.Y.; Guo, Y.; Li, L.; Li, D.Z.; Guo, Z.H. Development of a universal and simplified ddRAD library preparation approach for SNP discovery and genotyping in angiosperm plants. Plant Methods 2016, 12, 39. [Google Scholar] [CrossRef] [Green Version]
  17. Tripodi, P.; Greco, B. Large scale phenotyping provides insight into the diversity of vegetative and reproductive organs in a wide collection of wild and domesticated peppers (Capsicum spp.). Plants 2018, 7, 103. [Google Scholar] [CrossRef] [PubMed] [Green Version]
  18. Catchen, J.; Hohenlohe, P.A.; Bassham, S.; Amores, A.; Cresko, W.A. Stacks: An analysis tool set for population genomics. Mol. Ecol. 2013, 22, 3124–3140. [Google Scholar] [CrossRef] [PubMed] [Green Version]
  19. Li, H. Minimap2: Pairwise alignment for nucleotide sequences. Bioinformatics 2018, 34, 3094–3100. [Google Scholar] [CrossRef] [PubMed]
  20. Tarasov, A.; Vilella, A.J.; Cuppen, E.; Nijman, I.J.; Prins, P. Sambamba: Fast processing of NGS alignment formats. Bioinformatics 2015, 31, 2032–2034. [Google Scholar] [CrossRef]
  21. Garrison, E.; Marth, G. Haplotype-based variant detection from short-read sequencing. arXiv 2012, arXiv:1207.3907. [Google Scholar]
  22. Danecek, P.; Auton, A.; Abecasis, G.; Albers, C.A.; Banks, E.; DePristo, M.A.; Handsaker, R.E.; Lunter, G.; Marth, G.T.; Sherry, S.T.; et al. The variant call format and VCFtools. Bioinformatics 2011, 27, 2156–2158. [Google Scholar] [CrossRef]
  23. Pritchard, J.K.; Stephens, M.; Donnelly, P. Inference of population structure using multilocus genotype data. Genetics 2000, 155, 945–959. [Google Scholar] [CrossRef]
  24. Structure Harverster. Available online: http://taylor0.biology.ucla.edu/structureHarvester/ (accessed on 26 May 2022).
  25. Kumar, S.; Stecher, G.; Li, M.; Knyaz, C.; Tamura, K. MEGA X: Molecular evolutionary genetics analysis across computing platforms. Mol. Biol. Evol. 2018, 35, 1547–1549. [Google Scholar] [CrossRef]
  26. Wickham, H. Ggplot2: Elegant Graphics for Data Analysis; Springer: New York, NY, USA, 2016; ISBN 978-3-319-24277-4. [Google Scholar]
  27. R Core Team. The R Project for Statistical Computing. 2020. Available online: https://www.R-project.org/ (accessed on 26 May 2022).
  28. Wei, T.; Simko, V. R package “corrplot”: Visualization of a Correlation Matrix. Available online: https://github.com/taiyun/corrplot (accessed on 26 May 2022).
  29. Mantel, N.A. The detection of disease clustering and a generalized regression approach. Cancer Res. 1967, 27, 209–220. [Google Scholar]
  30. XLSTAT. Data Analysis and Statistical Solutions for Microsoft Excel; Addinsoft: Paris, France, 2012. [Google Scholar]
  31. Tripodi, P.; Ficcadenti, N.; Rotino, G.L.; Festa, G.; Bertone, A.; Pepe, A.; Caramanico, R.; Migliori, C.A.; Spadafora, D.; Schiavi, M.; et al. Genotypic and environmental effects on the agronomic, health-related compounds and antioxidant properties of chilli peppers for diverse market destinations. J. Sci. Food Agric. 2019, 99, 4550–4560. [Google Scholar] [CrossRef]
  32. UPOV. General Introduction to the Examination of Distinctness, Uniformity and Stability and the Development of Harmonized Descriptions of New Varieties of Plants, TG/1/3. Available online: https://www.upov.int/en/publications/tg-rom/tg001/tg_1_3.pdf(2002) (accessed on 13 June 2022).
  33. Ji, M.; Deng, J.; Yao, B.; Chen, R.; Fan, Z.; Guan, J.; Li, X.; Wu, F.; Niklas, K.J. Ecogeographical variation of 12 morphological traits within Pinus tabulaeformis: The effects of environmental factors and demographic histories. J. Plant Ecol. 2017, 10, 386–396. [Google Scholar]
  34. Amiteye, S. Basic concepts and methodologies of DNA marker systems in plant molecular breeding. Heliyon 2021, 7, e080932. [Google Scholar] [CrossRef] [PubMed]
  35. Muñoz-Falcón, J.E.; Vilanova, S.; Plazas, M.; Prohens, J. Diversity, relationships, and genetic fingerprinting of the Listada de Gandía eggplant landrace using genomic SSRS and EST-SSRs. Sci. Hortic. 2011, 129, 238–246. [Google Scholar] [CrossRef] [Green Version]
  36. Caramante, M.; Rao, R.; Monti, L.M.; Corrado, G. Discrimination of San Marzano accessions: A comparison of minisatellite, CAPS and SSR markers in relation to morphological traits. Sci. Hortic. 2009, 120, 560–564. [Google Scholar] [CrossRef]
  37. Tripodi, P.; Pepe, R.; Francese, G.; Rosaria, M.; Onofaro Sanajà, V.; Di Cesare, C.; Festa, G.; D’Alessandro, A.; Mennella, G. Biochemical Characterisation and Genetic Structure Provide Insight into the Diversity of the Mediterranean Tomato Ancient Varieties ‘San Marzano’ and ‘Re Fiascone’: New Resources for Breeding. Agronomy 2022, 12, 18. [Google Scholar] [CrossRef]
  38. Ganopoulos, I.; Argiriou, A.; Tsaftaris, A. Microsatellite high resolution melting (SSR-HRM) analysis for authenticity testing of protected designation of origin (PDO) sweet cherry products. Food Control 2011, 22, 532–541. [Google Scholar] [CrossRef]
  39. Pusadee, T.; Jamjod, S.; Chiang, Y.C.; Rerkasem, B.; Schaal, B.A. Genetic structure and isolation by distance in a landrace of Thai rice. Proc. Natl. Acad. Sci. USA 2009, 106, 13880–13885. [Google Scholar] [CrossRef] [Green Version]
Figure 1. Details of the experimental field trial in Alvito (Frosinone, 41°41′ N 13°44′ E) and morphological diversity of the ‘Peperone Cornetto di Pontecorvo’ accessions (CP) and similar types. Additional details are in Table 1.
Agronomy 12 01433 g001
Figure 2. Loading plot of the first (PC1) and second (PC2) principal components showing the variation in 52 morpho-agronomic traits scored for 21 accessions. (a) ‘Peperone Cornetto di Pontecorvo’ (Pontecorvo) and similar types are indicated with different coloured symbols; the first and second component centroids for each cultivar groups are indicated by filled yellow symbols with shape and edge colour according to cultivar group. (b) On the right are indicated the distribution of the traits scored. The direction and distance from the centre of the biplot indicates how each OTU contributes to the first two components. The different categories of traits are indicated using different colour codes as follows: agronomic traits in green, chemical traits in red, digital morpho traits in blue. Trait acronyms are listed in Table 3 and Table 4.
Agronomy 12 01433 g002
Figure 3. Cluster analysis (Ward coefficient) based on 52 phenotypic traits evaluated on 21 pepper accessions.
Agronomy 12 01433 g003
Figure 4. Pearson’s rank correlation coefficients between morpho-agronomic, chemical, and fruit imaging traits. Only correlation coefficients with p < 0.05 after Bonferroni correction are shown. Dot dimensions and colour intensity are proportional to the correlation coefficients. On the right side of the correlogram, the legend colour shows the correlation coefficients and the corresponding colours: in red, negative correlations; in blue, positive correlations.
Agronomy 12 01433 g004
Figure 5. Distribution of 2196 SNPs on the 12 pepper chromosomes. The number of SNPs is represented within 1 Mb window size. The horizontal axis shows the chromosome (Chr) length (Mb); each bar represents a chromosome, with Chr 1 at the top and Chr 12 at the bottom. The different colours depict SNP density following the gradient in the legend on the right.
Agronomy 12 01433 g005
Figure 6. Phylogenetic analysis and population structure of 21 pepper accessions based on 2196 SNPs. (a) Maximum likelihood composite phylogenetic tree using the Tamura–Nei model; numbers at the nodes are bootstrap values for 1000 resamplings. (b) STRUCTURE analysis considering K = 2 clusters on the basis of Evanno’s test. Horizontal solid bars for each genotype represent the allele frequency (indicated with numbers) for each K.
Agronomy 12 01433 g006
Figure 7. Loading plot in the first two components, showing the genomic diversity of 21 studied pepper accessions. (a) PCA displaying the differences between ‘Peperone Cornetto di Pontecorvo’ accessions and similar types. (b) Differences based on the region of provenance. (c) Stratification of the collection on the basis of the area of provenance (district) with additional details on the map. Description and acronyms for each accession are in Table 1.
Agronomy 12 01433 g007
Table 1. List of accessions studied and details of their area of cultivation.
CodeNameCultivation AreaDistrictRegionCoordinateM.a.s.l.
CP_ESCornetto di PontecorvoEsperiaFrosinoneLatium41°23′ N; 13°41′ E370
CP_FRy1Cornetto di Pontecorvo ‘giallo’FormiaLatinaLatium42°15′ N; 13°37′ E19
CP_FRy2Cornetto di Pontecorvo ‘giallo’FormiaLatinaLatium42°15′ N; 13°37′ E19
CP_FRr1Cornetto di Pontecorvo Rosso FormiaLatinaLatium42°15′ N; 13°37′ E19
CP_FRr2Cornetto di Pontecorvo ‘linea 49 rosso’FormiaLatinaLatium42°15′ N; 13°37′ E19
CP_PSGCornetto di PontecorvoPiedimonte San Germano FrosinoneLatium41°29′ N; 13°45′ E115
CP_PT1Cornetto di PontecorvoPontecorvo FrosinoneLatium42°27′ N; 13°40′ E97
CP_PT2Cornetto di PontecorvoPontecorvo FrosinoneLatium42°27′ N; 13°40′ E97
CP_PT3Cornetto di PontecorvoPontecorvo FrosinoneLatium42°27′ N; 13°40′ E97
CP_PT4Cornetto di PontecorvoPontecorvo FrosinoneLatium42°27′ N; 13°40′ E97
CP_PT5Cornetto di PontecorvoPontecorvo FrosinoneLatium42°27′ N; 13°40′ E97
CP_PT6Cornetto di PontecorvoPontecorvo FrosinoneLatium42°27′ N; 13°40′ E97
CP_PT7Corno PontecorvoPontecorvo FrosinoneLatium42°27′ N; 13°40′ E97
CP_RMCornetto di PontecorvoRomaRomaLatium41°54′ N; 12°28′ E21
CMCorno tipo CarmagnolaCarmagnola TorinoPiedmont44°50′ N; 07°43′ E240
FRFrigitelloSarnoSalernoCampania40°49′ N; 14°37′ E30
CCCorno di CapraAcerraNapoliCampania40°57′ N; 14°22′ E26
MGMarconi GialloSarnoSalernoCampania40°49′ N; 14°37′ E30
FNpFriariello NapoliTorre Del GrecoNapoliCampania40°47′ N; 14°23′ E40
FNcFriariello NocereseNoceraSalernoCampania40°45′ N; 14°38′ E43
CTCorno di Toro GialloPiana del SeleSalernoCampania41°37′ N; 14°59′ E72
Table 2. MANOVA analysis considering as ‘factor’ the cultivar typology (‘Peperone Cornetto di Pontecorvo’, CP; and ‘Similar horn types’) and the 21 studied accessions (factor = genotype).
Multivariate Test (Factor ‘Cultivar Groups’).Multivariate Test (Factor ‘Genotype’)
EffectTest StatisticValueFdf
Hypothesis
df
Error
Sig. (p)ValueFdf
Hypothesis
df
Error
Sig. (p)
InterceptPillai’s trace1.003113.435210<0.0011.00114,074.88421<0.01
Wilks’s lambda0.003113.435210<0.0010.00114,074.88421<0.01
CategoryPillai’s trace0.989.055210<0.00117.613.50840400<0.001
Wilks’s lambda0.029.055210<0.0010.0018.94840132<0.001
Table 3. MANOVA descriptive statistics, range, mean, and coefficient of variation (CV) for agronomic and qualitative traits analysed in the CP accessions and similar cultivars.
Trait AcronymsRsquareF RatioProb > FPontecorvoSimilar
RangeMeanCVRangeMeanCV
Agronomic Traits
Total YieldTY0.000.16ns2.24–0.871.4221.832.21–0.931.3826.09
Fruit WeightFW0.5573.86***186.18–91.71136.3715.93132.62–23.1171.4553.63
Fruit LengthFL0.3431.53***19.50–9.0015.0814.3217.00–6.1011.4125.77
Fruit WidthFD0.1611.32**5.50–3.404.7010.436.30–1.603.9234.18
Fruit Shape FS0.010.52ns4.44–2.183.2315.794.89–2.083.1126.37
Pericarp ThicknessPT0.1410.17**6.41–2.504.5920.267.06–2.293.7133.42
Locules NumberLN0.074.94 * 4.00–3.003.5012.294.00–3.003.2610.43
Quality Traits
Brix DegreeBX0.3838.12***6.90–4.605.9410.109.30–4.907.5619.58
Total AcidityAC0.000.16ns0.21–0.100.1717.650.25–0.100.1822.22
pHPH0.010.31ns5.90–5.095.312.826.36–4.765.356.92
LL0.021.25ns56.68–26.8538.1419.0657.73–32.2740.4721.70
aa*0.000.25ns38.82–3.3429.4227.9758.60–3.1127.9356.14
bb*0.021.23ns55.81–13.3923.8849.3758.90–14.4427.7053.43
ChromaC0.074.34 * 56.50–32.5639.9616.1462.28–27.0543.8918.60
* Significant at p < 0.05; ** significant at p < 0.01; *** significant at p < 0.001; ns, not significant. TY is expressed in kilograms; FW in grams; FL and FD in centimetres. PT in millimetres. BX is expressed as °Brix on fresh weight. AC is expressed as mEq % fresh weight.
Table 4. MANOVA descriptive statistics, range, mean, and coefficient of variation (CV) for fruit parameters assessed through scans and imaging analysis in the CP accessions and similar cultivars.
CategoryTraitAcronymsR-SquaredF RatioProb > FPontecorvoSimilar
RangeMeanCVRangeMeanCV
Fruit sizePerimeterP0.28924.853***109.42–50.8563.3319.0479.69–28.6446.7128.45
AreaA0.28624.424***96.54–58.2880.1912.8989.35–23.7059.638.34
Width Mid-heightWMH0.0493.137ns7.95–3.735.2917.017.24–2.294.7630.67
Maximum WidthMW0.19714.953***8.70–5.887.128.438.33–2.926.0426.66
Height Mid-widthHMW0.24619.876***23.02–16.4018.79.2025.61–10.6115.4326.64
Maximum HeightMH0.23318.492***29.04–16.7219.787.8428.42–11.5716.3828.51
Curved HeightCH0.24820.108***29.78–17.2920.8611.3627.97–12.1117.0925.34
Fruit shape indexFruit Shape Index External IFSEI0.0000.000ns3.45–2.202.811.434.09–1.612.826.07
Fruit Shape Index External IIFSEII0.0231.414ns4.52–2.613.6216.024.83–1.963.3927.14
Curved Fruit Shape IndexFSC0.0674.351* 5.04–2.984.0215.425.35–2.113.626.39
BlockinessProximal Fruit BlockinessPFB0.0000.004ns1.45–0.571.0726.171.49–0.141.0823.15
Distal Fruit BlockinessDFB0.25721.073***1.39–0.520.8924.720.85–0.420.6520.00
Fruit Shape TriangleFST0.1278.896**2.42–0.461.3138.172.81–0.191.7232.56
HomogeneityEllipsoidE0.0593.832ns0.24–0.080.1127.270.14–0.080.120.00
CircularC0.1228.450**0.43–0.310.358.570.40–0.180.3218.75
RectangularR0.0000.001ns0.61–0.300.4816.670.60–0.340.4814.58
Proximal fruit end-shapeShoulder HeightSH0.0040.239ns0.11–0.000.0366.670.09–0.000.02100.00
Proximal Angle MicroPMI0.17012.537***359.50–9.30206.647.69296.40–0.40116.974.10
Proximal Angle MacroPMA0.0211.325ns219.60–4.0982.5670.54209.70–1.50100.2956.13
Proximal Indentation AreaPIA0.1077.317**0.29–0.000.08100.000.07–0.000.0366.67
Distal fruit end-shapeDistal Angle MicroDMI0.0332.113ns348.10–1.80117.1462.38342.70–0.0088.8181.78
Distal Angle MacroDMA0.0563.650ns152.00–8.0071.0539.52112.00–10.0057.3242.24
Distal Indentation AreaDIA0.0895.954* 0.18–0.000.03166.670.04–0.000.01100.00
Distal End ProtrusionDEP0.0020.139ns0.99–0.000.08250.000.81–0.000.1220.00
AsymmetryObovoidOB0.1077.337**0.64–0.000.13169.230.00–-0.0100.00
OvoidOV0.0181.097ns0.68–0.000.3180.650.63–0.000.3836.84
V. AsymmetryAsv0.1258.720**1.21–0.190.5248.080.61–0.140.3531.43
H. Asymmetry.obAsob0.0865.737* 2.81–0.000.59166.101.32–0.000.06483.33
H. Asymmetry.ovAsov0.0010.046ns2.92–0.001.3971.222.48–0.001.3348.12
Width Widest PosWWP0.0271.670ns0.89–0.060.3494.120.50–0.080.2540.00
Internal eccentricityEccentricityEC0.0120.730ns0.80–0.690.763.950.80–0.610.756.67
Proximal EccentricityPE0.0010.090ns1.00–0.840.893.371.04–0.770.895.62
Distal EccentricityDE0.0050.293ns1.00–0.830.893.370.96–0.740.895.62
Fruit Shape Index InternalFSI0.0221.365ns4.52–2.623.6216.024.84–1.963.427.06
Eccentricity Area IndexEA0.0050.323ns0.55–0.130.3826.320.50–-0.020.3633.33
Latitudinal sectionLobedness DegreeLD0.0110.686ns45.73–26.4035.5514.3753.51–13.6233.7934.89
Pericarp AreaPA0.0050.282ns0.80–0.570.6710.451.10–0.560.6619.70
Epicarp ThicknessEP0.0010.043ns0.25–0.210.234.350.24–0.190.234.35
* Significant at p < 0.05; ** significant at p < 0.01; *** significant at p < 0.001; ns, not significant.
Publisher’s Note: MDPI stays neutral with regard to jurisdictional claims in published maps and institutional affiliations.

