
Relationship among Electrical Signals, Chlorophyll Fluorescence, and Root Vitality of Strawberry Seedlings under Drought Stress

 ,
,
Abstract
:1. Introduction
2. Materials and Methods
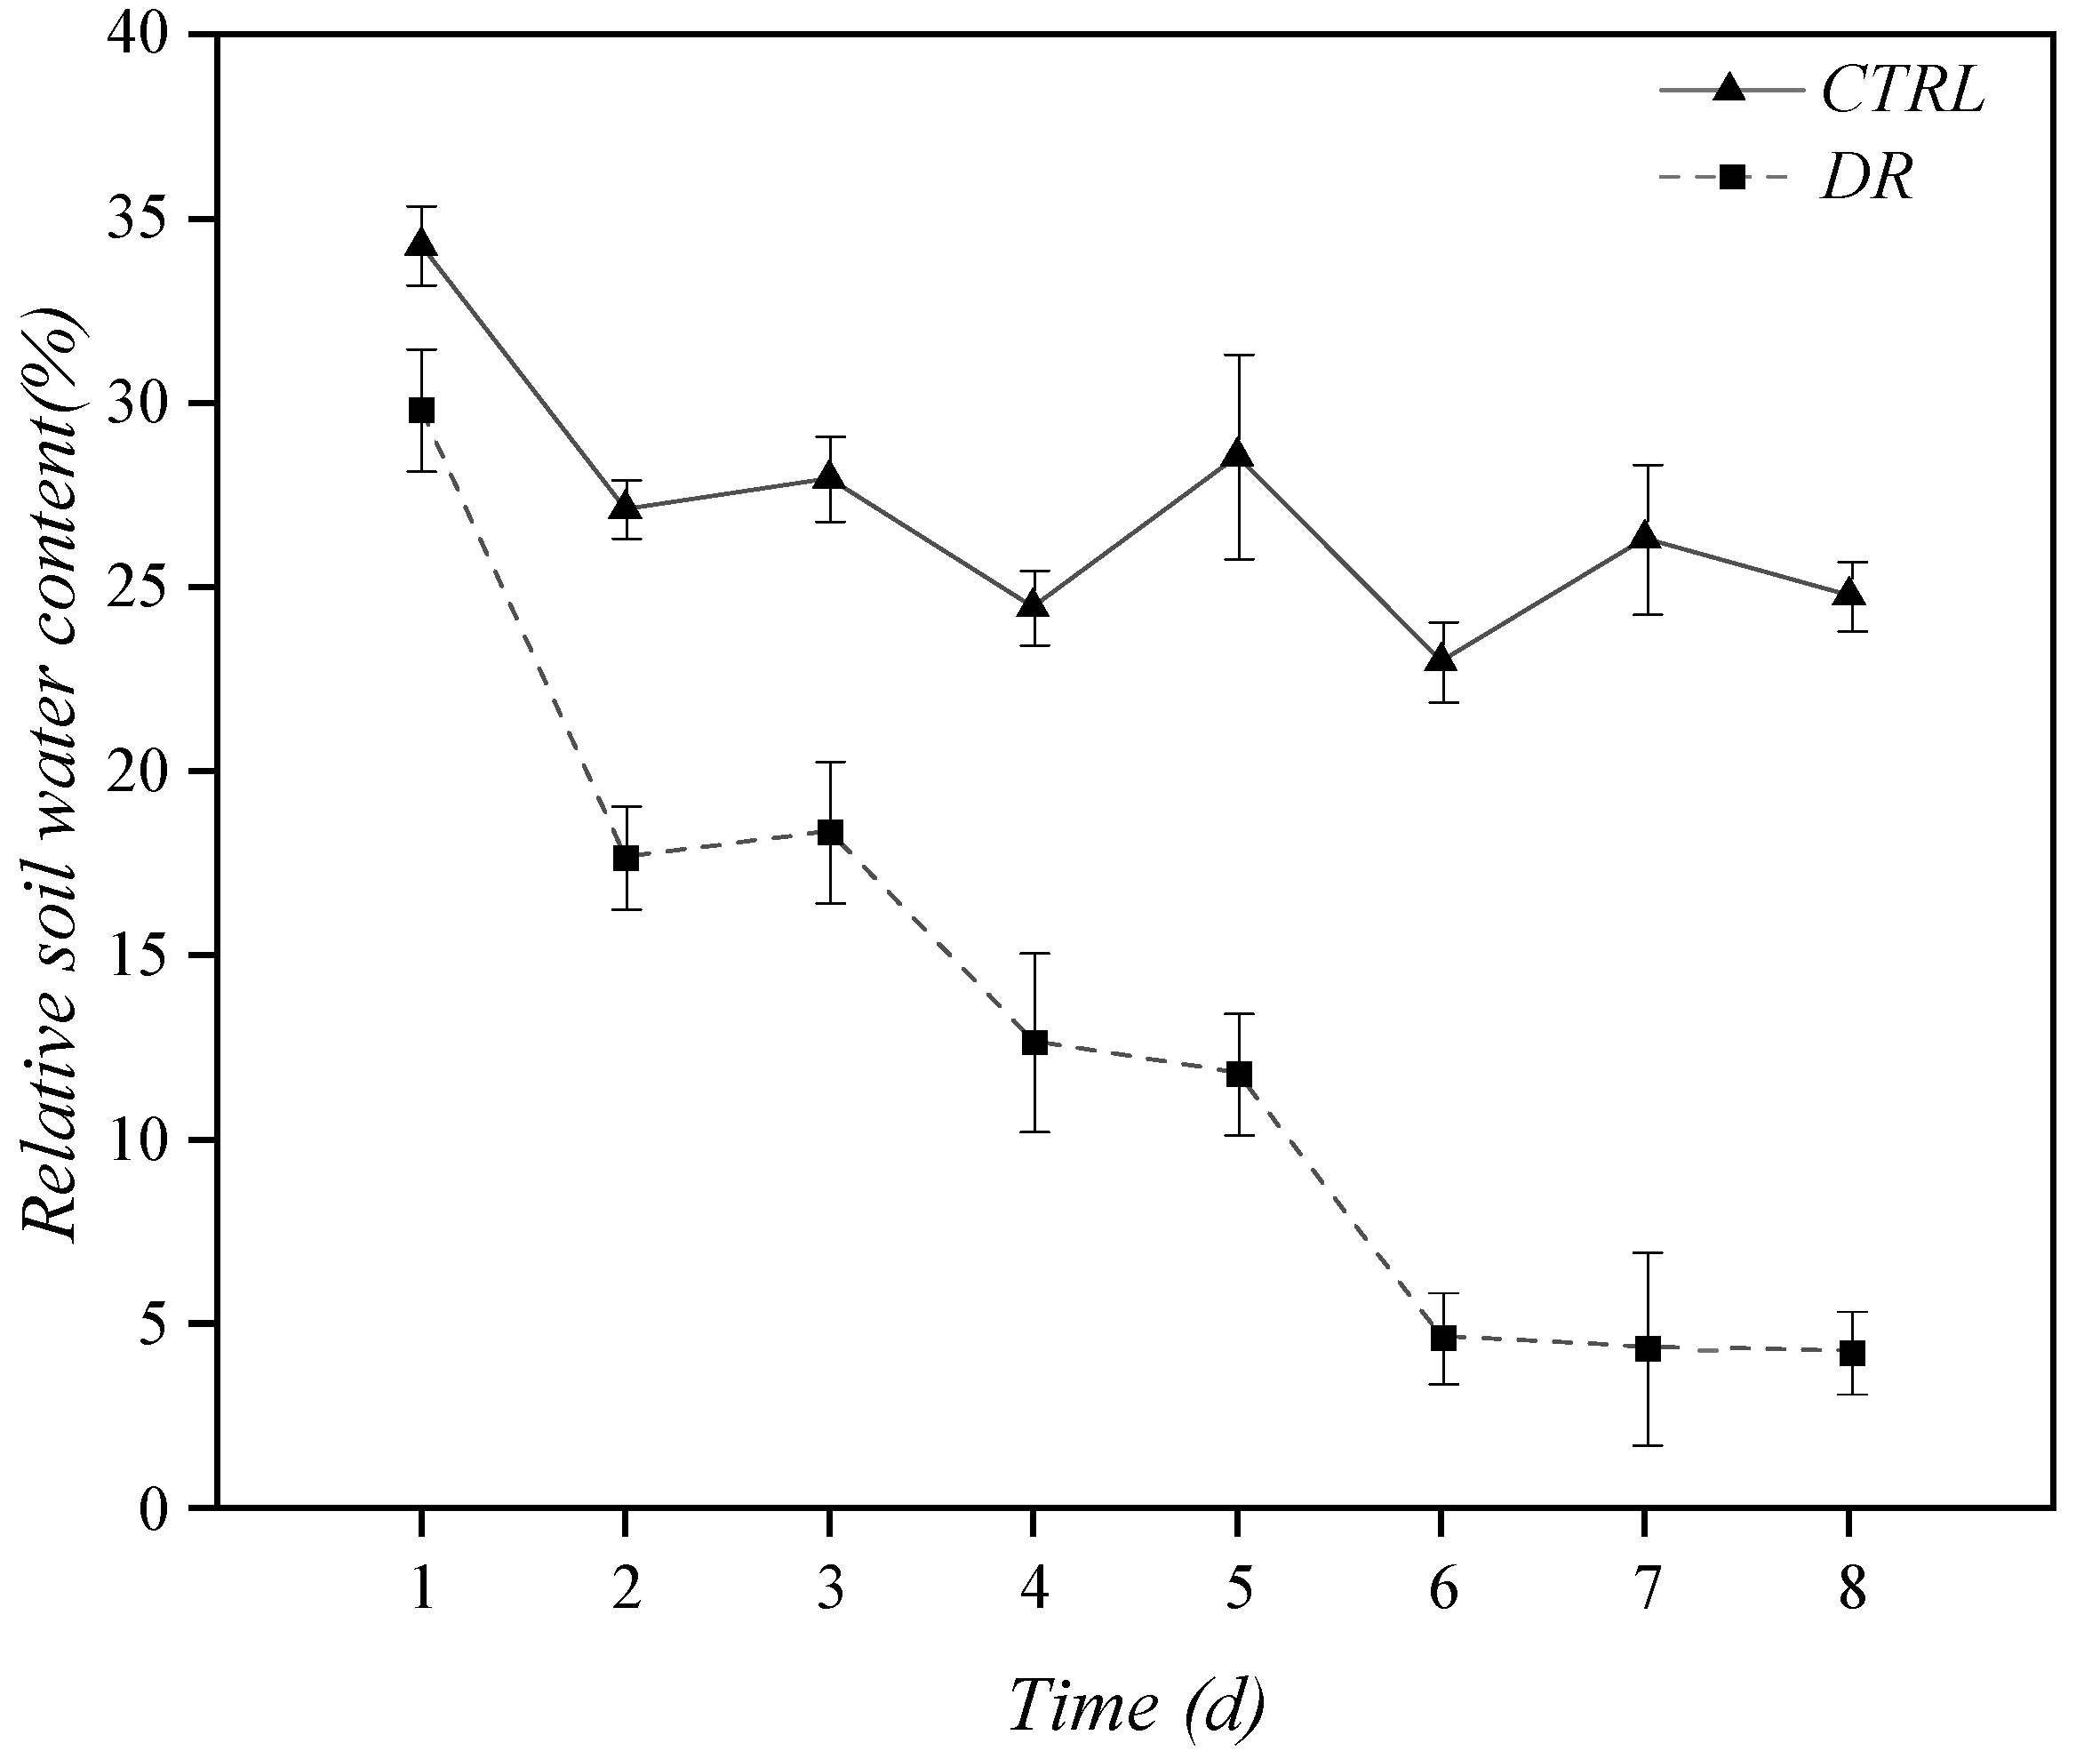
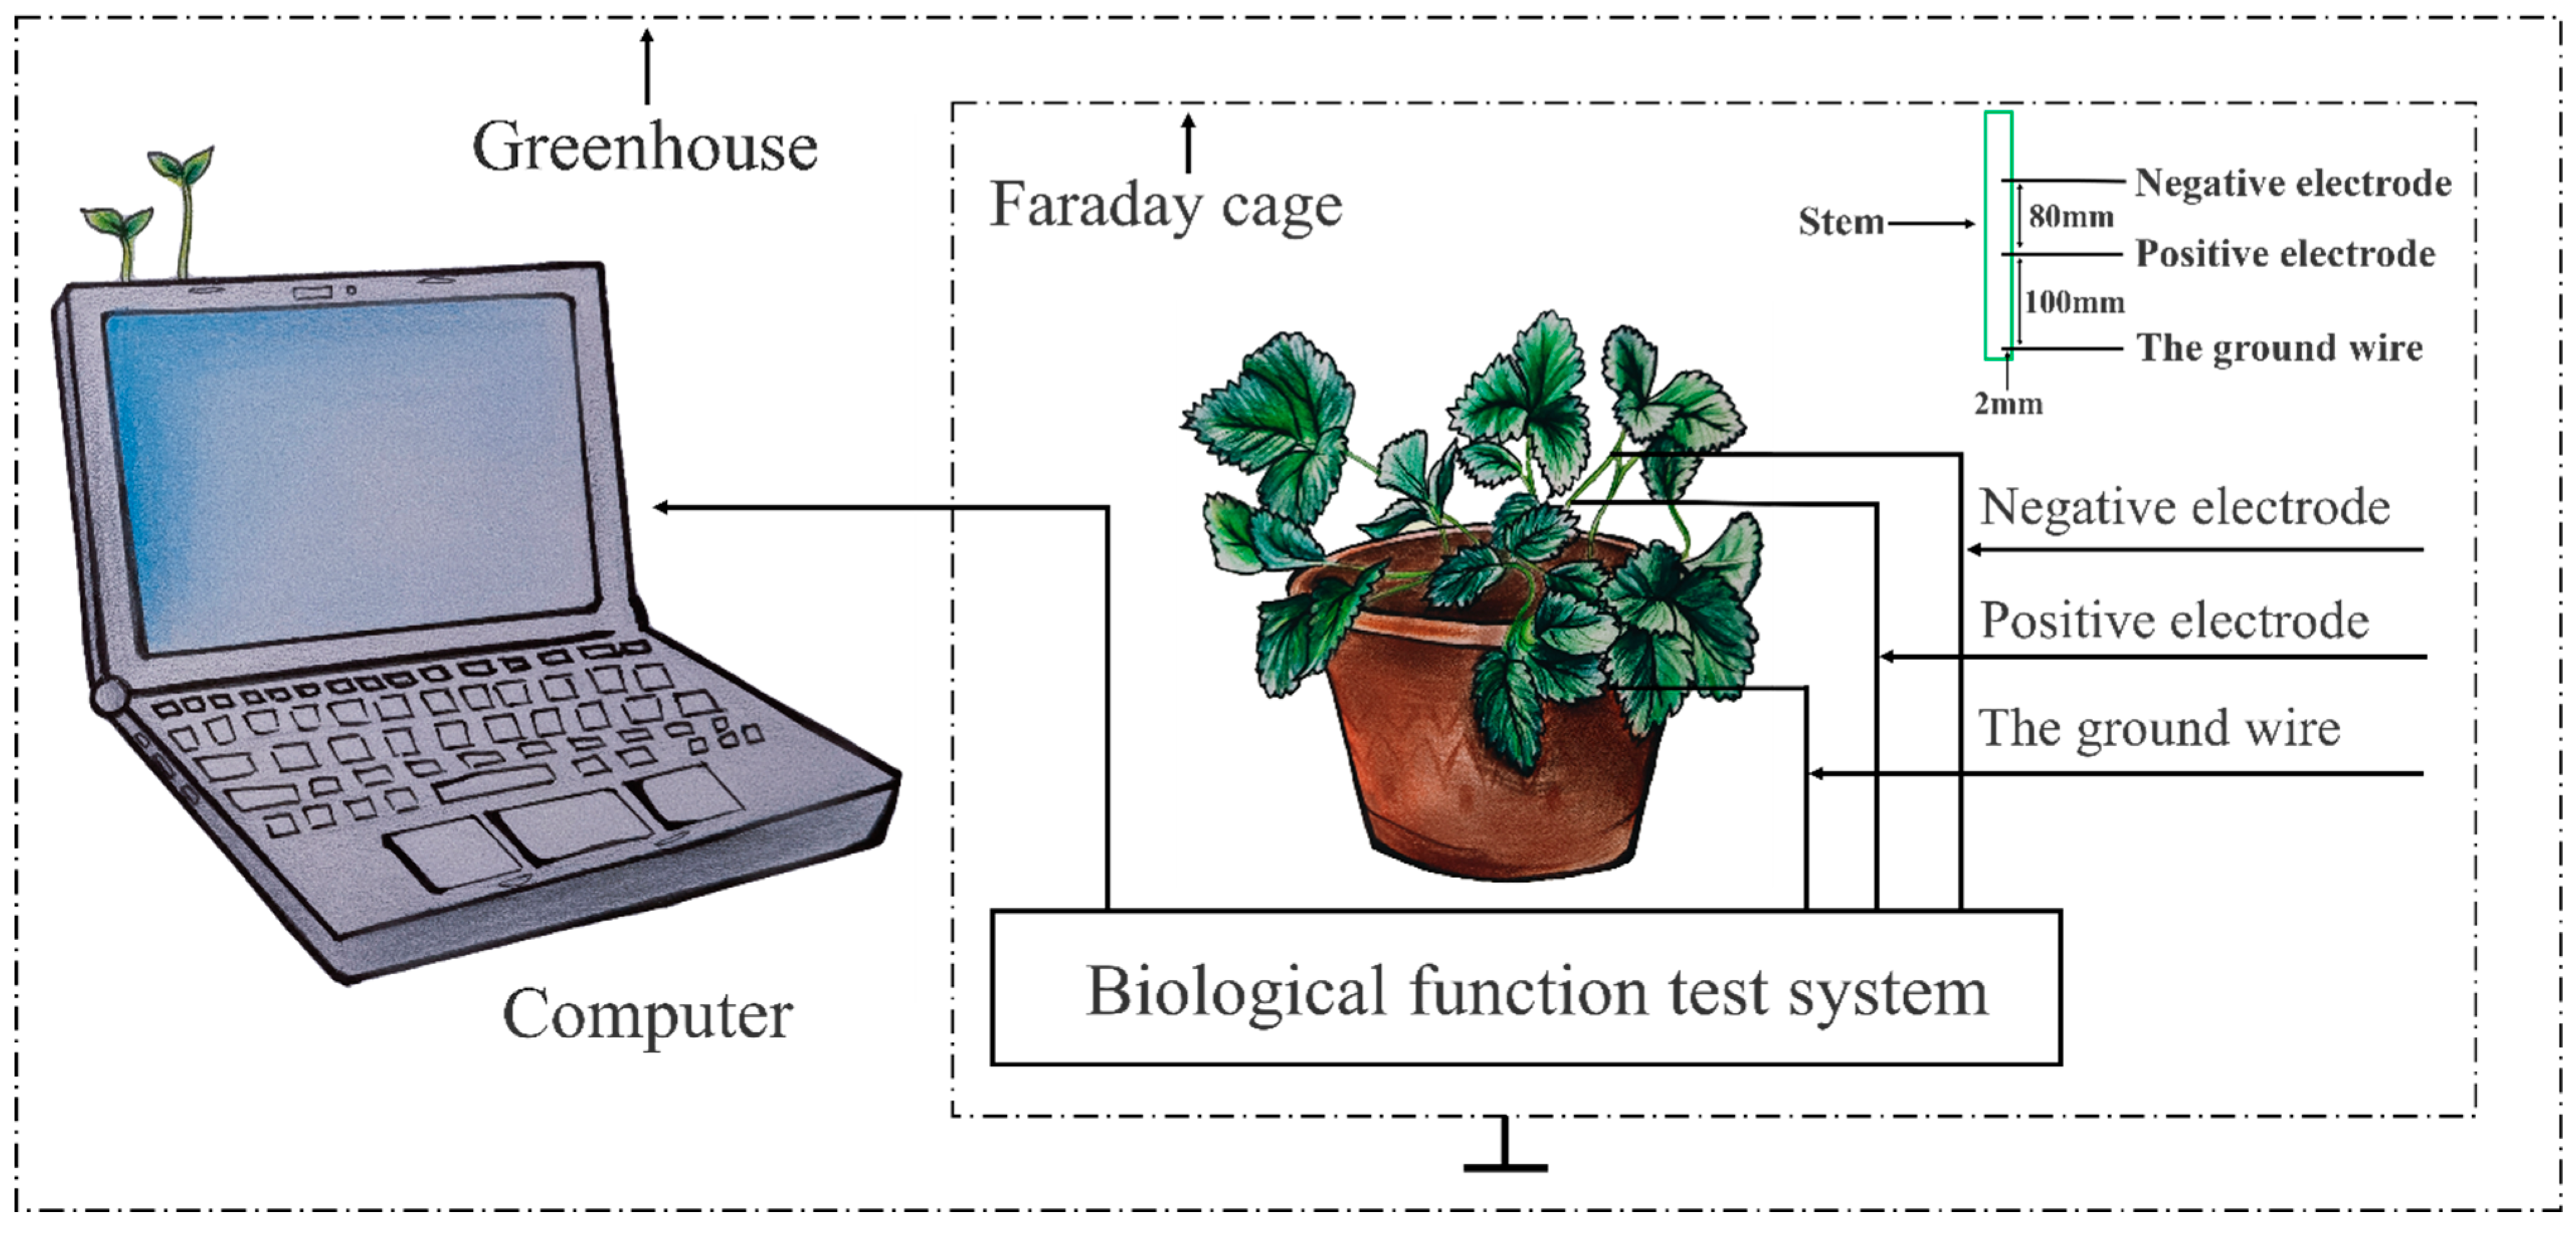
2.1. Experiment Design
2.2. Indicator Measurement and Method
2.2.1. Electrical Signals’ Measurement and Treatment
Collecting Electrical Signals
Reducing Frequency of Electrical Signal
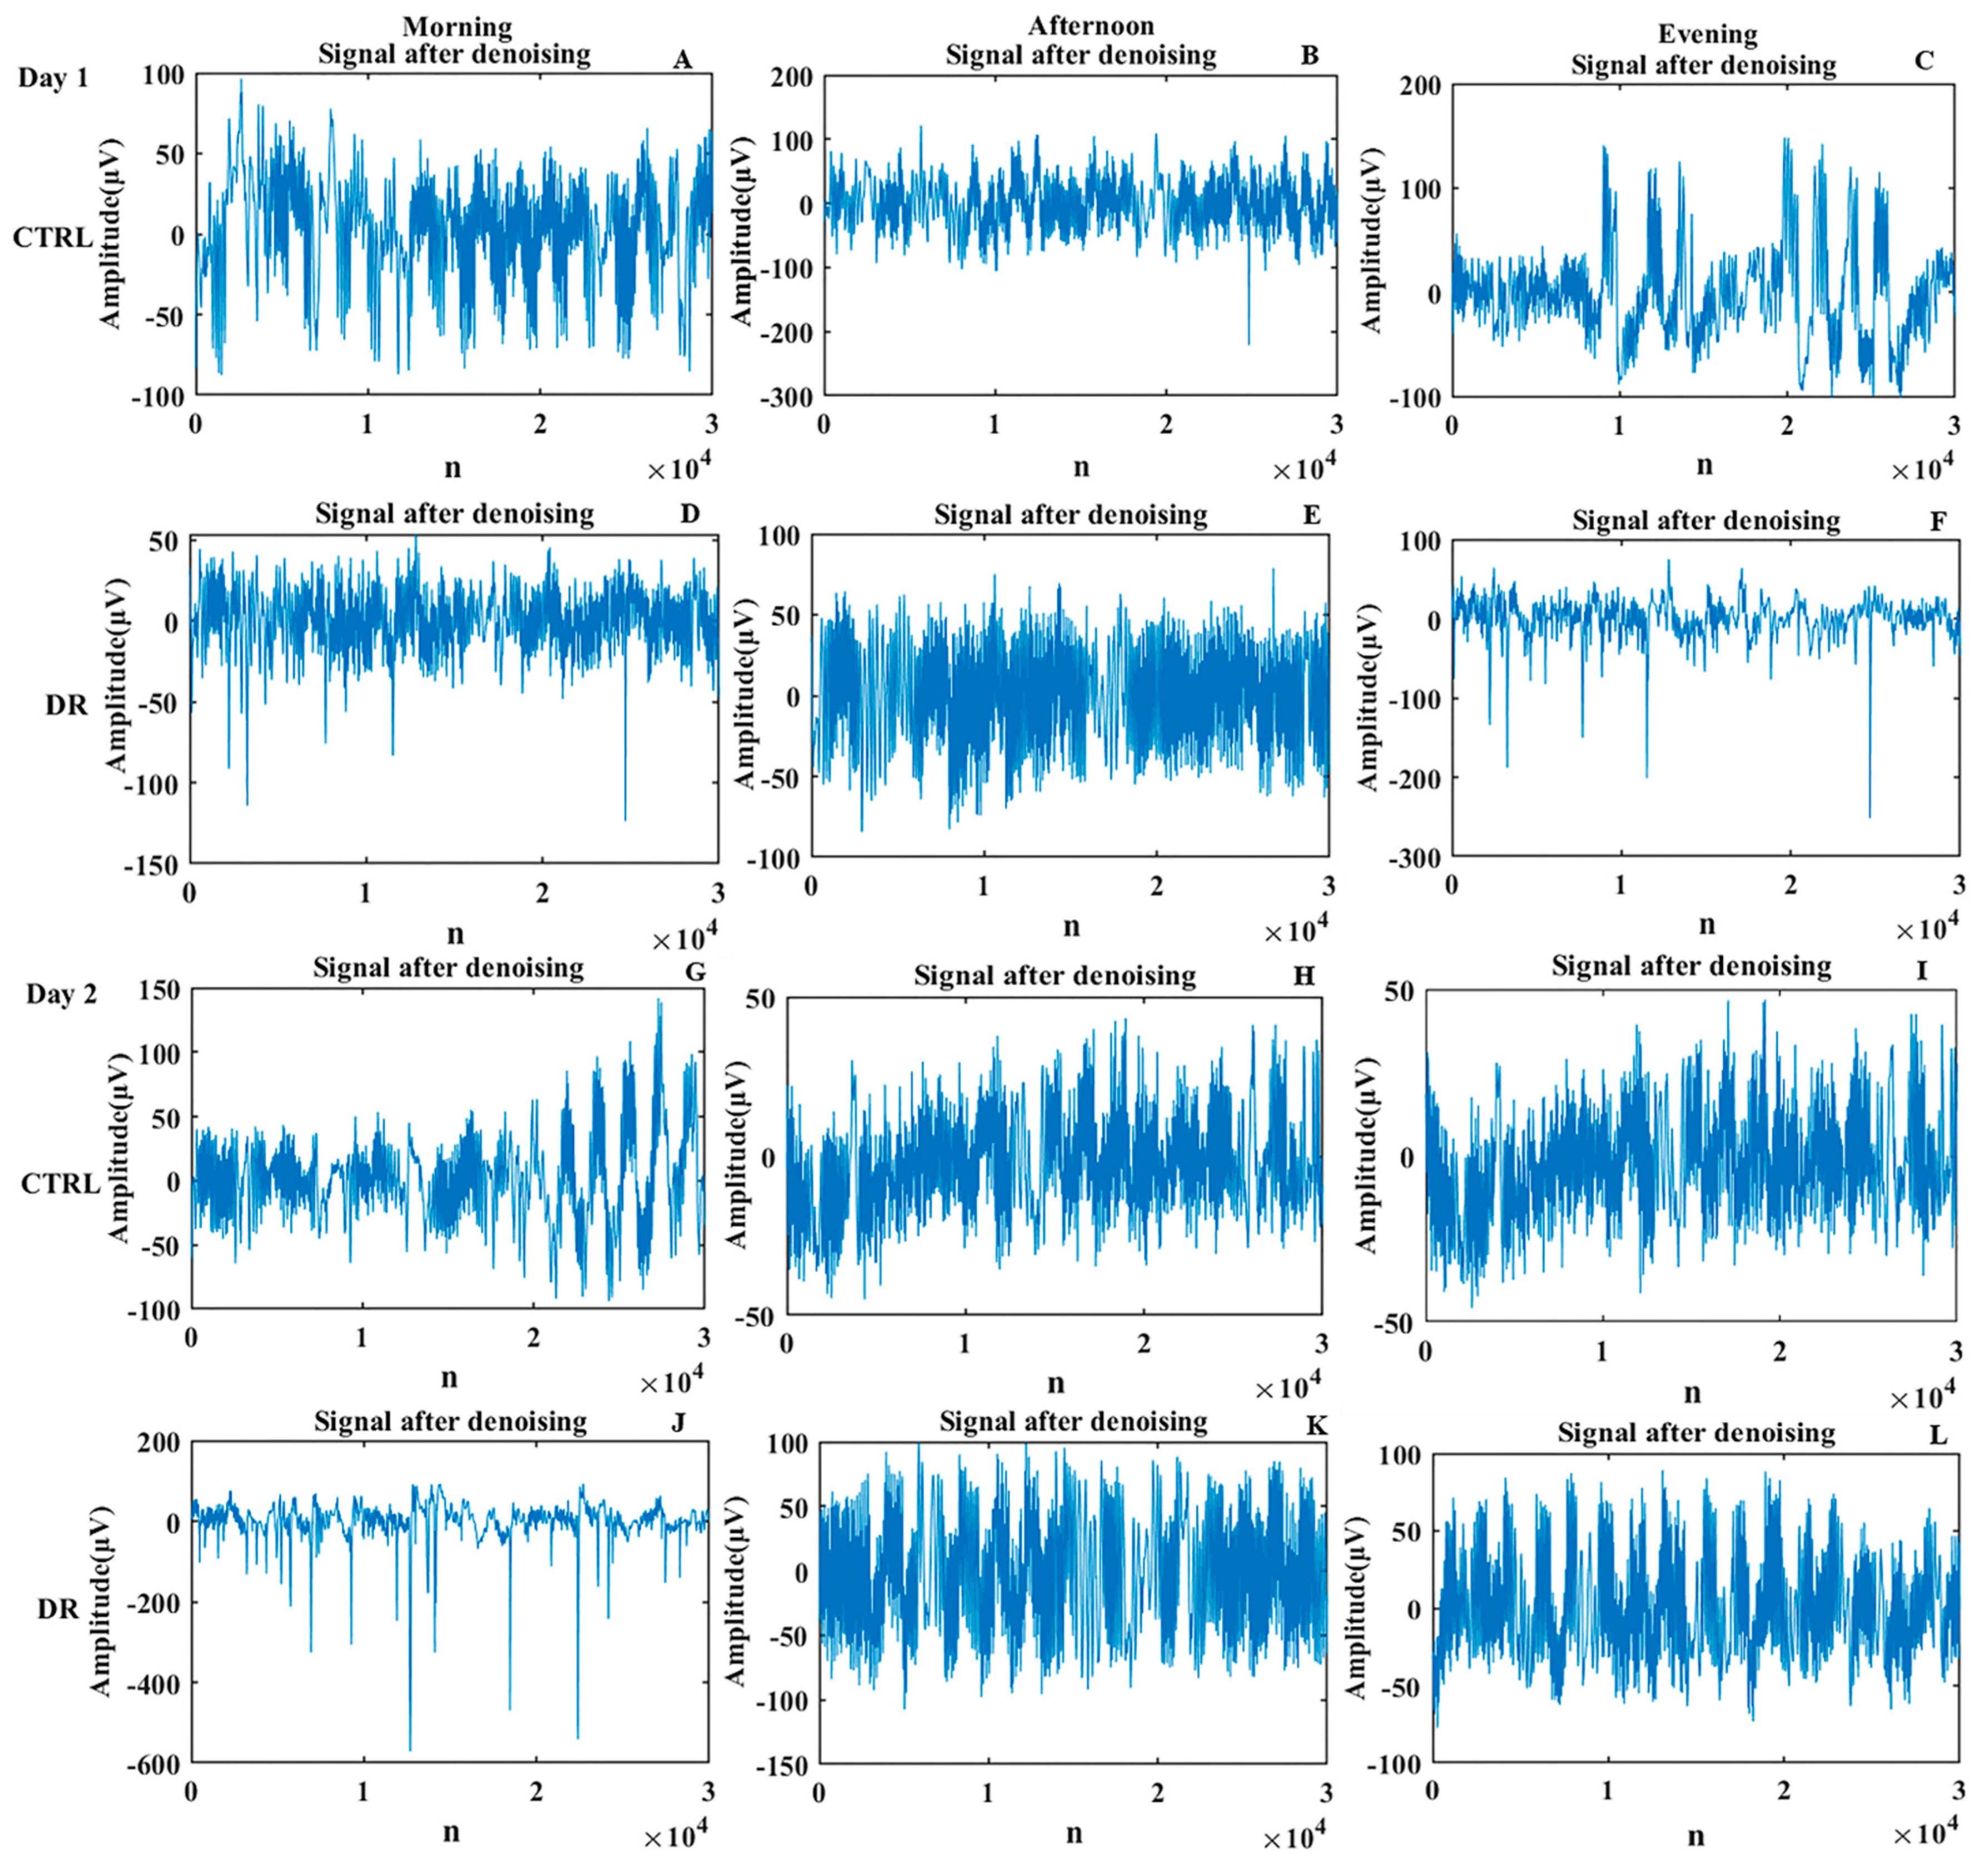
Denoising for Electrical Signal
2.2.2. Physiological Parameters
Root Vitality (RV)
Maximal Photochemical Efficiency (Fv/Fm)
The Relative Amount of Chlorophyll (SPAD Value)
2.2.3. Data Treatment and Analysis
3. Results
3.1. Electrical Signal
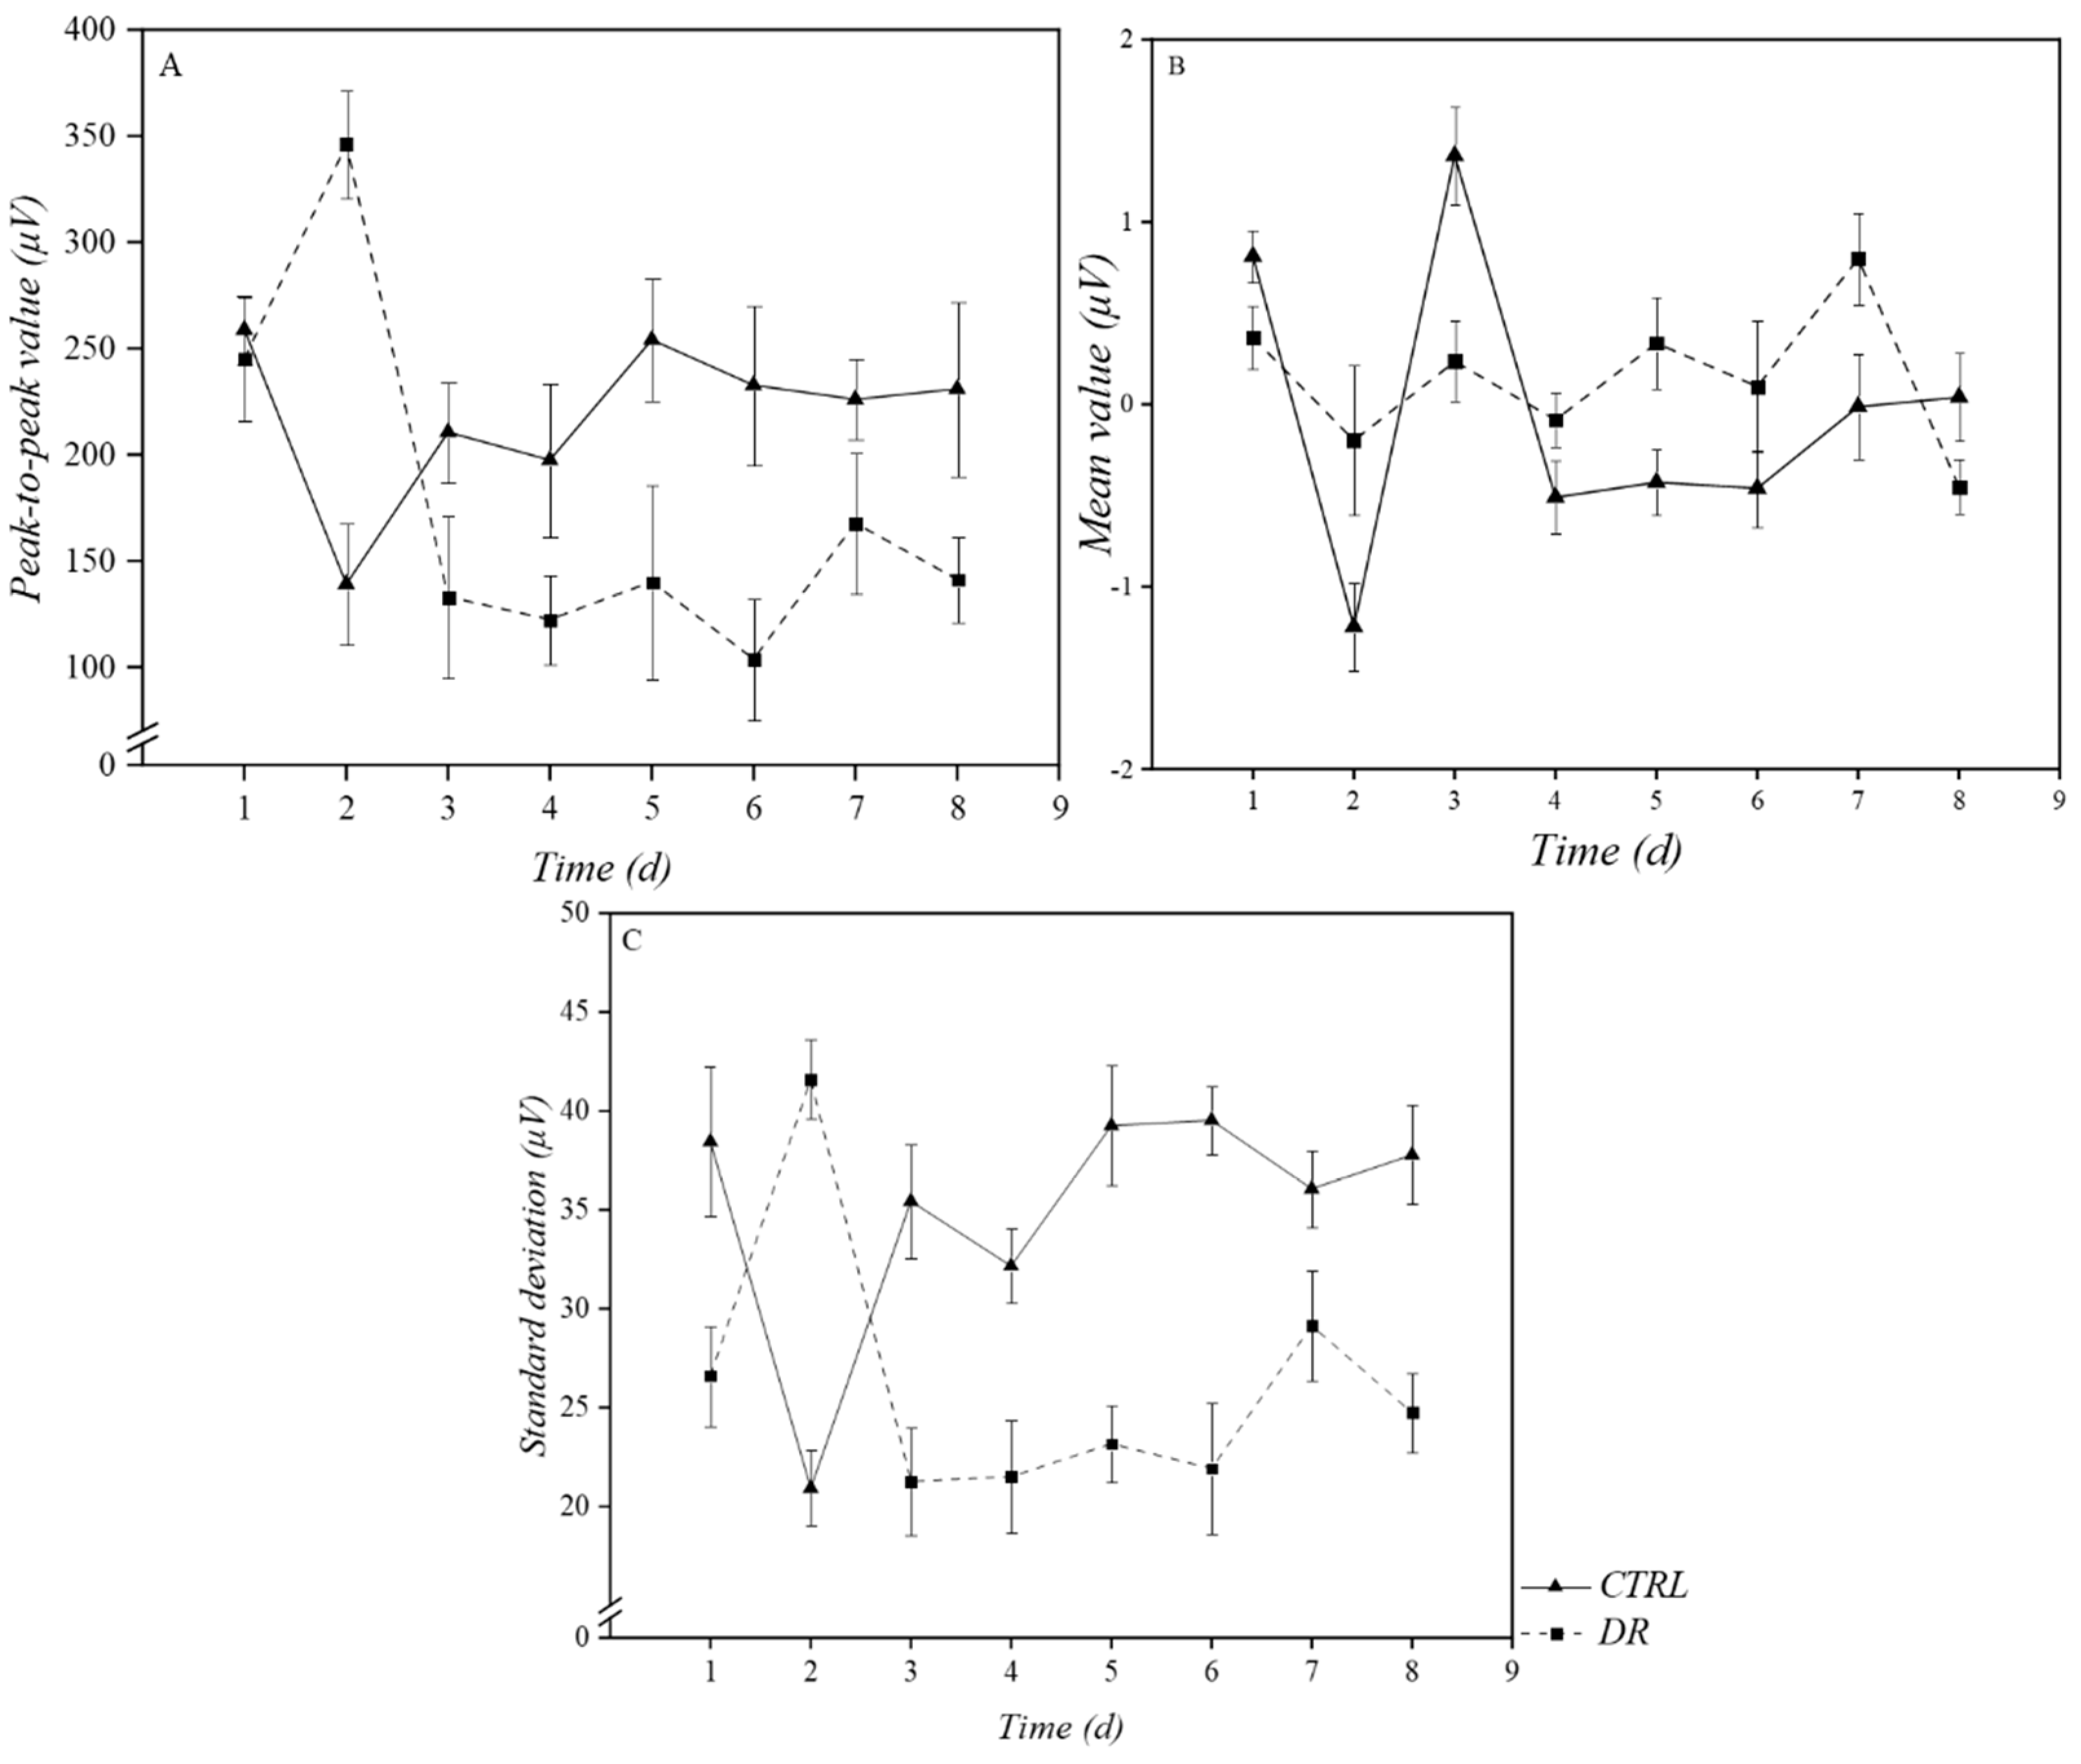
3.1.1. Time-Domain Analysis
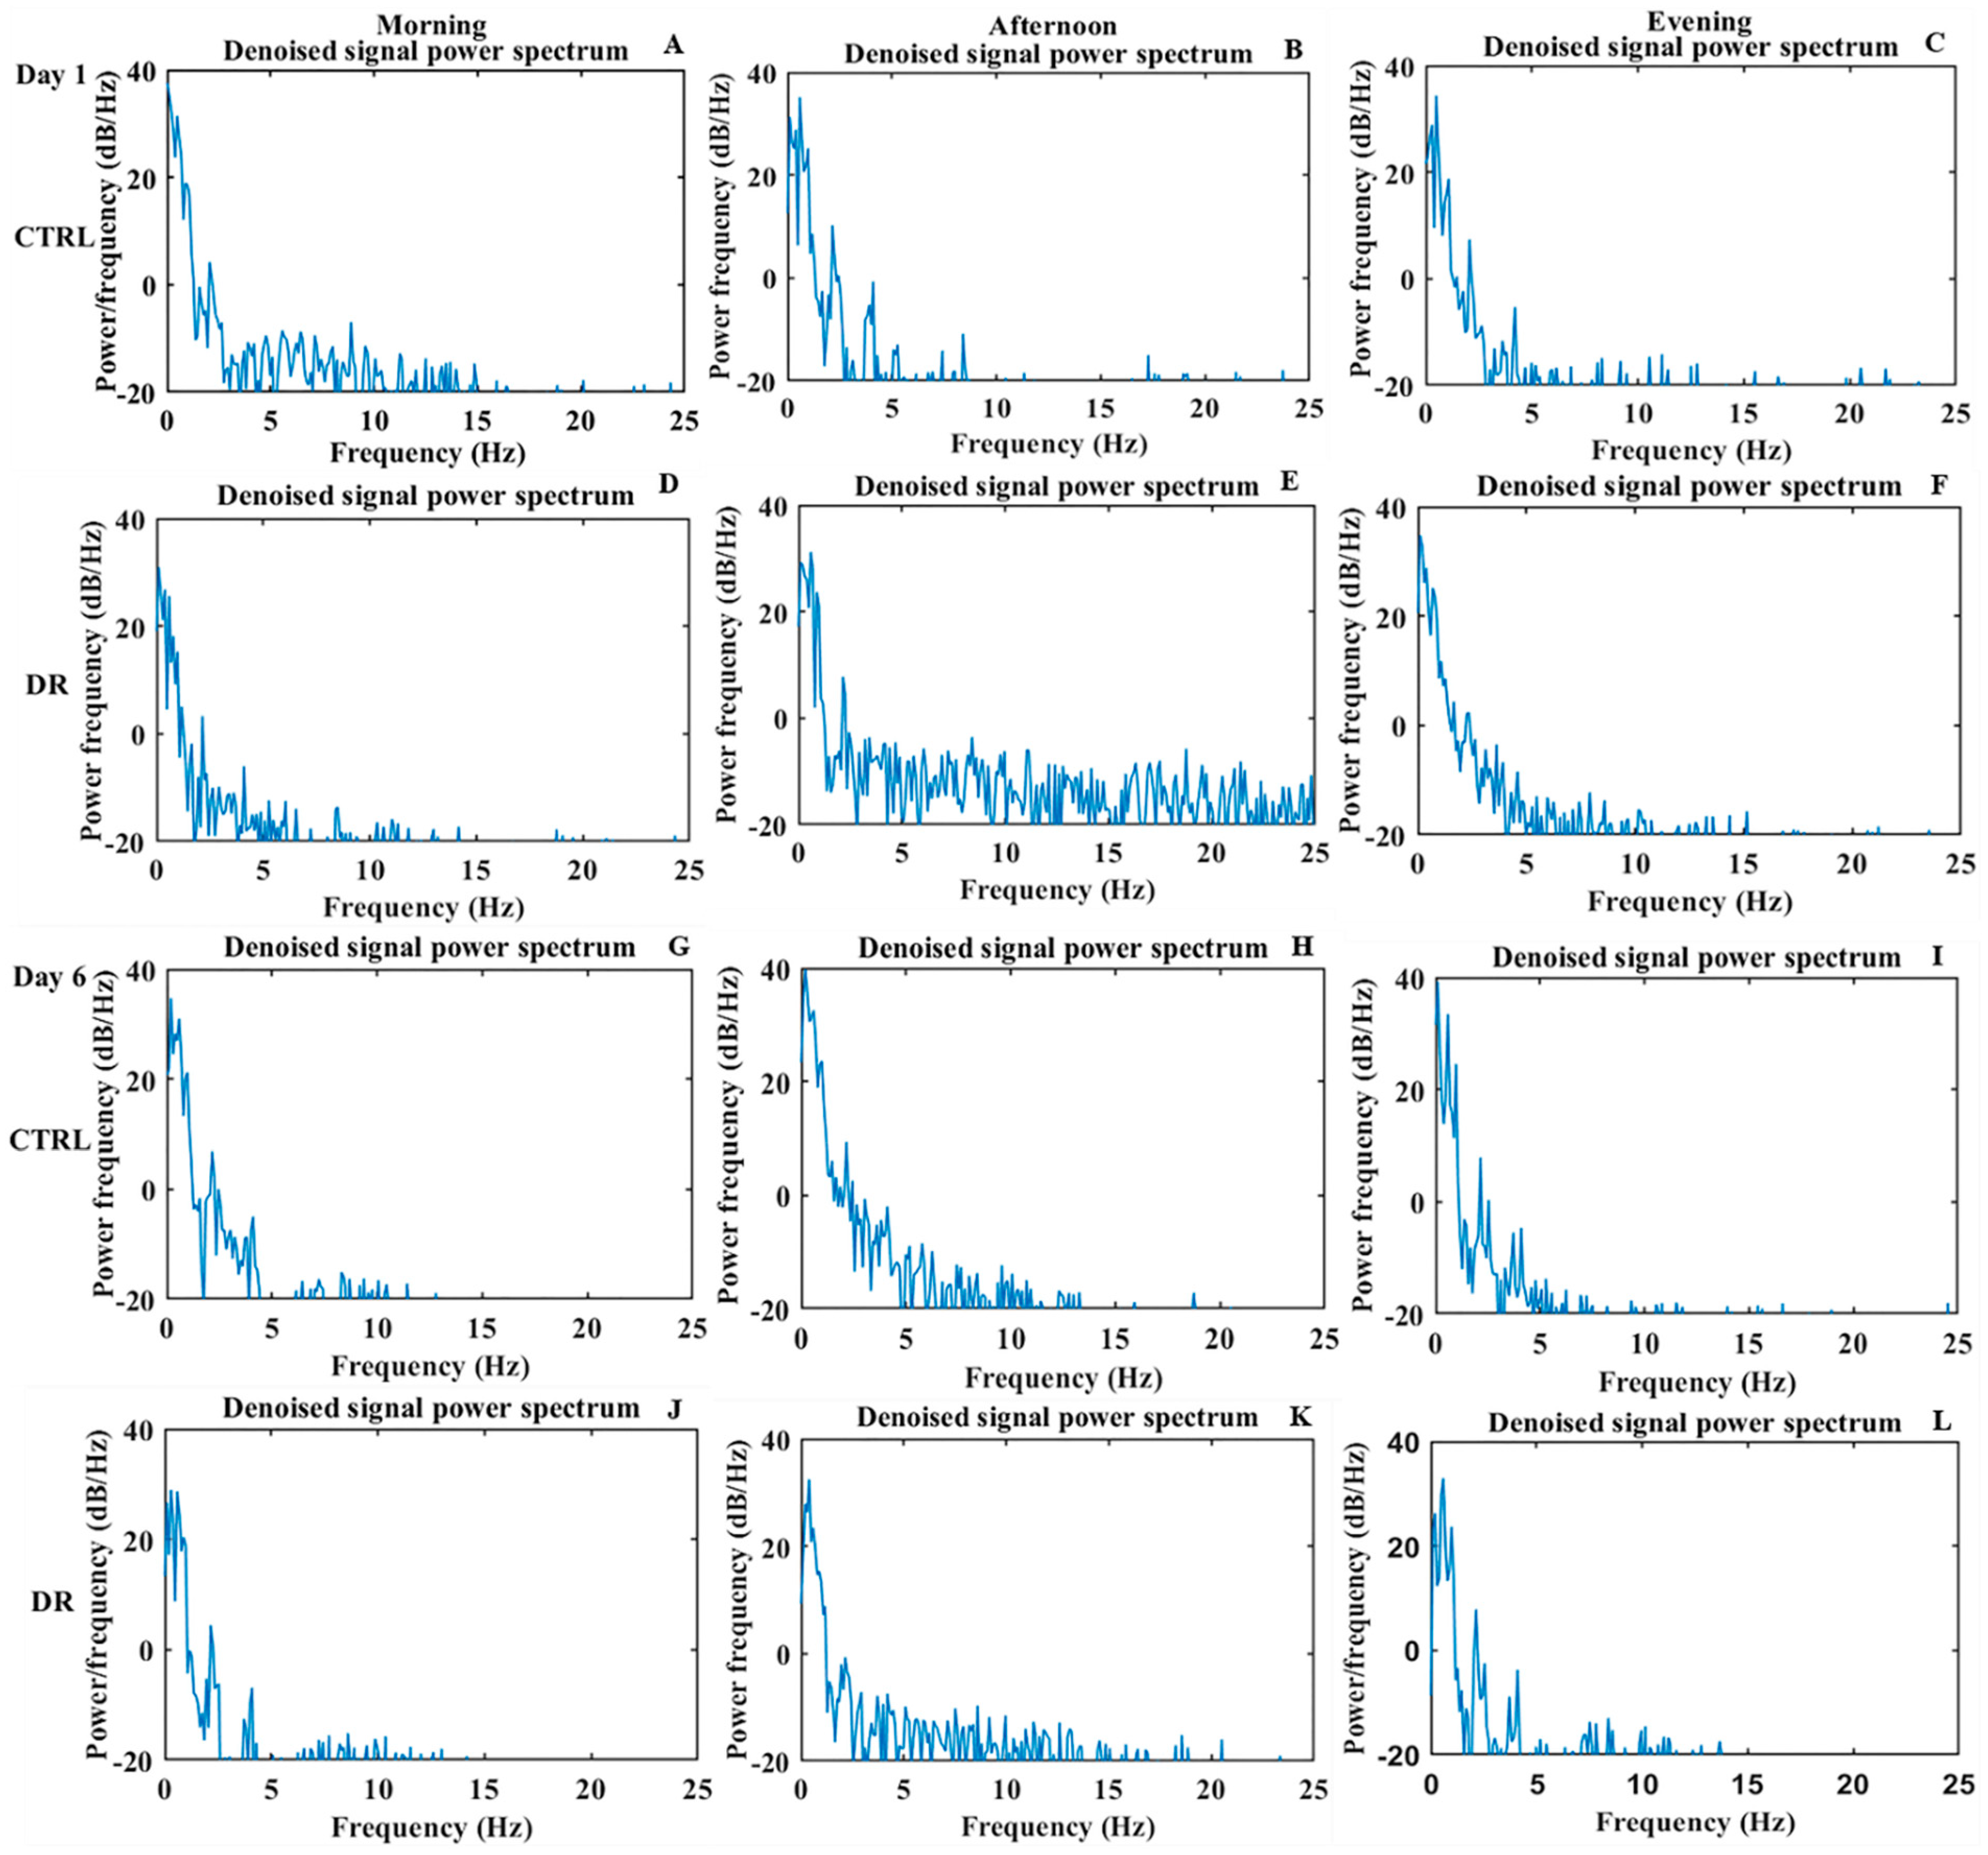
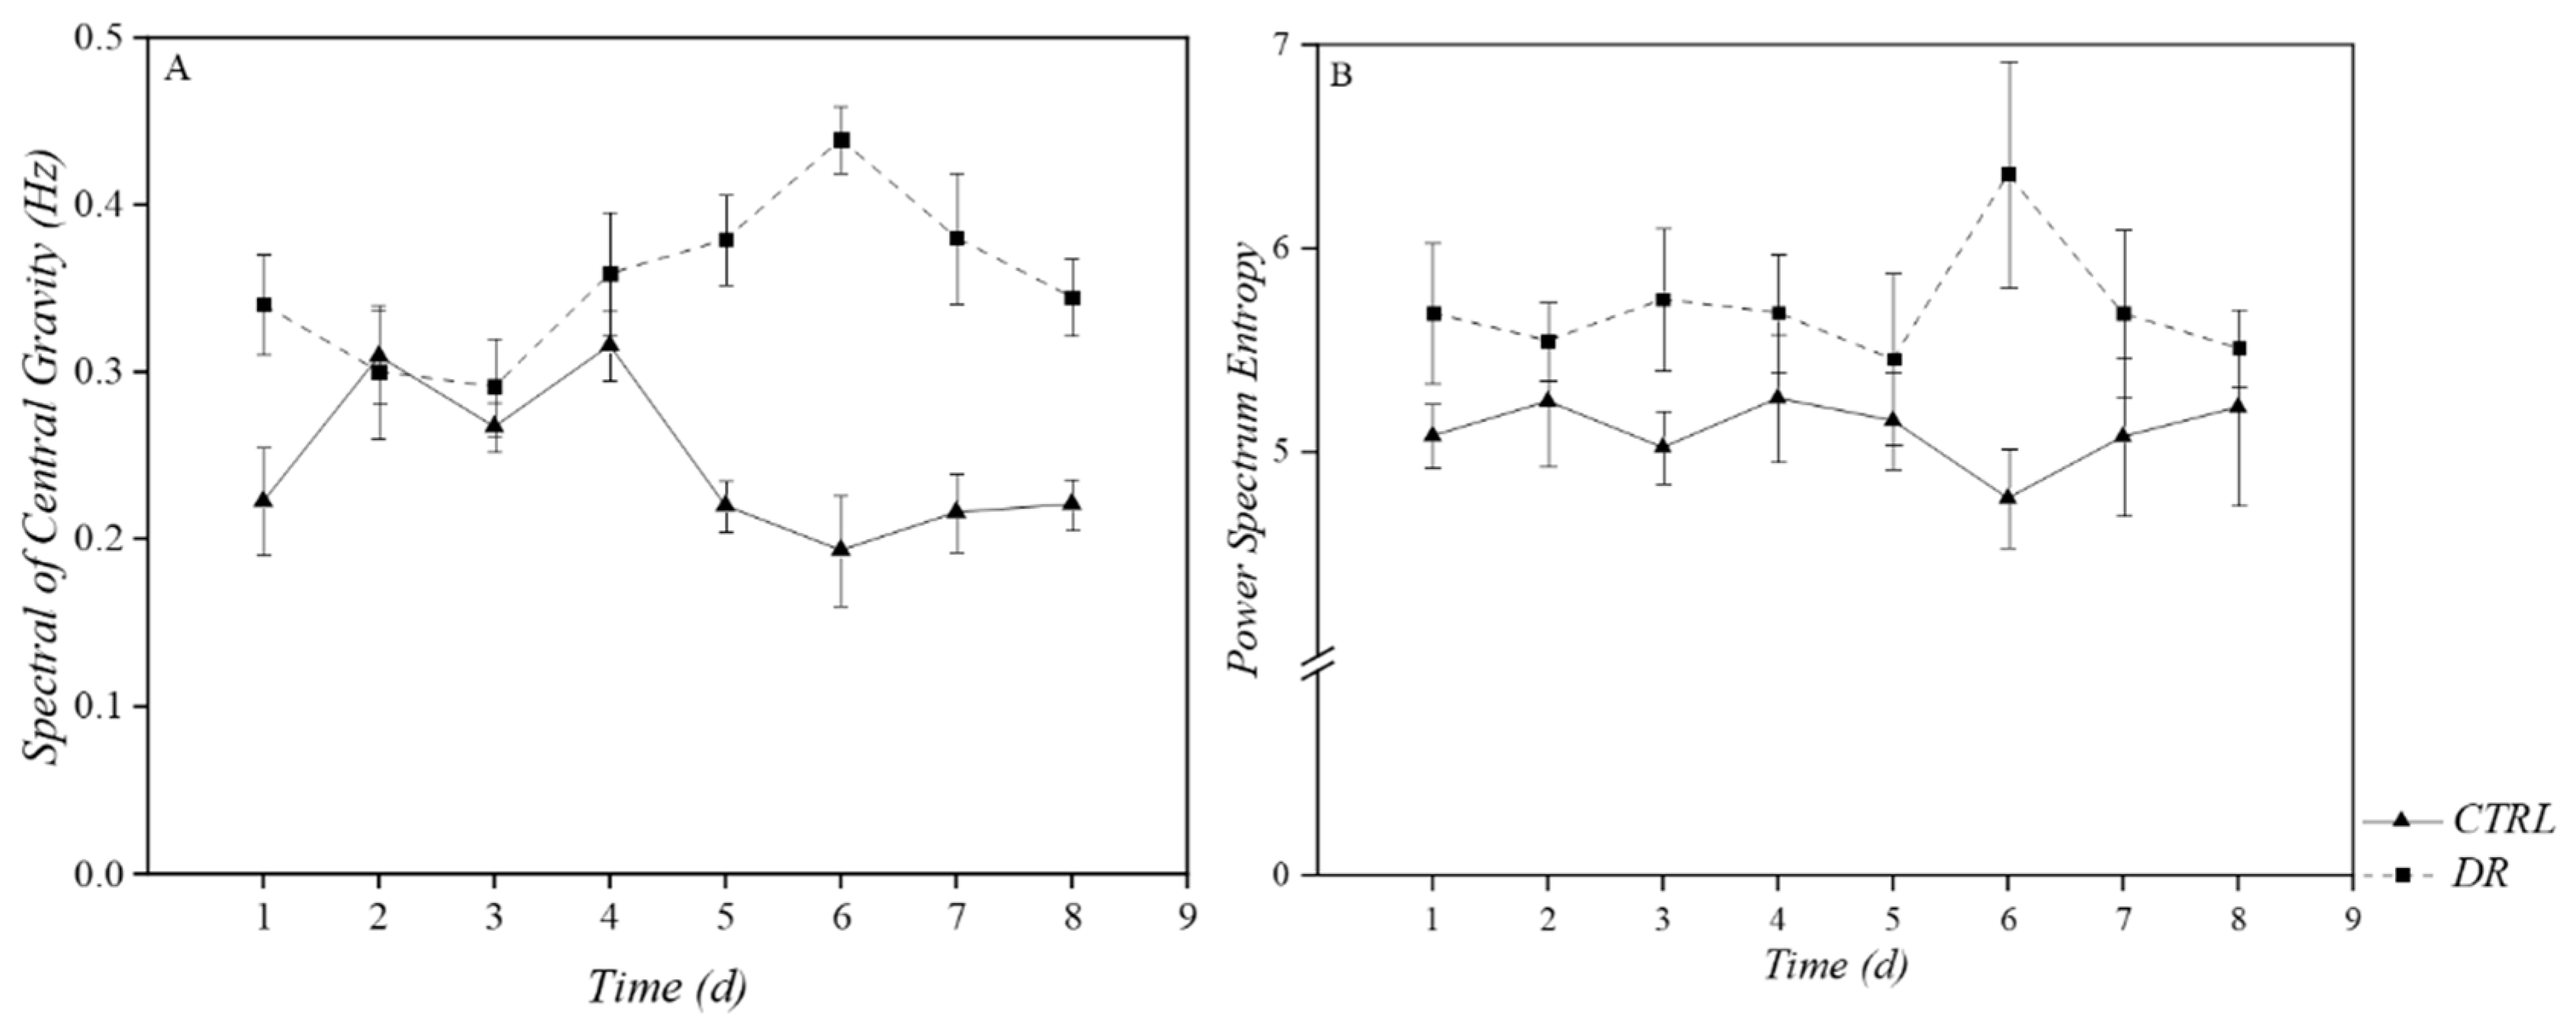
3.1.2. Frequency-Domain Analysis
3.2. Physiological Indicator Results
3.3. Chronological Relationship between Electrical Signals and Physiological Parameters
4. Discussion
5. Conclusions
Author Contributions
Funding
Institutional Review Board Statement
Informed Consent Statement
Data Availability Statement
Acknowledgments
Conflicts of Interest
Abbreviations
| IPCC | the Intergovernmental Panel on Climate Change; |
| SOD | superoxide dismutase; |
| POD | peroxidase; |
| DR | drought treatment; |
| d | day; |
| CTRL | control treatment; |
| PTP | peak-to-peak value; |
| Mean | mean value; |
| SD | standard deviation; |
| SCG | Spectral of Central Gravity; |
| PSE | power spectrum entropy; |
| RV | root vitality; |
| Fv/Fm | maximal photochemical efficiency; |
| SPAD | the relative amount of chlorophyll; |
| AW | action wave; |
| VW | variation wave. |
References
- IPCC. IPCC Launches Complete Synthesis Report. Contribution of Working Groups I, II and III to the Fifth Assessment Report of the Intergovernmental Panel on Climate Change; IPCC: Geneva, Switzerland, 2015; 163p. [Google Scholar]
- Janssen, T.; Fleischer, K.; Luyssaert, S.; Naudts, K.; Han, D. Drought resistance increases from the individual to the ecosystem level in highly diverse neotropical rainforest: A meta-analysis of leaf, tree and ecosystem responses to drought. Biogeosciences 2020, 17, 2621–2645. [Google Scholar] [CrossRef]
- Sun, S.; Jung, E.; Gaviria, J.; Engelbrecht, B.M.J. Drought survival is positively associated with high turgor loss points in temperate perennial grassland species. Funct. Ecol. 2020, 34, 788–798. [Google Scholar] [CrossRef]
- Seleiman, M.F.; Al-Suhaibani, N.; Ali, N.; Akmal, M.; Alotaibi, M.; Refay, Y.; Dindaroglu, T.; Abdul-Wajid, H.H.; Battaglia, M.L. Drought stress impacts on plants and different approaches to alleviate its adverse effects. Plants 2021, 10, 259. [Google Scholar] [CrossRef]
- Dolfi, M.; Dini, C.; Morosi, S.; Comparini, D.; Masi, E.; Pandolfi, C.; Mancuso, S. Electrical signaling related to water stress acclimation. Sens. Bio-Sens. Res. 2021, 32, 100420. [Google Scholar] [CrossRef]
- Chi, X.F.; Han, L. Research on plant adversity stresses. Seed Sci. Technol. 2019, 37, 122–124. [Google Scholar]
- Luo, H.Y.; Jin, J.; Zhao, Q.L.; Deng, H.S.; Liao, C.F.; Fan, J.C.; Pu, T.L.; Han, X.Q. Research progress of drought stress on Moringa oleifera lam. China Trop. Agric. 2021, 4, 21–23, 72. [Google Scholar]
- Zahedi, S.M.; Moharrami, F.; Sarikhani, S.; Padervand, M. Selenium and silica nanostructure-based recovery of strawberry plants subjected to drought stress. Sci. Rep. 2020, 10, 17672. [Google Scholar] [CrossRef]
- Wang, D.; Sun, C.H. Effects of water stress on physiological characteristics of strawberry leaves. Shandong Agric. Sci. 2013, 45, 72–74. [Google Scholar] [CrossRef]
- Klamkowski, K.; Treder, W. Response to drought stress of three strawberry cultivars grown under greenhouse conditions. J. Fruit Ornam. Plant. Res. 2008, 16, 179–188. [Google Scholar]
- Ghaderi, N.; Siosemardeh, A. Response to drought stress of two strawberry cultivars (Cv. Kurdistan and Selva). Hortic. Environ. Biotechnol. 2011, 52, 6–12. [Google Scholar] [CrossRef]
- Xue, X.P.; Liu, J. Effects of water stress on biochemical characteristics of apple seedlings. North. Gard. 2017, 20, 72–76. [Google Scholar]
- Xiao, S.H.; Sun, H.B.; Zhang, W.Q.; Huang, F.F.; Gan, X.H.; Tang, C.B. Effect of drought stress on photosynthetic physiology of Heritiera littoralis seedlings. J. For. Environ. 2021, 41, 584–592. [Google Scholar] [CrossRef]
- Shi, Y.J. The Effect of Drought Stress on Growth and Physiological Characteristics of Sassafras Tsumu Seedlings. Master’s Thesis, Zhejiang A&F University, Hangzhou, China, 15 June 2016. [Google Scholar]
- Zhang, Q.H.; Zeng, X.G.; Xiang, F.Y.; Han, Y.C.; Chen, F.Y.; Guo, C.; Han, Y.P.; Gu, Y.C. Effects on photosynthetic characteristics of strawberry seedlings under drought stress. Hubei Agric. Sci. 2016, 55, 6147–6150. [Google Scholar] [CrossRef]
- Sanderson, J.B. Note on the electrical phenomena which accompany irritation of the leaf of Dionaea muscipula. Nature 1873, 21, 495–496. [Google Scholar] [CrossRef] [Green Version]
- Brenner, E.D.; Stahlberg, R.; Mancuso, S.; Vivanco, J. Plant Neurobiology: An Integrated View of Plant Signaling. Trends Plant Sci. 2006, 11, 413–419. [Google Scholar] [CrossRef] [PubMed]
- Schroeder, J.I.; Hedrich, R. Involvement of ion channels and active transport in osmoregl alation and signaling of higher plant cells. Trends Biochem. Sci. 1989, 14, 187–192. [Google Scholar] [CrossRef]
- García-Servín, M.Á.; Mendoza-Sánchez, M.; Contreras-Medina, L.M. Electrical signals as an option of communication with plants: A review. Theor. Exp. Plant Physiol. 2021, 33, 125–139. [Google Scholar] [CrossRef]
- Datta, P.; Palit, P. Relationship between environmental factors and diurnal variation of bioelectric potentials of an intact jute plant. Curr. Sci. 2004, 87, 680–683. [Google Scholar]
- Chatterjee, S.K.; Ghosh, S.; Das, S.; Manzella, V.; Vitaletti, A.; Masi, E.; Santopolo, L.; Mancuso, S.; Maharatna, K. Forward and inverse modelling approaches for prediction of light stimulus from electrophysiological response in plants. Measurement 2014, 53, 101–116. [Google Scholar] [CrossRef] [Green Version]
- Wang, X.L.; Tian, L.G.; Li, M.; Li, Y.S. Analysis of the variation of electrical signals with illumination in the swallow palm. Jiangsu Agric. Sci. 2016, 44, 64–66, 141. [Google Scholar] [CrossRef]
- Fromm, J.; Lautner, S. Electrical signals and their physiological significance in plants. Plant Cell Environ. 2007, 30, 249–257. [Google Scholar] [CrossRef] [PubMed]
- Wang, Z.Y.; Fan, L.F.; Wang, Y.Q.; Li, J.H.; Zhou, Q.; Huang, L.; Wang, Z.Y. Selection of recording pattern of plant surface electrical signal based on analysis of electrical characteristics. Trans. Chin. Soc. Agric. Eng. 2018, 34, 137–143. [Google Scholar] [CrossRef]
- Gao, X.; Xi, G.; Liu, K.; Liu, Q. The study of de-noising method about plant electrical signal based on wavelet. J. Xi’an Univ. Technol. 2013, 29, 92–97. [Google Scholar] [CrossRef]
- Verma, N.; Verma, A.K. Performance analysis of wavelet thresholding methods in denoising of audio signals of some Indian musical instruments. Int. J. Eng. Sci. Technol. 2012, 4, 6. [Google Scholar]
- Valencia, D.; Orejuela, D.; Salazar, J.; Valencia, J. Comparison analysis between rigrsure, sqtwolog, heursure and minimaxi techniques using hard and soft thresholding methods. In Proceedings of the 2016 XXI IEEE Symposium on Signal Processing, Images and Artificial Vision (STSIVA), Bucaramanga, Colombia, 31 August–2 September 2016; pp. 1–5. [Google Scholar]
- Clemensson-Lindell, A. Triphenyltetrazolium chloride as an indicator of fine-root vitality and environmental stress in coniferous forest stands: Applications and limitations. Plant Soil 1994, 159, 297–300. [Google Scholar] [CrossRef]
- Yu, X.L.; Zhang, J.B.; Wang, J. Relation between scalp potentialand heart rate variability basedon power spectral analysis. J. Xi’an Jiaotong Univ. 2007, 41, 991–994. [Google Scholar] [CrossRef]
- Liu, Q.; Zhihui, L.I.; Jiyou, W.U. Research progress on leaf anatomical structures of plants under drought stress. Agric. Sci. Technol. 2016, 17, 4–7, 14. [Google Scholar] [CrossRef]
- Nasir, M.W.; Toth, Z. Effect of drought stress on potato production: A review. Agronomy 2022, 12, 635. [Google Scholar] [CrossRef]
- Šebelík, V.; Kuznetsova, V.; Lokstein, H.; Polívka, T. Transient absorption of chlorophylls and carotenoids after two-photon excitation of LHCII. J. Phys. Chem. Lett. 2021, 12, 3176–3181. [Google Scholar] [CrossRef]
- Lunch, C.K.; LaFountain, A.M.; Thomas, S.; Frank, H.A.; Lewis, L.A.; Cardon, Z.G. The xanthophyll cycle and NPQ in diverse desert and aquatic green algae. Photosynth. Res. 2013, 115, 139–151. [Google Scholar] [CrossRef]
- Zhang, K.; Chen, B.-H.; Hao, Y.; Yang, R.; Wang, Y.-A. Effects of short-term heat stress on PSII and subsequent recovery for senescent leaves of Vitis vinifera L. Cv. red globe. J. Integr. Agric. 2018, 17, 2683–2693. [Google Scholar] [CrossRef]
- Hussain, M.I.; El-Keblawy, A.; Tsombou, F.M. Leaf age, canopy position, and habitat affect the carbon isotope discrimination and water-use efficiency in three C3 leguminous prosopis species from a hyper-arid climate. Plants 2019, 8, 402. [Google Scholar] [CrossRef] [PubMed] [Green Version]
- Agrawal, D.; Jajoo, A. Study of high temperature stress induced damage and recovery in photosystem II (PSII) and photosystem I (PSI) in spinach leaves (Spinacia oleracia). J. Plant Biochem. Biotechnol. 2021, 30, 532–544. [Google Scholar] [CrossRef]
- Ueki, K.; Iwamori, H. Geochemical differentiation processes for arc magma of the sengan volcanic cluster, northeastern Japan, constrained from principal component analysis. Lithos 2017, 290–291, 60–75. [Google Scholar] [CrossRef]
- Xie, J.; Wu, Y.; Xing, D.; Li, Z.; Chen, T.; Duan, R.; Zhu, X. A comparative study on the circadian rhythm of the electrical signals of Broussonetia papyrifera and Morus alba. Plant Signal. Behav. 2021, 16, 1950899. [Google Scholar] [CrossRef]
- Debono, M.W. Dynamic protoneural networks in plants. Plant Signal. Behav. Dyn. Protoneural Netw. Plants 2019, 8, e24207. [Google Scholar] [CrossRef] [Green Version]
- Szechyńska-Hebda, M.; Maria, L.; Witoń, D.; Yosef, F.; Ron, M.; Karpiński, S.M. Aboveground plant-to-plant electrical signaling mediates network acquired acclimation. Plant Cell 2022. [Google Scholar] [CrossRef]
- Van, B.A.J.E.; Furch, A.; Torsten, W.; Buxa, S.V.; Rita, M.; Hafke, J.B. Spread the news: Systemic dissemination and local impact of Ca2+ signals along the phloem pathway. J. Exp. Bot. 2014, 65, 1761–1787. [Google Scholar] [CrossRef]
- Gallé, A.; Lautner, S.; Flexas, J.; Fromm, J. Environmental stimuli and physiological responses: The current view on electrical signalling. Environ. Exp. Bot. 2015, 114, 15–21. [Google Scholar] [CrossRef]
- Tracey, C.; Ingo, D.; Erwan, M. The role of potassium channels in arabidopsis thaliana long distance electrical signalling: AKT2 modulates tissue excitability while GORK shapes action potentials. Int. J. Mol. Sci. 2018, 19, 926. [Google Scholar] [CrossRef] [Green Version]
- Lu, J.X. Reaearch on relationship between environmental factors and features of electrical signals in plants. Nanjing Agric. Univ. 2012. [Google Scholar] [CrossRef]
- Zhang, C.; Wu, Y.; Su, Y.; Xing, D.; Dai, Y.; Wu, Y.; Fang, L. A Plant’s electrical parameters indicate its physiological state: A study of intracellular water metabolism. Plants 2020, 9, 1256. [Google Scholar] [CrossRef] [PubMed]
- Comparini, D.; Masi, E.; Pandolfi, C.; Sabbatini, L.; Dolfi, M.; Morosi, S.; Mancuso, S. Stem electrical properties associated with water stress conditions in olive tree. Agric. Water Manag. 2020, 234, 106109. [Google Scholar] [CrossRef]
- Sukhov, V.; Sukhova, E.; Vodeneev, V. Long-distance electrical signals as a link between the local action of stressors and the systemic physiological responses in higher plants. Prog. Biophys. Mol. Biol. 2019, 146, 63–84. [Google Scholar] [CrossRef]
- Ben Hamed, K.; Zorrig, W.; Hamzaoui, A.H. Electrical impedance spectroscopy: A tool to investigate the responses of one halophyte to different growth and stress conditions. Comput. Electron. Agric. 2016, 123, 376–383. [Google Scholar] [CrossRef]


| Pairwise Comparison | Process-Time | |||||||
|---|---|---|---|---|---|---|---|---|
| 1 d | 2 d | 3 d | 4 d | 5 d | 6 d | 7 d | 8 d | |
| PTP | 0.875 | 0.012 * | 0.324 | 0.339 | 0.150 | 0.105 | 0.456 | 0.255 |
| Mean | 0.694 | 0.314 | 0.267 | 0.674 | 0.450 | 0.578 | 0.421 | 0.624 |
| SD | 0.131 | 0.005 ** | 0.047 * | 0.130 | 0.025 * | 0.015 * | 0.319 | 0.066 |
| SCG | 0.245 | 0.940 | 0.793 | 0.600 | 0.079 | 0.010 * | 0.063 | 0.172 |
| PSE | 0.255 | 0.530 | 0.132 | 0.375 | 0.521 | 0.002 ** | 0.206 | 0.535 |
| RV | 0.394 | 0.700 | / | 0.010 * | / | / | 0.006 ** | 0.027 * |
| Fv/Fm | 0.611 | 0.939 | 0.598 | 0.768 | 0.596 | 0.618 | 0.006 ** | 0.000 ** |
| SPAD | 0.253 | 0.956 | 0.313 | 0.585 | 0.529 | 0.678 | 0.048 * | 0.042 * |
Publisher’s Note: MDPI stays neutral with regard to jurisdictional claims in published maps and institutional affiliations. |
© 2022 by the authors. Licensee MDPI, Basel, Switzerland. This article is an open access article distributed under the terms and conditions of the Creative Commons Attribution (CC BY) license (https://creativecommons.org/licenses/by/4.0/).
Share and Cite
Zhou, J.; Yuan, W.; Di, B.; Zhang, G.; Zhu, J.; Zhou, P.; Ding, T.; Qian, J. Relationship among Electrical Signals, Chlorophyll Fluorescence, and Root Vitality of Strawberry Seedlings under Drought Stress. Agronomy 2022, 12, 1428. https://doi.org/10.3390/agronomy12061428
Zhou J, Yuan W, Di B, Zhang G, Zhu J, Zhou P, Ding T, Qian J. Relationship among Electrical Signals, Chlorophyll Fluorescence, and Root Vitality of Strawberry Seedlings under Drought Stress. Agronomy. 2022; 12(6):1428. https://doi.org/10.3390/agronomy12061428
Chicago/Turabian StyleZhou, Juan, Weidong Yuan, Bao Di, Guanghua Zhang, Jianxi Zhu, Pengyu Zhou, Tianran Ding, and Ji Qian. 2022. "Relationship among Electrical Signals, Chlorophyll Fluorescence, and Root Vitality of Strawberry Seedlings under Drought Stress" Agronomy 12, no. 6: 1428. https://doi.org/10.3390/agronomy12061428
APA StyleZhou, J., Yuan, W., Di, B., Zhang, G., Zhu, J., Zhou, P., Ding, T., & Qian, J. (2022). Relationship among Electrical Signals, Chlorophyll Fluorescence, and Root Vitality of Strawberry Seedlings under Drought Stress. Agronomy, 12(6), 1428. https://doi.org/10.3390/agronomy12061428