
Methodological Design to Determine Water Resource Management Indicators in Irrigation Districts

 ,
,
Abstract
1. Introduction
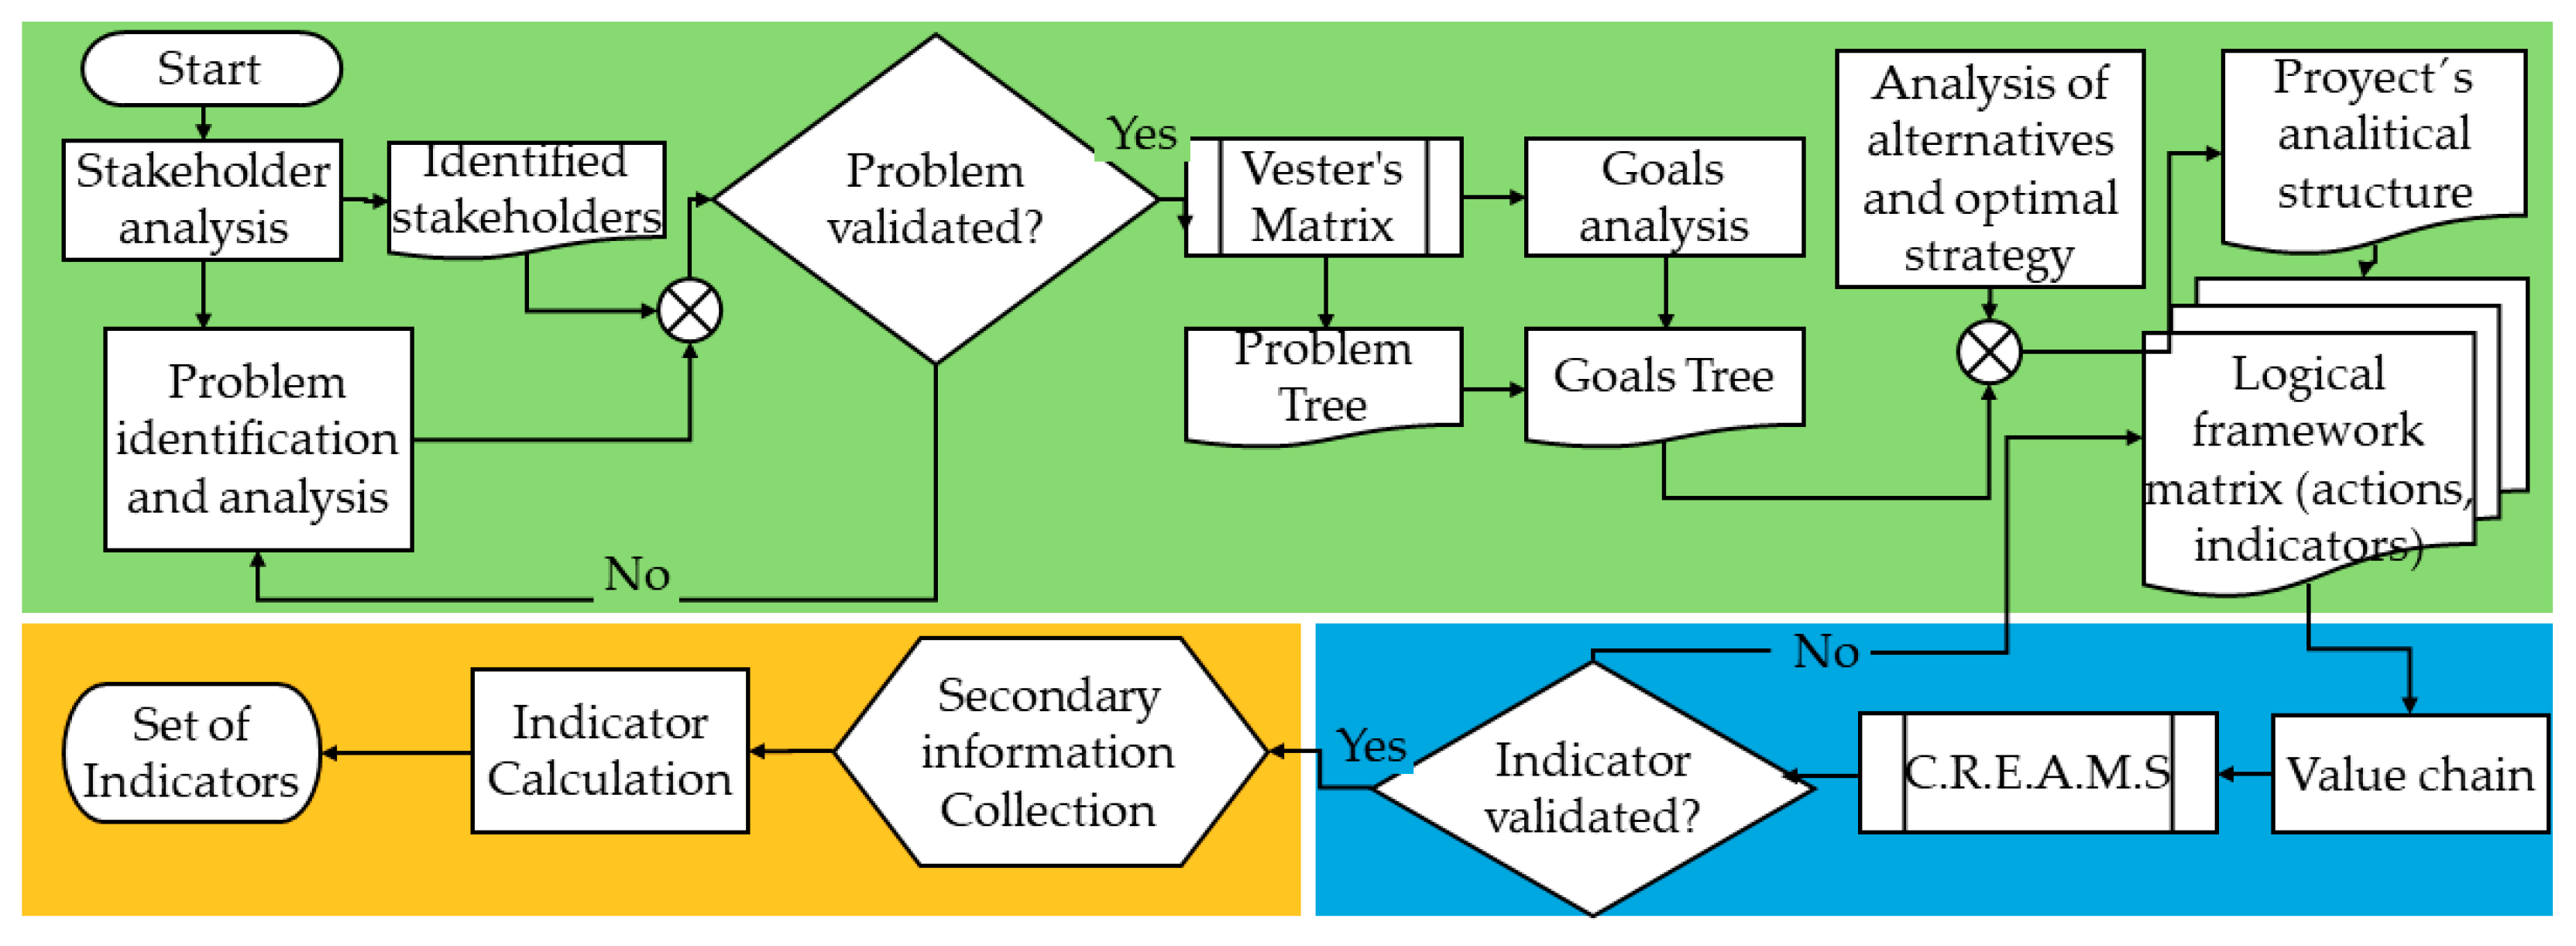
2. Materials and Methods
2.1. Step 1: Stakeholder Analysis
2.2. Step 2: Identify and Analyze the Problem
2.3. Step 3: Vester Matrix
2.4. Step 4: Problem Tree—Objectives
2.5. Step 5: Analysis of Alternatives and Optimal Strategy
2.6. Step 6: Logical Framework Matrix
2.7. Step 7: Selecting Indicators: Structuring and Validation
- -
- Value chain methodology
- -
- CREAMS
3. Results
3.1. Categorization of Stakeholders and Associated Problems
3.2. Objectives and Analytical Structure of the Study
3.3. Logical Framework Matrix
3.4. Selection of Management Indicators
4. Discussion
5. Conclusions
Author Contributions
Funding
Data Availability Statement
Conflicts of Interest
References
- Alamanos, A.; Mylopoulos, N.; Loukas, A.; Gaitanaros, D. An Integrated Multicriteria Analysis Tool for Evaluating Water Resource Management Strategies. Water 2018, 10, 1795. [Google Scholar] [CrossRef]
- Xuebin, Q.I.; Huang, Z.; Qiao, D.; Zhang, X.; Li, P.; Andersen, M.N. Research advances on thereasonable water resources allocation in irrigation district. Adv. Water Sci. 2015, 26, 287–295. [Google Scholar]
- Aguilar-Sánchez, G.; De La Cruz-Ángeles, J. Gestión del Agua En El Distrito 011, Los Módulos de Riego De Acámbaro Y Salvatierra, Guanajuato México. Rev. Geográfica América Cent. 2016, 2, 153. [Google Scholar] [CrossRef][Green Version]
- Calzadilla, A.; Rehdanz, K.; Tol, R.S.J. The economic impact of more sustainable water use in agriculture: A computable general equilibrium analysis. J. Hydrol. 2010, 384, 292–305. [Google Scholar] [CrossRef]
- Pereira, L. Indicadores de Desempenho de Sistemas Hídricos E de Sistemas de Rega. In El Agua En Iberoamérica. Aspectos de La Problemática de Las Tierras Secas; AF Cirelli e E.M. Abraham. CYTED XVII; CYTED: Buenos Aires, Argentina, 2003; pp. 131–140. [Google Scholar]
- Galindo, A.; Corell, M.; Martín-Palomo, M.J.; Teresa, C. Combination of Indicators for Increasing Irrigation Sustainability. Definition of a Hydrosustainable Index. In Proceedings of the EGU General Assembly Conference Abstracts, online, 19–30 April 2021. [Google Scholar] [CrossRef]
- Bos, M. Performance indicators for irrigation and drainage. Irrig. Drain Syst. 1997, 11, 119–137. [Google Scholar] [CrossRef]
- Iñiguez-Covarrubias, M.O.; Waldo, O.V.M. Productivity analysis of the Río Bravo irrigation districts using performance indicators. Ing. Agríc. Biosist. 2020, 12, 131–158. [Google Scholar] [CrossRef]
- Alvarez, I.; Manrique, O.; Cid, E.P. Sustainability indicators for the use of water in irrigation systems. Univ. Cienc. 2022, 11, 10. Available online: http://revistas.unica.cu/uciencia (accessed on 23 March 2022).
- Vázquez, V.M.O.; Poyato, E.C.; Díaz, J.A.R.; Lugo, J.L.M.; Hernández, M.L.H. Determinación de indicadores de gestión en los módulos del Distrito de Riego No. 041, Río Yaqui (Sonora, México). Rev. Fac. Cienc. Agrar. 2017, 49, 149–168. [Google Scholar]
- Moreno-Pérez, M.F.; Roldán-Cañas, J. Assessment of irrigation water management in the Genil-Cabra (Córdoba, Spain) irrigation district using irrigation indicators. Agric Water Manag. 2013, 120, 98–106. [Google Scholar] [CrossRef]
- Soto-García, M.; Martínez-Alvarez, V.; García-Bastida, P.A.; Alcon, F.; Martin-Gorriz, B. Effect of water scarcity and modernisation on the performance of irrigation districts in south-eastern Spain. Agric. Water Manag. 2013, 124, 11–19. [Google Scholar] [CrossRef]
- Salomón, M.; Ríos, C.G.; Rubio, C.; Galárraga, R.; Abraham, E. Indicadores de uso del agua en una zona de los Andes centrales de Ecuador. Estudio de la cuenca del Río Ambato. Ecosistemas 2008, 17, 14. [Google Scholar]
- Bos, M.G.; Burton, M.A.; Molden, D.J. (Eds.) Irrigation and Drainage Performance Assessment: Practical Guidelines; CABI: London, UK, 2005. [Google Scholar] [CrossRef]
- Sakthivadivel, R.; De Fraiture, C.; Molden, D.J.; Perry, C.; Kloezen, W. Indicators of Land and Water Productivity in Irrigated Agriculture. Int. J. Water Resour. Dev. 1999, 15, 161–179. [Google Scholar] [CrossRef]
- Lorite, I.J.; García-Vila, M.; Carmona, M.A.; Santos, C.; Soriano, M.A. Assessment of the Irrigation Advisory Services’ Recommendations and Farmers’ Irrigation Management: A Case Study in Southern Spain. Water Resour. Manag. 2012, 26, 2397–2419. [Google Scholar] [CrossRef]
- Alcon, F.; García-Bastida, P.A.; Soto-García, M.; Martínez-Alvarez, V.; Martin-Gorriz, B.; Baille, A. Explaining the performance of irrigation communities in a water-scarce region. Irrig. Sci. 2017, 35, 193–203. [Google Scholar] [CrossRef]
- Muema, F.; Home, P.; Raude, J. Application of Benchmarking and Principal Component Analysis in Measuring Performance of Public Irrigation Schemes in Kenya. Agriculture 2018, 8, 162. [Google Scholar] [CrossRef]
- Wang, Y.; Wu, J. An Empirical Examination on the Role of Water User Associations for Irrigation Management in Rural China. Water Resour. Res. 2018, 54, 9791–9811. [Google Scholar] [CrossRef]
- Perfetti, J.J.; Bravo-Ureta, B.E.; García, A.; Blanco, J.; Jara-Rojas, R.; Moraga, C.; Paredes, G. Adecuación de tierras y el desarrollo de la agricultura colombiana: Políticas e instituciones. Fedesarrollo 2019, 447, 456. [Google Scholar]
- DNP. Guía Para el Seguimiento de Políticas Públicas; Departamento Nacional de Planeación: Bogotá D.C., Colombia, 2018. Available online: www.dnp.gov.co (accessed on 17 February 2019).
- Ortegón, E.; Pacheco, J.F.; Prieto, A. Metodología del Marco Lógico Para la Planificación, el Seguimiento y la Evaluación de Proyectos y Programas; Naciones Unidas, CEPAL; Latinoamericano y del Caribe de Planificación Económica y Social. 2015. Available online: http://www.cepal.org/publicaciones/Ilpes/0/LCL2350P/manual42.pdf (accessed on 23 February 2022).
- DNP. Guia Metodológica Para la Formulación de Indicadores; Departamento Nacional de Planeación. Scripto Gómez y Rosales: Bogotá D.C., Colombia, 2009. Available online: www.dnp.gov.co (accessed on 17 February 2019).
- Aston, B. 9 Ejemplos de Metodología de un Proyecto, Simplificados. Metodologías de Gestión de Proyectos. Published 2022. Available online: https://thedigitalprojectmanager.com/es/metodologias-gestion-proyectos-simplificadas/ (accessed on 23 April 2019).
- Li, R.; Verhagen, W.J.C.; Curran, R. Stakeholder-oriented systematic design methodology for prognostic and health management system: Stakeholder expectation definition. Adv. Eng. Inform. 2020, 43, 101041. [Google Scholar] [CrossRef]
- Fraser, E.D.G.; Dougill, A.J.; Mabee, W.E.; Reed, M.; McAlpine, P. Bottom up and top down: Analysis of participatory processes for sustainability indicator identification as a pathway to community empowerment and sustainable environmental management. J. Environ. Manag. 2006, 78, 114–127. [Google Scholar] [CrossRef]
- Forero, A.; Cuéllar, A.; Castellanos, A.; Gómez, A.; Rojas, C.; Flórez, C.; Repetto, E.; Alvarado, S. Guía Para la Etapa de Administración, Operación, Mantenimiento y Manejo Integral de Distritos de Adecuación de Tierras; UPRA: Bogotá, Colombia, 2018. Available online: https://www.upra.gov.co/web/guest/publicaciones (accessed on 20 February 2019).
- UPRA. Linea Base de Indicadores de Usos Agropecuarios y Adecuación de Tierras; Unidad de Planificación Rural Agropecuaria: Bogotá D.C., Colombia, 2015. [Google Scholar]
- Massiris, Á. Definición de Modelo Territorial Agropecuario y Estrategia de Ocupación y Uso del Territorio Agropecuario; UPRA: Bogotá D.C., Colombia, 2016. Available online: https://www.upra.gov.co/web/guest/publicaciones (accessed on 20 February 2019).
- Betancourt, D.F. Matriz de Vester Para la Priorización de Problemas. Published 19 June 2016. Available online: www.ingenioempresa.com/matriz-de-vester (accessed on 14 June 2019).
- Golini, R.; Kalchschmidt, M.; Landoni, P. Adoption of project management practices: The impact on international development projects of non-governmental organizations. Int. J. Proj. Manag. 2015, 33, 650–663. [Google Scholar] [CrossRef]
- Zall Kusec, J.; Rist, R.C. Ten Stteps to a Results-Based Monitoring and Evaluation System; World Bank: Washington, DC, USA, 2004; Available online: www.worldbank.org (accessed on 5 November 2020).
- IDEAM. Estudio Nacional del Agua 2018; IDEAM: Bogotá D.C., Colombia, 2019. Available online: http://ideam.gov.co/web/guest (accessed on 15 October 2020).
- Córcoles, J.I.; de Juan, J.A.; Tarjuelo, J.M. La gestión del agua y la energía en el regadío mediante técnicas de Benchmarking. Español 2010, 106, 28. [Google Scholar]


| Objectives | Narrative Summary of Objectives |
|---|---|
| Goal | This describes the solution to problems of high-level and national, sectoral, or regional importance that have been diagnosed. It also represents a development objective that obeys a strategic level (development policies), that is, it helps to establish the context in which the study fits and describes the long-term impact to which the study is expected to contribute. |
| Purpose | This describes the direct effect (behavioral changes) or expected result at the end of the execution period and refers to the change that the project will face. It is a hypothesis about what will happen as a result of producing and using the components. The title of the study must arise directly from the definition of the purpose. |
| Components | These are the specific works, studies, services, and training that are required to produce, in this case, the LADs. Each of the components of the study must be necessary to achieve the purpose, and it is reasonable to assume that the purpose will be achieved if the components are properly produced. |
| Activities | These comprise those actions that the beneficiary of the study must conduct to produce each component and involve the use of resources. A detailed list of activities should be drawn up as the starting point of the implementation plan, in chronological order and grouped by component. |
| ID | Classification | Name | Expectation | Strength | Resultant |
|---|---|---|---|---|---|
| 03AU | AU | Rural Development Agency | 5 | 5 | 25 |
| 01AU | AU | Ministry of Agriculture and Rural Development | 5 | 4 | 20 |
| 02AU | AU | Agricultural Rural Planning Unit | 5 | 3 | 15 |
| 07BE | BE | Associations’ Users | 5 | 3 | 15 |
| 05AU | AU | Territorial Entities | 3 | 4 | 12 |
| 11FN | FN | Financial Institutions | 4 | 3 | 12 |
| 04AU | AU | Regional Autonomous Corporations | 2 | 5 | 10 |
| 08IA | IA | Institute of Hydrology, Meteorology, and Environmental Studies | 3 | 2 | 6 |
| 06BE | BE | Irrigation Districts Users | 5 | 1 | 5 |
| 10IA | IA | Agricultural Research Centers | 4 | 1 | 4 |
| 09IA | IA | Universities | 3 | 1 | 3 |
| Type | ID | Problem | x | y | Score |
|---|---|---|---|---|---|
| Critical | 6AU | Irrigation districts have poor water resource management | 42 | 27 | 69 |
| 5BE | Water concessions for irrigation districts are insufficient | 24 | 29 | 53 | |
| 2BE | Irrigation water of poor quality | 26 | 23 | 49 | |
| Actives (Causes) | 7BE | Deficient and unjustified rural public policies | 47 | 7 | 54 |
| 8BE | Poor monitoring of hydrological variables affecting the district | 35 | 12 | 47 | |
| 4AU | Widespread absence of productive management in Land Adequacy Districts | 28 | 16 | 44 | |
| 2AU | Conflict of use of the soils of the properties benefited by land adequacy that usually overuse the soils | 27 | 16 | 43 | |
| 3BE | Deterioration of civil works (infrastructure) | 26 | 12 | 38 | |
| Passives (Effects) | 1BE | Insufficient water resources for crop irrigation | 22 | 40 | 62 |
| 1AU | Non-payment of fees by users of Land Adequacy Districts | 23 | 38 | 61 | |
| 4BE | High water service tariffs for irrigation | 18 | 33 | 51 | |
| 3IA | Uncertainty about future land use due to climate change | 10 | 33 | 43 | |
| 8AU | Evidence of high contamination of water resources after irrigation | 7 | 33 | 40 | |
| 6BE | Productivity or yields of crops below the theoretical ceilings of crops or production systems | 9 | 28 | 37 | |
| 5AU | Deterioration of the soils with respect to the properties benefited by land adequacy | 11 | 20 | 31 | |
| Indifferences | 7AU | Decentralization of water information and high dispersion of applied irrigation data | 22 | 17 | 39 |
| 3AU | Ignorance of excess dumping into rivers and streams | 18 | 19 | 37 | |
| 2IA | Low efficiency in applications in the irrigated crop area | 21 | 9 | 30 | |
| 1IA | Low efficiency in water conduction | 15 | 10 | 25 | |
| 4IA | There are no criteria for classifying Land Adequacy Districts | 15 | 9 | 24 | |
| 1FN | Failure to meet the beneficiaries’ financial obligations due to the low profitability of the initially projected harvests | 4 | 19 | 23 |
| ID | Classification | Objectives |
|---|---|---|
| OP | Main objective | Land Adequacy Districts ensure proper water resource management |
| FI1 | Purposes | Water resources sufficient for agriculture irrigation |
| FI2 | Purposes | Provision of sufficient water to Land Adequacy Districts |
| FI3 | Purposes | Irrigation water of good quality |
| FI4 | Purposes | Yields above the theoretical limits of production systems |
| FI5 | Purposes | Water service for irrigation is provided at reasonable rates |
| FI6 | Purposes | Users of Land Adequacy Districts pay fees on time |
| FI7 | Purposes | Sustainable conservation of the soils and properties benefited by land adequacy |
| FI8 | Purposes | In the face of climate change, certainty in the future use of land is essential |
| FI9 | Purposes | Land Adequacy Districts have excellent quality dumping available for reuse |
| ME1 | Media | Water conduction efficiency is high |
| ME2 | Media | Application efficiency in irrigated agricultural areas is high |
| ME3 | Media | Excess discharges into rivers and streams are measured |
| ME4 | Media | Efficient use of soils with respect to the properties benefited by land adequacy |
| ME5 | Media | Adequate and timely maintenance of the infrastructure required by the districts for the collection, management, and distribution of water resources |
| ME6 | Media | Application of centralization and standardization of hydrological and irrigation data |
| ME7 | Media | The district’s land is being managed productively, with the input and approval of the district’s users |
| ME8 | Media | Monitoring of hydrological factors that affect the district in an efficient and effective manner |
| ME9 | Media | Agricultural producers need coordinated, justified, and fair agricultural public policies |
| ID | Type | Actions |
|---|---|---|
| ME5 | Complementary | Developing a maintenance plan, as well as improving or expanding current infrastructure |
| ME7 | Complementary | Adoption of a production order in district properties based on soil suitability |
| ME8 | Complementary | Design of a tool for integrating multiscale hydrological monitoring data for visualization and application in relation to the Land Adequacy District’s geographical scope |
| ME9 | Complementary | Development of a tool for monitoring and assessing water resource management at the district level as a framework for developing new public policies in the land adequacy subsector |
| ID | Components | Actor ID | Activities |
|---|---|---|---|
| CO1 | Water collection, management, and distribution infrastructure maintenance, upgrade, and expansion plan | AC1 | The plan’s preparation and funding |
| CO2 | The Land Adequacy District’s Productive Management Plan | AC2 | The plan’s preparation and funding |
| CO3 | Integrated system for recording and monitoring hydrological data in the district’s geographical area | AC3 | The system’s preparation and funding |
| CO4 | Natural resource management monitoring and assessment tool | AC4 | The tool’s preparation and funding |
| Narrative Summary of Objectives | Pre-Selected Management Indicators | ||
|---|---|---|---|
| Type | Narrative | Indicator (49) | Variable (30) |
| Purposes | FI1. Irrigation is used to manage and ensure sufficient water resources to meet the water requirements of the crops of the Land Adequacy District’s users | 1. Water delivery ratio 2. Relative total water supply 3. Relative supply of irrigation water 4. Relative water supply by rainfall 5. Surface Water Use Index (UIU) * 6. Water Use Efficiency Index (UIS) * 7. Standardized Precipitation Index (SPI) * 8. Shortage Vulnerability Index (IVH) * | 1. Evapotranspiration crops 2. Effective precipitation 3. Water requirements of crops 4. Irrigable area 5. Watered area 6. Volume of irrigation water supplied to each user 7. Total volume of water entering the system |
| FI2. Manage and maintain the concession of sufficient water for the district for land sufficiency with respect to the appropriate environmental authority | 9. Guarantee of supply 10. Recruitment ratio 11. Aridity Index (IA) * 12. Water Retention and Regulation Index (IRH) * 13. Ecosystem Water Pressure Index (IPHE) * 14. Non-Basin Water Index (IARC) * | 8. Price of water 9. Volume of irrigation water entering the system 10. Concessional volume | |
| FI3. Manage and ensure that the water resource is of excellent quality so that the Land Adequacy District users’ crops can be irrigated correctly | 15. Water Quality Index (ACI) * 16. Mean Sediment Yield Index (IRS) * | 11. Electrical conductivity irrigation water 12. Biochemical oxygen demand irrigation water 13. Chemical oxygen demand irrigation water 14. Sodium adsorption ratio irrigation water 15. Salinity irrigation water 16. Average sediment concentration | |
| FI4. Achieve the highest possible yields from the users of the Land Adequacy District’s production systems | 17. Gross margin per unit of irrigated area 18. Energy productivity per crop 19. Productivity per unit of irrigated area 20. Crop yield per unit of irrigated area 21. Value of agricultural production per unit of irrigated area | 17. Agricultural production 18. Total value of agricultural production | |
| FI5. Agree on suitable water use rates for the Land Adequacy District’s users | 22. Energy cost per unit of irrigation water supplied 23. Energy cost per unit of irrigated area 24. Cost of maintenance and operation per unit of irrigation water supplied 25. Cost of maintenance and operation per unit of irrigated area 26. Staff cost per unit of irrigation water supplied 27. Cost of personnel per unit of irrigated area 28. Relative cost of the service 29. Workers per unit area 30. Active energy consumed per unit of irrigated area 31. Area irrigated per worker | 19. Cost of operating the system 20. Energy cost 21. Maintenance cost 22. Personnel cost 23. Active energy consumed 24. Number of workers | |
| FI6. Land Adequacy District users pay water use fees on time | 32. Efficiency in collection 33. Collection rate 34. Cost recovery ratio 35. Ratio of maintenance costs and returns | 25. Income 26. Billing | |
| FI7. Sustainable conservation of the soils and properties benefited by land adequacy | 36. Relative depth of the water table | 27. Number of days with flooded drainage 28. Changes in the depth of the water table | |
| FI8. Ensure land use in the conditions of climate change scenarios | |||
| FI9. Improve the quality of wastewater so that it can be reused | 37. Salt balance 38. Unit of nitrogen fertilizer per unit of water supplied 39. Nitrogen fertilizer unit per irrigated area unit 40. Potential Water Quality Alteration Index (IACAL) * | 29. Salinity of drainage water 30. Nitrogen fertilizer unit 31. Biological oxygen demand of drainage water 32. Chemical oxygen demand of drainage water | |
| Components | CO1. Water collection, management, and distribution infrastructure maintenance, upgrade, and expansion plan | 41. Water conduction efficiency 42. Distribution efficiency 43. Fraction of operation, conservation, and maintenance 44. Relationship of application at the property level 45. Relationship of use of irrigation infrastructure | |
| CO2. The Land Adequacy District’s Productive Management Plan | 46. Relationship of the effectiveness of infrastructure (works of art) | ||
| CO3. Integrated system for recording and monitoring hydrological data in the district’s geographical area | |||
| CO4. Natural resource management monitoring and assessment tool | |||
| Activities | AC1. The plan’s preparation and funding for water collection, management, and distribution infrastructure maintenance, upgrade, and expansion | 33. Investments | |
| AC2. The Land Adequacy District’s Productive Management preparation and funding | |||
| AC3. Integrated system preparation and funding | |||
| AC4. Tool’s preparation and funding | |||
| Link | Type of Indicators | Indicators |
|---|---|---|
| Inputs | Management | 1. Water Quality Index (ACI) 2. Surface Water Use Index (IUA) 3. Water Retention and Regulation Index (IRH) 4. Shortage Vulnerability Index (IVH) 5. Potential Water Quality Alteration Index (IACAL) 6. Water conduction efficiency 7. Irrigation infrastructure usage index 8. Relative depth of the water table |
| Activities | Management | 9. Guarantee of supply 10. Operation and maintenance cost per unit of irrigation water supplied 11. Cost of operation and maintenance per unit of irrigated area 12. Collection rate 13. Application at the property level |
| Results | Result | 14. Relative total water supply 15. Relative supply of irrigation water 16. Crop yield per unit irrigated area 17. Gross margin per unit of irrigated area |
| Indicator | CREAMS Criteria | |||||||||
|---|---|---|---|---|---|---|---|---|---|---|
| N | Name | Definition and Object | C | R | E | A | M | S | Mean | Approval |
| 1 | Water Quality Index (ICA) | This allows the analysis of quality conditions at specific points of a current at the time the measurement is made; it is calculated using the measurements of the six representative variables of the main pollutants (DO, COD, SST, CE, pH, NT/PT ratio) [33] | 4.18 | 4.27 | 4.00 | 4.09 | 4.27 | 4.18 | 4.17 | YES |
| 2 | Surface Water Use Index (IUA) | Amount of water used by the different user sectors in each period (annual, monthly) and spatial unit of analysis (area, zone, subzone) of the surface water supply available for the same units of time and space; it allows the analysis of the quantities used by the different sectors of the economy within a hydrographic unit [33] | 4.00 | 4.27 | 3.55 | 3.91 | 3.73 | 3.45 | 3.82 | YES |
| 3 | Water Retention and Regulation Index (IRH) | The indicator associated with the natural regime of the basins that qualitatively qualifies the capacity of retention and water regulation, using the shape of the curve of the duration of average daily flows (CDC) to indicate the areas that drain more stably and the occurrence of extreme flows [33] | 3.73 | 4.18 | 3.27 | 3.73 | 3.64 | 3.36 | 3.65 | YES |
| 4 | Vulnerability Index due to Shortages (IVH) | This index is calculated from a matrix of relationships between the water regulation index and the water use index; it measures the degree of fragility of the water system to maintain an offer that allows the supply of water from sectors that use the resource, both in average hydrological conditions and extremely dry years [33] | 3.91 | 4.18 | 3.09 | 3.91 | 3.27 | 3.27 | 3.61 | YES |
| 5 | Potential Water Quality Alteration Index (IACAL) | This accounts for the pressure of pollutants discharged into surface water systems (organic matter, suspended solids, and nutrients) that affect water quality conditions [33] | 3.82 | 4.09 | 3.00 | 3.64 | 3.18 | 3.45 | 3.53 | NO |
| 6 | Water conduction efficiency | This is the ratio between the total volumes delivered to the user vs. the total volume entering the system; it quantifies the efficiency operating in the system between the source and the delivery points and indicates the efficiency with which water demands are met | 4.55 | 4.45 | 3.82 | 4.09 | 4.18 | 3.64 | 4.12 | YES |
| 7 | Irrigation infrastructure usage index | This is the relationship between the irrigated area vs. the irrigable area; it evaluates the interest of farmers in the use of available irrigation resources and indicates their interest in the use of irrigation services | 4.09 | 4.27 | 4.00 | 4.18 | 3.91 | 3.45 | 3.98 | YES |
| 8 | Relative depth of the water table | This evaluates the appearance of drainage and is defined as the relationship between the current depth of the water table during a given period and the critical depth in the same period | 3.46 | 4.00 | 2.64 | 3.73 | 3.27 | 3.64 | 3.46 | NO |
| 9 | Guarantee of supply | This evaluates the management of the DAT before the Regional Autonomous Corporation regarding the surface water concession and is defined as the relationship between the amount of water entering the system and the volume to which it is entitled | 3.55 | 4.00 | 3.09 | 3.73 | 3.36 | 3.55 | 3.55 | YES |
| 10 | Operation and maintenance cost per unit of irrigation water supply | This relates the annual costs necessary for the operation of the DAT (consisting of personnel costs, maintenance, district administration management, and other miscellaneous costs) and the total volume supplied to users in the same period | 4.27 | 4.27 | 4.00 | 4.27 | 4.09 | 3.36 | 4.04 | YES |
| 11 | Cost of operation and maintenance per unit of irrigated area | This relates the annual costs necessary for the operation of the DAT (consisting of personnel costs, maintenance, district administration management, and other miscellaneous costs) and the total adequate area of the DAT in the same period | 4.27 | 4.18 | 4.09 | 3.91 | 4.27 | 3.27 | 4.00 | YES |
| 12 | Collection ratio | This evaluates the acceptance of the services by the users and is defined by the collection in a certain period on the billing of the same period | 4.18 | 4.27 | 4.00 | 4.27 | 4.36 | 3.45 | 4.09 | YES |
| 13 | Application at the property level | This evaluates the efficiency of the application of irrigable area water, that is, the volume of water required by crops over the volume of property water delivered | 4.09 | 4.36 | 3.64 | 3.91 | 3.73 | 3.82 | 3.93 | YES |
| 14 | Total irrigation supply | This is the relationship between water inputs by precipitation and irrigation vs. evapotranspiration regarding crops; it allows the determination of whether the total amount of water that crops received during a cycle was excessive, sufficient, or insufficient [9] | 4.27 | 4.09 | 3.73 | 3.91 | 3.45 | 3.73 | 3.86 | YES |
| 15 | Relative irrigation supply | This is the relationship between the water inputs from irrigation vs. the water not supplied according to the water needs (by precipitation) of crops; it reports the quality of irrigation applied by relating the amount of water demanded to the net water needs, since it shows whether the farmer has considered the evapotranspiration of a crop and the leaching requirements when using a certain volume of water [9] | 3.45 | 3.82 | 2.82 | 3.45 | 2.91 | 3.18 | 3.27 | NO |
| 16 | Crop yield per unit irrigated area | This evaluates the impact of proper surface water resource management on the agricultural productivity of irrigated crops; it is the quantity of product (t) over the watered area (ha) | 4.27 | 4.55 | 3.64 | 4.18 | 3.91 | 4.00 | 4.09 | YES |
| 17 | Gross margin per unit of irrigated area | This evaluates the profitability of farmers concerning the amount of water that they receive from the DAT—gross profitability for the total volume of irrigation water [34] | 3.55 | 3.36 | 3.27 | 3.36 | 3.36 | 3.45 | 3.39 | NO |
Publisher’s Note: MDPI stays neutral with regard to jurisdictional claims in published maps and institutional affiliations. |
© 2022 by the authors. Licensee MDPI, Basel, Switzerland. This article is an open access article distributed under the terms and conditions of the Creative Commons Attribution (CC BY) license (https://creativecommons.org/licenses/by/4.0/).
Share and Cite
Martínez-Tunarroza, J.L.; Valenzuela-Mahecha, M.A.; Rodríguez-Vásquez, A.F.; García-Navarrete, O.L. Methodological Design to Determine Water Resource Management Indicators in Irrigation Districts. Agronomy 2022, 12, 1407. https://doi.org/10.3390/agronomy12061407
Martínez-Tunarroza JL, Valenzuela-Mahecha MA, Rodríguez-Vásquez AF, García-Navarrete OL. Methodological Design to Determine Water Resource Management Indicators in Irrigation Districts. Agronomy. 2022; 12(6):1407. https://doi.org/10.3390/agronomy12061407
Chicago/Turabian StyleMartínez-Tunarroza, José Luis, Miguel Angel Valenzuela-Mahecha, Andrés F. Rodríguez-Vásquez, and Oscar Leonardo García-Navarrete. 2022. "Methodological Design to Determine Water Resource Management Indicators in Irrigation Districts" Agronomy 12, no. 6: 1407. https://doi.org/10.3390/agronomy12061407
APA StyleMartínez-Tunarroza, J. L., Valenzuela-Mahecha, M. A., Rodríguez-Vásquez, A. F., & García-Navarrete, O. L. (2022). Methodological Design to Determine Water Resource Management Indicators in Irrigation Districts. Agronomy, 12(6), 1407. https://doi.org/10.3390/agronomy12061407