Abstract
The determination of organic nitrogen (N) mineralization is crucial for estimating N availability, quantifying exogenous inputs, and estimating associated environmental impacts. The objective of this study was to explore the effect of long-term various fertilization on soil organic N mineralization potential (NMP), which influences plant N accessibility. Treatments from a 26-year long-term field experiment with no fertilization (CK), chemical fertilizer N at 165 kg N ha−1 and P at 82.5 kg P2O5 ha−1 (NP), NP with K fertilizer at 165, 82.5, 82.5 kg ha−1 N, P2O5 and K2O (NPK), NPK at 165, 82.5, 82.5 kg ha−1 N, P2O5 and K2O with manure at 7857.14 kg ha−1 (NPKM), and NPKM at 165, 82.5, 82.5 kg ha−1 N, P2O5 and K2O with manure at 1.5× application rate (11,785.71 kg ha−1) (1.5NPKM) were examined for potentially mineralizable N by aerobic incubation at 35 °C for 30 weeks. Three pools (Pools I, II, and III) of mineralizable N were recognized. Pool I, the mineralization flush on rewetting in the first 2 weeks; Pool II, gross N mineralization between weeks 2 and 30; and Pool III, the potentially mineralizable N, predicted from the fitted curve, that did not mineralize during the incubation period. Soil microbial biomass carbon (SMBC) and N (SMBN) as well as fixed ammonium (NH4+) contents and relationship with N mineralization rate (k) were also studied. Long-term manure application yielded a significantly higher k (0.32 week−1) than other treatments (0.12–0.22 week−1) but not a significantly higher NMP. Nitrogen mineralization during the wheat and maize-growing seasons was predicted to be 8.7–26.3 (mg N kg−1 soil) and 25.9–42.1 (mg N kg−1 soil), respectively. Both labile mineralizable N pools (Pools I and II) followed the same patterns in the treatments: 1.5NPKM > NPKM > NPK > NP > CK, while the reverse was true for stable N (Pool III). The significant positive correlation between k with SMBC and SMBN (R2 = 0.93, p = 0.008 and R2 = 0.94, p = 0.006) suggested that the higher mineralization rate might be contributed by the higher soil microbial biomass in NPKM. The trends of fixed NH4+ and mineralized N were coupled. Long-term manure application significantly improved the N mineralization rate in soil. Manure application is an effective strategy to enhance soil microbial biomass and soil N availability and has the potential to reduce the dependence upon chemical N fertilization.
1. Introduction
Globally, approximately 50% of the nitrogen (N) applied in agricultural fields is lost to the environment, which severely affects N use efficiency and deteriorates the environment [1,2]. There is uncertainty in choosing the optimal fertilizer N rate due to the inherent variability in the soil N supply [3]. An accurate estimate of the soil’s ability to supply N is essential for determining the optimum rate and time of fertilizer application required to develop sustainable land management strategies, optimize crop yield and quality, and minimize the adverse impacts of excessive N on the environment. Although most soils contain a large quantity of organic N, an appreciable portion of organic N is chemically or physically stabilized and resistant to microbial degradation, whereas a small portion is more labile and plays a prominent role as a source of substrate for N mineralization [4]. Only when organic N is mineralized to inorganic N may it be easily taken up by plants. From the perspective of plant nutrition, soil organic N needs to be continuously activated to ensure the growth and development of plants [5]. However, there is potential of leaching loss and N use efficiency reduction if soil mineral N is far beyond the absorption capacity of plants [6,7]. Therefore, understanding the characteristics of soil N mineralization (Nmin) is of great significance for crop production and ecosystem health sustainability.
Soil N mineralization is mediated by soil microorganisms. Soil microbial biomass N is a vigorous source of controlled N release during immobilization and re-mineralization. It was reported that soil N mineralization rate (NMR) was controlled by soil carbon (C) level, which acts as an energy source for soil microorganisms [8]. The addition of organic materials with low C and N ratio (C:N) is associated with N mineralization, and material addition with a high C:N ratio resulted in immobilization in a fine-loamy soil [9]. Hence, an accurate assessment of N mineralization is essential for determining the nitrogen mineralization potential (NMP) and N application rate, measures of which are necessary to improve N use efficiency and minimize the risks of N losses and their impacts on the environment.
The combined use of mineral and manure incorporation has been considered a proven strategy to increase the NMP for crop uptake [10]. However, whether fertilization management changes the NMP (N0) or the NMR constant (k) and its link with soil microbial biomass remains unclear. In addition, identifying the relationship between N mineralization and NH4+ fixation and nitrification is crucial to assess the long-term sustainability of cropping systems. To date, NMP and NMR under various long-term fertilization have rarely been explored, and the specific interaction between N mineralization and NH4+ fixation in the wheat–maize cropping systems remains to be examined. The fixation and release of ammonium by minerals is an important process of N transformation in soil, and it has the significance of enhancing soil ability to stabilize and provide the fertility of N [11]. The fixation of NH4+ is defined as “the adsorption or absorption of ammonium ions by the mineral or organic fraction of the soil in a manner that they are relatively unexchangeable by the usual methods of cation exchange” [12]. Ref. [13] reported that reserved Fixed NH4−-N is involved in the general cycle of N and also plays an important role in plant nutrition. Ref. [14] reported that ammonium fixation and release can play a crucial role for the efficiency of fertilizer N. Ref. [15] examined how the indigenous soil N supply impacts crop N uptake. Nitrogen contributions from soil including the defixation of NH4+ in a given year/season can greatly alter the recovery efficiency of applied N because there occurs a large fertilizer N substitution of soil N.
We hypothesized that manure application would increase NMP and NMR, and it might relate with the improved soil microbial biomass by increased C resource. To test this, we collected treatments from a 26-year fertilization experiment and carried out an incubation study to investigate the NMP and NMR under treatments with or without manure application. Furthermore, the mineralizable N in the wheat and maize-growing season was estimated, and the relationship between N mineralization with SMBN and fixed NH4+ was evaluated.
2. Materials and Methods
The long-term experiment was established in 1990 located at the experimental station in Yuanyang (113°40′42″ E, 34°47′25″ N), Henan, China. At the station, the mean annual temperature (MAT) is 14.5 °C, the minimum annual temperature is −4.3 °C, the maximum temperature is 31.7–31.8 °C, and the mean annual precipitation (MAP) is 48.1 mm (Figure 1). The soil type is light-loam textured Fluvo-aquic soil (Aquic Ustochrept, U.S. classification). At the beginning of the field study in 1990, treatment samples across the field were collected in each plot and analyzed. This field had an average of soil organic C (SOC) content of 5.86 g kg−1, a total N (TN) content of 0.65 g kg−1, a total phosphorus (P) content of 0.64 g kg−1, a total potassium (K) content of 16.9 g kg−1, an alkali-hydrolysable N content of 76.6 mg kg−1, an Olsen-P content of 6.5 mg kg−1, an ammonium-acetate extracted K content of 74 mg kg−1, and a pH of 8.3 at the start of the experiment. The crop rotation cycle was winter wheat followed by summer maize each year. Maize is sown in June and harvested in mid-September, and winter wheat is planted in early October and harvested in early June the following year.
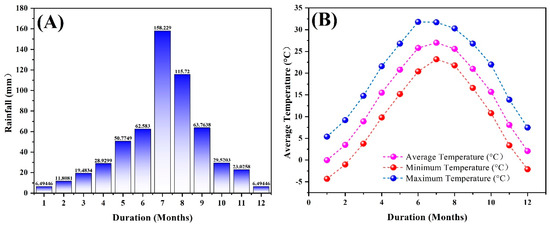
Figure 1.
Annual rainfall (mm) (A) and annual temperature (°C) during long-term experimental period (B).
Five treatments representing different fertilizer inputs were established: (1) no fertilizer (CK); (2) inorganic N and P fertilizers at the rate 165 kg N ha−1 and P at 82.5 kg P2O5 ha−1 (NP); (3) inorganic N, P, and K fertilizers at the rate 165 kg ha−1N, P at 82.5 kg ha−1 P2O5 and 82.5 kg ha−1 K2O (NPK); (4) manure (horse) at 7857.14 kg ha−1 + inorganic N, P and K fertilizers at 165, 82.5 and 82.5 kg ha−1 (NPKM) at a 70:30 organic/inorganic N ratio; and (5) NPK at the rate 165, 82.5, 82.5 kg ha−1 + Manure at 1.5× the application rate (11,785.71 kg ha−1) (1.5NPKM), respectively. Treatments were collected (n = 4) after maize harvesting in October 2016. To collect representative samples, five random soil cores (0–20 cm depth) were collected from each subplot of the treatment (replicated 3×) and mixed as one composite.
The samples used a 3 inch (76 mm) diameter stainless steel standard soil auger. The soil samples were placed in an ice box and transported to the laboratory on the same day. The soil samples from within a treatment were thoroughly mixed, moistly sifted with a <2.0 mm sieve (10 mesh), and divided into three portions. One portion was air-dried for analyses of basic soil properties (Table 1). The second portion was immediately stored in a refrigerator at 4 °C for the determination of SMBC and SMBN and subsequent use. The third portion, comprising a fresh sample, was immediately analyzed for NH4+-N and NO3−-N. Additionally, a portion of the refrigerated treatments was used for the incubation study; all the treatment samples were prepared in quadruplicate. The properties of treatments before the incubation study are given in Table 1.

Table 1.
Chemical and biological properties of experimental treatments used for incubation study (2016).
After 26 years of fertilization, the SOC, TN, Olsen-P, soil microbial biomass carbon (SMBC) and nitrogen (SMBN) contents were the highest for NPKM and 1.5NPKM treatment, higher for NP and NPK, and the lowest for CK treatment (Table 1). The pH values and C:N varied at 8.1–8.4 and 9.6–10.6, respectively, among the treatments. Integrated soil fertility level (SFL) was calculated to reflect the treatment nutrient fertility status using SOC, pH, TN, Olsen-P, and available K contents, which are considered the most crucial components of soil fertility [16]. According to [17], for the S-type membership function, the weight value for each component was calculated with the correlation coefficient method. The SFL was 0.26, 0.53, 0.61, 0.73, and 0.88 for CK, NP, NPK, NPKM, and 1.5NPKM, respectively. The chemical and biological properties of the treatments before the incubation study are given in Table 1.
2.1. Analysis of Soil Properties
pH was measured in treatment with a 1:2.5 soil–water ratio, and total N was determined by digesting the soil with H2SO4 in the presence of a digestion mixture (K2SO4: CuSO4: Se) [18]. The SOC was analyzed by vitriol acid potassium dichromate oxidation [19]. Available phosphorus was determined by the Olsen P method [20], and available potassium was determined as described elsewhere [21]. The method of [22] was used to determine the fixed NH4+ following the KOBr-HF procedures. Briefly, organic matter and exchangeable NH4+ in the soil residues were removed with KOBr, and fixed NH4+ was then released by digestion of the sample in 5M HF:1 M HCl for 24 h and quantified by titration and distillation, as reported by [23]. The fumigation–extraction method was used for determining SMBN and SMBC [24].
2.2. Incubation for Nitrogen Mineralization
Mineralizable N pools were quantified using a 30-week long-term aerobic incubation procedure, as described by [25], to obtain the potentially mineralizable soil N (N0). Briefly, 15 g of each treatment sample (quadruplicate) and 15 g of sand quartz (20-mesh) were moistened and mixed, transferred into a leaching tube, and wetted to 55% of the soil’s water-holding capacity. Mineral N initially present was removed by leaching with 0.01 mol L−1 CaCl2, which was followed by the addition of a zero-N nutrient solution, suction (≈80 kPa) and incubation at 35 °C. After 2 weeks, mineral N was recovered by leaching with 0.01 mol L−1 CaCl2, followed by a zero N nutrient solution, suction, and incubation. The treatments were leached periodically (cumulative: 2, 4, 8, 12, 16, 22, and 30 weeks). The leachates were analyzed for NH4+-N and NO3−-N concentrations using a continuous flow analyzer (Foss FIASTAR 5000 Analyzer). Afterwards, the treatments samples were analyzed for the contents of total N, SOC, and fixed NH4+. All treatments were tested with 4 replications.
2.3. Calculation of NMP and NMR Constant
The cumulative N mineralization defined as “the average of the N mineralization rates in all different periods” was calculated over the sum of 30 weeks of incubation. Three different pools of mineralizable N were calculated as described in [26]. The NMP and rate of mineralized N were calculated using the first-order, nonlinear kinetic model using the Marquardt iteration method [25] as follows:
where Nmin is the cumulative N mineralized (NH4+-N + NO3−-N) at time t (Pool II), N0 is the NMP (mg N kg−1), and k is the NMR (week−1) [27]. Three different pools of mineralizable N were calculated as described by [28]. Pool I is the N mineralized in the first 2-week period and was not used for the curve-fitting procedure because it represents the initial flush of mineralization of labile N on rewetting. Pool II is the cumulative amount of N that mineralized between weeks 2 and 30 and represents the release of an intermediately labile pool of mineralizable N. Pool III is the amount of N that was predicted to be potentially mineralizable based on a curve fitting but did not mineralize during the incubation; it represents a more stable pool of mineralizable organic N. The N0 excludes Pool I and is the sum of Pools II and III.
The changes in the treatment net NMR and cumulative NMR were calculated from the data on mineralized N during the incubation by applying the following equations [29]:
where (Mineral-N)t1 is the mineralized N (NH4+-N + NO3−-N) from the leaching tube at week t1, (Mineral-N)t2 is the mineralized N (NH4+-N + NO3−-N) from the leaching tube at week t2, and (t2 − t1) is the number of days between the two incubation periods.
where (Mineral-N)t is the mineralized N from the leaching tube at week t and (Mineral-N)t0 is the mineralized N from the leaching tube in the initial week.
2.4. Mineralized N Potentially Available for Crops (Wheat and Maize) during the Growing Period
To quantify the amount of potentially mineralized N supplied to the crop, we used the following prediction model based on the mineralized N, local temperature, and growing time (days) during the whole growing period for each of the wheat and maize crops [30].
where Y is the cumulative mineralized N (mg kg−1); T is the daily local air temperature obtained from the National Meteorological Information Center, China Meteorological Data Service Center (CMDC), with the accumulative temperature used; D is time (day); and K and n are constants (rates). The wheat season starts in October, and harvest is in June (total period: 215–225 days); the maize season starts in June, and harvest is in October (total period: 110–118 days). The temperature during the wheat season ranged from −5.7 to 26.6 °C, and the temperature during the maize season ranged from 13.8 to 32.7 °C.
2.5. Data Processing and Statistical Analysis
Statistical analyses were performed using SPSS v.20.0 software (IBM Corp., Armonk, NY, USA). The significance of differences among the SFLs was determined by one-way ANOVA and Duncan’s tests at p < 0.05 and p < 0.01 (means ± SD, n = 4). The first-order kinetic equation for N mineralization and nitrified N was fitted with a nonlinear regression curve procedure in SigmaPlot 12.5 (Systat Software Inc., Chicago, IL, USA). The relationship between N mineralization and each of the C:N and soil microbial biomass was assessed using linear regression analysis in Sigma Plot 12.5 (Systat Software Inc., Chicago, IL, USA) and R-software (ggplot2-package).
3. Results
3.1. NMP and Mineralization Rate Constant (k)
The mineralized N changed significantly with incubation time, and a higher mineralization rate was observed in 1.5NPKM, NPKM treatments than in NPK, NP, and CK treatments (Figure 2; Table 2). The NMP ranged from 46.08 to 50.85 mg kg−1, and the NMR ranged from 0.118 to 0.327 week−1, being positively correlated with CK to 1.5NPKM. Overall, an increase in NMP of 6 to 10% relative to that in CK was observed in all of the fertilizer treatments.
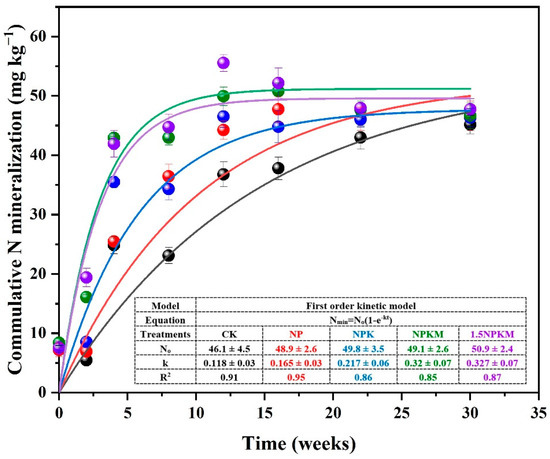
Figure 2.
Cumulative mineralized N, N mineralization potential (N0), and constant rate (k) differences among treatments with long-term fertilization treatments in relation to time. The N0 and k were obtained according to equation (Nmin = N0 (1 − e−kt). CK-1.5NPKM represents the treatments from: no fertilization (CK), chemical nitrogen and phosphorus fertilizer (NP), NP with K fertilizer (NPK), NPK with manure application (NPKM), 1.5 rates of NPKM (1.5NPKM).

Table 2.
Nitrogen mineralization potential N (N0), mineralization rate constant (k), and mineralizable N pools after 26 years of fertilization.
Long-term fertilization affected the distribution of three mineralizable N pools (Table 2). Both the highest Pool I and Pool II were observed in 1.5NPKM as 15.5 mg N kg−1 and 44.21 mg N kg−1, respectively. The lowest Pool I and Pool II were observed in CK treatment as 7.65 mg N kg−1 and 30.91 mg N kg−1, respectively. In contrast, Pool III was significantly but negatively related with 1.5NPKM to CK. The highest amount of mineralizable N in Pool III was 15.21 mg kg−1 for CK and the lowest was 6.66 mg kg−1 for 1.5NPKM.
3.2. Net NMR and Cumulative NMR
Regardless of the treatments, the net NMR was the highest at 2–4 weeks, which was followed by that at 0–2 weeks and that at 8–12 weeks (Figure 3A). Among the treatments, those with NPKM and 1.5NPKM showed higher net NMR early in incubation, during weeks 2–4. After 12 weeks, the NMR was higher in CK and NP treatments than in other treatments (NPK, NPKM, and 1.5NPKM). Similar to the net NMR, cumulative NMR was the highest during the first four weeks (Figure 3B). Compared with the CK treatment, the fertilized treatments exhibited significantly higher cumulative NMR. There was no significant difference in the cumulative mineralization rate among all treatments after 16 weeks.
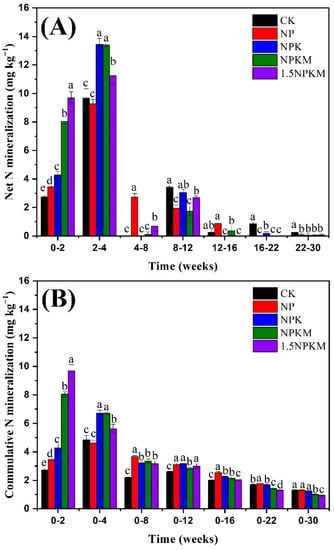
Figure 3.
Changes in the net N mineralization rate (A) and cumulative N mineralization rate (B) during the incubation. Different letters indicate significant differences (p < 0.05) between treatments during the same period according to Duncan’s test.
3.3. Quantification of Mineralizable N to Wheat and Maize Crops
The actual amount of mineralized N or N supplied to the wheat or maize was predicted during the whole growing season according to the mineralization N potential, weather conditions, and growing period, as shown in Equation (4). The mineralized N was significantly higher for manure applied treatment than for only chemical fertilizer applied treatment, which was further higher than for no-fertilization treatment during both the wheat and maize growing seasons (Figure 4). The treatments supplied 8.67–26.41 mg N kg−1 to wheat and 25.9–42.11 mg N kg−1 to maize during the corresponding whole season.
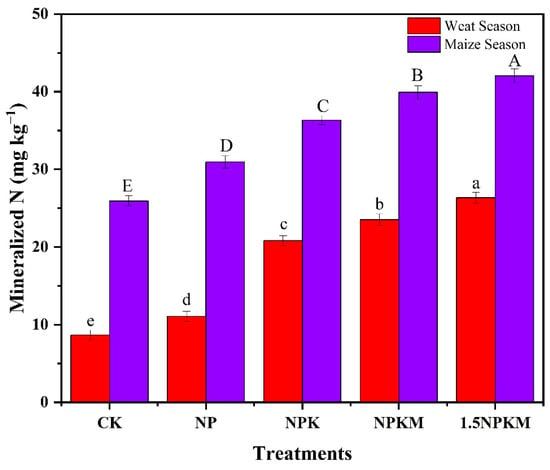
Figure 4.
Availability of mineralized N to wheat and maize during the whole growing period. Capital letters and lowercase letters indicate significant (p < 0.05) differences among various treatments for the maize and wheat growing season, respectively.
3.4. The Relationship between NMR and Soil Microbial Biomass
A significant correlation was identified between the mineralized N rate and soil microbial biomass (SMBC: R2 = 0.93, p = 0.008; SMBN: R2 = 0.94, p = 0.006) (Figure 5A,B). Likewise, the SOC and TN ratio (C:N) was significantly higher in the CK treatment than the 15.NPKM treatment during the 30 weeks. The C:N increased with time during the first 2–12 weeks and then decreased during weeks 12–30 (Figure 5C).
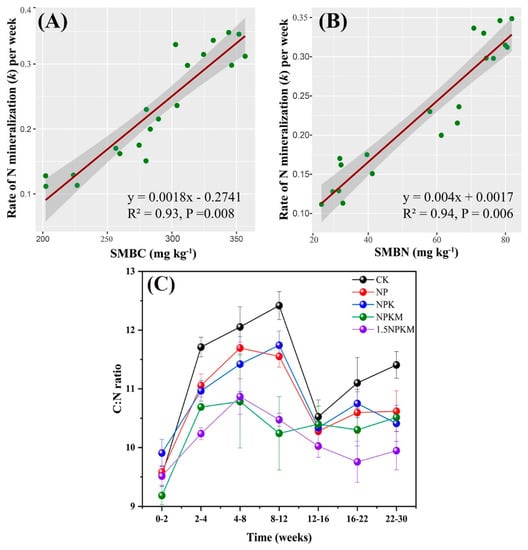
Figure 5.
Relationship between N mineralization rate (constant) and soil microbial biomass carbon (A), Nitrogen (B), and changes in the C/N ratio among the treatments in relation to time (C).
3.5. Temporal Changes in Mineralized N and Fixed NH4+
The fixation of NH4+-N in treatments decreased in the first 10 weeks and then increased after N mineralization increased in treatments (Figure 6). After their peaks, N mineralization and fixed NH4+ both showed parallel trends. The maximum NMP values were recorded at 16, 12, 12, and 12 weeks in NP, NPK, NPKM, and 1.5NPKM, respectively, but in CK, N0 was observed at 30 weeks of incubation. These results suggested that a correlation/balance exists between fixed NH4+ and mineralization and that the lowest-fertility treatment (CK) required more time than the other treatments to reach the maximum mineralization potential.
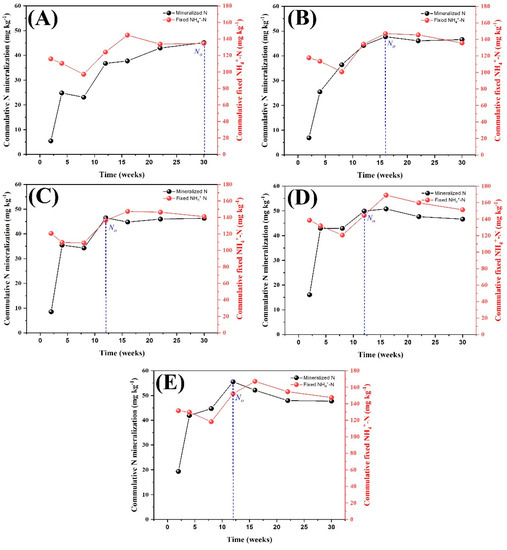
Figure 6.
Temporal changes in mineralized N and fixed NH4+ among the treatments in relation to time. N0 showing the maximum levels of mineralized N in relation to time. CK (A), NP (B), NPK (C), NPKM (D) and 1.5NPKM (E).
3.6. Relationships between N Mineralization Rate and N pools, Microbial Biomass and Fixed NH4+
Significant positive correlations were identified between the N mineralization rate and N pools (I and II), SMBC, SMBN and fixed NH4+ (Pool I: r = 0.69; Pool II: r = 0.86; SMBC: r = 0.81; SMBN: r = 0.60; Fixed NH4+: r = 0.78) (Figure 7). In contrast, significant negative correlations were identified between Pool III and potential mineralized N, SMBC, SMBN and fixed NH4+ (N0: r = −0.70; Pool I: r = 0.96; Pool II: r = 0.97; SMBC: r = 0.94; SMBN: r = 0.97; Fixed NH4+: r = 0.94).
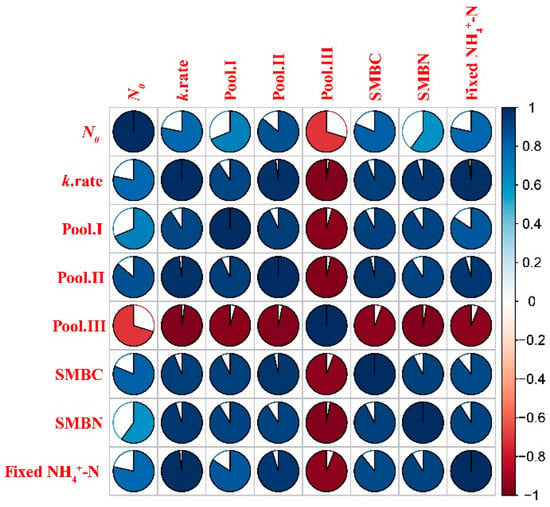
Figure 7.
Pearson’s correlation matrix between N mineralization rate, N pools, microbial biomass and fixed NH4+. A graphical representation of the Pearson correlation matrix for the initial features. Blue and red colors indicate positive and negative correlations, respectively. The lighter the tone used, the less significant the corresponding correlation. The filled fraction of the circle in each of the pie charts corresponds to the absolute value of the associated Pearson correlations coefficient. (For interpretation of the references to color in this figure legend, the reader is referred to the web version of this article.)
4. Discussion
4.1. Nitrogen Mineralization Potential (NMP) and Mineralization Rate Constant (k) as Affected by Long-Term Fertilization
The mineralized N in the manure applied treatments (NPKM and 1.5NPKM) was always higher than that in other treatments (Figure 2), suggesting that the treatment with manure application supplied more available N to the crops than the control treatment, highlighting the importance of organic amendments to enhance soil fertility [31,32]. Nitrogen mineralization is an essential process for crop nutrition [27]. Refs. [33,34] reported that the application of combined (organic and inorganic) fertilizers increased the N supply capacity of the soil, consequently enhancing N mineralization. Ref. [35] reported that both N0 and NMR were highest in a treatment to which manure had been applied for more than 10 years. However, our results revealed that it was the constant k but not the potential that led to the differences among the treatments (Figure 2). The k value in the 1.5NPKM treatment was 3 times that of the CK treatment, suggesting that high-fertility treatments supply available N to the crops in a timely manner, whereas the sterile treatment mineralized slowly despite having similar potential. The curvilinear pattern of mineralized N indicates the different pools of organic C that are released at different rates. The significant difference in mineralized N during the first 16 weeks, and the similar mineralized N values during later weeks (16–30) suggested that the labile and intermediate portions of the organic N fraction led to a varied k and then varied N mineralization among treatments (Figure 2). These results are in agreement with previous findings in which the temporal release of NH4+-N decreased because of the lower mineralization potential at a later stage of incubation, which is an indication of the recalcitrant part of organic amendments, but the concentration of NO3−-N increased due to the rapid nitrification process [10].
It has been shown that NMP, as measured by N0, not only predicts the nutrient supply capacity but also serves as a viable measure to estimate the microbial activity in the soil [36]. While the N0 values obtained in our study were similar to those in previous studies, we found that the values of the k constant (NMR) varied among treatments and were typically higher in manure applied treatment than in other treatments. The mean value obtained by [25] was 0.054 (range, 0.035–0.095), with higher values of the k constant rate resulting from the faster decomposition of organic residues (maize crop) from the previous crop and the subsequent more rapid release of inorganic N through the activity of soil microflora. For the Aquic soil used in our study, the NMP values range was 46–51 mg kg−1, which are similar to those reported for Indian soils (44.5–59.4 mg kg−1) [37]. However, the NMP for soils in the USA (18 to 358 mg kg−1) [25], Canadian maize soil (155 to 246 mg kg−1) [35] and Italian soil (21 to 405 ppm) [36] are very different. The large variation among these soils could be related to the different soil types and variation in the content of soil fertility, coupled with variations in other factors, such as soil properties and biological and environmental factors. Among these factors, soil organic C content is a key limiting factor for N mineralization. A higher soil C stock boosts microbial activity and stimulates microbes, producing a faster turnover of N, which always contributes to a higher NMP [38].
4.2. Dynamics of Soil Organic C and Total N as Affected by Long-Term Fertilization
We investigated the dynamics of soil organic C and total N concentrations during the 30 weeks of incubation to determine whether N mineralization was accompanied by C mineralization. As expected, C:N increased during the first 2 weeks and decreased at 16–30 weeks (Figure 5B). Moreover, this ratio was consistently higher in CK than in 1.5NPKM; however, the C:N in 1.5NPKM was more consistent over time than that in CK. It suggested that N mineralization is not always synchronized with C mineralization and that the relative mineralization rate of N to C is higher in high-fertility treatments. The latter finding is a typical one, as the degradation of soil organic matter and the mineralization of C and N are mediated primarily by soil microorganisms [39].
Our findings have practical implications for the farmer to estimate the amount and time of fertilizer addition to achieve proper crop growth, thereby avoiding the excessive application of fertilizers, which is the leading cause of low N use efficiency in terrestrial ecosystems. Therefore, the N mineralization in our study describes the fates of N and the slower release of N due to the recalcitrance of organic C, which would be available to the plants for efficient utilization at later stages.
4.3. Temporal Changes in Mineralized N and Fixed NH4+ as Affected by Long-Term Fertilization
Fixed ammonium accounted for 16–19% of the total N in the treatment at each sampling time during the incubation, which indicated that it is an important N pool in the soil and was used as a source for the mobilization of NH4+ as well as a pool for the immobilization of NH4+. During the first 8 weeks, the fixed NH4+ decreased linearly with increasing mineralization (Figure 6). It suggested that we might overestimate N mineralization at early stages because NH4+ can originate not only from mineralization but also from the release of fixed NH4+ from soil clay. After 8 weeks, the fixed NH4+ increased with increasing mineralized N. We hypothesize that the NH4+ fixation process occurred after the NH4+ content in the soil reached a specific content. The authors of [40] found that soil containing 2:1 of clay minerals had a greater capacity to fix NH4+. It was reported that an inconsistent trend of fixed NH4+ might be possible due to the nitrifying bacterial population and that the heterotrophic biomass can be a major cause of increased fixed NH4+ from the interlayer spaces of clay minerals [41]. Moreover, the highest value of fixed NH4+ was observed at the same time point as the most mineralized N (N0) at all treatments. After their peak points, the N mineralization and fixed NH4+ both showed a parallel trend. These results suggested that the fixed NH4+ is a sink and source of exchangeable NH4+ that plants assimilate, thereby contributing to optimum plant growth and fertility status. The results revealed an asymptotic relationship between N mineralization and fixed NH4+. Therefore, it is important to consider a part of the fixed NH4+ in future research on N mineralization and availability.
5. Conclusions
Manure application with inorganic fertilizer enhanced SOC, total N, total P, and K concentrations in soil. Long-term fertilization did not change the NMP in Fluvo-aquic soil. However, the N mineralized rate (k) was higher in the long-term manure applied treatment than in other treatments, suggesting that manure application accelerated the soil mineralization. Strong positive correlations were observed among the k, N pool (Pools I, II), SMBC, SMBN, and fixed NH4+. These correlations suggest that enhancing the supply of organic material, such as manure, is an effective strategy to increase the soil microbial activity and, thus, the availability of soil N. We also found that fixed NH4+ was involved in the N mineralization process, which suggested that mobilization and immobilization should be considered in future soil N cycling research. We conclude that the combination of manure with inorganic fertilizers is an optimal strategy to increase N availability and boost nutrient availability for crops in agricultural ecosystems. The optimum proportions and rates require further examination under long-term field experiments.
Author Contributions
Conceptualization and writing—original draft preparation, A.A.M.; methodology, A.A.M. and W.A.; formal analysis, A.A.M. and W.A.; investigation, A.A.M., S.Z. and H.Y.; resources, Y.D. and M.X.; writing—review and editing, A.A.M., Y.D., S.A., W.A., K.J. and S.M.B.; project administration, Y.D. and M.X.; supervision, Y.D. and M.X.; funding acquisition, Y.D. and M.X. All authors have read and agreed to the published version of the manuscript.
Funding
Financial support was provided by the National Science Foundation of China (42077098) and Fundamental Research Funds for Central Non-profit Scientific Institution (Y2022XK26).
Data Availability Statement
Not applicable.
Acknowledgments
We are thankful to all managers of long-term experiments at the National Observation Station of Yuanyang Agri-ecology System, Henan Province, China.
Conflicts of Interest
The authors declare that they have no conflict of interest. This article does not contain any studies with human participants or animals performed by any of the authors.
References
- Chen, Y.; Xu, Z.; Feng, K.; Yang, G.; Fu, W.; Chen, B. Nitrogen and water addition regulate soil fungal diversity and co-occurrence networks. J. Soils Sediments 2020, 20, 3192–3203. [Google Scholar] [CrossRef]
- Galloway, J.N.; Townsend, A.R.; Erisman, J.W.; Bekunda, M.; Cai, Z.; Freney, J.R.; Martinelli, L.A.; Seitzinger, S.P.; Sutton, M.A. Transformation of the Nitrogen Cycle: Recent Trends, Questions, and Potential Solutions. Science 2008, 320, 889–892. [Google Scholar] [CrossRef] [PubMed] [Green Version]
- Lobell, D. The cost of uncertainty for nitrogen fertilizer management: A sensitivity analysis. Field Crops Res. 2007, 100, 210–217. [Google Scholar] [CrossRef]
- Jia, X.; Zhu, Y.; Huang, L.; Wei, X.; Fang, Y.; Wu, L.; Binley, A.; Shao, M. Mineral N stock and nitrate accumulation in the 50 to 200 m profile on the Loess Plateau. Sci. Total Environ. 2018, 633, 999–1006. [Google Scholar] [CrossRef] [PubMed] [Green Version]
- Xu, Y.; Ding, F.; Gao, X.; Wang, Y.; Li, M.; Wang, J. Mineralization of plant residues and native soil carbon as affected by soil fertility and residue type. J. Soils Sediments 2019, 19, 1407–1415. [Google Scholar] [CrossRef]
- Ali, S.; Dongchu, L.; Jing, H.; Ahmed, W.; Abbas, M.; Qaswar, M.; Anthonio, C.K.; Lu, Z.; Boren, W.; Yongmei, X.; et al. Soil microbial biomass and extracellular enzymes regulate nitrogen mineralization in a wheat-maize cropping system after three decades of fertilization in a Chinese Ferrosol. J. Soils Sediments 2021, 21, 281–294. [Google Scholar] [CrossRef]
- Ali, S.; Liu, K.; Ahmed, W.; Jing, H.; Qaswar, M.; Anthonio, C.K.; Maitlo, A.A.; Lu, Z.; Liu, L.; Zhang, H. Nitrogen Mineralization, Soil Microbial Biomass and Extracellular Enzyme Activities Regulated by Long-Term N Fertilizer Inputs: A Comparison Study from Upland and Paddy Soils in a Red Soil Region of China. Agronomy 2021, 11, 2057. [Google Scholar] [CrossRef]
- Wu, Q.; Zhang, C.; Liang, X.; Zhu, C.; Wang, T.; Zhang, J. Elevated CO2 improved soil nitrogen mineralization capacity of rice paddy. Sci. Total Environ. 2020, 710, 136438. [Google Scholar] [CrossRef]
- Watts, D.B.; Torbert, H.A.; Prior, S.A.; Huluka, G. Long-Term Tillage and Poultry Litter Impacts Soil Carbon and Nitrogen Mineralization and Fertility. Soil Sci. Soc. Am. J. 2010, 74, 1239–1247. [Google Scholar] [CrossRef] [Green Version]
- Sharma, V.; Mir, S.H.; Sharma, A. Nitrogen Mineralization as Influenced by Different Organic Manures in an Inceptisol in the Foothill Himalayas. Commun. Soil Sci. Plant Anal. 2015, 47, 194–202. [Google Scholar] [CrossRef]
- Zhang, Y.-Z.; Huang, S.-H.; Wan, D.-J.; Huang, Y.-X.; Zhou, W.-J.; Zou, Y.-B. Fixed Ammonium Content and Maximum Capacity of Ammonium Fixation in Major Types of Tillage Soils in Hunan Province, China. Agric. Sci. China 2007, 6, 466–474. [Google Scholar] [CrossRef]
- Osborne, G.; Storrier, R. Efficiency of utilization of nitrogen fertilizers on representative soils from southern New South Wales. Aust. J. Exp. Agric. 1976, 16, 875–880. [Google Scholar] [CrossRef]
- Marzadori, C.; Antisari, L.V.; Ciavatta, C.; Sequi, P. A rapid method for the determination of fixed ammonium in soil. Commun. Soil Sci. Plant Anal. 1993, 24, 745–756. [Google Scholar] [CrossRef]
- Nieder, R.; Benbi, D.K.; Scherer, H.W. Fixation and defixation of ammonium in soils: A review. Biol. Fertil. Soils 2010, 47, 1–14. [Google Scholar] [CrossRef] [Green Version]
- Scherer, H.; Mengel, K. Importance of soil type on the release of nonexchangeable and availability of fertilizer and fertilizer . Nutr. Cycl. Agroecosyst. 1986, 8, 249–258. [Google Scholar] [CrossRef]
- Krupenikov, I.A.; Boincean, B.P.; Dent, D. Humus–Guardian of Fertility and Global Carbon Sink. In The Black Earth; Springer: Berlin, Germany, 2011. [Google Scholar]
- Xiao, L.U.; Yun, L.U.; Wang, R. Preliminary studies on the integrated evaluation of soil nutrient fertility. J. Zhejiang Agric. Univ. 1999, 25, 378–382. [Google Scholar]
- Black, C.A.; Evans, D.D.; White, J.L.; Ensminger, L.E.; Clark, F.E. Methods of Soil Analysis: Part 2 Methods Soil Anal. Part 2 Chemical and Microbiological Properties, 2nd ed.; American Society of Agronomy, Inc.; Soil Science Society of America, Inc.: Madison, WI, USA, 2016; pp. 1–1572. [Google Scholar] [CrossRef] [Green Version]
- Walkley, A. An Examination of Methods for Determining Organic Carbon and Nitrogen in Soils. (With One Text-figure.). J. Agric. Sci. 1935, 25, 598–609. [Google Scholar] [CrossRef]
- Nathan, A.J.; Scobell, A. How China Sees America; United States Department of Agriculture: Washington, DC, USA, 2012; Volume 91, ISBN 9788578110796.
- Bao, S.D. Soil and agricultural chemistry analysis. Agric. Publ. Beijing 2000, 10, 355–356. [Google Scholar]
- Silva, J.A.; Bremner, J.M. Determination and Isotope-Ratio Analysis of Different Forms of Nitrogen in Soils: 5. Fixed Ammonium. Soil Sci. Soc. Am. J. 1966, 30, 587–594. [Google Scholar] [CrossRef]
- Liang, B.; Yang, X.; He, X.; Murphy, D.; Zhou, J. Long-term combined application of manure and NPK fertilizers influenced nitrogen retention and stabilization of organic C in Loess soil. Plant Soil 2011, 353, 249–260. [Google Scholar] [CrossRef]
- Brookes, P.; Landman, A.; Pruden, G.; Jenkinson, D. Chloroform fumigation and the release of soil nitrogen: A rapid direct extraction method to measure microbial biomass nitrogen in soil. Soil Biol. Biochem. 1985, 17, 837–842. [Google Scholar] [CrossRef]
- Stanford, G.; Smith, S.J. Nitrogen Mineralization Potentials of Soils. Soil Sci. Soc. Am. J. 1972, 36. [Google Scholar] [CrossRef]
- Dessureault-Rompré, J.; Zebarth, B.J.; Burton, D.L.; Sharifi, M.; Cooper, J.; Grant, C.A.; Drury, C.F. Relationships among Mineralizable Soil Nitrogen, Soil Properties, and Climatic Indices. Soil Sci. Soc. Am. J. 2010, 74, 1218–1227. [Google Scholar] [CrossRef]
- Owen, J.S.; Wang, M.K.; Sun, H.L.; King, H.B.; Wang, C.H.; Chuang, C.F. Comparison of soil nitrogen mineralization and nitrification in a mixed grassland and forested ecosystem in central Taiwan. Plant Soil 2003, 251, 167–174. [Google Scholar] [CrossRef]
- Sharifi, M.; Zebarth, B.J.; Burton, D.L.; Grant, C.A.; Cooper, J.M. Evaluation of Some Indices of Potentially Mineralizable Nitrogen in Soil. Soil Sci. Soc. Am. J. 2007, 71, 1233–1239. [Google Scholar] [CrossRef]
- Willems, J.J.G.M.; Marinissen, J.C.Y.; Blair, J. Effects of earthworms on nitrogen mineralization. Biol. Fertil. Soils 1996, 23, 57–63. [Google Scholar] [CrossRef]
- Cui, Z.; Wang, S.; Jin, X.; Liu, J. The characteristics of mineralization of nitrogen and prediction of different sediments and soil in Beijing. Chin. Agric. Sci. Bull. 2006, 22. [Google Scholar]
- Ahmed, W.; Liu, K.; Qaswar, M.; Huang, J.; Huang, Q.; Xu, Y.; Ali, S.; Mehmood, S.; Asghar, R.M.A.; Mahmood, M.; et al. Long-Term Mineral Fertilization Improved the Grain Yield and Phosphorus Use Efficiency by Changing Soil P Fractions in Ferralic Cambisol. Agronomy 2019, 9, 784. [Google Scholar] [CrossRef] [Green Version]
- Ahmed, W.; Jing, H.; Kaillou, L.; Qaswar, M.; Khan, M.N.; Jin, C.; Geng, S.; Qinghai, H.; Yiren, L.; Guangrong, L.; et al. Changes in phosphorus fractions associated with soil chemical properties under long-term organic and inorganic fertilization in paddy soils of southern China. PLoS ONE 2019, 14, e0216881. [Google Scholar] [CrossRef]
- Zhang, J.; Qin, J.; Yao, W.; Bi, L.; Lai, T.; Yu, X. Effect of long-term application of manure and mineral fertilizers on nitrogen mineralization and microbial biomass in paddy soil during rice growth stages. Plant Soil Environ. 2009, 55, 101–109. [Google Scholar] [CrossRef] [Green Version]
- Griffin, T.S.; He, Z.; Honeycutt, C.W. Manure composition affects net transformation of nitrogen from dairy manures. Plant Soil 2005, 273, 29–38. [Google Scholar] [CrossRef]
- Thomas, B.W.; Sharifi, M.; Whalen, J.K.; Chantigny, M.H. Mineralizable Nitrogen Responds Differently to Manure Type in Contrasting Soil Textures. Soil Sci. Soc. Am. J. 2015, 79, 1396–1405. [Google Scholar] [CrossRef]
- Benedetti, A.; Sebastiani, G. Determination of potentially mineralizable nitrogen in agricultural soil. Biol. Fertil. Soils 1996, 21, 114–120. [Google Scholar] [CrossRef]
- Mohanty, S.; Nayak, A.; Kumar, A.K.; Tripathi, R.; Shahid, M.; Bhattacharyya, P.; Raja, R.; Panda, B.B. Carbon and nitrogen mineralization kinetics in soil of rice–rice system under long term application of chemical fertilizers and farmyard manure. Eur. J. Soil Biol. 2013, 58, 113–121. [Google Scholar] [CrossRef]
- Luce, M.S.; Whalen, J.K.; Ziadi, N.; Zebarth, B.J. Net nitrogen mineralization enhanced with the addition of nitrogen-rich particulate organic matter. Geoderma 2016, 262, 112–118. [Google Scholar] [CrossRef]
- Savin, M.C.; Gorres, J.; Neher, D.A.; Amador, J.A. Uncoupling of carbon and nitrogen mineralization: Role of microbivorous nematodes. Soil Biol. Biochem. 2001, 33, 1463–1472. [Google Scholar] [CrossRef]
- Wu, Y.; Shaaban, M.; Deng, C.; Peng, Q.; Hu, R. Changes in the soil N potential mineralization and nitrification in a rice paddy after 20 years application of chemical fertilizers and organic matter. Can. J. Soil Sci. 2017, 97, 290–299. [Google Scholar] [CrossRef]
- Nommik, H.; Vahtras, K. Retention and fixation of ammonium and ammonia in soils. In Nitrogen in Agricultural Soils; American Society of Agronomy, Inc.; Soil Science Society of America, Inc.: Madison, WI, USA, 2015; pp. 123–171. ISBN 9780891182160. [Google Scholar]
Publisher’s Note: MDPI stays neutral with regard to jurisdictional claims in published maps and institutional affiliations. |
© 2022 by the authors. Licensee MDPI, Basel, Switzerland. This article is an open access article distributed under the terms and conditions of the Creative Commons Attribution (CC BY) license (https://creativecommons.org/licenses/by/4.0/).