Article

Effects of Soil Water Regulation on the Cotton Yield, Fiber Quality and Soil Salt Accumulation under Mulched Drip Irrigation in Southern Xinjiang, China

1
College of Agricultural Science and Engineering, Hohai University, Nanjing 210098, China
2
Key Laboratory of Agricultural Soil and Water Engineering in Arid and Semiarid Areas of Ministry of Education, Northwest A&F University, Xianyang 712100, China
*
Author to whom correspondence should be addressed.
Agronomy 2022, 12(5), 1246; https://doi.org/10.3390/agronomy12051246
Submission received: 5 April 2022 / Revised: 17 May 2022 / Accepted: 19 May 2022 / Published: 23 May 2022
(This article belongs to the Topic Plant Responses and Tolerance to Salinity Stress)

Abstract

:
To optimize suitable water-saving and soil salt-controlling irrigation needed for the high yield and good quality of cotton in southern Xinjiang, a field experiment was carried out to study the effects of soil water lower limits on water consumption, water use efficiency (WUE), yield, cotton fiber quality and soil salt accumulation under mulched drip irrigation in Korla, Xinjiang. The field capacity (FC) was regarded as the upper limit of soil moisture, and five soil water lower limits (85% FC, 75% FC, 65% FC, 55% FC, 45% FC, referred as T1~T5, respectively) were designed during the cotton growth period. The results indicated that the irrigation frequency and irrigation quota of cotton were gradually increased with the increase in the soil water lower limit, while the water consumption modulus for T2 treatment during the critical period of water demand arrived at the maximum value. Moreover, with the decrease in the soil water lower limit, the WUE, fiber micronaire value and fiber maturity index of cotton increased, whereas the yield, nitrogen partial factor productivity (PFPN) and fiber breaking elongation of cotton decreased. However, when the soil water lower limit exceeded 75% FC, the increase had little effect on the cotton yield increase and PFPN improvement, and the yield and PFPN for T2 treatment were 7146.4 kg∙hm2 and 23.82 kg∙kg1, respectively, In addition, the decrease in the soil water lower limit was unfavorable for an increase in fiber length, but it was conducive to the enhancement of fiber strength. Furthermore, soil salt accumulated inside and outside the film for the designed soil water lower limits, and the amount of accumulated salt in 0~100 cm followed T3 > T5 > T1 > T2 > T4. Based on a comprehensive analysis with the entropy TOPSIS method, the findings of the present study suggested that the suitable soil water lower limit for cotton under mulched drip irrigation was 75% FC in southern Xinjiang, China.

1. Introduction

Due to the high yield and good quality of its produced cotton, southern Xinjiang has become the largest production base for cotton in China [1]. However, the shortage of irrigation water resources [2], secondary salinization of cultivated land [3] and low utilization rate of irrigation water and fertilizer [4] have seriously restricted the sustainable development of cotton planting. Thus, it is necessary to study the proper mulched drip irrigation mode for cotton cultivation in southern Xinjiang, China.
The irrigation schedule can be determined appropriately with crop evapotranspiration [5,6] or practical experience [7,8]; additionally, it can be designed with the soil moisture in the rootzone [9,10,11]. Soil water regulation is one of the effective methods for regulating the soil moisture in the tillage layer, which is carried out by triggering the field irrigation with designed upper and lower limits of soil water content [12,13]. In recent years, many scholars have carried out research on determining the proper soil water limits for greenhouse crops (such as cucumber [14], melon [15], cabbage [16], etc.) and field crops (such as wheat [17,18], corn [19], etc.). Pei et al. conducted a pot experiment with regulated deficit irrigation at different growth stages of cotton, and the results indicated that the soil water lower limits for rational deficit irrigation scheduling of cotton at the seedling, bud, boll and boll opening stages were 55~60% FC, 65% FC, 70% FC and 50~55% FC, respectively [20]. To determine the appropriate lower limits of drip irrigation during the growing period of cotton, field experiments were carried out by Shen et al. [21] in Shihezi and Pan et al. [22] in Hutubi county of northern Xinjiang, respectively; the experiments implied that the suitable soil water limit was 60~65% FC at squaring stage and 75% FC at flowering and boll stages for cotton cultivation. However, the research was conducted on soil moisture regulation for cotton mainly located in northern Xinjiang; due to the differences in soil texture and climatic conditions, soil moisture regulation for cotton under mulched drip irrigation in southern Xinjiang requires further study.
Generally, controlling soil moisture lower limits at levels that are too high or too low is not conducive to the improvement of crop yield or WUE under mulched drip irrigation. Yuan et al. conducted a study in greenhouse conditions for tomato and indicated that appropriately increasing the soil water lower limit showed significant effects on dry matter accumulation; however, an excessively low limit for soil moisture was unfavorable for the normal growth and development of tomato plants [23]. Li et al. also implied that the tomato yield increased with the increase in soil water lower limits, while both the WUE and tomato quality decreased; in particular, the maximum tomato yield was obtained with a soil water lower limit of 80% FC [24]. Zhang et al. carried out an experiment for spring wheat in Gansu Province, China and indicated that with an increase in soil water lower limits, both wheat production and WUE increased first and then decreased [25]. Further, Wang et al. studied the effects of solar greenhouse conditions and found that the soil water lower limit was a critical factor for high yields of muskmelon, and that muskmelon production with a soil water lower limit of 70% FC increased by 22.58% and 2.42%, respectively, compared to that with a limit of 60% FC and 80% FC [26]. Moreover, Yilmaz Ersel suggested that drip irrigation for cotton with a 75% irrigation regime had significant benefits in terms of saving irrigation water resources and achieving high WUE [27].
Fiber quality is not only affected by the genotype [28], but also by the soil moisture [29] and soil salinity [30]. Appropriate soil water limitation was found to promote the cotton yield in Xinjiang, at the expense of fiber quality to a certain degree, such that the fiber length decreased and micronaire value increased [31,32]. Generally, the fiber strength and fiber length decreased with deficit irrigation, while the micronaire significantly increased [33,34,35], which severely inhibits fiber quality. However, Shen indicated that the lint percentage of blossom before frost, fiber length, and fiber breaking resistance increased with a moderate soil water deficit (60% FC) at the budding stage of cotton, while excessive water stress resulted in a decrease in fiber length and fiber breaking resistance [21]. Hu et al. implied that the fiber density decreased seriously with increased drought, while individual fiber mass and lint percentage increased [36].
In southern Xinjiang, due to the scarce precipitation and strong evaporation, unsuitable soil moisture regulation may result in the secondary salinization of farmland and lead to interference in normal crop growth and sustainable farmland utilization. Zhou et al. found that with an irrigation quota of 270~285 mm under mulched drip irrigation, the soil salt accumulated in 0~60 cm layers and the soil salt accumulation rate reached 12.4% [37]. Liu et al. indicated that with the irrigation quota of 340 mm during the cotton growth period, the soil salt content in 0~60 cm layers increased after harvest; in particular, a large amount of soil salt accumulated in 0~20 cm outside the film, and the accumulation rate reached as high as 94.5% [38]. However, Wang et al. reported that the soil salinity in 0~40 cm decreased with a desalination rate of 30~60% during the cotton growth period when the irrigation quota was 210~450 mm [39]. Bai et al. performed an experiment on the effects of soil moisture regulation on soil water content and soil salt in Shihezi city, Xinjiang. The results indicated that the soil salt in the tillage layers of cotton fields could be leached effectively when the lower limit of soil moisture in the bud period and flowering-boll period was 60% and 70%, respectively [40].
The present study performed an experiment on the influence of soil moisture regulation with five soil water lower limit levels on the water consumption, yield, fiber quality and soil salt accumulation during the cotton growth period. The objectives of this study were to: (a) investigate the effects of soil water lower limits on the yield and fiber quality of cotton, WUE and soil salt accumulation under mulched drip irrigation in southern Xinjiang; and (b) optimize the suitable soil water lower limit for cotton planting in southern Xinjiang.

2. Materials and Methods

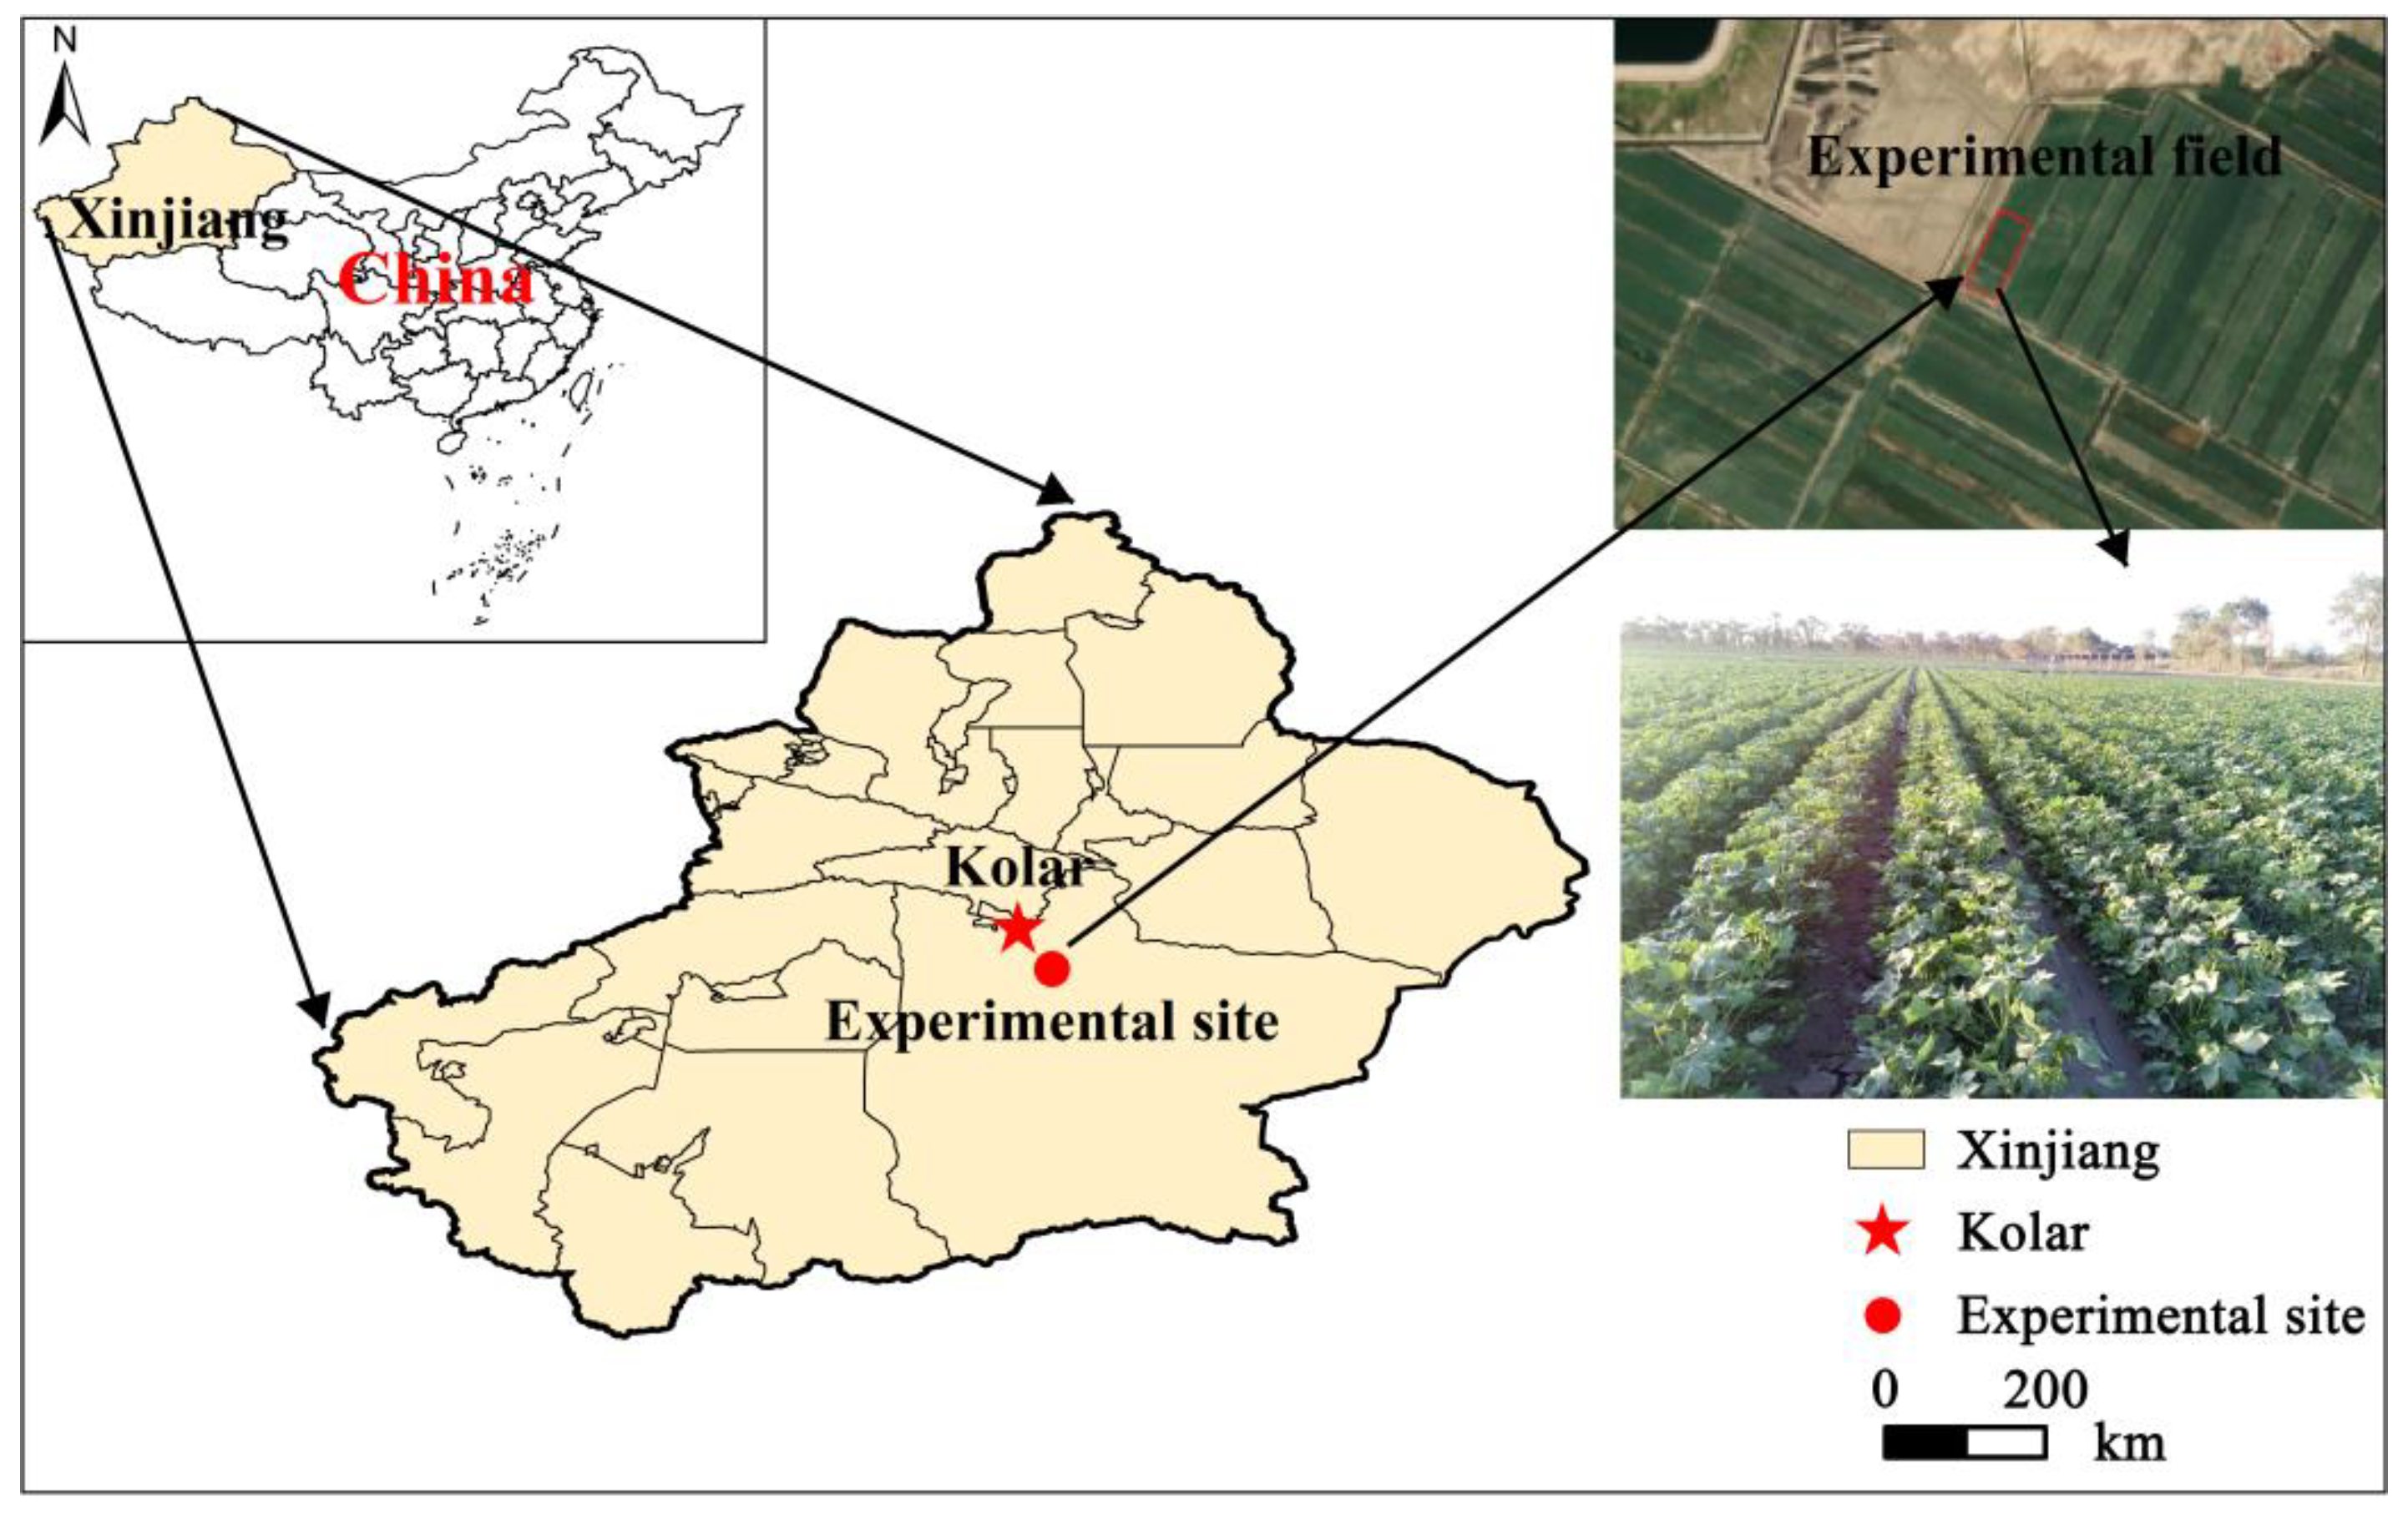
2.1. Experimental Site

The field experiment was conducted in a typical salt-alkali cotton field located in Korla city, Xinjiang (40°53′03″ N, 86°56′58″ E, 900 m above sea level), China (Figure 1). The region enjoys a typical continental desert climate. The annual mean precipitation is 135.4 mm, whereas the average annual potential evaporation is as high as 2417 mm. The daily water surface evaporation, buried depth of groundwater, maximum temperature, minimum temperature and daily precipitation data during the cotton growth period are shown in Figure 2. The total rainfall during the cotton growth period was 18.6 mm, while the effective rainfall was only 5.6 mm. The water surface evaporation increased first and then decreased during the cotton growth stage and was particularly high during May to June; moreover, the average buried depth of the groundwater was 1.53 m.
The soil in the 0~60 cm zone was mainly sandy loam and silt loam, while the soil in the 60~100 cm zone was mainly sandy; some soil physical properties and chemical properties in the 0~100 cm zone are shown in Table 1. The average bulk density in the rootzone (0~60 cm) was 1.57 g∙cm−3, while the average FC (volumetric water content) was 30.57%; moreover, the soil field water capacity declined in the 0~40 cm and 40~100 cm zones. The average initial soil salinity in the 0~100 cm zone was 0.52 g∙kg−1 and increased from the 0 cm to 100 cm soil layers. The content of NO3-N and NH4-N in the rootzone (0~60 cm) was 14.28 and 8.64 mg∙kg−1, respectively.

2.2. Experimental Design and Arrangement

2.2.1. Experimental Design

With the FC act as the upper limit of soil water, the drip irrigation was triggered by five soil water lower limit levels in the rootzone, which were 85% FC (T1), 75% FC (T2), 65% FC (T3), 55% FC (T4) and 45% FC (T5), respectively. The five treatments were replicated three times in a randomized complete factorial block design with 15 plots, each covering an area of 60.8 m2 (6.08 m × 10 m) with white polyethylene film 0.038 mm thick.

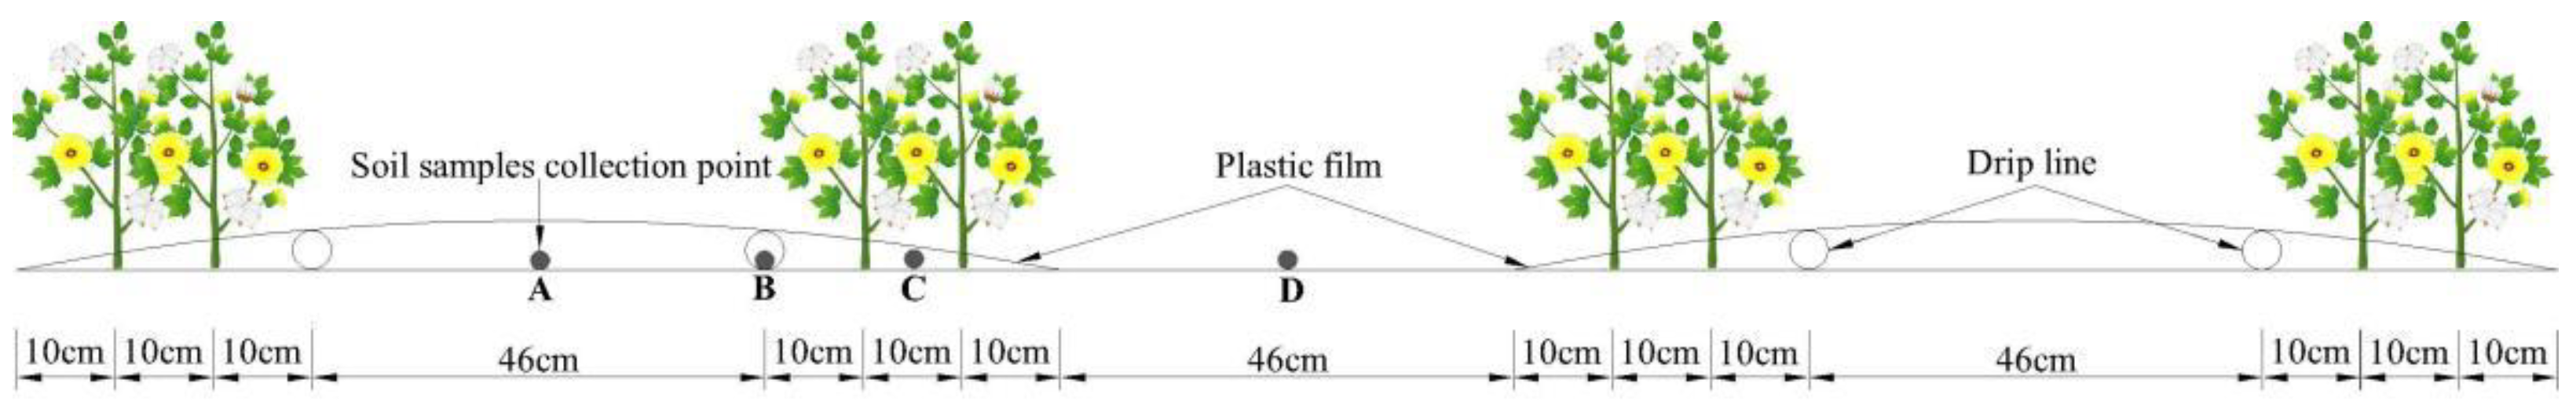
2.2.2. Experimental Arrangement

Cotton seeds of the variety Xinluzhong 66 were sown at a depth of 0.03 m with row spacing of “0.10 m + 0.66 m + 0.10 m” (Figure 3) and plant spacing of 0.10 m on 11 April 2018. Cotton seeds were planted on four beds in each plot; the beds were 1.06 m wide and 10 m long, spaced 0.46 m apart. Each treatment utilized three plots equipped with an independent drip irrigation system using water from a channel with salinity of 0.7 g∙L−1. Drip tapes with 0.3 m emitter intervals and flow rate of 2.4 L∙h−1 were placed on the beds (Figure 3).
To ensure that enough seedlings were available for the experiment, all of the plots were irrigated with a drip irrigation system immediately after sowing, and the quantity of irrigation was 15 mm. After seedling emergence, the irrigation water was applied immediately as soon as the soil moisture reached the designed lower limits in the rootzone for each treatment. Urea (N ≥ 46%), ammonium dihydrogen phosphate (P2O5 ≥ 46%) and potassium chloride (K2O ≥ 62%) were used as fertilizers and were applied by mixing them with irrigation water at a concentration of 30% (w·w−1). The dose of fertilizer was determined according to the local fertilizer rate for cotton, which was 300, 120 and 60 kg∙hm−2 for N, P2O5 and K2O, respectively. Moreover, the fertilizer was applied at the cotton bud stage, flowering stage, boll forming and boll opening stage, and the mass proportion of total fertilizer was 25%, 30%, 30% and 15%, respectively. Disease and pest management practices were the same as those used in local conventional cultivation.

2.3. Measurements and Methods

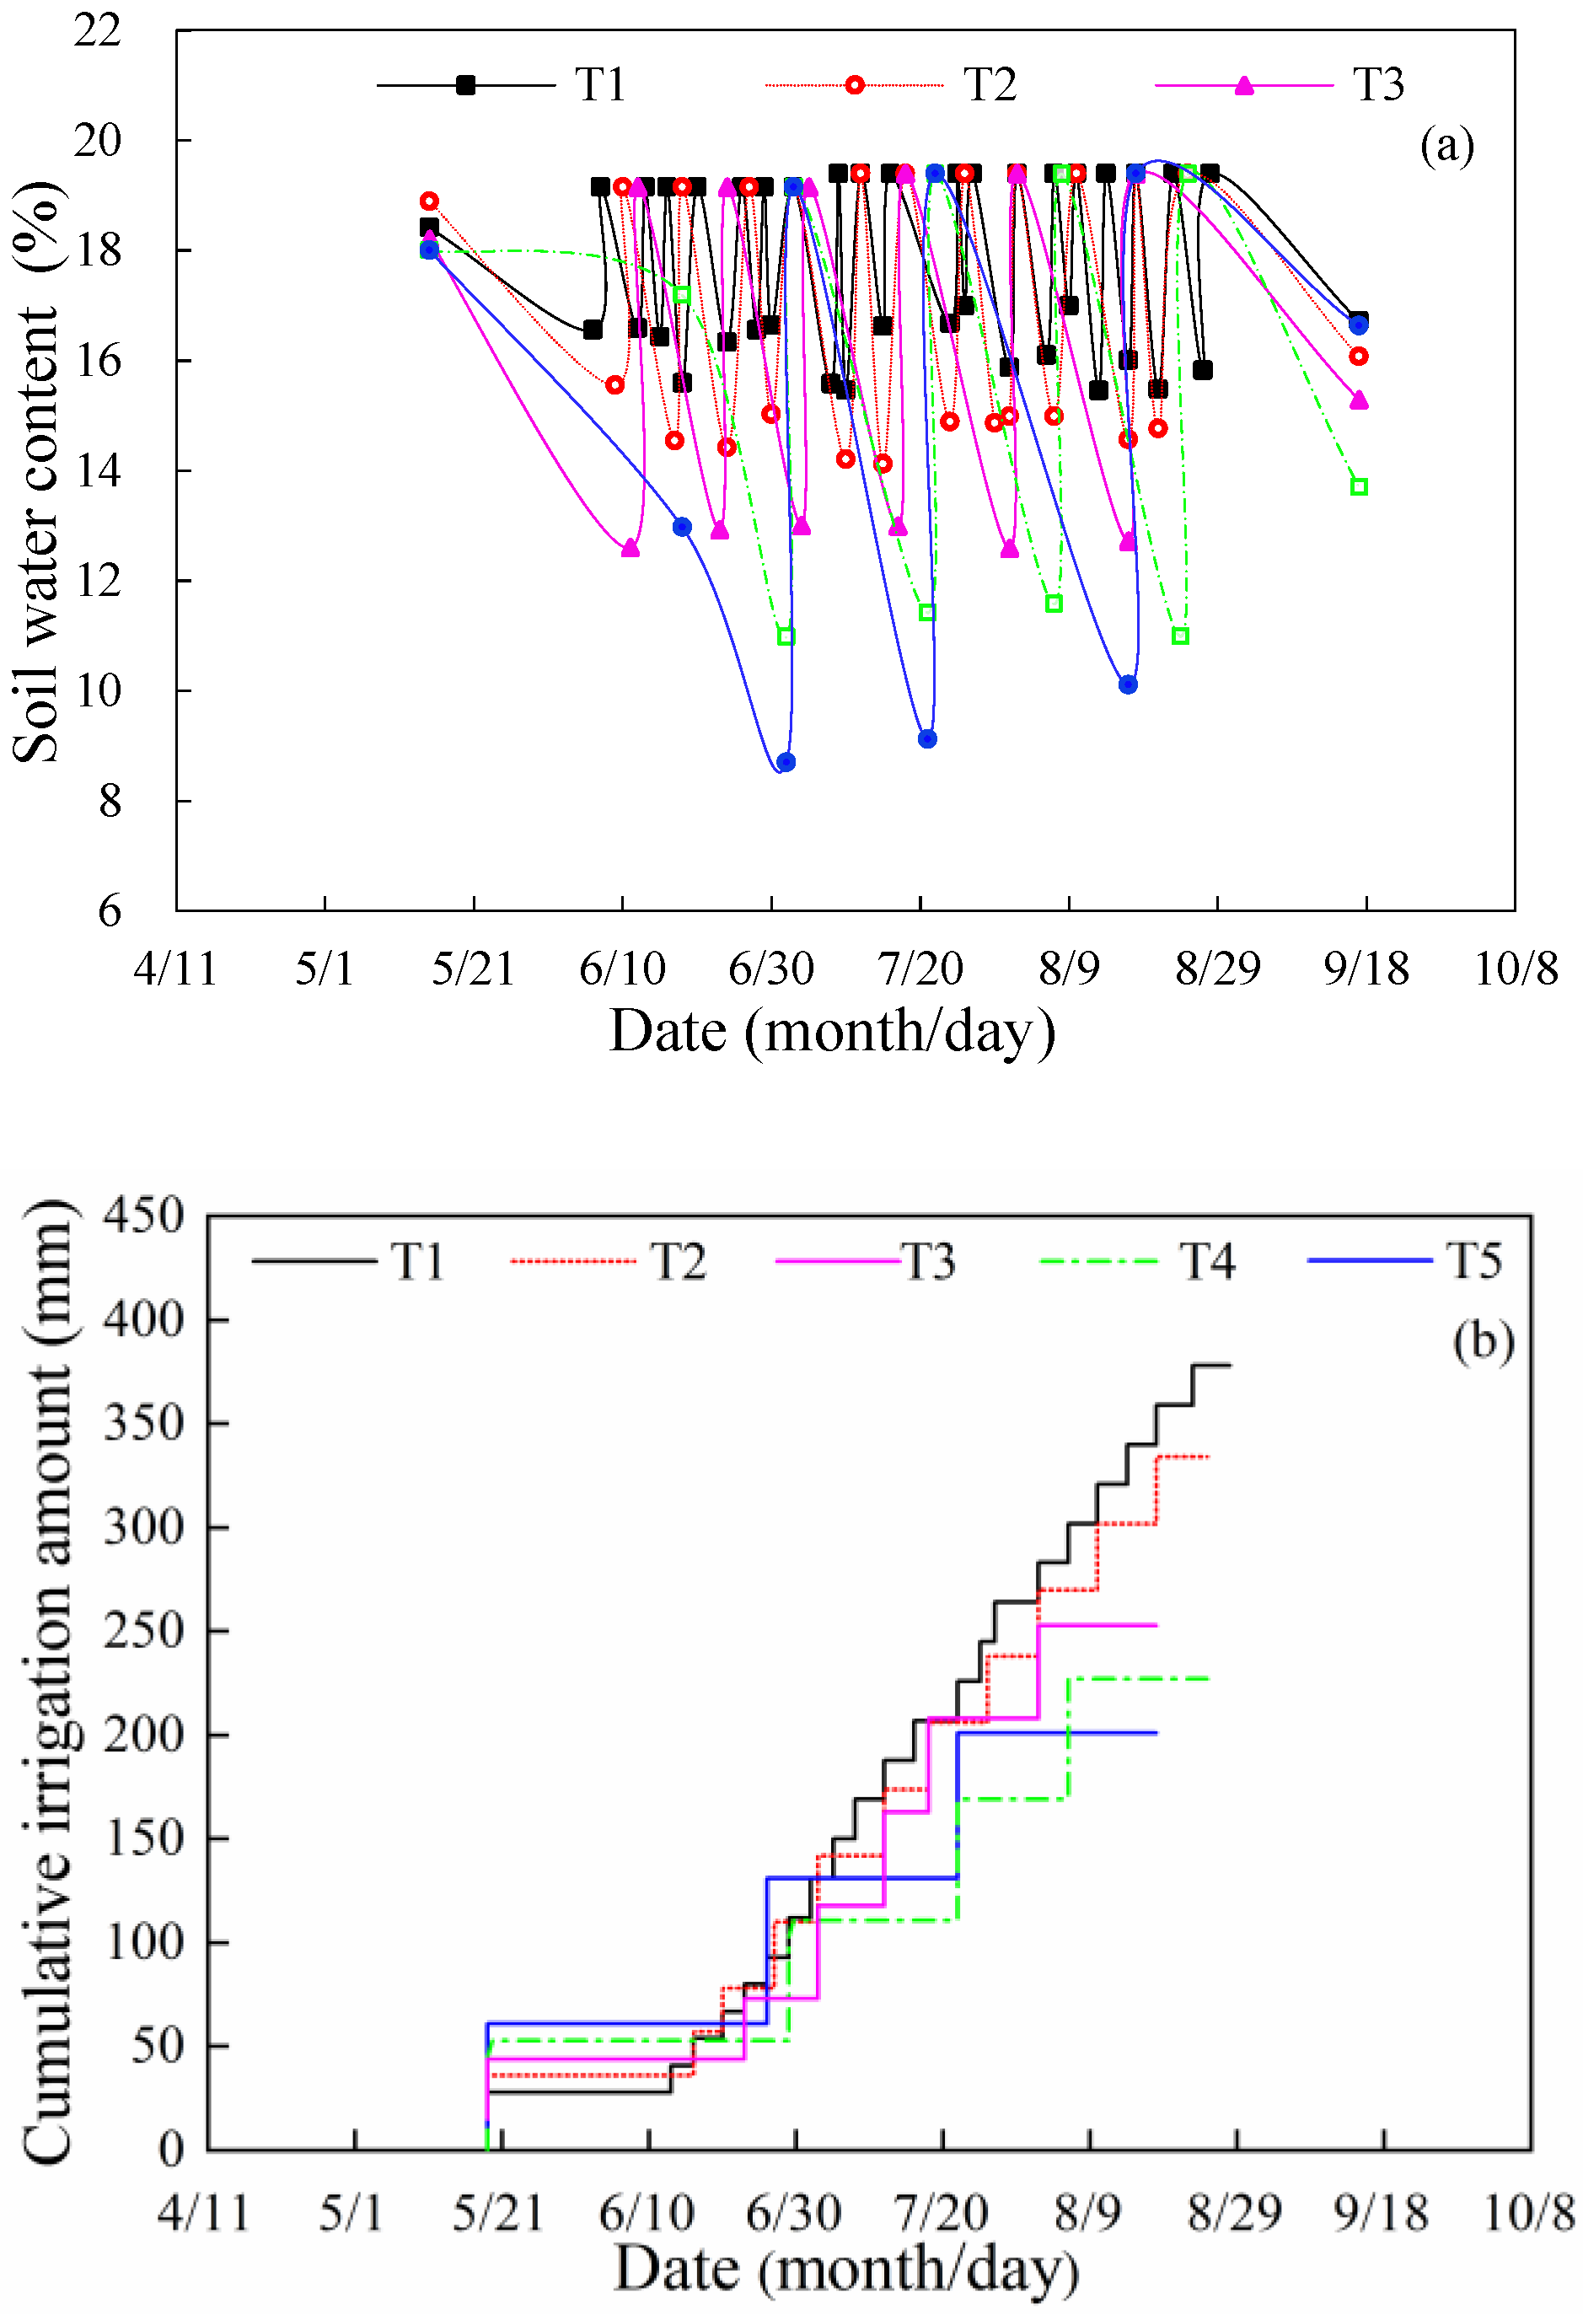
2.3.1. Soil Water Content and Salinity

Soil samples for moisture determination were collected (at position B in Figure 3) every day with a soil auger (5 cm in diameter and 25 cm high) during the growth period of cotton at depths of 0~20, 20~40 and 40~60 cm. Soil samples for the calculation of water consumption in different growth stages and soil salt content measurements were taken at the end of each cotton growth stage (budding, flowering, boll forming and boll opening stage), one day before sowing and harvest as well; the sample collection depths were distributed as follows: 0~10, 10~20, 20~40, 40~60, 60~80 and 80~100 cm, and the samples locations are shown in Figure 3 (A, B, C, D).
The soil samples for soil moisture measurement were sealed, weighed, dried in a fan-assisted oven at 105 ± 2 °C for 24 h, and reweighed to determine the gravimetric water content, and the volumetric soil water content was obtained by multiplying the gravimetric water content by the average soil bulk density of the measured soil layer. The soil samples for salinity measurement were air dried, ground and passed through a 1 mm sieve. Soil leachates were prepared at a soil to water ratio of 1:5. The electrical conductivity (EC1:5) was determined by a DDS-307A conductivity meter (Shanghai Precision & Scientific Instrument Inc., Shanghai, China) to obtain the soil salt content (SC). Based on the statistical linear relationship (SC = 2.446 × EC1:5; R2 = 0.98; n = 30), the EC1:5 could be converted into the soil salt content.

2.3.2. Irrigation Amount and ET

The irrigation quota for each drip irrigation treatment was determined by the following equation:
M = 10 × γ × H × p ( θ m a x θ m i n )
where M is the irrigation quota (mm) for each drip irrigation; γ is the soil bulk density of rootzone (g∙cm−3); H is the designed wetting depth (cm), which was 40 in bud stage, 60 in flowering stage to boll opening stage; p is moisture ratio, which was 0.7 in the present experiment; θmax is the FC (mass moisture content), which is the upper limit of soil moisture; θmin is the average soil mass moisture content in the designed wetting layer before irrigation, namely the lower limit of soil water content in the rootzone.
The crop water consumption for each treatment was determined by the soil water balance equation, as follow:
E T = P + U + I D R 10 i = 1 n [ γ i H i ( θ i 1 θ i 2 ) ]
where ET is the crop water consumption, mm; P is the precipitation, mm; U is the amount of groundwater recharge, mm; I is the irrigation quota, mm; D is the quantity of deep drainage, mm; R is the amount of runoff, mm; i is the number of the soil layer; n is the total number of soil layers; γi is the soil dry bulk density of layer i, g∙cm−3; Hi is the thickness of soil layer i cm; θi1 and θi2 are the soil moisture content at the beginning and end of the calculation interval, respectively, g∙g−1.
Due to the limited precipitation and drip irrigation, there was no deep drainage and surface runoff in the experimental area, D = 0, R = 0. The amount of groundwater recharge during the cotton growth period was determined by the formula proposed by Aviriyanover [41] with groundwater depth and water surface evaporation as follows:
U = × ( 1 ( h 3.8 ) 3 ) × E 0
where is the coefficient of groundwater recharge, which was 0.6 here; h is the groundwater buried depth, mm; E0 is the water surface evaporation, mm.

2.3.3. Cotton Yield

At the boll opening stage of cotton, three blocks (1.52 m × 1.0 m) were randomly selected in each plot for yield measurement. The cotton was harvested by hand on 17 September 2018; the cotton yield was weighed by an electronic balance, and the harvest density and number of effective bolls per plant were counted synchronously. Meanwhile, 10 cotton bolls were picked from the lower, middle and upper sections of each plot, respectively, to measure the average single boll weight.

2.3.4. WUE, IWUE and PFPN

The WUE, irrigation water use efficiency (IWUE) and PFPN were determined as follows:
W U E = Y / E T
I W U E = Y / I
P F P N = Y / T N
where Y is the cotton yield, kg∙hm−2; ET is the crop water consumption, m3∙hm−2; I is the irrigation amount, m3∙hm−2; TN is the total application of nitrogen fertilizer, kg∙hm−2.

2.3.5. Fiber Quality

After harvest, 30 bolls were randomly picked from each plot for fiber quality measurement. The fiber length, uniformity, strength, elongation, short-fiber index, textile parameter, micronaire, and maturity index of cotton were determined in the “Cotton Quality Inspection Center of the Ministry of Agriculture (Urumpi, Xinjiang, China)”. The fiber quality test was calibrated by the high volume instrument calibration cotton (HVICC, U.S. Department of Agriculture) [4].

2.3.6. Soil Salt

Soil Salt Accumulation

Based on the weights of horizontal distance to the sampling positions (the distance from the drip line to the wide row was 23 cm and the narrow row to the wide row was 38 cm), the salt accumulation inside the plastic film could be evaluated in different soil layers, while soil salinity changes in bare land represented the soil salt accumulation outside the film [42]. Soil salt accumulation during the whole growth period of cotton could be evaluated as follows:
Δ S i n = i = 1 n 10 H i γ i ( 23 106 Δ S C i , A + 38 106 Δ S C i , B + 45 106 Δ S C i , C )
Δ S o u t = i = 1 n 10 H i γ i Δ S C i , D
Δ S = 106 152 Δ S C i n + 46 152 Δ S C o u t
where ΔS is the amount of soil salt accumulation in 0~1 m soil profile, g∙m−2; ΔSin and ΔSout are the quantity of soil salt accumulation in 0~1 m soil profile inside the film and outside the film, respectively, g∙m−2; ΔSCi,A, ΔSCi,B, ΔSCi,C and ΔSCi,D are the variation of soil salinity for points A, B, C and D between sowing and harvest in 0~1 m soil profile, respectively, g∙kg−1. Hi is the soil depth of layer(i = 1, 2, …, 6), m; γi is the soil bulk density of layer i.

Soil Salination Rate

The soil salination rate is the rate of increase in soil salinity in the 0~100 cm soil profile during the cotton growth period; the equation is as follows [43]:
W = S t S 0 S 0 × 100 %
where St is the soil salt content after harvest, kg∙hm−2; S0 is the soil salt content before cotton sowing, kg∙hm−2.

2.3.7. Economic Benefit

The economic benefit for cotton production in designed treatments in the experimental zone was evaluated as follows [44]:
E b = G p I w F w O
where Eb is the economic benefit, CNY∙hm−2; Gp is the gross profit, CNY∙hm−2; Iw is the irrigation cost, CNY∙hm−2; Fw is the fertilizer input, CNY∙hm−2; O is other inputs, CNY∙hm−2.

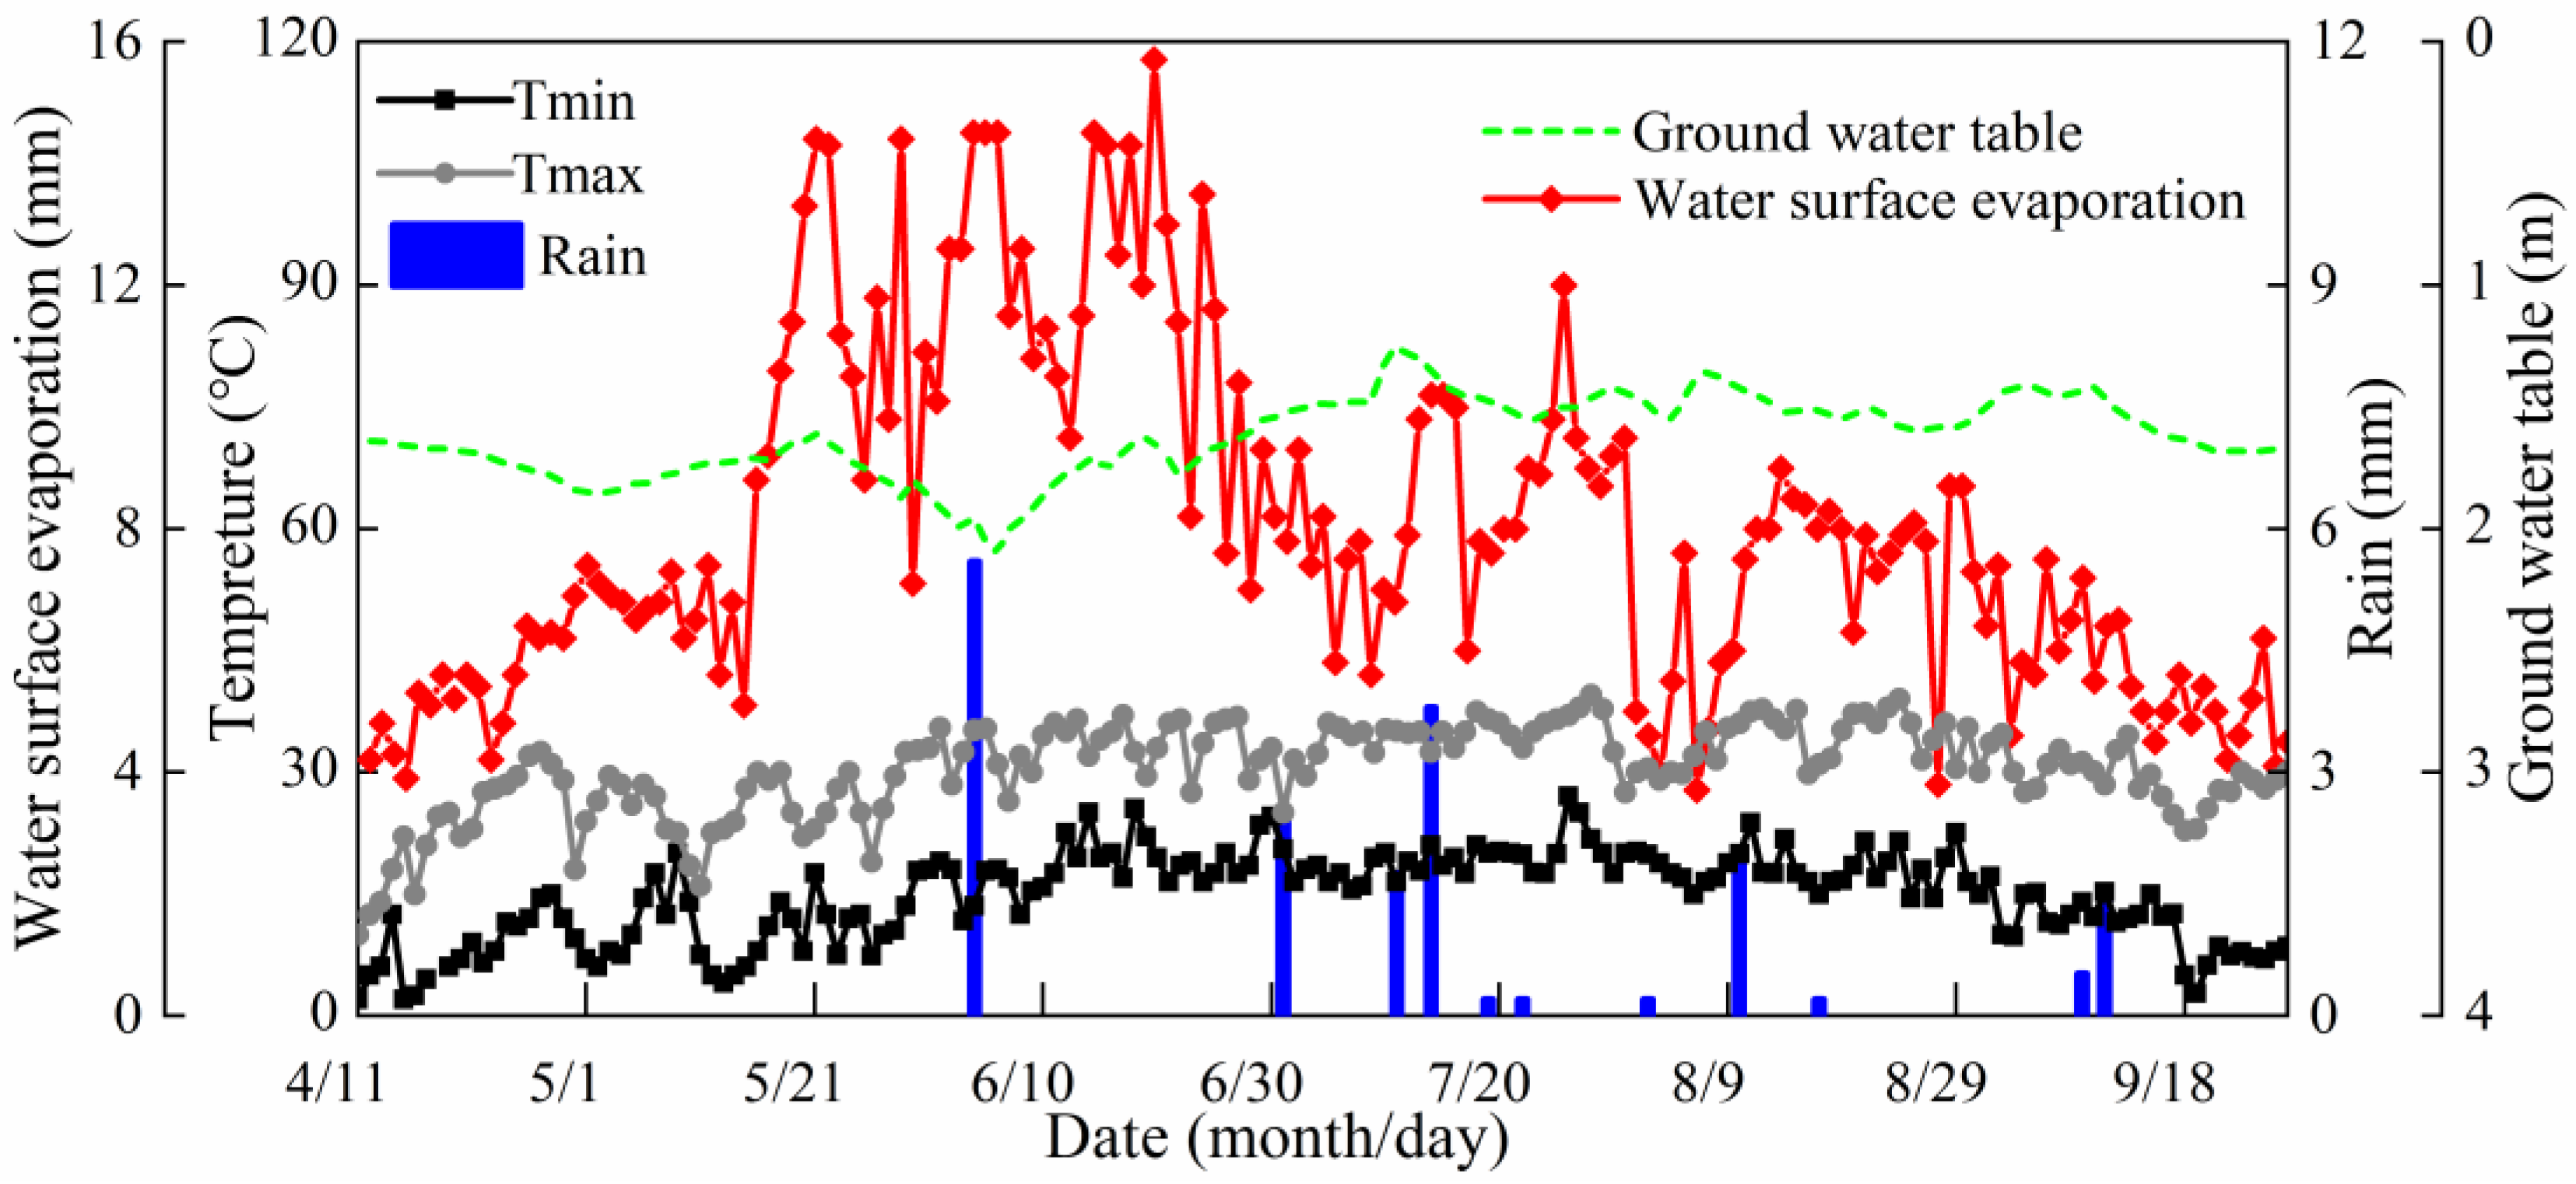
2.3.8. Observation of Groundwater Depth and Meteorological Data

Meteorological data, including daily rainfall, wind speed, and temperature, were obtained from an automatic weather station (YM-03A) located 43 m away from the field experiment area. The groundwater buried depth during the cotton growth period was observed by an automatic record water level meter.

2.3.9. Entropy Weight TOPSIS Method

The entropy weight TOPSIS method is a comprehensive evaluation method that applies the entropy weight method for the weights of indexes and the TOPSIS method for decisions.
The detailed calculation formulas for measuring the index weights are as follows:
W j = 1 E j m E j
E j = l n ( n ) 1 i = 1 n p i j l n ( p i j )
p i j = y i j i = 1 n y i j
y i j = r i j m i n ( r j ) m a x ( r j ) m i n ( r j )       j = 1 , 2 , m
where Wj is the entropy weight; Ej is the entropy value for the jth index; pij is the proportion of the ith evaluation object under the jth index; yij is the dimensionless value of the ith evaluation object under the jth index; rij is the value of the ith evaluation object under the jth index.
The detailed equations for deciding the relative proximity are as follows:
C = D D + + D
D = j = 1 m ( z i j z j ) 2
D + = j = 1 m ( z i j z j + ) 2           i = 1 , 2 , n
z i j = b i j   ×   W j i = 1 , 2 n ;     j = 1 , 2 , , m  
b i j = r i j i = 1 n r i j 2 j = 1 , 2 , , m
where C is the relative proximity; D+ and D are the positive and negative ideal solution distances between the target value and the ideal point, respectively.

2.4. Data Analysis

One-way analysis of variance (ANOVA) was performed with Duncan’s multiple range test at p < 0.05 in SPSS 20.0 (SPSS Inc., Chicago, CA, USA) to evaluate the influence of soil water regulation on cotton yield, WUE, PFPN, fiber quality and soil salt accumulation. The soil water content and soil salinity were analyzed for average and standard deviation for each treatment (n = 3). The entropy weight TOPSIS analysis for all indexes was performed with online software (SPSSAU). Additionally, Origin 9.0, ArcGIS 10.5 and Auto CAD 2016 were used to draw the figures.

3. Results

3.1. Water Consumption Characteristics of Cotton

The variation in soil water content in the designed wetting layer during the growth period of cotton is shown in Figure 4a. The soil moisture for each treatment at seedling stage (15 May) was 18%, which was close to the FC, while the soil moisture after cotton harvest (17 September) was significantly decreased compared with that in the seedling stage. Due to the higher soil water lower limit in T1 treatment, the irrigation quota for T1 treatment was small, and the irrigation frequency was higher than in other treatments; moreover, the soil moisture for T1 treatment usually decreased from 100% FC to 85% FC within 3~4 days. Contrarily, as the soil water lower limit for T5 treatment was low, the soil moisture after each irrigation was higher than the designed soil water lower limit for a long time, which resulted in a low irrigation frequency with an interval of about 26 days. As shown in Figure 4b, the irrigation frequency and cumulative irrigation quota for treatments both followed T1 > T2 > T3 > T4 > T5, the cumulative irrigation quota for T1 treatment reached as high as 378 mm, and the cumulative irrigation quotas for the T2, T3, T4 and T5 treatments decreased by 9.52%, 30.65%, 38.99% and 44.94%, respectively, compared with that for the T1 treatment.
According to the soil moisture for treatment on 11 April, 19 June, 26 July, 22 August and 17 September, the daily water consumption intensity of cotton was evaluated with Formula (2), and the result is shown in Table 2. The average daily water consumption intensity of cotton from seedling stage to early bud stage was 0.87~1.95 mm∙d−1, while the maximum water consumption intensity for T1 treatment was 1.95 mm∙d−1; however, the daily water consumption intensity for the T2, T3, T4 and T5 treatments decreased by 47.96%, 124.17%, 84.69% and 41.21%, respectively, compared with that for the T1 treatment. Additionally, the average daily water consumption intensity of cotton was 3.03~5.78 mm∙d−1 from late bud stage to flowering stage, and the values for the T4 and T5 treatments were significantly lower than those for the T1, T2 and T3 treatments. Moreover, the average daily water consumption intensity of cotton in the boll forming stage was 2.52~5.82 mm∙d−1, and the T2 treatment obtained the maximum value of 5.82 mm∙d−1, which was 7.29%, 73.56%, 28.92% and 130.35% higher than that of the T1, T3, T4 and T5 treatment, respectively. Furthermore, the daily water consumption intensity during the boll opening period of cotton was basically maintained at 1.92~3.71 mm∙d−1, and the T4 treatment yielded the maximum value.
The water consumption percentage of cotton for treatments in each growth period is shown in Table 2. The water consumption modulus of cotton in growth stages follows late bud stage to flowering stage (irrigation interval of 37 days), boll stage (irrigation interval of 27 days), seedling stage to early bud stage (irrigation interval of 69 days), and then the boll opening stage (irrigation interval of 26 days). Due to the high value of the cotton water consumption modulus, the late bud stage to boll forming stage becomes the key period for water absorption by cotton. The T2 treatment obtained the highest water consumption modulus during the late bud stage to boll forming stage. However, compared with that for the T2 treatment, the water consumption modulus for the T1, T3, T4 and T5 treatments decreased by 10.61%, 0.80%, 22.23% and 19.15%, respectively.
The above results indicated that an irrational soil water lower limit was not conducive to the reasonable allocation of water consumption modulus throughout the whole growth period of cotton. Moreover, the soil water lower limit of 75% FC was in accord with the high value of the water consumption modulus in the key period of water demand by cotton.

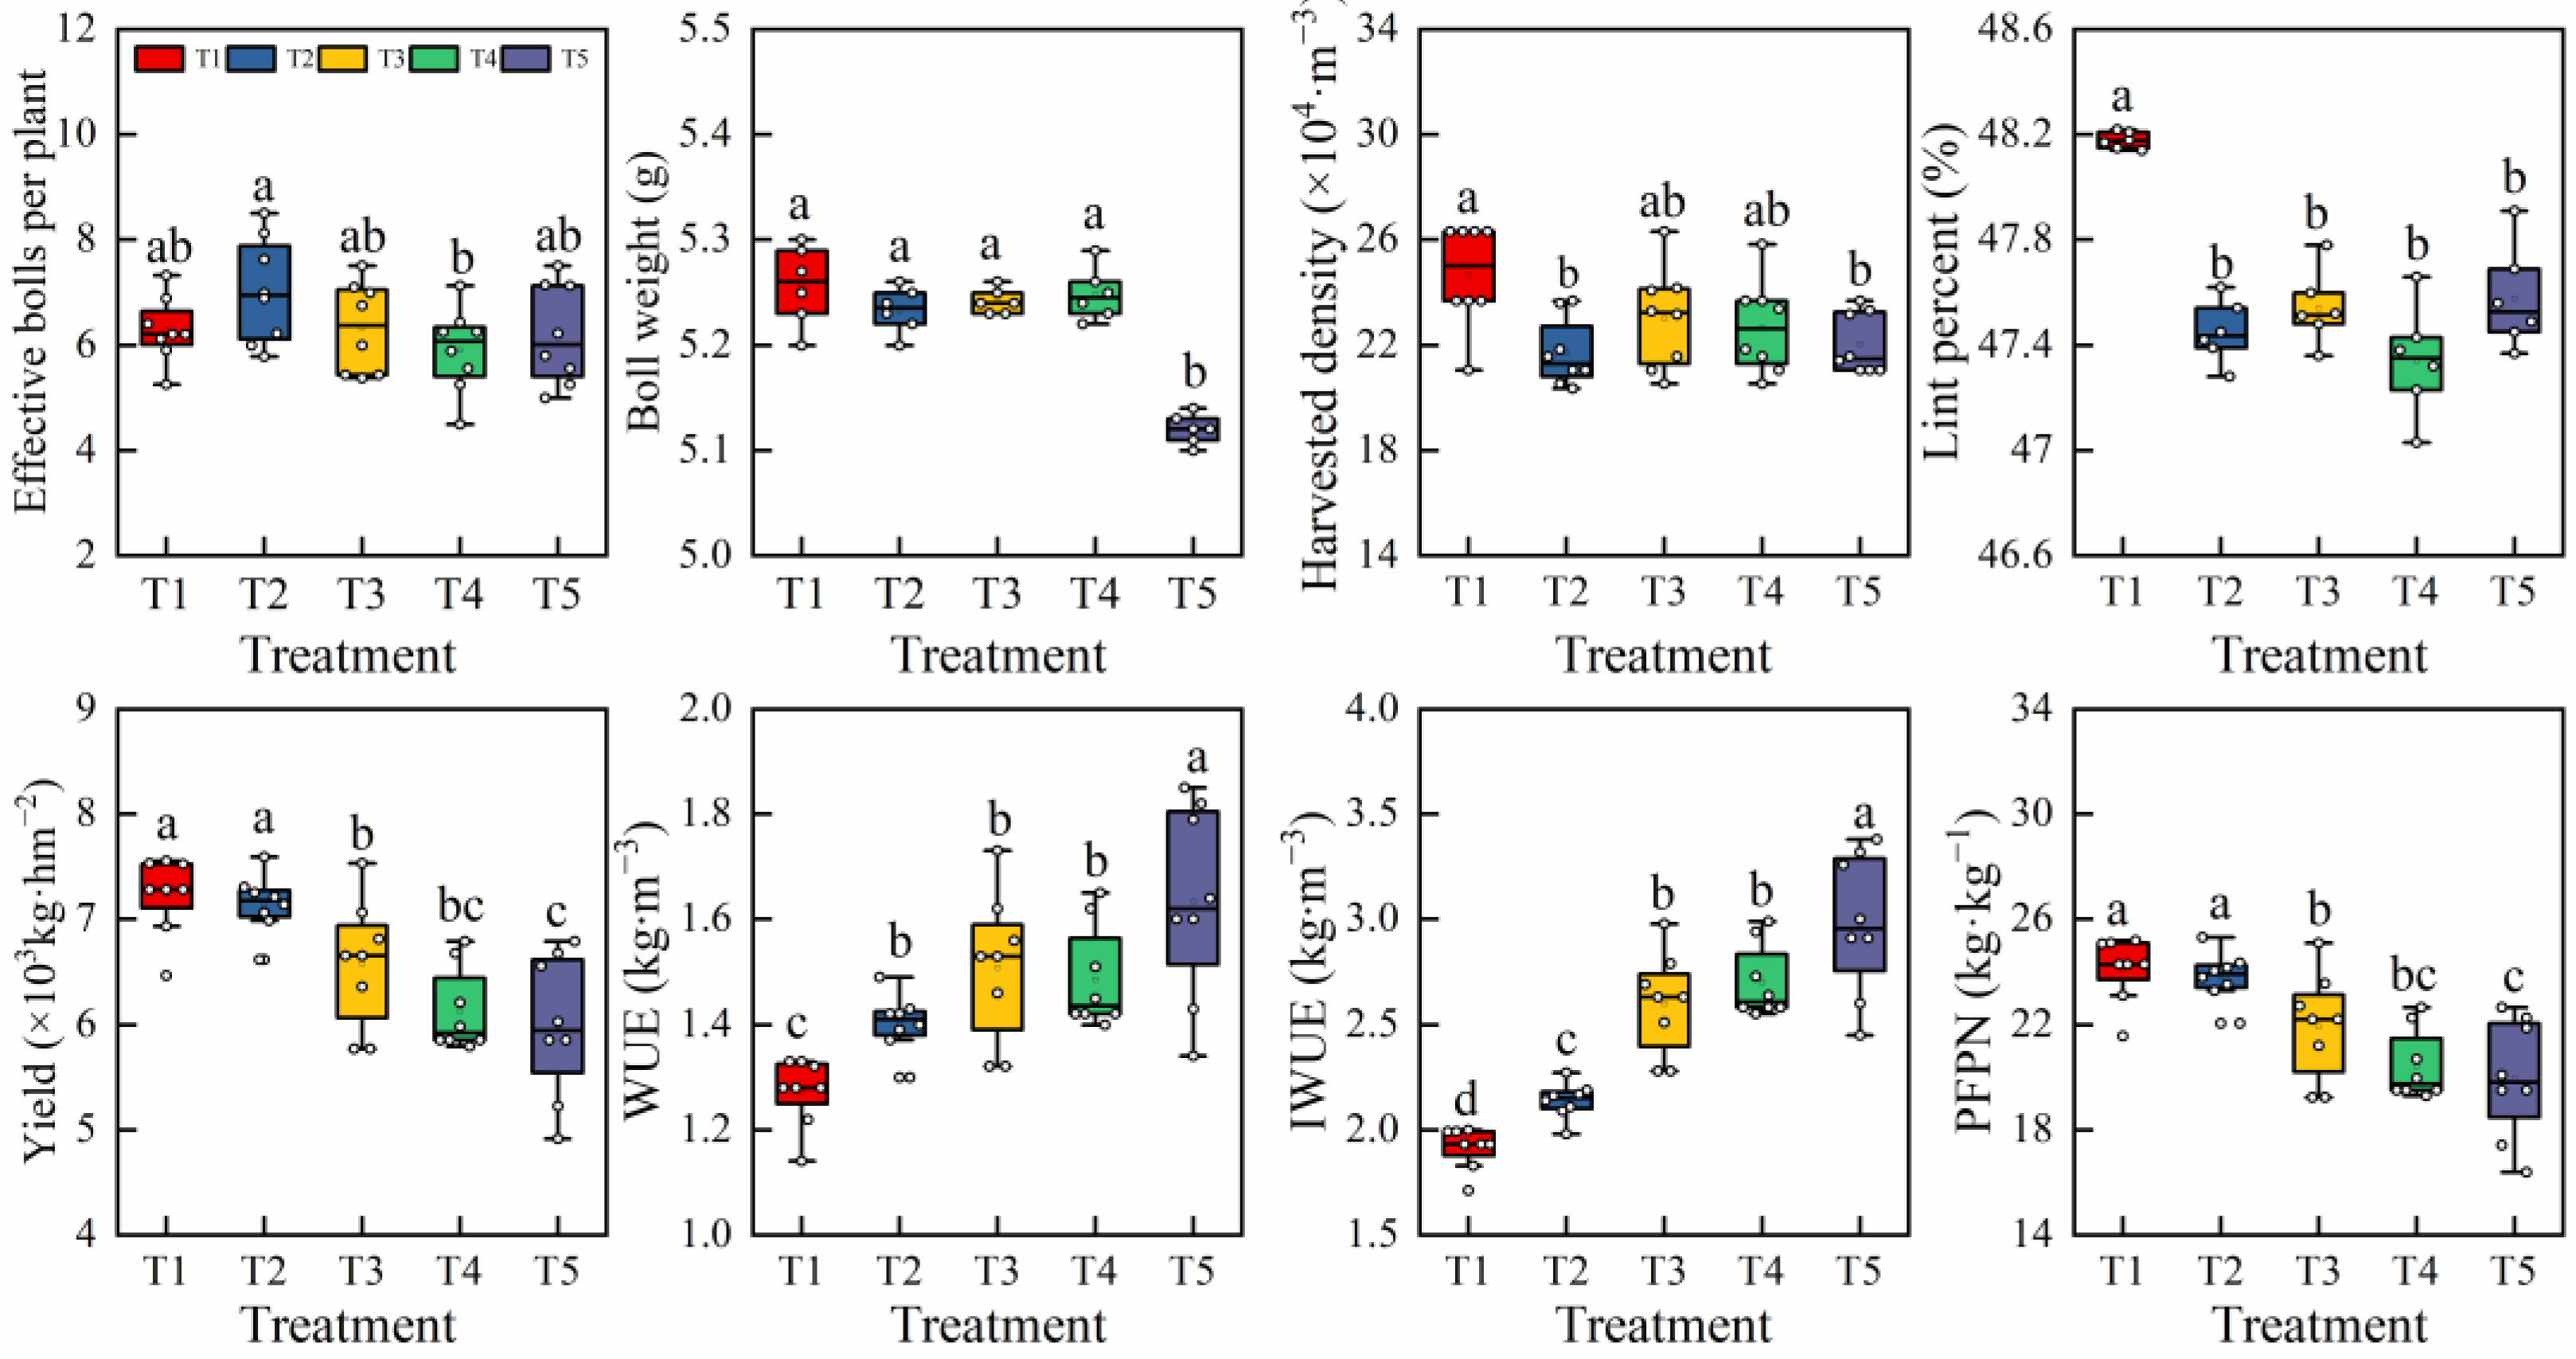
3.2. Cotton Yield, Water and Nitrogen Use Efficiency
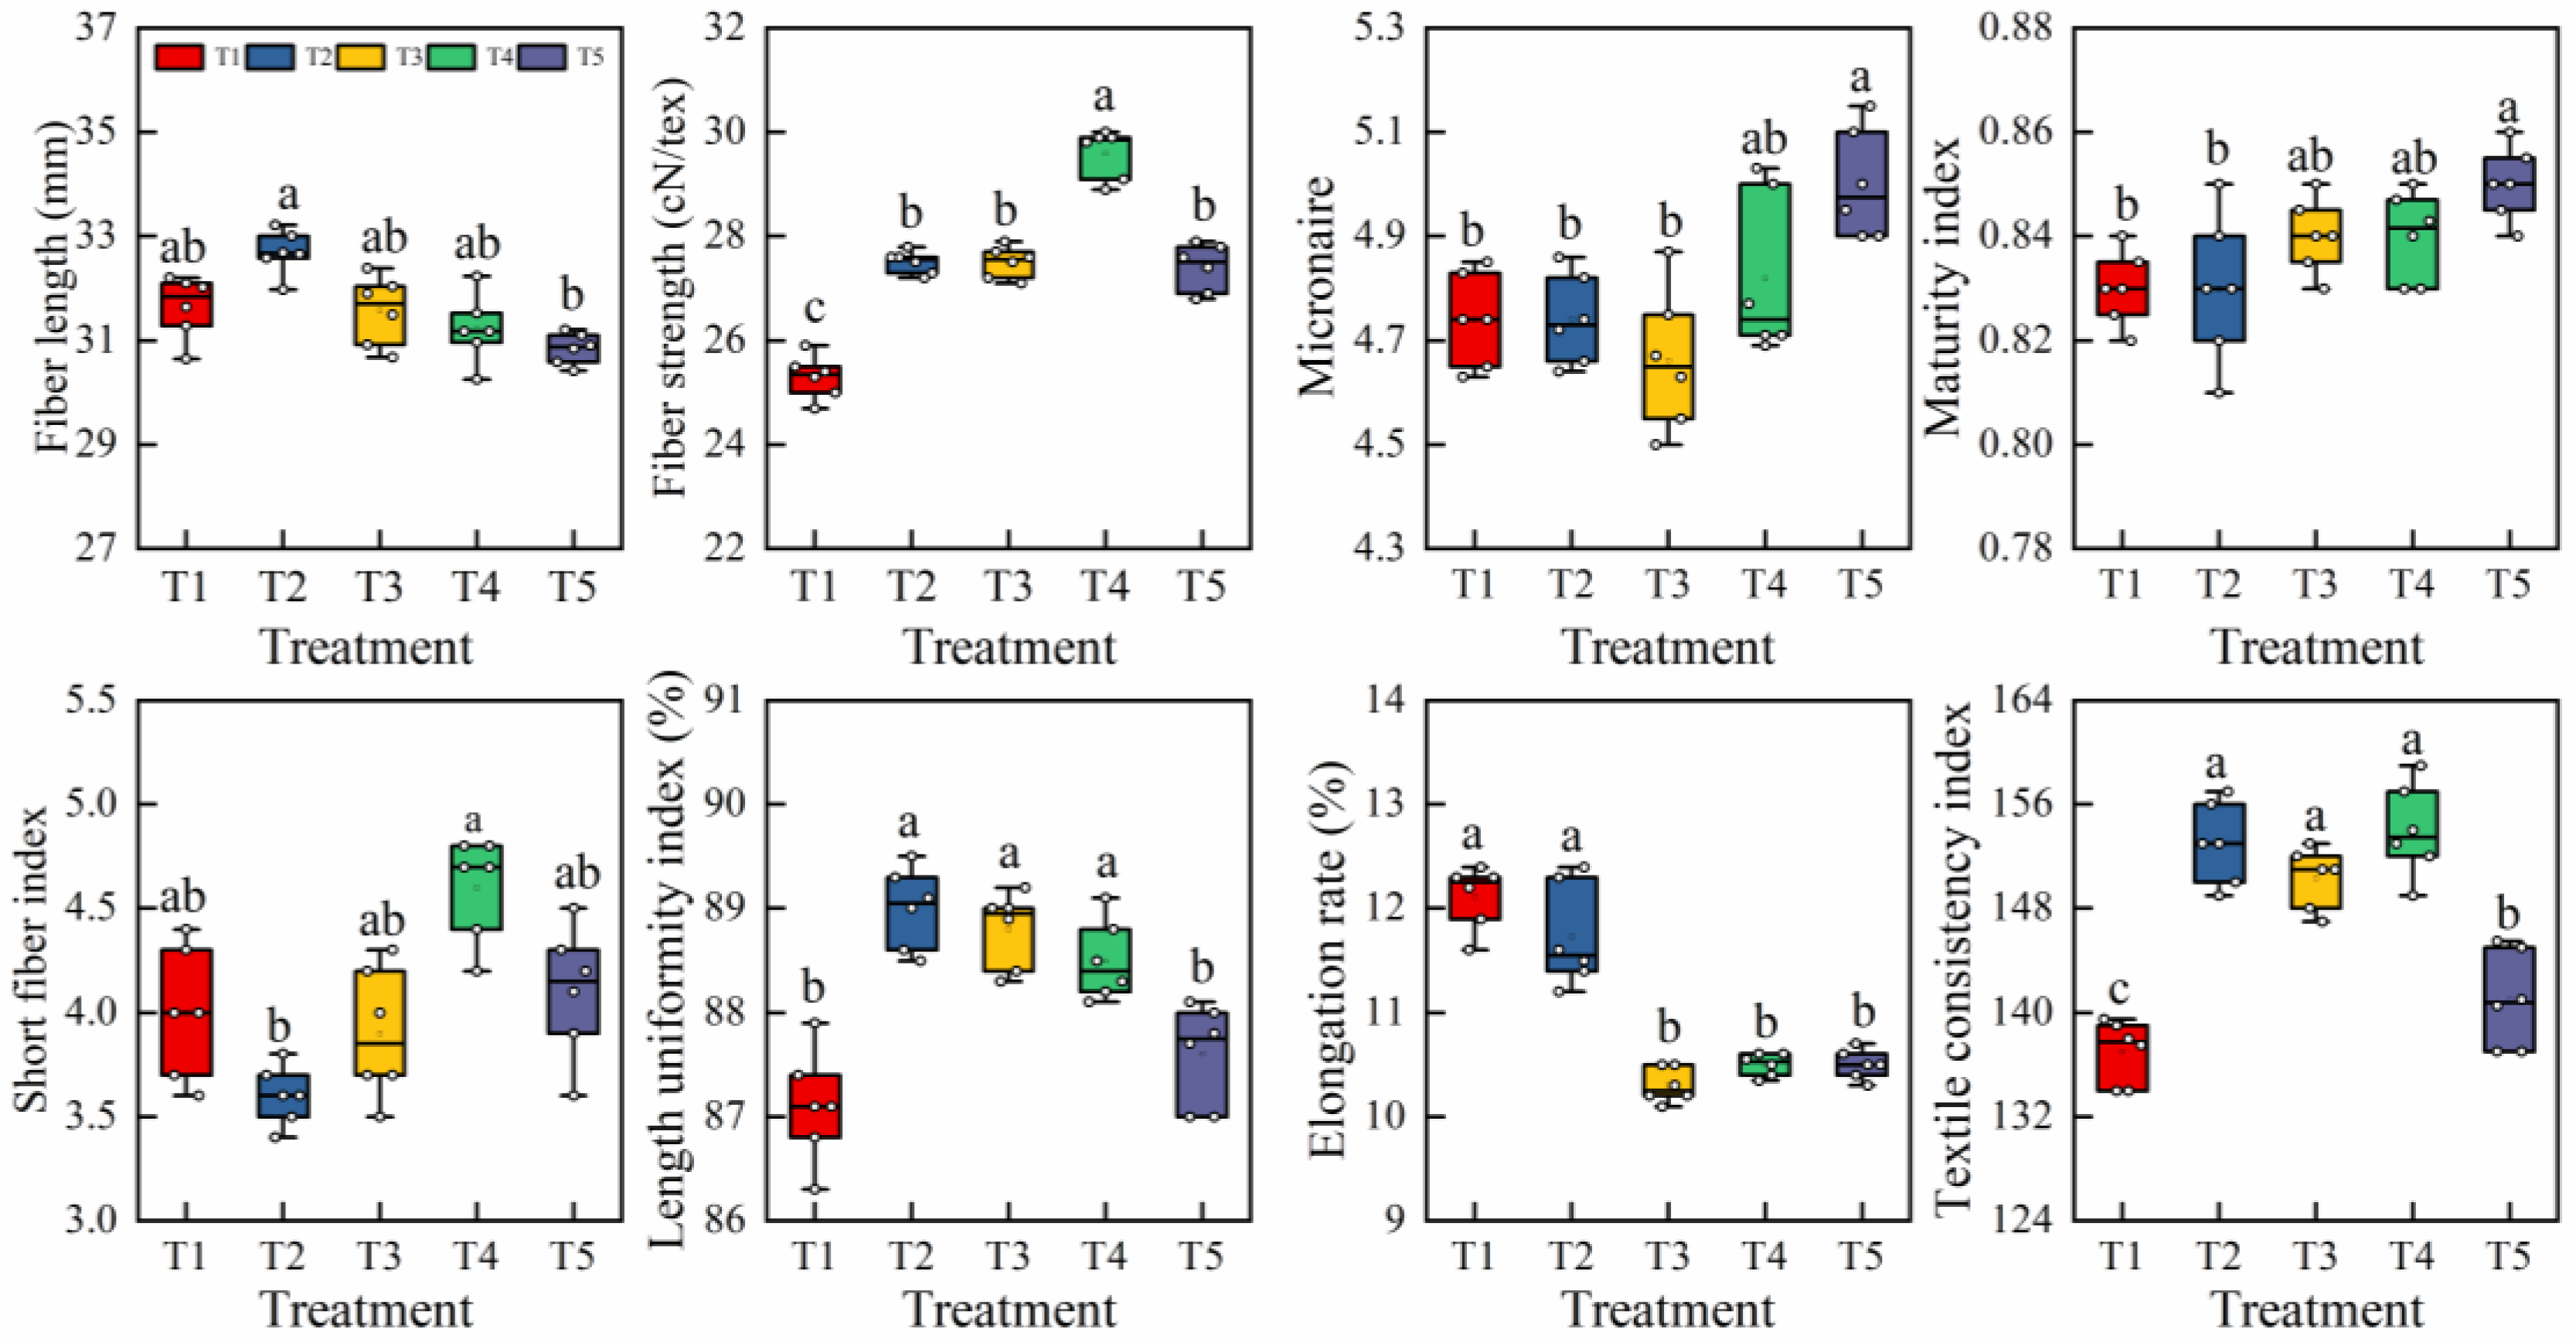
Generally, the cotton yield can be comprehensively affected by boll number per plant, harvest density, average boll weight, and lint percentage. As shown in Figure 5, there was a significant difference in yield components for treatments. T2 treatment obtained the highest boll number per plant, which was 10.44%, 9.85%, 15.80% and 11.65% higher than the boll number per plant obtained with the T1, T3, T4 and T5 treatments, respectively. The average boll weight of cotton with the T5 treatment was significantly lower than that with the other treatments (p < 0.05), while there were no significant differences for the T1, T2, T3 and T4 treatments (p > 0.05). Moreover, the T1 treatment obtained the highest value for harvest density, and the T3 treatment followed, while there were no significant differences among the T2, T4 and T5 treatments (p > 0.05). The lint percentage of cotton with the T1 treatment was significantly higher than that with the other treatments, which indicates that the increase in the soil water lower limit was conducive to an increase in the lint percentage of cotton. There was no significant difference in cotton yield between the T1 and T2 treatments; however, cotton production with the T3, T4 and T5 treatments was significantly lower than that with the T1 and T2 treatments. Additionally, with the decrease in the soil water lower limit, both the WUE and IWUE increased gradually, while the PFPN decreased. WUE and IWUE for the T2 treatment were significantly higher than those for the T1 treatment; however, there was no significant difference in PFPN between the T1 and T2 treatments.
The results above indicated that rational reduction in the soil water lower limit within a certain range has no significant effect on the single boll weight of cotton, but when the soil water lower limit was lower than 45% FC, the single boll weight of cotton significantly decreased. Moreover, the cotton yield and PFPN increased with the increase in soil water lower limit, whereas when the soil water lower limit exceeded 75% FC, the increase had little effect on yield or PFPN improvement.

3.3. Fiber Quality

The cotton fiber quality corresponding to different soil water lower limits is shown in Figure 6. The fiber length uniformity index of cotton for all treatments was higher than 86%, which indicated that the fiber length uniformity index for designed treatments reached the high level. In addition to the fact that the fiber strength for T1 treatment was at the low level, the fiber strength for T2, T3, T4 and T5 treatment remained in the middle level. Moreover, the fiber elongation for treatments was higher than 7, which stayed at a high level. In addition, the cotton fiber micronaire value for treatments ranged from 3.7 to 5.0, which belonged in the middle level.
As shown in Figure 6, the fiber length of cotton increased with the increase in soil water lower limit, while the fiber length decreased with the increasing soil water lower limit as the limit rose higher than 75% FC. The fiber strength increased first and then decreased with the decrease in soil water lower limit, and the fiber strength of cotton for T4 treatment achieved the highest value, which indicated that an appropriate decrease in the soil water lower limit was conducive to an increase in fiber strength. The micronaire value and maturity index of cotton fiber increased with the decrease in soil water lower limit, which indicated that the lower the soil water lower limit, the higher the maturity index and micronaire value of cotton fiber. Moreover, the cotton fiber elongation was positively correlated with the soil water lower limit. The fiber elongation for T1 and T2 treatments was significantly higher than that for the T3, T4 and T5 treatments, which implied that the decrease in the soil water lower limit was not conducive to an improvement in cotton fiber elongation. Additionally, with an increase in soil water lower limit, the length uniformity index and textile consistency index of cotton fiber increased first and then decreased, and the T2 treatment and T4 treatment reached the maximum value of the length uniformity index and textile consistency index of cotton fiber, respectively. Additionally, the length uniformity index and textile consistency index of cotton fiber for the T2, T3 and T4 treatments were significantly higher than those for the T1 and T5 treatments, which indicated that a soil water lower limit too high or too low was unfavorable for the length uniformity index and textile consistency index of cotton fiber. Moreover, the short fiber index for the T2 treatment was lower than that for other treatments.

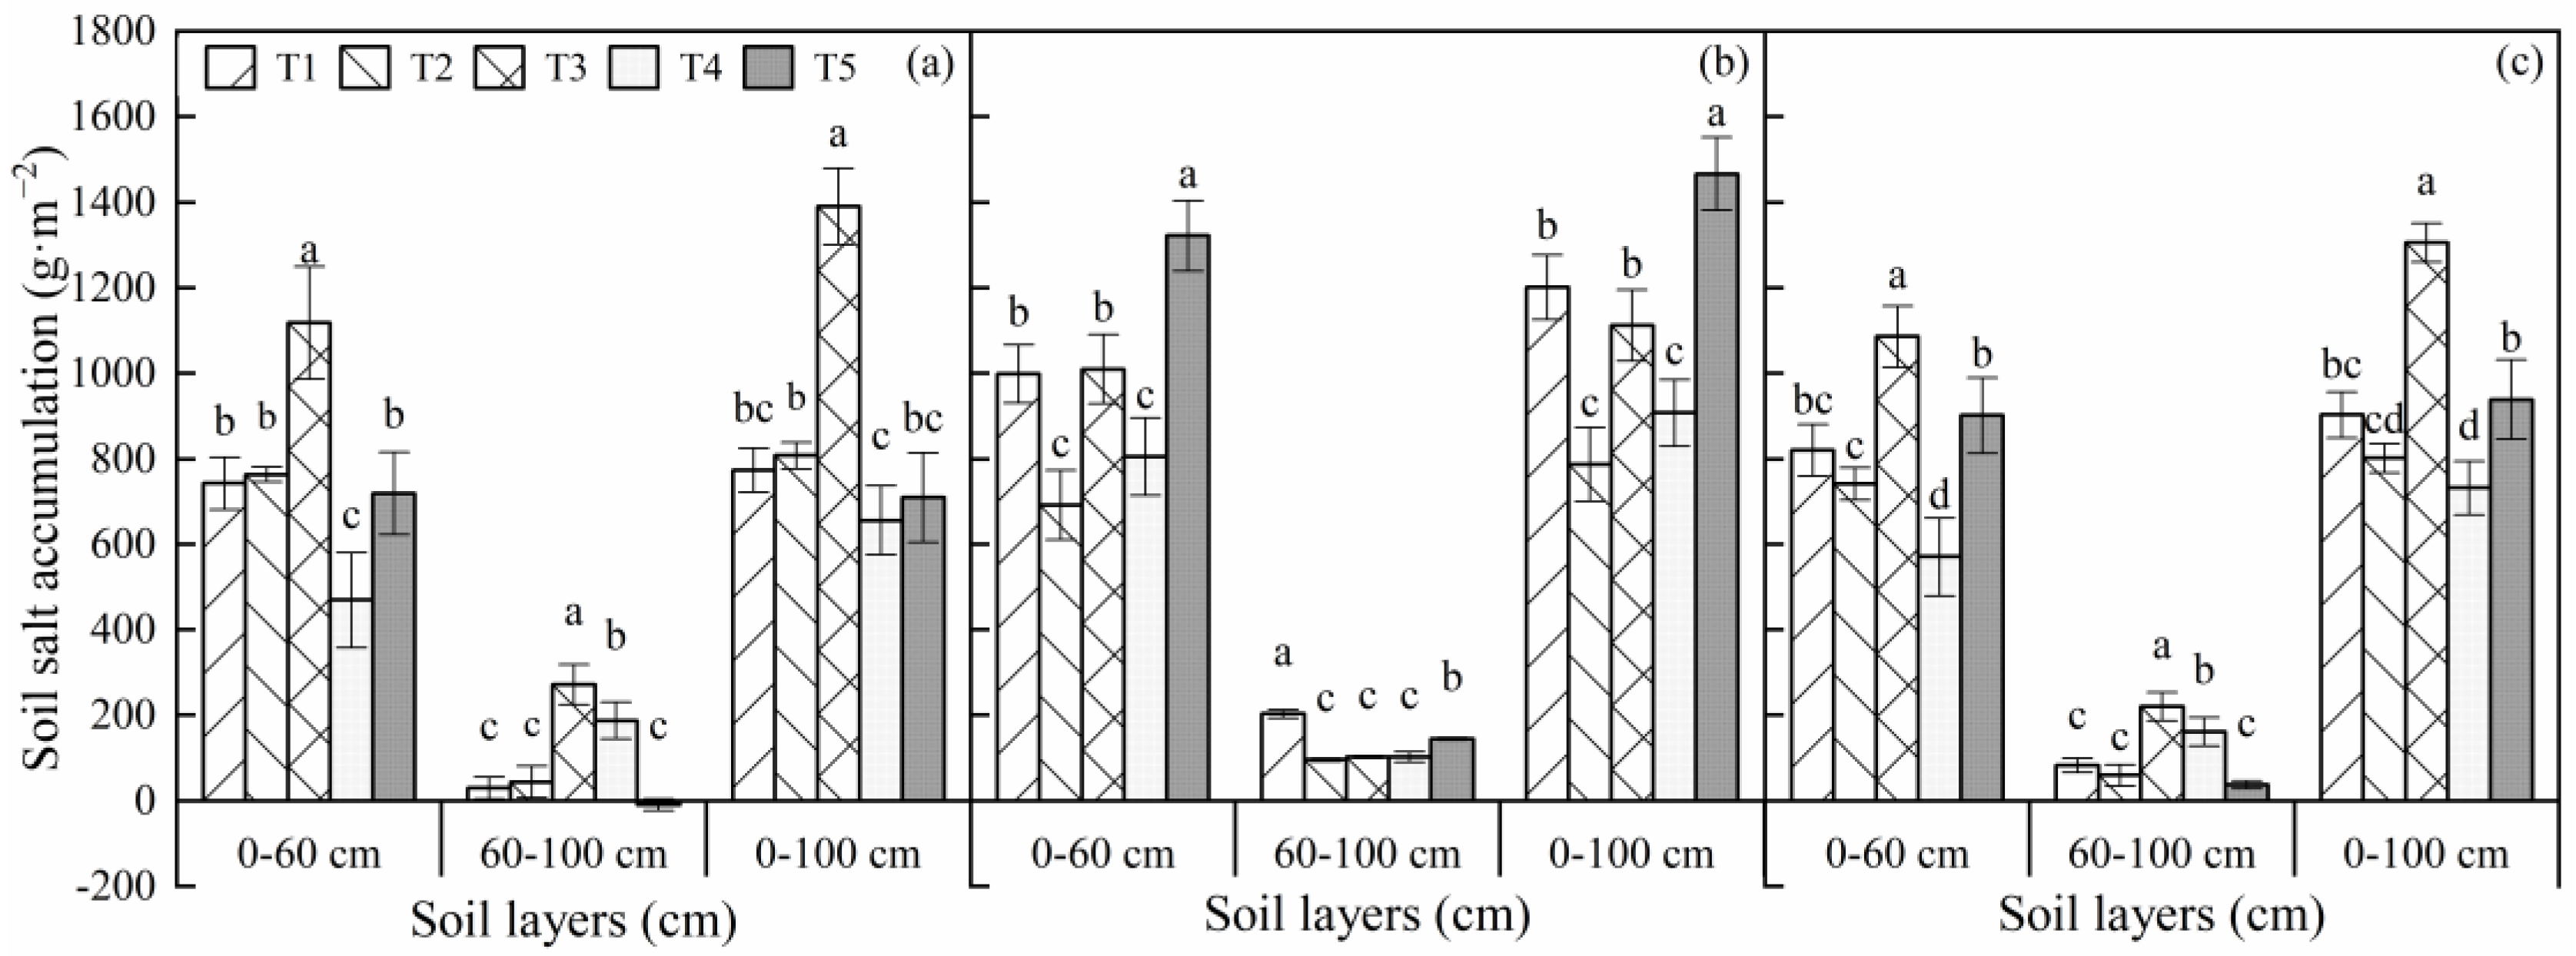
3.4. Soil Salt Accumulation

Irrigation was regulated according to the soil moisture lower limit. During the boll bearing stage, the T1, T2 and T4 treatments were irrigated, while the T3 and T5 treatments were not irrigated. The variation in soil salt content for treatments from sowing to harvest is shown in Figure 7. Affected by the horizontal migration of soil salt inside the film to outside the mulch, and the deep soil salt outside the membrane accumulated to the surface; the top soil salt accumulation inside the film was significantly less than that outside the film. Owing to the topsoil evaporation, the soil salt accumulation in 0~60 cm was higher than that in the 60~100 cm soil layer. As shown in Figure 7a,b, there was no significant difference in soil salt accumulation inside the film between T1 and T2 treatments (p > 0.05), while the salt accumulation outside the mulch for the T1 treatment was significantly higher than that for the T2 treatment. The irrigation quota for the T3 treatment (41 mm) was less than that for the T5 treatment (64 mm) in the boll opening stage, which was in accord with the fact that the soil salt accumulation for the T3 treatment was higher than that for the T5 treatment. Additionally, as shown in Figure 7c, the total salt accumulation in 0~100 cm followed T3 > T5 > T1 > T2 > T4.
The soil salt accumulation rates for treatments in the 0~100 cm layer inside and outside the film are shown in Table 3. At the end of the growth period, except for the soil desalination in 60~100 cm inside the film for the T5 treatment, the soil salt accumulation rates in each soil layer inside and outside the film for the treatments were higher than 0. The salt accumulation rate in the 0~60 cm layer inside the film was 96.64% ~ 230.36%, which was 2.25~22.46 times more than that in the 60~100 cm layer inside the film. Additionally, the salt accumulation rate in the 0~60 cm layer outside the film was 119.27% ~ 226.46%, which was 3.78~7.38 times more than that in the 60~100 cm layer outside the film. The soil salt accumulation rate outside the film was about 0.72~1.82 times more than that inside the mulch in the 0~100 cm layer. Moreover, the salt accumulation rate in the 0~60 cm layer outside the film was 0.75~1.43 times more than that in the 0~60 cm layer inside the film, and the salt accumulation rate in the 60~100 cm soil layer outside the film was 0.38~6.70 times more than that in the 60~100 cm layer inside the film. Both inside and outside the film, the soil salt accumulation rate in the 0~60 cm layer was 3.01~21.21 times more than that in the 60~100 cm layer. In conclusion, the salt accumulation rate in the 0~100 cm layer followed T3 > T5 > T1 > T2 > T4.

3.5. Optimization of Irrigation System

The entropy TOPSIS method was used for the independent evaluation of 13 cotton yield indexes to select an appropriate soil moisture regulation model. The evaluation indexes and the corresponding assignments for treatments are shown in Table 4. Generally, the smaller the cotton fiber maturity index and short fiber index, the higher the cotton quality. Additionally, when the elongation and micronaire value of cotton fiber were higher than 7 and 4.2, respectively, the smaller the fiber elongation the micronaire value of cotton fiber, the higher the cotton quality [45].
The ranking results for treatments based on the entropy weight TOPSIS analysis is shown in Table 5. T2 treatment and T5 treatment obtained the first and fifth order, which indicated that the soil moisture regulation model for the T2 treatment was better than that for the other treatments.

4. Discussion

4.1. Water Consumption Characteristics of Cotton

Generally speaking, the water consumption by the crop during the growth period is positively related to the irrigation quota: the higher the irrigation quota, the higher the crop water consumption. This study indicated that when the irrigation quota was 201~378 mm during the growth period of cotton under mulch drip irrigation, the corresponding water consumption was 366.6~568 mm, which was in accord with the results of Yan et al., who implied that the water demand of cotton during the whole growth period under mulch drip irrigation in southern Xinjiang was 543.2 mm, and the corresponding water consumption was 441.2~624.5 mm when the drip irrigation quota was 262~427 mm [46]. Additional research showed that both the flowering stage and boll stage were the key water demand periods for cotton growth and development; the small “average daily water consumption intensity” and “water consumption modulus” are not conducive to the formation of cotton bolls, and may result in a decrease in cotton production [17]. This study showed that the daily water consumption intensity was 2.47~5.84 mm∙d−1 from late bud stage to boll stage, and that the water consumption modulus reached 56.40~69.66%. The results of the present study were similar to the results of Wang et al., who carried out field experiments in southern Xinjiang and found that the water consumption modulus of cotton at flowering and boll stage reached 60.4~61.8%, and that the water consumption modulus of cotton at bud stage was about 16.2~18.5% [47]. These ranges are conducive to achieving high cotton yield by maintaining a suitable water consumption modulus during the critical water demand period of cotton. The present study implied that the water consumption modulus for the T2 treatment was higher than that of other treatments in the critical period of cotton; from the perspective of the proper water consumption modulus, the suitable soil water lower limit for cotton in southern Xinjiang is 75% FC.

4.2. Cotton Yield, Water and Nitrogen Use Efficiency

Studies have shown that the decrease in boll density was the main factor that resulted in a decrease in cotton yield [36]. Additionally, decreases in the effective number of bolls per plant and the average boll weight also resulted in a decrease in cotton yield to a certain extent [34]. Cai et al. reported that long-term water deficits would result in metabolic disorders in cotton plants and a reduced growth rate, which had negative impacts on the economic yield of cotton [48]. However, the fiber yield from sufficient irrigation usually did not reach the maximum value [49,50]. The present study indicated that increases in the irrigation quota were conducive to improving cotton lint, harvest density and average boll weight; however, when the soil moisture lower limit exceeded 85% FC, the number of effective bolls per plant declined. Moreover, the WUE and IWUE increased with the decrease in soil water lower limit, while the cotton yield and PFPN decreased. Although the WUE and IWUE for the T5 treatment were higher than the respective values for the other treatments, the effective boll number per plant and boll weight with the T5 treatment decreased, thus reducing the cotton yield with the T5 treatment significantly. Compared with the T1 treatment, the cotton yield with the T2 treatment decreased only by 1.2%; however, the corresponding IWUE and WUE increased by 11.82% and 10.28%, respectively.

4.3. Fiber Quality

With the improvement in people’s living standards, the quality of cotton has attracted more and more attention. Generally, with water-saving irrigation for cotton, considerable declines occurred in fiber length, the fiber uniformity index and the textile consistency index, while the short fiber index increased accordingly [51,52]. This study indicated that the cotton fiber length, length uniformity index, and textile consistency index decreased, while the short fiber index increased when the soil water lower limit was too high or too low. That may be due to the fact that when the soil water lower limit exceeded the critical value, over-irrigation may lead to more immature bolls and result in reduced fiber quality correspondingly [53]. When the soil water lower limit was lower than the critical value, the crops suffered from severe drought and the plants could not grow normally; thus, the cotton quality declined. The micronaire value usually serves as a comprehensive index that is used for representing the fineness and maturity of cotton fiber [54], and the greater the fiber elongation, the less the cotton rigidity. A lower irrigation quota for cotton tends to result in a higher micronaire value and lower fiber elongation [55,56,57]. Similar results have been indicated in this study; with the decrease in the soil water lower limit, the higher the cotton maturity index, the greater the cotton micronaire value, and the smaller the fiber elongation. Basal H. et al. implied that the fiber strength decreased with increases in the soil water deficit [58]. Additionally, this study implied that the fiber strength could be significantly improved by appropriately reducing the soil water lower limit, which was similar to the results of Shen, who found that moderate water stress was beneficial to improve cotton fiber strength [21]. Moreover, Witt et al. believed that cotton had lower fiber strength at the highest irrigation rate [53].

4.4. Soil Salt Accumulation

The soil salt distribution and spatiotemporal migration process can be influenced by mulched drip irrigation effectively during the cotton growth period [59]. Wang et al. found that soil salt accumulated in the 0~40 cm soil layer and desalinated in the 80~100 cm layer in the vertical direction during the non-irrigation period, while in the irrigation period, soil salt desalinated in the 0~20 cm layer and accumulated in the 40~100 cm layer; however, total soil salt in the 0~100 cm layer remained unchanged [60]. The results of Zhang et al. showed that at the end of the cotton growth period, soil salt accumulated between the plastic films, and the soil salt content between the films was 1.24~2.34 times greater than that below the drip irrigation belt [61]. This study indicated that the soil salt accumulated both inside and outside the membrane with each treatment at the end of the cotton growth period. Influenced by the horizontal migration of soil salt inside the film and the evaporation from topsoil outside the film, the soil salt accumulation rate outside the membrane in the 0~100 cm soil layer was 0.72~1.82 times more than that inside the membrane. With the influence of topsoil evaporation, the soil salt accumulation rate in the 0~60 cm soil layer was 3.01~21.21 times more than that in the 60~100 cm layer. Li et al. indicated that with an increase in the irrigation lower limit under mulch drip irrigation with saline water, the soil moisture in the designed wetting layer increased and more soil salt migrated outside the film, whereas the crop yield decreased with a decrease in the irrigation lower limit [62]. However, an excessively small irrigation quota was not conducive to soil salt leaching. The present study indicated that, after harvest, the irrigation model for the T2 and T4 treatments could ensure that the soil remained under low salt condition. In order to maintain the regional water and salt balance and the sustainable planting of cotton, it is necessary to apply supplementary irrigation with a large quota of fresh water during the non-growth period of cotton to leach the accumulated soil salt.

5. Conclusions

With the increase in the soil water lower limit, both the irrigation frequency and irrigation quota increased and the cotton yield increased, while the WUE and IWUE decreased. The cotton yield reached as high as 7146 kg∙hm−2 when the soil water lower limit was set at 75% FC. In particular, cotton fiber quality was influenced significantly by soil moisture regulation, and the lower the soil water lower limit, the greater the micronaire value, the higher the maturity index, and the less the fiber elongation. Moreover, appropriate reduction of the soil water lower limit (decreased from 85% FC to 75% FC) was conducive to an increase in the fiber length and textile consistency index and an improvement in fiber strength. After cotton harvest, soil salt accumulated inside and outside the film for all treatments, especially inside the film, where the soil salt accumulation rate was about 0.87~1.82 times higher than that outside the mulch, while the soil salt accumulation rate in the 0~60 cm layer was 3~21.21 times higher than that in the 60~100 cm layer. Based on a comprehensive analysis by the entropy TOPSIS method, the proper soil water lower limit for cotton mulched drip irrigation during the growth period was 75% FC, and the corresponding irrigation quota was 334 mm.

Author Contributions

Conceptualization, P.H. and S.Y.; methodology, F.Z.; software, P.H.; validation, T.M., J.D. and K.C.; formal analysis, X.C.; investigation, Y.D.; resources, P.H.; data curation, P.H.; writing—original draft preparation, P.H.; writing—review and editing, P.H.; visualization, S.Y.; supervision, F.Z.; project administration, P.H.; funding acquisition, S.Y. All authors have read and agreed to the published version of the manuscript.

Funding

This research was funded by the National Natural Science Foundation of China (NSFC), grant number 51879074 and 52109051; the Natural Science Foundation of Jiangsu Province, grant number BK20200513; and the Water Science and Technology Foundation of Jiangsu Province under grant numbers 2020047 and 2020048.

Institutional Review Board Statement

Not applicable.

Informed Consent Statement

Not applicable.

Data Availability Statement

Data is contained within the article.

Acknowledgments

We are grateful for the help and technical support of Fan Junliang, Hou Xianghao and Zhang Yingchun in the implementation of the experiment.

Conflicts of Interest

The authors declare no conflict of interest.

References

  1. Pan, W.; Yang, D.G.; Yang, L.; Xiao, Y.Q.; Wang, G.G.; Tang, H. Spatio-temporal dynamics and optimal development scale of cotton industry in Xinjiang. Chin. J. Eco-Agric. 2011, 19, 415–420, (In Chinese with English abstract). [Google Scholar] [CrossRef]
  2. Li, M.; Du, Y.; Zhang, F.C.; Fan, J.L.; Ning, Y.; Cheng, H.L.; Xiao, C. Modification of CSM-CROPGRO-Cotton model for simulating cotton growth and yield under various deficit irrigation strategies. Comput. Electron. Agric. 2020, 179, 105843. [Google Scholar] [CrossRef]
  3. Xiao, C.; Li, M.; Fan, J.L.; Zhang, F.C.; Li, Y.; Cheng, H.L.; Li, Y.P.; Hou, X.H.; Chen, J.Q. Salt leaching with brackish water during growing season improves cotton growth and productivity, water use efficiency and soil sustainability in southern Xinjiang. Water 2021, 13, 2602. [Google Scholar] [CrossRef]
  4. Hou, X.H.; Xiang, Y.Z.; Fan, J.L.; Zhang, F.C.; Hu, W.H.; Yan, F.L.; Guo, J.J.; Xiao, C.; Li, Y.P.; Cheng, H.L.; et al. Evaluation of cotton N nutrition status based on critical N dilution curve, N uptake and residual under different drip fertigation regimes in Southern Xinjiang of China. Agric. Water Manag. 2021, 256, 107134. [Google Scholar] [CrossRef]
  5. Mane, R.B.; Tumbare, A.D.; Surve, U.S. Drip fertigation and crop management in Bt cotton (Gossypium hirsutum). Indian J. Agron. 2019, 63, 350–356. [Google Scholar]
  6. Che, Z.; Wang, J.; Li, J.S. Effects of water quality, irrigation amount and nitrogen applied on soil salinity and cotton production under mulched drip irrigation in arid Northwest China. Agric. Water Manag. 2021, 247, 106738. [Google Scholar] [CrossRef]
  7. Li, N.N.; Ma, H.; Wang, X.Y.; Li, J.H.; Han, H.Y.; Luo, H.H. Effects of drip irrigation quota on plant shape, yield and fiber quality of cotton. Agric. Res. Arid Areas 2019, 37, 16–21, (In Chinese with English abstract). [Google Scholar]
  8. Cui, Y.S.; Wang, F.; Sun, J.S.; Han, Q.S.; Wang, J.L.; Li, N. Effects of irrigation regimes on the variation of soil water and salt and yield of mechanically harvested cotton in Southern Xinjiang, China. Chin. J. Appl. Ecol. 2018, 29, 3634–3642, (In Chinese with English abstract). [Google Scholar]
  9. Doorenbos, J.; Kassam, A.H. Yield response to water. Irrig. Drain. Pap. 1979, 33, 257. [Google Scholar]
  10. Fares, A.; Alva, A.K. Evaluation of capacitance probes for optimal irrigation of citrus through soil moisture monitoring in an entisol profile. Irrig. Sci. 2000, 19, 57–64. [Google Scholar] [CrossRef]
  11. Gheysarl, M.; Sadeghi, S.H.; Loescher, H.W.; Amiri, S.; Mohammad, J.Z.; Majidi, M.M.; Asgarinia, P.; Payero, J.O. Comparison of deficit irrigation management strategies on root, plant growth and biomass productivity of silage maize. Agric. Water Manag. 2017, 182, 126–138. [Google Scholar] [CrossRef] [Green Version]
  12. Campbell, G.S.; Campbell, M.D. Irrigation scheduling using soil moisture measurements: Theory and practice. Adv. Irrig. 1982, 1, 25–42. [Google Scholar]
  13. Hanson, B.R.; Orloff, S.; Peters, D. Monitoring soil moisture helps refine irrigation management. Calif. Agric. 2000, 54, 38–42. [Google Scholar] [CrossRef] [Green Version]
  14. Zhao, Q.S.; Li, P.P.; Wang, J.Z.; Gao, B. Effects of irrigation threshold on growth and physiological characteristics of cucumber plug seedlings. Trans. CSAE 2011, 27, 31–35, (In Chinese with English abstract). [Google Scholar]
  15. Wang, H.Y.; Li, G.Y. Effect of Drip Irrigation Model and Irrigation Start Pointon Water Consumption and Yield of Sweet Melon. Trans. CSAE 2010, 41, 47–51, (In Chinese with English abstract). [Google Scholar]
  16. Wu, X.B.; Bai, M.j.; Li, Y.N.; Du, T.S.; Zhang, S.H.; Shi, Y.; Liu, Y.N. The Effect of Fertigation on Cabbage (Brassica oleracea L. var. capitata) Grown in a Greenhouse. Water 2020, 12, 1076. [Google Scholar] [CrossRef]
  17. Chen, K.L.; Zhao, J.H.; Fu, Q.P.; Ma, Y.J.; Wang, Z.R. The effects of different water and nitrogen treatments on the growth, yield and water consumption characteristics of winter wheat. Agric. Res. Arid Areas 2018, 36, 125–132, (In Chinese with English abstract). [Google Scholar]
  18. Ma, S.C.; Zhang, W.Q.; Duan, A.W.; Wang, T.C. Effects of controlling soil moisture regime based on root-sourced signal characteristics on yield formation and water use efficiency of winter wheat. Agric. Water Manag. 2019, 221, 486–492. [Google Scholar] [CrossRef]
  19. Greaves, G.E.; Wang, Y.M. Effect of regulated deficit irrigation scheduling on water use of corn in southern Taiwan tropical environment. Agric. Water Manag. 2017, 188, 115–125. [Google Scholar] [CrossRef]
  20. Pei, D.; Zhang, X.Y.; Kang, R. Effects of water deficit on cotton growth, physiology and yield. Eco-Agric. Res. 2000, 8, 54–57, (In Chinese with English abstract). [Google Scholar]
  21. Shen, X.J.; Zhang, J.Y.; Sun, J.S.; Li, M.S.; Wang, J.L.; Liu, H. Effect of drip irrigation pattern and irrigation lower limit on yield and quality of cotton. J. Drain. Irrig. Mach. Eng. 2014, 32, 711–718, (In Chinese with English abstract). [Google Scholar]
  22. Pan, J.J.; Fu, Q.P.; Abudoukayimu, A.; Ma, Y.J. Effects of irrigation limits at bud stage and flowering stage on yield of drip irrigation cotton. Agric. Res. Arid Areas 2019, 37, 27–32, (In Chinese with English abstract). [Google Scholar]
  23. Yuan, Y.X.; Zhang, F.C.; Zhang, Y.; Suo, Y.S. Effects of irrigation threshold and fertilization on growth‚ yield and physiological properties of fertigated tomato in greenhouse. Agric. Res. Arid Areas 2013, 31, 76–83, (In Chinese with English abstract). [Google Scholar]
  24. Li, B.; Bao, Z.R.; Yao, M.Z.; Li, C.X.; Sun, X.L. Effects of irrigation lower limit and straw returning amount on yield, quality and water use efficiency of greenhouse tomato. Chin. J. Appl. Ecol. 2020, 31, 493–500, (In Chinese with English abstract). [Google Scholar]
  25. Zhang, Y.X.; Zhang, F.C.; Zou, H.Y.; Chen, D.F. Effects of soil water regulation in growing period on spring wheat growth and water use in Hexi areas under drip irrigation. Agric. Res. Arid Areas 2017, 35, 171–177, (In Chinese with English abstract). [Google Scholar]
  26. Wang, J.W.; Niu, W.Q.; Zhang, M.Z.; Li, Y. Response of muskmelon growth to film covering, drip pipes density and irrigation lower limits in greenhouse. Trans. CSAE 2016, 32, 117–125, (In Chinese with English abstract). [Google Scholar] [CrossRef]
  27. Yilmaz, E.; Gürbüz, T.; Dadelen, N.; Wzorek, M. Impacts of different irrigation water levels on the yield, water use efficiency, and fiber quality properties of cotton (gossypium hirsutum l.) irrigated by drip systems. Euro-Mediterr. J. Environ. Integr. 2021, 6, 1–7. [Google Scholar] [CrossRef]
  28. Yang, H.L.; Zhang, D.W.; Zhang, D.Y.; Bozorov, T.A.; Abdullaev, A.A.; Wood, A.J.; Wang, J.C.; Li, X.S.; Zhao, J.Y. Overexpression of ALDH21 from Syntrichia caninervis Moss in Upland Cotton Enhances Fiber Quality, Boll Component Traits, and Physiological Parameters during Deficit Irrigation. Crop Sci. 2019, 59, 553–564. [Google Scholar] [CrossRef] [Green Version]
  29. Lascano, R.J.; Baumhardt, R.L.; Goebel, T.S.; Baker, J.T.; Dennis, C.G. Irrigation termination thermal time and amount on cotton lint yield and fiber quality. Open J. Soil Sci. 2017, 7, 216–234. [Google Scholar] [CrossRef] [Green Version]
  30. Zhang, D.Y.; Li, J.N.; Niu, X.; Deng, C.Y.; Song, X.H.; Li, W.X.; Cheng, Z.M.; Xu, Q.A.; Zhang, B.H.; Guo, W.Z. GhANN1 modulates the salinity tolerance by regulating ABA biosynthesis, ion homeostasis and phenylpropanoid pathway in cotton. Environ. Exp. Bot. 2021, 185, 104427. [Google Scholar] [CrossRef]
  31. Li, B.Q.; Tian, Q.; Wang, X.W.; Han, B.; Liu, L.; Kong, X.H.; Si, A.J.; Wang, J.; Lin, Z.X.; Zhang, X.L.; et al. Phenotypic plasticity and genetic variation of cotton yield and its related traits under water-limited conditions. Crop J. 2020, 8, 966–976. [Google Scholar] [CrossRef]
  32. Wang, P.P.; He, S.P.; Sun, G.F.; Pan, Z.E.; Sun, J.L.; Geng, X.L.; Peng, Z.; Gong, W.F.; Wang, L.R.; Pang, B.Y.; et al. Favorable pleiotropic loci for fiber yield and quality in upland cotton (Gossypium hirsutum). Sci. Rep. 2021, 11, 1–12. [Google Scholar] [CrossRef] [PubMed]
  33. Liu, H.; Gao, Y.; Sun, J.S.; Wu, X.L.; Jha, S.K.; Zhang, H.; Gong, X.W.; Li, Y. Responses of yield, water use efficiency and quality of short-season cotton to irrigation management: Interactive effects of irrigation methods and deficit irrigation. Irrig. Sci. 2017, 35, 125–139. [Google Scholar] [CrossRef]
  34. Wang, R.; Ji, S.; Zhang, P.; Meng, Y.L.; Wang, Y.H.; Chen, B.L.; Zhou, Z.G. Drought Effects on Cotton Yield and Fiber Quality on Different Fruiting Branches. Crop Sci. 2016, 56, 1265–1276. [Google Scholar] [CrossRef]
  35. Bilalis, D.; Patsiali, S.; Karkanis, A.; Konstantas, A.; Makris, M.; Efthimiadou, A. Effects of cultural system (organic and conventional) on growth and fiber quality of two cotton (Gossypium hirsutum L.) varieties. Renew. Agric. Food Syst. 2010, 25, 228–235. [Google Scholar] [CrossRef]
  36. Hu, W.; Snider, J.L.; Wang, H.M.; Zhou, Z.G.; Chastain, D.R.; Whitaker, J.; Perry, C.D.; Bourland, F.M. Water-induced variation in yield and quality can be explained by altered yield component contributions in field-grown cotton. Field Crop. Res. 2018, 224, 139–147. [Google Scholar] [CrossRef]
  37. Zhou, H.F.; Ma, J.L. Studies on water-salt dynamics and balance of cotton crops land in tarim irrigation region. J. Irrig. Drain. 2005, 24, 10–14, (In Chinese with English abstract). [Google Scholar]
  38. Liu, X.Y.; Tian, C.Y.; Ma, Y.J.; Liu, H.P. Water consumption characteristics and scheduling of drip irrigation under plastic film for cotton in south Xinjiang. Agric. Res. Arid Areas. 2016, 24, 108–113, (In Chinese with English abstract). [Google Scholar]
  39. Wang, J.; Xiao, J.; Wang, J. Selection of optimal irrigation parameters under mulch drip irrigation of cotton in arid inland river irrigation area of Xinjiang. Water Resour. Res. 2008, 29, 26–28, (In Chinese with English abstract). [Google Scholar]
  40. Bai, M.; Lu, T.B.; Xu, Q.; Wang, D.W.; Wang, Z.L.; Niu, J.R. Effect of Water Regulation on Water and Salt Movement in Machine Cotton. Southwest China J. Agric. Sci. 2020, 33, 842–847, (In Chinese with English abstract). [Google Scholar]
  41. Luo, Y.; Mao, Y.; Peng, S.; Zheng, Q.; Wang, W.; Jiao, X.; Feng, Y. Modified Aver’yanov’s phreatic evaporation equations under crop growing. Trans. CSAE 2013, 29, 102–109, (In Chinese with English abstract). [Google Scholar]
  42. Tan, S.; Wang, Q.J.; Xu, D.; Zhang, J.H.; Shan, Y.Y. Evaluating effects of four controlling methods in bare strips on soil temperature, water, and salt accumulation under film-mulched drip irrigation. Field Crops Res. 2017, 214, 350–358. [Google Scholar] [CrossRef]
  43. Wang, G.S.; Shi, H.B.; Li, X.Y.; Guo, J.W.; Wang, W.G.; Wu, D. Estimation of salt transport and relationship with groundwater depth in different land types in Hetao Irrigation Area. Trans. CSAE 2020, 51, 255–269, (In Chinese with English abstract). [Google Scholar]
  44. Zou, H.Y.; Fan, J.L.; Zhang, F.C.; Xiang, Y.Z.; Wu, L.F.; Yan, S.C. Optimization of drip irrigation and fertilization regimes for high grain yield, crop water productivity and economic benefits of spring maize in Northwest China. Agric. Water Manag. 2020, 230, 105986. [Google Scholar] [CrossRef]
  45. He, P.R.; Zhang, F.C.; Fang, J.L.; Hou, X.H.; Liu, X.; Zhang, Y.C.; Xue, Z.Q. Effects of soil moisture regulation on growth quality and water use of cotton under drip irrigation in southern Xinjiang. Agric. Res. Arid Areas 2020, 38, 39–46, (In Chinese with English abstract). [Google Scholar]
  46. Yan, Y.Y. Cotton water requirements and water saving benefit under mulched drip irrigation in tarim irrigated area. Res. Soil Water Conserv. 2016, 23, 123–127, (In Chinese with English abstract). [Google Scholar] [CrossRef]
  47. Wang, L.; Guo, R.S.; Wumaierjiang, K.; Tian, L.; Tian, L.W.; Lin, T.; Zheng, Z.P.; Xu, H.J.; Kong, F.Y.; Cui, J.P. Effects of subsoiling depth on water use efficiency and yield of cotton field under drip irrigation in south Xinjiang, China. Trans. CSAE 2020, 36, 144–152, (In Chinese with English abstract). [Google Scholar] [CrossRef]
  48. Cai, H.J.; Shao, G.C.; Zhang, Z.H. Water demand and irrigation scheduling of drip irrigation for cotton under plastic mulch. J. Hydraul. Eng. 2002, 33, 119–123, (In Chinese with English abstract). [Google Scholar]
  49. Schaefer, C.R.; Ritchie, G.L.; Bordovsky, J.P.; Lewis, K.; Kelly, B. Irrigation timing and rate affect cotton boll distribution and fiber quality. Agron. J. 2018, 110, 922–931. [Google Scholar] [CrossRef] [Green Version]
  50. Thorp, K.R.; Thompson, A.L.; Bronson, K.F. Irrigation rate and timing effects on Arizona cotton yield, water productivity, and fiber quality. Agric. Water Manag. 2020, 234, 106146. [Google Scholar] [CrossRef]
  51. Zhang, D.M.; Luo, Z.; Liu, S.H.; Li, W.J.; Dong, H.Z. Effects of deficit irrigation and plant density on the growth, yield and fiber quality of irrigated cotton. Field Crops Res. 2016, 197, 1–9. [Google Scholar] [CrossRef]
  52. Masasi, B.; Taghvaeian, S.; Boman, R.; Datta, S. Impacts of irrigation termination date on cotton yield and irrigation requirement. Agriculture 2019, 9, 39. [Google Scholar] [CrossRef] [Green Version]
  53. Witt, T.W.; Ulloa, M.; Schwartz, R.C.; Ritchie, G.L. Response to deficit irrigation of morphological, yield and fiber quality traits of upland (Gossypium hirsutum L.) and Pima (G. barbadense L.) cotton in the Texas High Plains. Field Crops Res. 2020, 249, 107759. [Google Scholar] [CrossRef]
  54. China Fiber Inspection Bureau. Report of Chinese Cotton Quality Analysis in 2017/2018. China Fiber Insp. 2018, 12, 24–31, (In Chinese with English abstract). [Google Scholar] [CrossRef]
  55. Zhou, H.; Peng, L.; Yuan, B.Z.; Zhang, X.L.; Nie, Y.C. Effect of Different Irrigation Norm on Yield and Fiber Quality of Potted Cotton. J. Irrig. Drain. 2012, 31, 91–94, (In Chinese with English abstract). [Google Scholar]
  56. Guan, H.J.; Li, J.S.; Li, Y.F. Effects of drip system uniformity and irrigation amount on cotton yield and quality under arid conditions. Agric. Water Manag. 2013, 124, 37–51. [Google Scholar] [CrossRef]
  57. Wan, H.L.; Liu, P.C.; Liu, L.T.; Zhang, Y.J.; Liu, Y.C.; Bai, Z.Y.; Li, C.D.; Sun, H.C. Effect of moderate drought in the early stage on cotton yield, fiber quality and water use efficiency. Cotton Sci. 2018, 30, 464–472, (In Chinese with English abstract). [Google Scholar]
  58. Basal, H.; Dagdelen, N.; Unay, A.; Yilmaz, E. Effects of deficit drip irrigation ratios on cotton (Gossypium hirsutum L.) yield and fiber quality. J. Agron. Crop Sci. 2009, 195, 19–29. [Google Scholar] [CrossRef]
  59. Zhang, Y.; Zhu, Y.J.; Yao, B.L. A study on interannual change features of soil salinity of cotton field with drip irrigation under mulch in Southern Xinjiang. PLoS ONE 2020, 15, e0244404. [Google Scholar] [CrossRef]
  60. Wang, Z.L.; Dong, P.G.; Fan, X.K.; Wang, T.R. Effects of irrigation quota on distribution of soil water-salt and yield of spring maize with drip irrigation under mulch. Sci. Agric. Sin. 2016, 49, 2343–2352, (In Chinese with English abstract). [Google Scholar]
  61. Zhang, Z.; Hu, H.C.; Tian, F.Q.; Hu, H.P.; Yao, X.H.; Zhong, R.S. Soil salt distribution under mulched drip irrigation in an arid area of northwestern China. Acad. Press 2014, 104, 23–33. [Google Scholar] [CrossRef]
  62. Li, J.G.; Qu, Z.Y.; Chen, J.; Wang, F.; Jin, Q. Effect of different thresholds of drip irrigation using saline water on soil salt transportation and maize yield. Water 2018, 10, 1855. [Google Scholar] [CrossRef] [Green Version]
Figure 1. Location of the experimental site in Korla, Xinjiang, China.
Agronomy 12 01246 g001
Figure 2. Variation in temperature, rainfall, water surface evaporation and groundwater table.
Agronomy 12 01246 g002
Figure 3. Experimental setup and sampling locations.
Agronomy 12 01246 g003
Figure 4. Variation in soil water content and accumulative irrigation amount for treatments. (a) Variation in soil water content; (b) Accumulative irrigation amount.
Agronomy 12 01246 g004
Figure 5. The yield components and WUE, IWUE and PFPN for treatments. Different letters above the boxes indicate a significant difference at p < 0.05 according to the Duncan test.
Agronomy 12 01246 g005
Figure 6. The cotton fiber quality for treatments. Different letters above the boxes indicate a significant difference at p < 0.05 according to the Duncan test.
Agronomy 12 01246 g006
Figure 7. Soil salt accumulation for treatments in the boll opening stage of cotton. (a) Soil salt accumulation in the film; (b) Soil salt accumulation outside the film; (c) The total soil salt accumulation. Bars are the means + one standard error of the mean (n = 3). Different letters above the error bars indicate a significant difference at p < 0.05 according to the Duncan test.
Agronomy 12 01246 g007
Table 1. Soil physical and chemical properties at the experimental site.
Depth (cm)Soil TextureSoil Mechanical Composition (%)Bulk
Density
(g∙cm−3)
Field Water Capacity (%)Soil Moisture Content (%)Soil
Salinity (g∙kg−1)
NO3-N (mg∙kg−1)NH4-N (mg∙kg−1)
ClaySiltSand
0~10Sandy loam2.0043.5454.461.5932.8715.210.4616.699.58
10~20Silt loam3.3049.3047.411.4432.8615.020.4315.589.44
20~40Silt loam2.8351.1346.051.6327.3519.910.4615.589.39
40~60Sandy loam3.1244.7952.091.5731.2324.700.5311.137.03
60~80Sandy0.0010.1689.841.7020.7420.460.6312.316.99
80~100Sandy0.006.8093.201.6620.5419.480.6312.156.54
Table 2. The daily water consumption intensity and water consumption percentage of cotton.
TreatmentSeedling~Budding
(4/11~6/19)
Budding~Flowering (6/20~7/26)Boll Forming
(7/27~8/22)
Boll Bearing
(8/23~9/17)
Intensity
(mm∙d−1)
Modulus
(%)
Intensity
(mm∙d−1)
Modulus
(%)
Intensity
(mm∙d−1)
Modulus
(%)
Intensity
(mm∙d−1)
Modulus
(%)
T12.0825.315.7837.655.4125.742.4711.30
T21.4619.805.4739.775.6329.892.0610.54
T30.9915.725.8449.563.1119.262.5915.45
T41.2420.812.9526.514.5629.883.6122.79
T51.5529.143.7938.272.4718.172.0314.42
Table 3. Salt accumulation rate in different soil layers inside and outside film for treatments (%).
TreatmentSoil Layers Inside the Film (cm)Soil Layers Outside the Film (cm)Soil Layers (cm)
0~6060~1000~1000~6060~1000~1000~6060~1000~100
T1154.77 b6.89 c87.44 bc174.57 b46.17 a121.55 b161.51 bc18.85 c98.54 b
T2157.66 b10.38 c90.56 b119.27 c21.83 c79.03 c144.47 c13.81 c86.77 c
T3230.36 a61.98 a153.87 a172.69 b23.39 c111.04 b210.49 a50.22 a139.84 a
T496.64 c42.95 b71.94 c138.20 c23.20 c90.71 c110.77 d36.86 b78.03 c
T5149.51 b−2.51 c80.28 bc226.46 a32.80 b146.49 a175.81 b8.29 c101.86 b
Note: different letters following the values mean a significant difference at p < 0.05.
Table 4. Evaluation index layer and indices assignment.
First-Class Index LayerSecond-Class Index LayerIndex NumberIndex TypeTreatment
T1T2T3T4T5
Yield IndexYield (kg∙hm−2)1Positive7233.2 a7146.5 a6577.6 b6127.4 bc5988.4 c
Water and nitrogen indexWUE (kg∙m−3)2Positive1.29 c1.43 b1.54 b1.52 b1.67 a
PFPN (kg∙kg−1)3Positive24.11 a23.82 a21.93 b20.43 bc19.96 c
Salt indexSalt accumulation (g∙m2)4Reverse902.8 b801.53 c1306.1 a732.25 c938.54 b
Quality indexFiber length (mm)5Positive31.65 ab32.69 a31.07 ab31.22 ab30.84 b
Length uniformity index (%)6Positive87.1 b89 a88.8 a88.5 a87.6 b
Breaking strength (cN/tex)7Positive25.3 c27.5 b27.5 b29.6 a27.4 b
Elongation rate (%)8Reverse12.1 a11.6 a10.3 b10.5 b10.5 b
Micronaire9Reverse4.74 b4.74 b4.65 b4.81 ab5 a
Short fiber index (%)10Reverse4 ab3.6 b3.9 ab4.6 a4.1 ab
Maturity index11Reverse0.83 b0.83 b0.84 ab0.84 ab0.85 a
Textile consistency index12Positive137 c153 a150 a154 a141 b
Economic indexEconomic benefit (CNY∙hm−2)13Positive27,242 a26,856 a23,278 b20,257 c19,416 c
Note: Positive type indicates the larger index value is better, while the reverse type indicates the smaller index value is better. Different letters following the values mean a significant difference at p < 0.05.
Table 5. The results of entropy weight by TOPSIS comprehensive analysis.
TreatmentT1T2T3T4T5
Positive ideal solution distance D+0.170.080.160.200.24
Negative ideal solution distance D0.200.250.170.160.11
Relative proximity C0.540.770.520.450.31
Rank21345
Publisher’s Note: MDPI stays neutral with regard to jurisdictional claims in published maps and institutional affiliations.

