Abstract
Dual-use cover crops as forage for livestock could offer ecological and economic benefits when incorporated into rotations with corn (Zea mays L.) and soybean (Glycine max (L.) Merr) in the Mid-South USA; however, information on implementation and impact is limited. A factorial of sixteen cool-season species and a no-cover control by two management systems (forage harvest and residue left in the field) was repeated under two cover crop planting/termination timings: long-season (Oct. through May; corn/cover-crop/soybean) and short-season (Nov. through Apr.; soybean/cover-crop/corn), two locations (Spring Hill and Knoxville, TN), and two growing seasons (2017/2018 and 2018/2019). Data were analyzed using a mixed model ANOVA (SAS 9.4.). The forage biomass did not differ by species within the short-season (415 to 1583 kg ha−1) but did in the long-season (475 to 4282 kg ha−1). Within the long-season, crimson clover (Trifolium incarnatum L.) and winter pea (Pisum sativum subsp. arvense (L.)) had crude protein and acid detergent fiber values within the range for prime forage and were among the highest biomasses. The forage harvest did not negatively affect soil properties or succeeding crop yield and quality. If appropriate species are selected, cover crops within a corn/cover-crop/soybean rotation can provide quality forage, without reducing the short term ecological benefits.
Keywords:
no-tillage; integrated cropping system; soybean; corn; dual-use; biomass; livestock; nutritive value; soil nutrients; nitrogen; oil; protein 1. Introduction
Cover crops provide numerous ecological benefits to row crop production systems, such as reduction of soil erosion [] and nutrient losses [], increased soil moisture retention [], weed suppression [], carbon sequestration, and green manure source for nitrogen (N) and carbon (C) [,]. Many of the most commonly used cover crop species are also prominent forage crops []. This provides an opportunity to integrate row crop production with forage harvest or livestock grazing of winter covers. However, questions remain when implementing this in no-tillage systems in the Mid-South USA, including which cover crop species provide the highest quality and quantity of forage when constrained by the planting/termination timing dictated by accompanying row crops and what economic and ecological impacts harvesting cover crops as forage have on subsequent row crop systems.
Limited research is available that identifies cover crop species that can optimize forage biomass and quality within the planting/termination timing restrictions dictated by a preceding and subsequent row crop in no-tillage systems in the Mid-South. A number of species of cool-season cover crops could fit in this system as seed is typically inexpensive, easily obtainable, and species provide high biomass [,]. Generally, cover crops in the Mid-South fall within three categories: cereals, legumes, and brassicas. Although cereal rye (Secale cereale L.) is one of the most common cereal cover crops, other cereal species, such as wheat (Triticum aestivum L.) and barley (Hordeum vulgare L.), may be of a higher forage nutritive value. Legumes, such as vetches and clovers, generally have a higher forage nutritive value than cereals, fix atmospheric N, and, depending on the species, can produce an adequate amount of biomass []. While crimson clover (Trifolium incarnatum L.) and hairy vetch (Vicia villosa Roth) are some of the most widely used cover crop species, a large number of additional legume species are being evaluated and marketed for use as cover crops [,]. Brassicas produce a taproot and can scavenge N, but vary in winter hardiness []. Although few studies have examined brassica species for adaptation to the Mid-South, turnip (Brassica rapa L.) and canola (B. napus L.) have been used as cover crops in the Midwestern US [], and are likely suited for use in the Mid-South as winters are generally milder.
Forage nutritive values can vary considerably among these species. The prime quality standard of grass or legume hay is characterized by 190 g kg−1 or higher crude protein (CP), 310 g kg−1 or less acid detergent fiber (ADF), and 400 g kg−1 or less neutral detergent fiber (NDF) []. It is possible to produce nutritive values in these ranges from spring grazed or harvested dual-use cover crops. For example, August sown oat (Avena sativa L.) in the northern US produced 180 g kg−1 CP and 521 g kg−1 NDF [,]. September sown rye + oat in the Midwest produced 390 g kg−1 NDF and 837 g kg−1 in vitro neutral digestible fiber (IVNDF) [,]. October sown legumes, such as crimson clover and hairy vetch, in Spain produced averages of 195 g kg−1 CP []. Although information on forage quality is available for a large number of species when grown specifically for forage, less is known about the impacts on quality when grown within the confines of an integrated system.
Interaction among species, environment, and harvest timing can impact the suitability of certain species to dual-use cover crop/forage systems. Harvest timing affects the forage nutritive value due to physiological changes in the plant biomass. As forages mature, fiber increases and protein decreases, resulting in an overall decrease in the forage nutritive value. Iglesias and Lloveras [] found that CP decreased by 44 g kg−1, ADF increased by 46 g kg−1, and in vitro true organic matter digestibility decreased by 49 g kg−1 between April and May cool-season legume harvests. These harvest timings are important to the Mid-South because the two most common crops grown in this area are corn (planted in April) and soybean (planted in May). The cash crop preceding a cover crop can also impact the cover crop planting timing in the fall. In Tennessee, cover crops following corn are typically planted in October, while cover crop succeeding soybeans are generally planted a month or more later. One of the most common rotations in the Mid-South, corn/soybean, can create two very different cover crop growing seasons, depending on the order of the crops. Corn followed by soybean creates a longer cover crop growing season (October to May) compared with soybean followed by corn, which creates a shorter cover crop growing season (November to April).
Furthermore, information is relatively limited regarding impact on the subsequent row crop system when cover crop biomass is removed via grazing or forage harvest. Franzluebbers and Stuedmann [] found that grazing winter cover crops, specifically cereal rye in rotation with no-tillage corn, in the southeastern United States, had no significant effect on soil microbial C and N mineralization, while also exhibiting a positive effect on soil microbial biomass C after three years []. The impact on subsequent row crop yield and quality has been variable, with reports of no impact [,] or yield decreases []. To understand the economic and ecological impacts of dual-use cover crop/forage systems more fully, further quantification of the impacts on soil parameters and row crop yield/quality following a harvested/grazed cover crop are needed.
The objectives of this study were: (1) evaluate the forage yield and nutritive value of sixteen cool season cover crop species and a no-cover control grown under two cover crop planting/termination timings common to corn/soybean and soybean/corn rotations in the Mid-South USA; and, (2) compare row crop yield and quality (oil and protein) and soil nutrients, moisture, pH, and carbon in corn and soybean systems immediately following cover crops managed as a dual-use forage/cover crop system (cover crop residue removed) to those following a standard cover crop system (cover crop residue left in field).
2. Materials and Methods
Materials and methods are described in Bracey []. In summary, plots were established at two University of Tennessee AgResearch and Education Centers: Plant Sciences Unit of the East Tennessee AgResearch and Education Center (ETREC) in Knoxville, TN (35.892495, −83.959613) and the Middle Tennessee AgResearch and Education Center (MTREC) in Spring Hill, TN (35.721164, −86.964894). Soil types differed between locations: Sequatchie loam (fine-loamy, siliceous, semiactive, thermic Humic Hapludult []) at ETREC and Maury silt loam (fine, mixed, active, mesic Typic Paleudalf []) at MTREC. Treatments were arranged in a factorial design with sixteen cover crop species and a no-cover control by two management systems: single-use (cover crop chemically terminated and left as residue before cash crop planting) and dual-use (cover crop residue mechanically harvested then chemically terminated prior to cash crop planting). This was repeated under two different cover crop planting/harvesting times (long-season: early Oct. planting/late April termination; short-season: late Oct. planting/early Apr. termination) and over two years (2017/2018 and 2018/2019; fall planted cover crop followed by succeeding summer cash crop were considered a single year). Species evaluated included wheat, cereal rye, barley, oat, triticale (×Triticosecale Wittmack), crimson clover, arrowleaf clover (Trifolium vesiculosum Savi), berseem clover (T. alexandrinum L.), red clover (T. pratense L.), common vetch (Vicia sativa L.), hairy vetch, woolypod vetch (V. villosa Roth subsp. varia (Host) Corb.), Austrian winter pea, canola, forage radish (Raphanus sativus L.), and purple-top turnip (Brassica rapa L.). Cover crops were planted at rates/depths recommended by the University of Tennessee Extension for forage production [] (Table 1). Whenever possible, named varieties were chosen over “variety not stated” (VNS) and kept consistent across growing seasons.
Table 1.
Cover crops, seeding rates, planting depth, and varieties by year.
Dates of cover crop establishment, harvest, and termination, and cash crop establishment and harvest are noted in Table 2. Although every attempt was made to maintain consistency in planting/termination timing between locations and years, some variation did occur due to weather. Short-season cover crop plots were established in late October of each year. Forage harvest occurred in late March to early April and was followed by chemical termination approximately one week later. Corn was planted in mid-April to early May and harvested in mid-September to early October. Long-season cover crop plots were established in late September to early October. Forage harvest occurred in mid to late April and was followed by chemical termination approximately one week later. Soybeans were planted in early to late May and harvested in late September to late October. Within each cover crop growing season, cover crop species and management treatments were arranged in a randomized complete block design with three replicates. These were repeated at two locations over two years. The summer prior to cover crop establishment, both locations were planted with sorghum-sudangrass (Sorghum × drummondii). In year 2, short-season plots were established over existing long-season plots and vice versa. Plots were planted to the same cover crop species as the previous year but were maintained under the opposite growing season from the previous year. Plots were planted 3.1 m × 9.1 m and chemical termination or mowing was used to trim plots to a final length of 7.5 m at ETREC and 8.2 m at MTREC prior to evaluation.
Table 2.
Plot establishment, forage harvest, and termination dates.
A 0.3 m × 0.3 m PVC square was randomly placed within the plot area. All plant material within that square was sampled at a height of 5 cm. Within each sample, weed and cover crop biomass were separated and bagged. Samples were dried at 55 °C for 72 h and weighed to determine dry cover crop biomass and weed biomass. Collected samples were then ground using a Wiley mill (Thomas Scientific, Swedesboro, NJ, USA) and an Udy cyclone type grinder (Udy One Corporation, Fort Collins, CO, USA) to produce a particle size of 1 mm or less []. Once ground, the samples were dried again, immediately before analysis, to remove any potential residual moisture absorbed during storage and to provide the best spectral analysis []. Samples were analyzed using near infrared spectroscopy (NIRS) with a Foss DS2500F NIRS analyzer (Foss North America, Eden Prairie, MN, USA) to estimate crude protein (CP), acid-detergent fiber (ADF), neutral-detergent fiber (NDF), lignin, ash, fat, calcium (Ca), phosphorus (P), potassium (K), magnesium (Mg), digestible neutral detergent fiber over 48 hrs (dNDF48), and in vitro total dry matter digestibility over 48 hrs (IVTDM48). Samples were scanned by species composition using the 2020 grass hay calibration for cereals, 2020 legume hay calibration for legumes, and the 2020 mixed hay calibration for brassicas. These calibrations were provided by the NIRS Consortium (Berea, KY, USA) with all protocols and recommendations followed to assure accuracy of the reported data []. Total digestible nutrients (TDN) were calculated using the formula TDN = 98.625 − (ADF × 1.048) [].
NIRS nutritive values of CP, ADF, NDF, lignin, and ash were used to derive the following values, according to Woodruff et al. []: percent nitrogen (CP/6.25), carbohydrates (NFC + CP + fat), cellulose (ADF−(lignin + ash)), and hemicellulose (NDF−ADF). These values, along with biomass, were inputted into the University of Georgia (UGA) cover crop nitrogen calculator [] to estimate nitrogen release. The UGA cover crop nitrogen calculator incorporates weather data and biomass constituents into a model to provide an estimate of nitrogen mineralization or immobilization over the course of 12 weeks following cover crop termination. The calculator does not currently include any Tennessee locations. Therefore, the Walker County, Georgia location was selected as the most representative due to its proximity to the trial locations. Additional options selected were “no” for high organic matter soil, and “left on surface” for cover crop residue.
Ten soil samples were taken to a depth of 15 cm from each plot two months after cover crop termination. These samples were sent to Brookside Laboratories (New Brennan, OH, USA) for analysis of WEC (water-extractable organic carbon), WEN (water-extractable organic N), pH, TEC (total exchange capacity), P, K, Mg, Ca, S, Mn, B, Zn, Fe, Al, Cu, and Na [,]. Soil samples were dried and ground, then sieved for <2 mm particles. WEN and WEC were determined using samples weighing 2 g, which were extracted with 20 mL of deionized water and shaken for 10 min. Samples were then filtered through Whatman 2 filter paper and the water extract was analyzed with a Teledyne-Tekmar Torch C:N analyzer (Teledyne-Tekmar, Mason, OH, USA). Samples for macro- and micronutrients were extracted with 40 mL of H3A, shaken for 10 min, then filtered with Whatman 2 filter paper. This extract was also analyzed for NO3, NH4, and PO4 using a FIAlyzer-1000 flow injection analyzer (FIAlab, Seattle, WA, USA). Analysis of P, K, S, Mg, Ca, B, Na, Zn, Fe, Mn, Cu, and Al was conducted using a Thermo Scientific ICP-OES (Thermo Fisher Scientific, Waltham, MA, USA).
Row crops were harvested with a small plot combine, which recorded total plot weight and moisture. Yields were adjusted to kg ha−1 at standard crop moisture content (15.5% for corn and 13% for soybean). Samples weighing approximately 0.45 kg were analyzed for protein and oil using NIRS with a Foss Tecator Infratec 1229 grain analyzer (Foss North America, Eden Prairie, MN, USA) using the manufacturer provided corn (AN 0434, Rev. 6) and soybean (AN 0444, Rev. 7) calibrations.
Data were analyzed using a mixed model analysis of variance with the GLIMMIX procedure in SAS 9.4. To determine statistical significance, a p value of less than 0.05 was used. Assumptions of normality and homogeneity of variance were checked for each independent variable. Data were transformed as necessary to meet the assumptions of normality. Mean separations were performed using Fisher’s Protected LSD. Two statistical models were used in this study. Model one was used to evaluate forage biomass and nutritive values and included species and season as fixed effects, while location, year, and block were considered random effects. This model was selected to provide a broader inference space in which to determine biomass/quality potential of dual-use cover crops across multiple potential environments within the region. Cash crop (corn and soybean) yield, quality, and soils data were analyzed using model two, which includes species, season, harvest, and year as fixed effects, and location and block as random effects. Year was included as a fixed effect in this model so that potential cumulative effects from the number of cover cropping years could be assessed.
3. Results
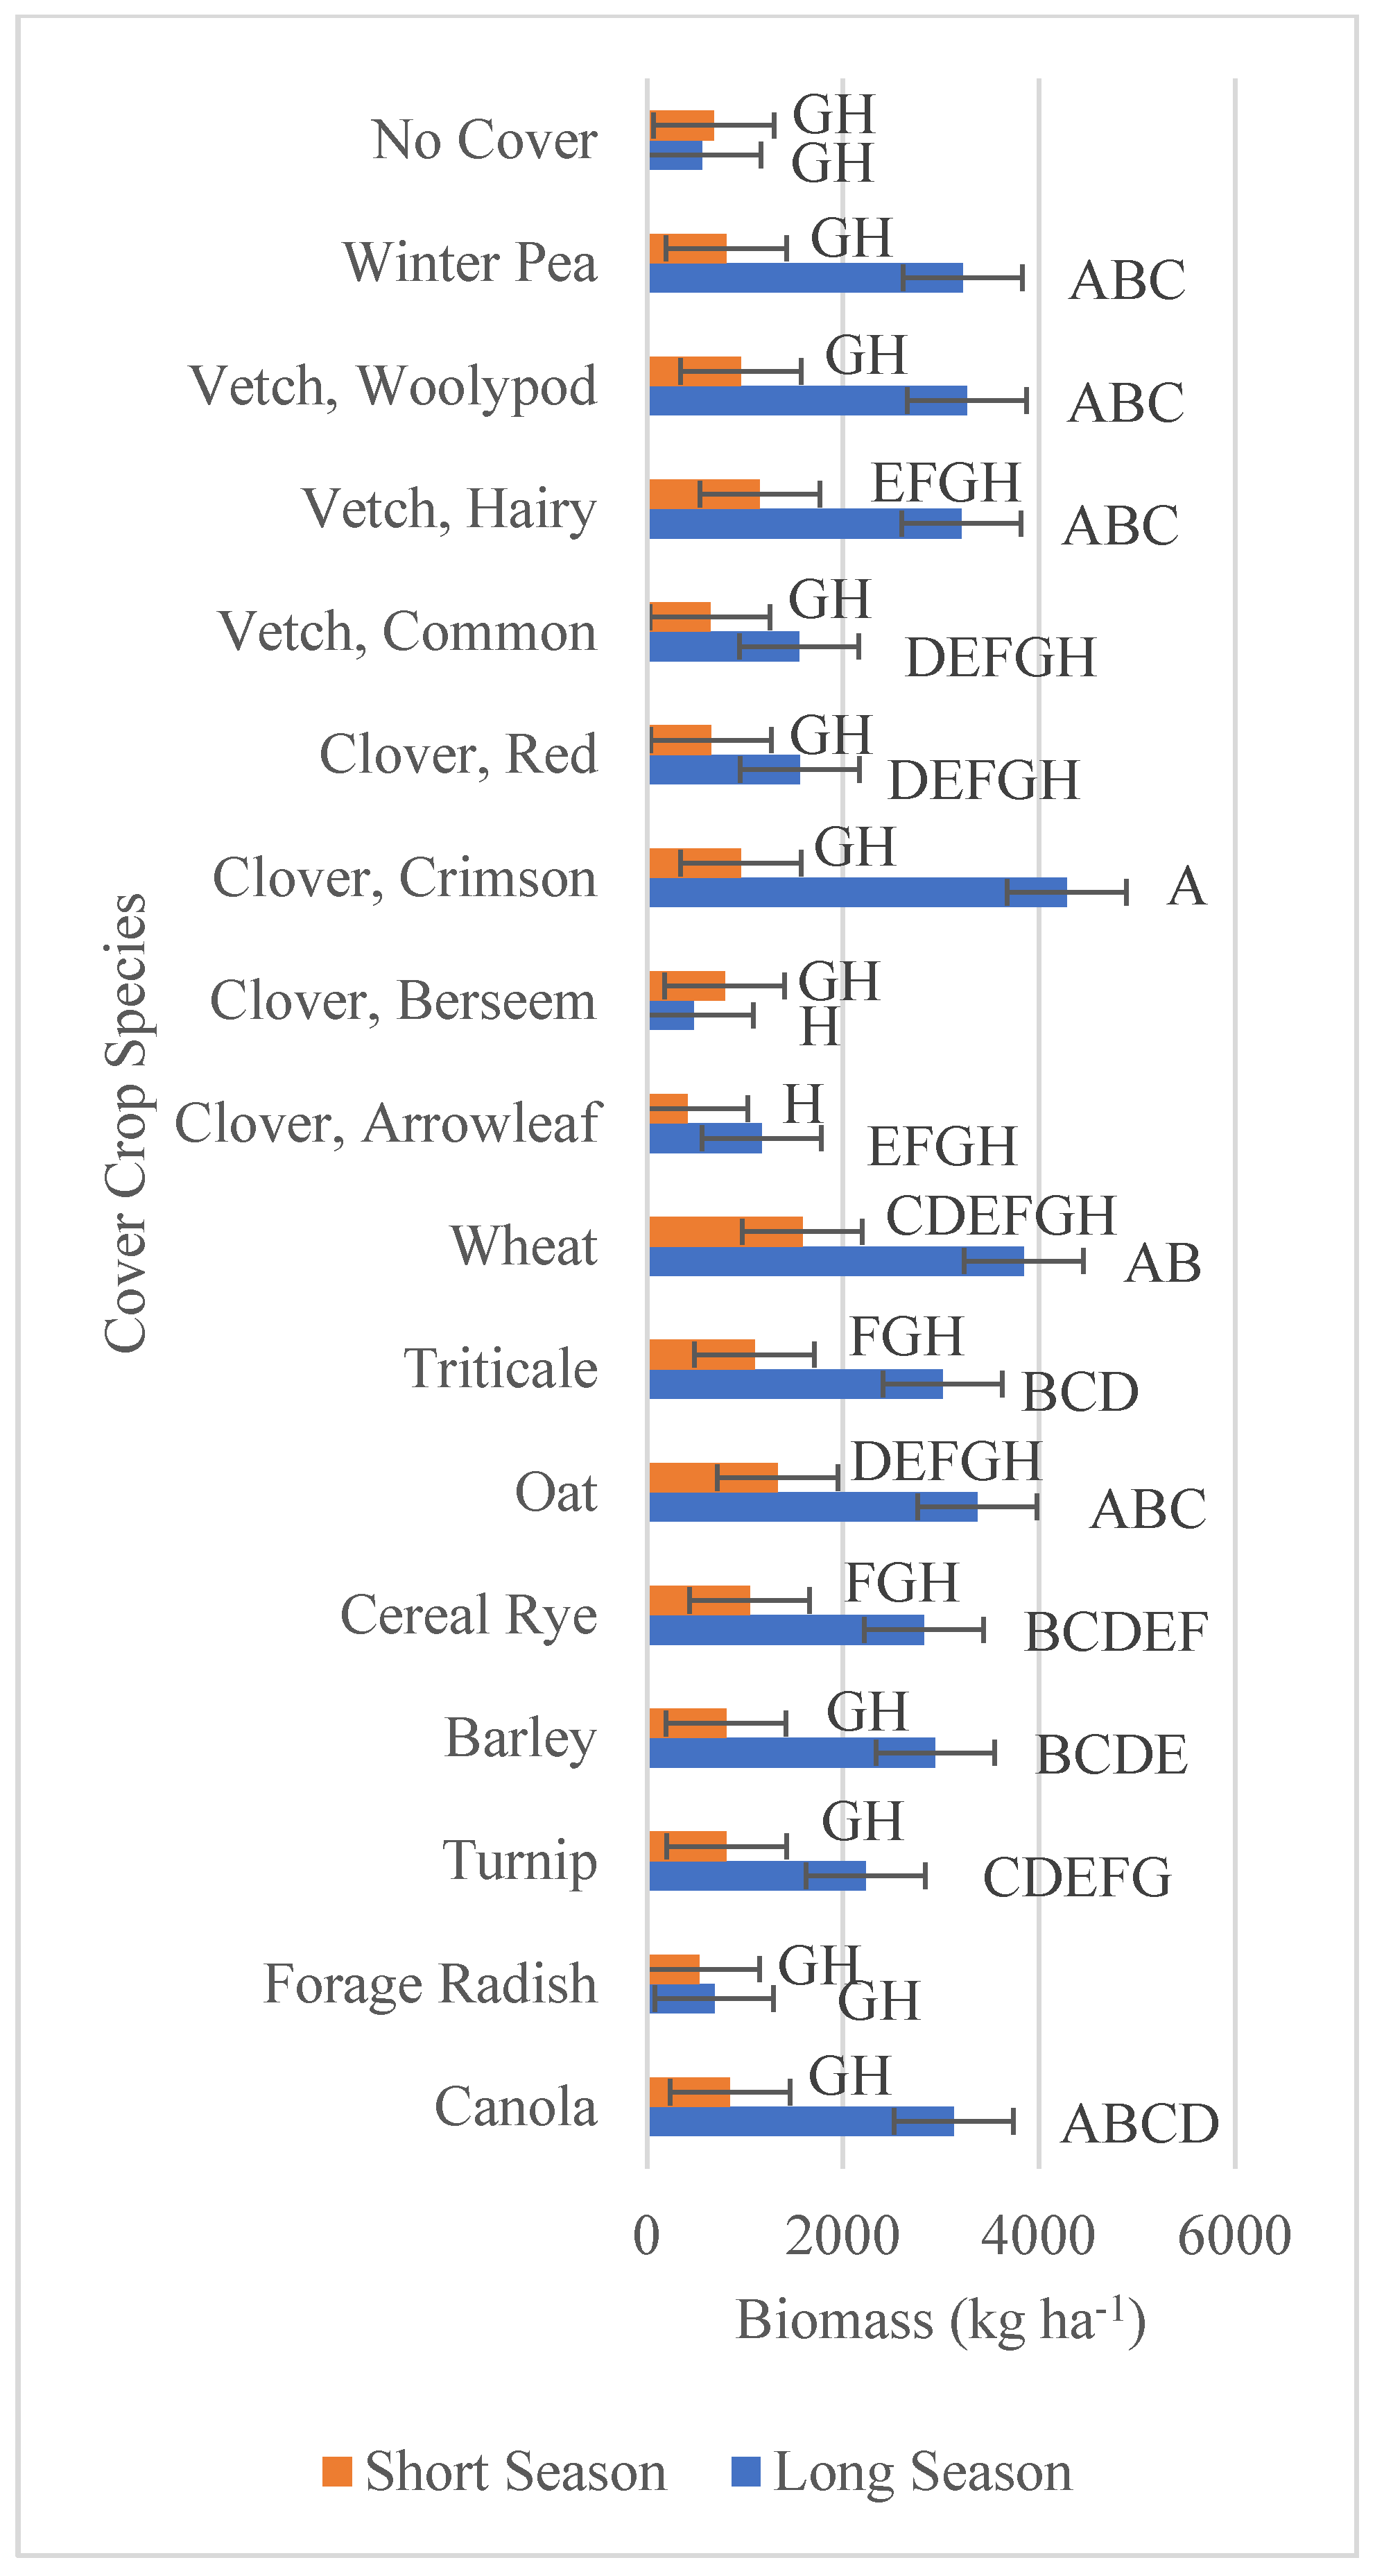
3.1. Forage Biomass and Nutritive Value
Forage biomass exhibited a significant season by species interaction (Table 3). The mean biomass, following the short cover crop growing season, averaged 889 kg ha−1 DM with a range of 415 to 1583 kg ha−1 DM (Figure 1). Within the short cover crop growing season, cover crop biomass did not differ among evaluated species nor did any species differ from the no cover crop control (683 kg ha−1 DM biomass from naturally occurring weeds). The long cover crop growing season averaged 2430 kg ha−1 DM with a range of 475 to 4282 kg ha−1 DM (Figure 1). Within this system, differences were observed among species. Turnip, red clover, common vetch, arrowleaf clover, forage radish, and berseem clover did not differ from the no-cover control (558 kg ha−1 DM biomass); however, the remaining ten species had a higher biomass. The species with the highest biomass included crimson clover, wheat, oat, woolypod vetch, winter pea, hairy vetch, and canola. These species, along with triticale and barley, also had a significantly higher biomass under the long cover crop growing season compared with the short growing season.
Table 3.
Forage biomass and nutritive value variables and their resulting p-values from an ANOVA using model 1, where species and season are fixed effects and location, year, and block are random effects. Dependent variables include concentration of carbon and nitrogen, measured using dry combustion, estimated nitrogen release over 2, 4, and 12 weeks, estimated using the UGA cover crop nitrogen calculator, and concentrations of calcium (Ca), potassium (K), magnesium (Mg), phosphorus (P), crude protein (CP), ash, fat, lignin, acid detergent fiber (ADF), neutral detergent fiber (NDF), digestible neutral detergent fiber over 48 h (dNDF48), in vitro total dry matter digestibility over 48 h (IVTDM48), and total digestible nutrients (TDN), measured using near-infrared spectroscopy. Terms with significant p-values (<0.05) are highlighted in green.
Figure 1.
Mean biomass from cover crops grown under long-season (late Sept./early Oct. through mid/late April) and short-season (late Oct. through late Mar./early Apr.) conditions. Mean separation letters were obtained using Fisher’s Protected LSD. Means followed by the same letter do not differ statistically at p < 0.05. Bars indicate standard errors.
All forage nutritive parameters, except carbon and fat concentrations, exhibited a significant species or species by season interaction effect (Table 3). The parameters influenced by cover crop species alone included the concentration of Ca, Mg, lignin, NDF, dNDF48, and IVTDM48. The quality parameters tended to be similar by group (cereal, legume, and brassica), with some exceptions (Table 4). The brassica and legume species generally had higher Ca (9 to 12 g kg−1), Mg (2 to 3 g kg−1), and lignin (55 to 69 g kg−1) concentrations than cereals (Ca: 4 to 5 g kg−1, Mg: 1 to 2 g kg−1, and lignin: 38 to 45 g kg−1). Exceptions included canola, arrowleaf clover, and berseem clover, which did not differ in Mg concentration from some cereal species. The cereal species generally had higher NDF and dNDF48 concentrations than legumes and brassicas, with the exception of oat. All cereal species and the majority of legume species were statistically not different from the highest IVTDM48 concentration; however, significant variation occurred among all evaluated species. Species that exhibited high Ca, Mg, and IVTDM48 paired with low lignin, NDF, and dNDF48 concentrations included crimson clover, hairy vetch, and woolypod vetch.
Table 4.
Mean concentrations of calcium (Ca), magnesium (Mg), lignin, neutral detergent fiber (NDF), digestible neutral detergent fiber at 48 h (dNDF48), and in vitro total dry matter digestibility at 48 h (IVTDM48), measured using near-infrared spectroscopy of harvested cover crop material, by species across long and short cover crop growing seasons. Mean separation letters were obtained using Fisher’s Protected LSD. Within each column, means followed by the same letter do not differ statistically at p < 0.05.
The majority of the quality parameters exhibited a significant interaction between cover crop growing season and species (Table 3). These included concentrations of N, K, P, ash, crude protein (CP), acid detergent fiber (ADF), and total digestible nutrients (TDN). The performance between the short- and long-season was similar for most species, with a few exceptions (Table 5). Among the brassica species, N, K, and ash concentrations tended to stay the same, while P, CP, and TDN concentrations stayed the same or decreased. Among cereal species, N, K, and P concentrations stayed the same or decreased, while ash, CP, and TDN concentrations remained consistent. Among legume species, N, K, P, ash, CP, and ADF concentrations stayed the same or increased, while TDN concentrations stayed the same or decreased.
Table 5.
Mean concentrations of N, K, and P measured using near-infrared spectroscopy of harvested cover crop material, by cover crop species and growing season (long-season (late Sept./early Oct. through mid/late April) and short-season (late Oct. through late Mar./early Apr.)). Mean separation letters were obtained using Fisher’s Protected LSD. Within each column, means followed by the same letter do not differ statistically at p < 0.05. Within each trait, * indicates species with means that differ significantly between short- and long-season.
Hairy vetch and woolypod vetch were among the highest concentrations for N, P, and K within both the short and long growing season (Table 5). No cereal species were among the highest for N or P concentrations in either season, although short-season oat, triticale, and wheat were among the highest for K concentrations. More species were statistically equivalent for nutrient content within the short-season compared with the long-season.
Within both the short- and long-season, ash and ADF concentrations were lowest in cereal rye, oat, triticale, and wheat (Table 6). Hairy vetch and woolypod vetch had the highest CP concentration within both the short- and long-season, but they were not among the highest concentrations for TDN (Table 7). The reverse was true for cereal rye, oat, triticale, and wheat, which had among the highest TDN concentrations, within both the long- and short-season, but among the lowest CP concentrations.
Table 6.
Mean concentrations of ash and acid detergent fiber (ADF), measured using near-infrared spectroscopy of harvested cover crop material, by cover crop species and growing season (long-season (late Sept./early Oct. through mid/late April) and short-season (late Oct. through late Mar./early Apr.)). Mean separation letters were obtained using Fisher’s Protected LSD. Within each column, means followed by the same letter do not differ statistically at p < 0.05. Within each trait, * indicates species with means that differ significantly between short- and long-season.
Table 7.
Mean crude protein (CP) concentration and total digestible nutrients (TDN) percentage, measured using near-infrared spectroscopy of harvested cover crop material, by cover crop species and growing season (long-season (late Sept./early Oct. through mid/late April) and short-season (late Oct. through late Mar./early Apr.)). Mean separation letters were obtained using Fisher’s Protected LSD. Within each column, means followed by the same letter do not differ statistically at <0.05. Within each trait, * indicates species with means that differ significantly between short- and long-season.
Species that exhibited values within the range of “prime forages” as defined by Ball, Hoveland, and Lacefield [] included crimson clover, hairy vetch, and woolypod vetch, within the short growing season, and red clover within the long growing season (Table 8). Short-season winter pea and long-season hairy vetch, crimson clover, common vetch, and winter pea had CP and ADF values within the preferred range, but they exceeded 400 g kg−1 NDF. Although both short- and long-season cereal species were within the preferred range for ADF, they fell short of the desired ranges for both CP and NDF. Among these species, values for CP and NDF were closer to the desired range in the short-season compared to the long; this therefore indicates that an earlier harvest could potentially result in values that were closer to the ideal range. However, the biomass was significantly reduced under the short growing season, so, while an earlier harvest may have better nutritive value, the reduction in biomass would likely reduce the economic viability of this system for those species. Overall, species that had both high biomass and CP and ADF concentrations within the desired range for prime forage included long-season crimson clover and winter pea.
Table 8.
Mean crude protein (CP), acid detergent fiber (ADF), and neutral detergent fiber (NDF) concentrations of cover crop species grown under long-season (late Sept./early Oct. through mid/late April) and short-season (late Oct. through late Mar./early Apr.). Values highlighted in green meet the criteria for “prime forage” as defined by Ball, Hoveland, and Lacefield [], which are CP > 190 g kg−1, ADF < 310 g kg−1, and NDF < 400 g kg−1.
Nitrogen concentration averaged 23 g kg−1 across species in both the short and long growing season (Table 5). Within the short-season, crimson clover, hairy vetch, woolypod vetch, winter pea, and forage radish had the highest nitrogen concentration, while in the long-season, red clover, hairy vetch, and woolypod vetch were highest. The nitrogen concentration differed significantly between seasons for some species. The nitrogen concentration decreased in oat and increased in common vetch and red clover between the short- and long-season. It was expected that legumes, which reach peak nitrogen concentration immediately prior to flowering, would increase in nitrogen concentration between the short- and long-season, while cereals would decrease as they approached maturity and became more lignified. Although some species followed this general trend, among most species, the change in N concentration was not large enough to be considered significant. This was likely due to differences in maturity among species, paired with the timing of the short- and long-season spring harvest. A longer time between short- and long-season harvest may have resulted in a larger number of species exhibiting differences. However, these results illustrate that, for some species, even a difference of only two weeks can significantly impact nitrogen content.
The estimated nitrogen release over 2, 4, and 12 weeks was higher following the long cover crop growing season for crimson clover, hairy vetch, woolypod vetch, and winter pea (Table 9). This was due to an increase in both biomass and nitrogen content within the cover crop biomass. The estimated nitrogen release was highest at each time point for crimson clover, hairy vetch, and woolypod vetch following a long cover crop growing season, ranging from 24 to 29 kg ha−1 over 2 weeks, 37 to 45 kg ha−1 over 4 weeks, and 50 to 63 kg ha−1 over 12 weeks. Within the short growing season, the estimated nitrogen release did not differ among species, averaging 4, 6, and 9 kg ha−1 over 2 weeks, 4 weeks, and 12 weeks, respectively.
Table 9.
Mean nitrogen release, estimated using the UGA cover crop nitrogen calculator with constituent input values measured using NIRS. Significant species by season interactions were observed; therefore, means are given by species and season, along with overall mean and standard error. Mean separation letters were obtained using Fisher’s Protected LSD. Within each column, means followed by the same letter do not differ statistically at p < 0.05. Within each trait, * indicates species with means that differ significantly between short- and long-season.
3.2. Cash Crop and Soil Attributes
Among the cash crop variables, yield, oil, and protein all differed by season (Table 10 and Table 11). This was expected because long- and short-season cover crops were followed by cash crops of soybean and corn, respectively, which have differing yield potential and quality characteristics. No significant interactions were observed for yield and oil, indicating that cover crop species and harvest did not impact these variables for either succeeding cash crop.
Table 10.
Cash crop and soil variables and their resulting p-values from an ANOVA using model 2, where species, season, harvest, and year are fixed effects, and location and block are random effects. Terms with significant p-values (<0.05) are highlighted in green. Dependent variables include cash crop yield, oil, and protein, and soil moisture, pH, organic matter (OM), and water extractable carbon (WEC).
Table 11.
Mean values for variables that exhibited significant effects by season (cash crop yield, oil, and protein, soil moisture and nitrate-nitrogen (NO3-N) and/or by year (water extractable carbon (WEC), potassium (K), magnesium (Mg), and NO3-N. Overall mean and standard error are also given for each trait. Mean separation values not given as only variables exhibiting significant effects are listed and comparisons are only between two treatments: season (short-season (corn) vs. long-season (soy) or year (2018 vs. 2019).
The protein concentration did exhibit a significant species effect and season by harvest effect. Across both corn and soybean, the protein concentration was lower in cash crops following berseem clover or turnip compared with the no cover crop control (Table 12). None of the evaluated cover crop species increased the cash crop protein concentration compared to the control, although oat, common vetch, and wheat did result in significantly higher protein compared with the cash crops following berseem clover or turnip. This was especially surprising as berseem clover and turnip had a low biomass that did not differ significantly from the no-cover control (Figure 1). Berseem clover has been shown to affect secondary metabolites in cereal rye when cocultivated [], and brassica species, such as turnip, can exhibit allelopathic effects. Although the underlying cause of these changes in protein may warrant greater investigation, changes in protein concentration of 3 g kg−1 or less are unlikely to make a practical impact. The cover crop harvest did not impact protein in the succeeding corn system (Table 13). However, it did have a small but significant impact in the soybean systems, reducing protein by 2 g kg−1 compared to the forage systems. Again, while significant, this magnitude of change in protein is unlikely to have practical implications.
Table 12.
Mean values for variables that exhibited significant effects by season and species, including soil nitrate (NO3-N) and moisture and cash crop protein. Overall mean and standard error are also given for each trait. Mean separation letters were obtained using Fisher’s Protected LSD. Within each trait, means followed by the same letter do not differ statistically at p < 0.05. A significant season by species interaction was not observed; therefore, only a single column of mean separation values are given for each trait.
Table 13.
Mean values for variables that exhibited a significant harvest effect (soil water extractable nitrogen (WEN)), harvest by season interaction (cash crop protein), or harvest by year interaction (soil iron (Fe)). Mean separation letters were obtained using Fisher’s Protected LSD. Within each column, means followed by the same letter do not differ statistically at p < 0.05.
Differences in season were also observed for soil moisture and NO3-N (Table 11 and Table 14). Variation in cash crop structure and nitrogen management between corn and soybean systems likely account for these differences. The soil moisture was slightly higher in the soybean system (12.5%) compared with the corn system (10.5%), with differences likely due to the differences in cash crop canopy closure and water usage rather than the season length of the preceding cover crop. Corn, which is a heavy nitrogen feeder and received applications of synthetic nitrogen, unsurprisingly had higher NO3-N compared with soybean, which did not receive supplemental nitrogen. In addition to the season effects, NO3-N was also impacted by cover crop species (Table 12). It was expected that legumes would have greater NO3-N in the soil, but this was not the case, as species within this group generally did not differ from the no-cover control. However, oat and triticale did show significant reductions in NO3-N compared to the no-cover control, indicating that these species may be immobilizing nitrogen through decomposition compared to other cover crop species. Woolypod vetch, hairy vetch, and winter pea had higher NO3-N compared with all the cereal species. Unlike NO3-N, no discernible trend was observed among groups for water extractable nitrogen (WEN) (Table 15). The no-cover control had the highest WEN, not differing from woolypod vetch, hairy vetch, oat, arrowleaf clover, forage radish, and barley.
Table 14.
Soil variables and their resulting p-values from an ANOVA using model 2, where species, season, harvest, and year are fixed effects, and location and block are random effects. Terms with significant p-values (<0.05) are highlighted in green. Dependent variables include water extractable nitrogen (WEN), nitrate-nitrogen (NO3-N), iron (Fe), potassium (K), magnesium (Mg), and sodium (Na).
Table 15.
Mean values for variables that exhibited significant species effect, including soil water extractable nitrogen (WEN) and soil pH. Mean separation letters were obtained using Fisher’s Protected LSD. Within each trait, means followed by the same letter do not differ statistically at p < 0.05.
The soil pH was also significantly impacted by the cover crop species (Table 10). Although most species did not differ from the no-cover control, berseem clover, crimson clover, and canola did exhibit slightly higher soil pH (5.8 to 5.9) compared with the no-cover control (5.7) (Table 15). Carbon, K, Mg, and NO3-N all exhibited a significant year effect, with lower values in year 2 (Table 10, Table 11 and Table 14). This was unanticipated as cover crops were expected to increase or help to retain soil nutrients and build soil carbon. It is unclear why these values decreased. Iron also decreased between year 1 and 2, but, additionally, exhibited a significant year by harvest interaction (Table 13 and Table 14). In year 1, forage harvested plots had higher iron than non-forage plots, while in year 2, the values did not differ.
A three-way interaction of year by harvest by species was observed for Na (Table 14). In 2018, barley had higher Na (0.030 g kg−1) than crimson clover (0.027 g kg−1) within the forage treatment, while, in the non-forage treatment, the no-cover control (0.030 g kg−1) was higher than turnip (0.026 g kg−1). In 2019, woolypod vetch (0.028 g kg−1) was higher than all the remaining species, while no other species differed from the no-cover control (0.022 g kg−1). In 2019, turnip and forage radish had higher N (0.025 g kg−1) compared with triticale (0.021 g kg−1), woolypod vetch (0.021 g kg−1), and crimson clover (0.021 g kg−1), but no species differed from the no-cover control (0.021 g kg−1).
Four-way interactions of year by season by harvest by species were observed within soil P and OM, indicating the sequence of long-season and short-season influenced treatment effects (Table 14). Within the long/short sequence, berseem clover had higher soil P in the forage treatment (0.104 g kg−1) compared with the non-forage treatments (0.080 g kg−1). Within the forage treatment, berseem clover had higher soil P (0.104 g kg−1) than the no-cover control (0.082 g kg−1). Across the remaining species in both the long/short and short/long sequence, no differences were observed between forage and non-forage treatments by species or between the no-cover control and the cover crop species.
For soil OM, no differences were observed between the long/short sequence, while significant species by harvest interaction was observed with the short/long sequence. The values for soil OM were higher in the forage treatment for cereal rye (2.9 vs. 2.7%), oat (F: 2.9%, NF: 2.7%), and no-cover (F: 2.9%, NF: 2.6%), but lower for canola (F: 2.7%, NF: 2.9%) and crimson clover (F: 2.5%, NF: 2.9%). Within the forage treatment, the no-cover control was among the highest for soil OM (2.9%), exceeding the values for crimson clover, canola, forage radish, woolypod vetch, and arrowleaf clover, which ranged from 2.5 to 2.7%. Within the non-forage treatment, the no-cover control was among the lowest for soil OM (2.6%), lower than barley, red clover, arrowleaf clover, berseem clover, hairy vetch, triticale, winter pea, forage radish, woolypod vetch, canola, and crimson clover, which ranged from 2.7 to 2.9%. The main effects and interactions were not significant for any of the remaining soil variables: Al, B, Ca, Cu, Mn, NH4, S, TEC, and Zn.
4. Discussion
Several cover crop species were identified that provided both high quantity and quality forage. Within the long cover crop growing season, the species that had the highest biomass and met CP and ADF criteria for prime forage [] were crimson clover and winter pea. Canola, oat, wheat, hairy vetch, and woolypod vetch were also among the highest yielding, but only met ADF or CP criteria for prime forage. These top-performing species ranged in biomass from 3130 to 4282 kg ha−1. Previous research by Fae, Sulc, Barker, Dick, Eastridge, and Lorenz [] showed oat + rye and annual ryegrass yields from two grazing harvests to be 4763 kg ha−1 and 3449 kg ha−1, respectively, with an average daily weight gain (ADG) of livestock in the spring of 0.76 to 0.86 kg day−1. Similar ADG could be obtained from the higher yielding cover crops in this study. Cover crop concentrations of Ca, P, K, and Mg were generally higher in the legumes and brassicas; however, the concentrations of these nutrients in all species were adequate to meet the mineral needs of finishing the beef cattle weighing approximately 544 kg []. Although a larger number of cover crop species met the criteria for prime forage within the short growing season, the tradeoff in biomass production may not make that an economically advisable choice. Balancing quantity and quality is an important consideration for producers wishing to implement a dual-use cover crop/forage system, and this balance will vary by cover crop species. Mixtures of top-performing cereal and legume species may help balance quality and quantity under these systems and should be examined in future research.
Although these results identify cover crop species that can maximize biomass/forage production, inferences from these results may be limited by inter-species variation. Most species that were evaluated were not of specified genetic composition (i.e., “variety not stated”), which is how many of the available cover crop species are sold. Using named varieties may have yielded more consistent results, but these were not available at the time. As breeders work to develop adapted varieties within some of these species, more options may become available both across and within species with better adaptation to Mid-South integrated row crop/forage systems. Cover crop variety trials, which were initiated after the start of this study, reinforce the top-species identified in this study, but do indicate significant inter-species variation in both quality and quantity [,].
Cover crop species did impact soil properties in the subsequent cash crop, with differences observed in soil NO3-N, WEN, pH, and soil moisture. Harvesting cover crops for forage also showed slight, but significant, increases in WEN. Differences in soil nitrogen among species were expected due to the differences in nitrogen content and estimated nitrogen release among species. Although differences in soil nitrogen were not as pronounced as those observed in forage nitrogen content and release, this is likely due to the sampling period, which was 2 months after termination. Previous research has shown that the majority of soil nitrogen increases are expected in a period of time between 2 and 6 weeks after termination [,,]. An earlier sampling date would have likely yielded greater differences. Little variation among species was observed in the remaining soil minerals and soil carbon. This was also expected, as previous studies dealing with soil attribute changes after cover crops concluded that changes are generally not observed after short-term use of cover crops [,,]. Changes in WEN from harvesting cover crops as forage were less than 1 mg kg−1, making it unlikely to have practical implications on management. However, these results do raise interesting questions regarding the availability of nitrogen under these species and management systems throughout the growing season and the long-term impacts after multiple cropping seasons. Long-term studies of cover crop species and management systems would be useful in better understanding the true impacts on soil nutrient and the carbon sequestration potential of dual-use cover crop/forage systems.
The cash crop yield exhibited no differences in species, which is consistent with several previous studies [,]. Some research has concluded that the use of cover crops could increase cash crop yield potential by providing additional N to the succeeding cash crop []. Because the cash crops in this study were equally and sufficiently fertilized, any yield benefits from additional N were not seen. Differences in nitrogen release were observed among species and could provide additional economic advantage if credits are used to reduce input costs. Differences in cash crop protein were observed among species and management systems. Although these differences may warrant further investigation, they were of a magnitude that would be unlikely to have practical implications, being 3 g kg−1 or less.
5. Conclusions
Utilizing cover crops as a spring forage before cash crop planting could be beneficial to integrated crop/livestock producers in the Mid-South without causing any detrimental impacts to the succeeding cash crop. The utility of this dual-use system is dependent on selecting species best suited for specific timings dictated by the cash crops with which cover crops are grown in rotation. Statistical differentiation in the biomass of cover crop species was observed under the long-season (corn > cover crop > soybean), whereas this was not true within the short-season (soybean > cover crop > corn). These results indicate better biomass potential for dual-use cover/forage systems, in which cover crops have a longer growing season, typical of that following corn and preceding soybean in the Mid-South USA. High biomass yielding cover crop species tended to increase in biomass with a longer growing season. Within a long growing season, the top cover crop species for both forage quality and quantity were crimson clover and winter pea. Canola, oat, wheat, hairy vetch, and woolypod vetch were also among the highest yielding, but only met either ADF or CP criteria for prime forage and not both. The shorter growing season had a larger number of species that met the criteria for prime forage; however, the reduced amount of biomass from an earlier termination likely would not make that system economically feasible. Harvesting cover crops as a forage did not negatively affect soil properties in the immediately succeeding cash crop. Results from this study indicate that select cover crop species can provide sufficient quantity and quality for forage production without any negative impacts on the succeeding cash crops. Future research that would aid in further refining this system includes the examination of top-performing species in mixes, the assessment of the long-term impacts on soil and cash crop properties, evaluation under grazing, and economic analysis, balancing input costs against expected gains.
Author Contributions
Conceptualization, W.M.B., V.R.S., X.Y., G.E.B., D.M.B. and A.R.W.; data curation, W.M.B., V.R.S. and A.R.W.; formal analysis, W.M.B. and V.R.S.; funding acquisition, V.R.S.; investigation, W.M.B., V.R.S., X.Y., D.W.M. and A.R.W.; methodology, W.M.B., V.R.S., X.Y., G.E.B., D.M.B. and A.R.W.; project administration, V.R.S.; resources, V.R.S., X.Y., G.E.B. and D.M.B.; supervision, V.R.S.; validation, W.M.B., V.R.S., X.Y., D.M.B. and D.W.M.; visualization, W.M.B. and V.R.S.; writing—original draft, W.M.B. and V.R.S.; writing—review and editing, W.M.B., V.R.S., X.Y., G.E.B., D.M.B., D.W.M. and A.R.W. All authors have read and agreed to the published version of the manuscript.
Funding
This research was funded by the United Soybean Board, grant number 1820-172-0132-A, the Tennessee Soybean Promotion Board, grant number 19-154-P and 20-154-R and the USDA National Institute of Food and Agriculture, hatch project 1017613.
Institutional Review Board Statement
Not applicable.
Informed Consent Statement
Not applicable.
Data Availability Statement
The data presented in this study are available in this article.
Acknowledgments
Alexandra Wilson and Francisco Palacios.
Conflicts of Interest
The authors declare no conflict of interest. The funders had no role in the design of the study; in the collection, analyses, or interpretation of data; in the writing of the manuscript, or in the decision to publish the results.
References
- Kaspar, T.C.; Bakker, M.G. Biomass production of 12 winter cereal cover crop cultivars and their effect on subsequent no-till corn yield. J. Soil Water Conserv. 2015, 70, 353–364. [Google Scholar] [CrossRef]
- Fraser, P.M.; Curtin, D.; Harrison-Kirk, T.; Meenken, E.D.; Beare, M.H.; Tabley, F.; Gillespie, R.N.; Franics, G.S. Winter nitrate leaching under different tillage and winter cover crop management practices. Soil Sci. Soc. Am. J. 2013, 77, 1391–1401. [Google Scholar] [CrossRef]
- Fageria, N.K.; Baligar, V.C.; Bailey, B.A. Role of cover crops in improving soil and row crop productivity. Commun. Soil Sci. Plant Anal. 2005, 36, 2733–2757. [Google Scholar] [CrossRef]
- Baraibar, B.; Hunter, M.C.; Schipanski, M.E.; Hamilton, A.; Mortensen, D.A. Weed suppression in cover crop monocultures and mixtures. Weed Sci. 2018, 66, 121–133. [Google Scholar] [CrossRef]
- Snapp, S.S.; Swinton, S.M.; Labarta, R.; Mutch, D.; Black, J.R.; Leep, R.; Nyiraneza, J.; O’Neil, K. Evaluating cover crops for benefits, costs and performance within cropping system niches of crop and impact of foregoing a cash crop, some farmers express Michigan and New York producers are experimenting. Agron. J. 2005, 97, 322–332. [Google Scholar] [CrossRef]
- Schipanski, M.E.; Barbercheck, M.; Douglas, M.R.; Finney, D.M.; Haider, K.; Kaye, J.P.; Kermaniam, A.R.; Mortensen, D.A.; Ryan, M.R.; Tooker, J.; et al. A framework for evaluating ecosystem services provided by cover crops in agroecosystems. Agric. Syst. 2014, 125, 12–22. [Google Scholar] [CrossRef]
- Hansen, M.J.; Owens, V.N.; Beck, D.; Sexton, P. Suitability of cover crop monocultures for late-season forage in South Dakota. Can. J. Plant Sci. 2013, 93, 589–597. [Google Scholar] [CrossRef]
- Appelgate, S.R.; Lenssen, A.W.; Wiedenhoeft, M.H.; Kaspar, T.C. Cover crop options and mixes for upper midwest corn–soybean systems. Agron. J. 2017, 109, 968–984. [Google Scholar] [CrossRef] [Green Version]
- Ketterings, Q.M.; Swink, S.N.; Duiker, S.W.; Czymmek, K.J.; Beegle, D.B.; Cox, W.J. Integrating cover crops for nitrogen management in corn systems on Northeastern U.S. dairies. Agron. J. 2015, 107, 1365–1376. [Google Scholar] [CrossRef] [Green Version]
- Sykes, V.R.; Wilson, A.; Bates, G.; McIntosh, D.; McClure, A.; Raper, T.; Blair, R.; Walker, F. Cover Crop Variety Tests in Tennessee 2020. In UT Ext. W953; University of Tennessee: Knoxville, TN, USA, 2020; Available online: https://search.utcrops.com/wp-content/uploads/2020/09/2020-TN-Cover-Crop-Variety-Test-FINAL-REPORT.pdf (accessed on 30 March 2022).
- Sykes, V.R.; Wilson, A.; Palacios, F.; Keadle, S.B.; Bates, G.; McIntosh, D. Cover Crop Variety Tests in Tennessee 2021. In UT Ext. W 1022; University of Tennessee: Knoxville, TN, USA, 2021; Available online: https://search.utcrops.com/wp-content/uploads/2021/09/W_1022_Cover_Crop_Variety_Tests_in_TN_2021.pdf (accessed on 30 March 2022).
- Gieske, M.F.; Ackroyd, V.J.; Baas, D.G.; Mutch, D.R.; Wyse, D.; Durgan, B.R. Brassica cover crop effects on nitrogen availability and oat and corn yield. Agron. J. 2016, 108, 151–161. [Google Scholar] [CrossRef]
- Ball, D.M.; Hoveland, C.S.; Lacefield, G.D. Southern Forages Modern Concepts for Forage Crop Management, 5th ed.; International Plant Nutrition Institute: Peachtree Corners, GA, USA, 2015. [Google Scholar]
- Contreras-Govea, F.E.; Albrecht, K.A. Forage production and nutritive value of oat in autumn and early summer. Crop Sci. 2006, 46, 2382–2386. [Google Scholar] [CrossRef]
- Sulc, R.M.; Franzlubber, A.J. Exploring integrated crop-livestock systems in different ecoregions of the United States. Eur. J. Agron. 2014, 57, 21–30. [Google Scholar] [CrossRef]
- Fae, G.S.; Sulc, R.M.; Barker, D.J.; Dick, R.P.; Eastridge, M.L.; Lorenz, N. Integrating winter annual forages into a no-till corn silage system. Agron. J. 2009, 101, 1286–1296. [Google Scholar] [CrossRef]
- Iglesias, I.; Lloveras, J. Annual cool-season legumes for forage production in mild winter areas. Grass Forage Sci. 1998, 53, 318–325. [Google Scholar] [CrossRef]
- Franzluebbers, A.J.; Stuedmann, J.A. Does grazing of cover crops impact biologically active soil carbon and nitrogen fractions under inversion or no tillage management? Soil Water Conserv. 2015, 70, 365–373. [Google Scholar] [CrossRef] [Green Version]
- Reddy, K.N. Effects of cereal and legume cover crop residues on weeds, yield, and net return in soybean (Glycine max). Weed Technol. 2001, 15, 660–668. [Google Scholar] [CrossRef]
- Ruffo, M.L.; Bullock, D.G.; Bollero, G.A. Soybean yield as affected by biomass and nitrogen uptake of cereal rye in winter cover crop rotations. Agron. J. 2004, 96, 800–805. [Google Scholar] [CrossRef]
- Franzluebbers, A.J.; Stuedmann, J.A. Crop and cattle responses to tillage systems for integrated crop-livestock production in the Southern Piedmont, USA. Renew. Agric. Food Syst. 2006, 22, 168–180. [Google Scholar] [CrossRef] [Green Version]
- Bracey, W. Evaluating Cool-Season Annual Species as Cover Crops and Dual-Use Forage Cover Crops in No-Till Tennessee Production Systems. University of Tennessee: Knoxville, TN, USA, 2020; Available online: https://trace.tennessee.edu/cgi/viewcontent.cgi?article=7174&context=utk_gradthes (accessed on 30 March 2022).
- Staff, S.S. Soil Taxonomy: A Basic System of Soil Classification for Making and Interpreting Soil Surveys, 2nd ed.; Natural Resources Conservation Service; U.S. Government Printing Office: Washington, DC, USA, 1999.
- Bates, G.; Harper, C.; McClure, A.; Raper, T.; Sykes, V.R. Forage and Field Crop Seeding Guide for Tennessee. In UT Ext. PB 378; University of Tennessee: Knoxville, TN, USA, 2016; Available online: https://extension.tennessee.edu/publications/Documents/pb378.pdf (accessed on 30 March 2022).
- McIntosh, D.; Anderson-Husmoen, B.J.; Kern-Lunbery, R.; Goldblatt, P.; Lemus, R.; Griggs, T.; Bauman, L.; Boone, S.; Shewmaker, G.; Teutsch, C. Guidelines for Optimal Use of NIRSC Forage and Feed Calibrations in Membership Laboratories, 2nd ed.; The University of Tennessee Press: Knoxville, TN, USA, 2022. [Google Scholar]
- National Academies of Sciences, Engineering, and Medicine. Nutrient Requirements of Beef Cattle, 8th ed.; The National Academies Press: Washington, DC, USA, 2016. [Google Scholar]
- Woodruff, L.K.; Hitchcock, R.; Sonon, L.; Saha, U.; Kissel, D.E.; Gaskin, J.; Romano, N.; Cabrera, M.L.; Habteselassie, M.Y.; Vigil, M.; et al. A web-based model of N mineralization from cover crop residue decomposition. Soil Sci. Soc. Am. J. 2018, 82, 983–993. [Google Scholar] [CrossRef]
- Gaskin, J.; Cabrera, M.; Kissel, D. Predicting Nitrogen Release from Cover Crops: The Cover Crop Nitrogen Availability Calculator. In UGA Ext. Bulletin 1466; University of Georgia: Athens, GA, USA, 2016; Available online: http://aesl.ces.uga.edu/publications/soil/B1466.pdf (accessed on 30 March 2022).
- Haney, R.; Brinton, W.; Evans, E. Soil CO2 respiration: Comparison of chemical titration, CO2 IRGA analysis and the Solvita gel system. Renew. Agric. Food Syst. 2008, 23, 171–176. [Google Scholar] [CrossRef] [Green Version]
- Haney, R.; Haney, E.B.; Smith, D.R.; Harmel, R.D.; White, M.J. The soil health tool—Theory and initial broad-scale application. Appl. Soil Ecol. 2018, 125, 162–168. [Google Scholar] [CrossRef]
- Rakoczy-Trojanowska, M.; Swiecicka, M.; Bakera, B.; Kowalczyk, M.; Stochmal, A.; Bolibok, L. Cocultivating rye with berseem clover affects benzoxazinoid production and expression of related genes. Crop Sci. 2020, 60, 3228–3246. [Google Scholar] [CrossRef]
- Gill, W.; Lane, C.; Neel, J.; Fisher, A.; Bates, G.; Joines, D. Mineral Nutrition of Beef Cattle. In UT Ext. PB 1749; University of Tennessee: Knoxville, TN, USA, 2004; Available online: https://trace.tennessee.edu/cgi/viewcontent.cgi?article=1003&context=utk_agexani (accessed on 30 March 2022).
- Wyland, L.J.; Jackson, L.; Chaney, W.E.; Klonsky, K.; Koike, S.T.; Kimple, B. Winter cover crops in a vegetable cropping system: Impacts on yield, nitrate leaching, pests and management costs. Agric. Ecosyst. Environ. 1996, 59, 1–17. [Google Scholar] [CrossRef]
- Hu, S.; Grunwald, N.J.; Van Bruggen, A.H.C.; Gamble, G.R.; Drinkwater, L.E.; Shennan, C.; Demment, M.W. Short-term effects of cover crop incorporation on soil carbon pools and nitrogen availability. Soil Sci. Soc. Am. J. 1997, 61, 901–911. [Google Scholar] [CrossRef]
- Parr, M.; Grossman, J.M.; Reberg-Horton, S.C.; Brinton, C.; Crozier, C. Roller-crimper termination for legume cover crops in North Carolina: Impacts on nutrient availability to a succeeding corn crop. Commun. Soil Sci. Plant Anal. 2014, 45, 1106–1119. [Google Scholar] [CrossRef]
- Richter, D.D.B.; Hofmockel, M.; Callaham, M.A.; Powlson, D.S.; Smith, P. Long-term soil experiments: Keys to managing Earth’s rapidly chancing ecosystems. Soil Sci. Soc. Am. J. 2007, 71, 266–279. [Google Scholar] [CrossRef]
- Boyer, C.N.; Lambert, D.M.; Larson, J.A.; Tyler, D.D. Investment analysis of cover crop and no-tillage systems on Tennessee cotton. Agron. J. 2018, 1, 331–338. [Google Scholar] [CrossRef]
Publisher’s Note: MDPI stays neutral with regard to jurisdictional claims in published maps and institutional affiliations. |
© 2022 by the authors. Licensee MDPI, Basel, Switzerland. This article is an open access article distributed under the terms and conditions of the Creative Commons Attribution (CC BY) license (https://creativecommons.org/licenses/by/4.0/).