
Can Olive Pruning Forms Influence the Olive Rhizosphere? The Root Microbiota and the Rhizosphere Properties in the Alto Ricaurte (Colombia)

 ,
,  ,
, 
Abstract
1. Introduction
2. Materials and Methods
2.1. Experimental Area and Plant Material
2.2. Experiment Design
2.3. Soil Sampling
2.4. Physical and Chemical Soil Properties
2.5. Mycorrhizal Fungal Spore Counting, Nitrogen-Fixing, Cellulolytic, Phosphate Solubilizers Microorganisms, and Enzymatic Activity
2.6. Data Analysis
3. Results
3.1. Physical and Chemical Soil Properties
3.2. Mycorrhizal Fungal Spore Counting, Nitrogen-Fixing, Cellulolytic, Phosphate Solubilizers Microorganisms, and Enzymatic Activity
4. Discussion
5. Conclusions
Supplementary Materials
Author Contributions
Funding
Institutional Review Board Statement
Informed Consent Statement
Data Availability Statement
Acknowledgments
Conflicts of Interest
References
- García-Molano, J.F. Acercamiento a la olivicultura en Boyacá. Cult. Sci. 2010, 8, 8–14. [Google Scholar]
- Ruiz, S.L.M.; Carvajal, R.D.C.; García, J.F.; Almanza-Merchán, P.J. Producción de Aceitunas y Aceite de Oliva en el Clima de la Región del Alto Ricaurte en Boyaca, Colombia. Rev. Colomb. Cienc. Hortic. 2019, 13, e9202. [Google Scholar] [CrossRef]
- López-Bernal, Á.; García-Tejera, O.; Testi, L.; Villalobos, F.J. Genotypic variability in radial resistance to water flow in olive roots and its response to temperature variations. Tree Physiol. 2020, 40, 445–453. [Google Scholar] [CrossRef] [PubMed]
- García-Molano, J.F.; Cheverría-González, E.Y. Comportamiento fenológico del olivo (Olea europaea L.) en el Alto Ricaurte (Boyacá). Rev. Logos Cienc. Tecnol. 2014, 6, 1–13. [Google Scholar] [CrossRef]
- Haberman, A.; Bakhshian, O.; Cerezo-Medina, S.; Paltiel, J.; Adler, C.; Ben-Ari, G.; Mercado, J.A.; Pliego-Alfaro, F.; Lavee, S.; Samach, A. A possible role for flowering locus T-encoding genes in interpreting environmental and internal cues affecting olive (Olea europaea L.) flower induction. Plant Cell Environ. 2017, 40, 1263–1280. [Google Scholar] [CrossRef]
- Rosati, A.; Marchionni, D.; Mantovani, D.; Ponti, L.; Famiani, F. Intercepted Photosynthetically Active Radiation (PAR) and spatial and temporal distribution of transmitted PAR under high-density and super high-density olive orchards. Agriculture 2021, 11, 351. [Google Scholar] [CrossRef]
- Gómez-Del-Campo, M.; Trentacoste, E.R.; Connor, D.J. Long-term effects of row spacing on radiation interception, fruit characteristics and production of hedgerow olive orchard (cv. Arbequina). Sci. Hortic. 2020, 272, 109583. [Google Scholar] [CrossRef]
- Erel, R.; Yermiyahu, U.; Yasuor, H.; Cohen Chamus, D.; Schwartz, A.; Ben-Gal, A.; Dag, A. Phosphorous nutritional level, carbohydrate reserves and flower quality in olives. PLoS ONE 2016, 11, e0167591. [Google Scholar] [CrossRef]
- Chatzistathis, T.; Monokrousos, N.; Psoma, P.; Tziachris, P.; Metaxa, I.; Strikos, G.; Papadopoulos, F.H.; Papadopoulos, A.H. How fully productive olive trees (Olea europaea L., cv. “Chondrolia Chalkidikis”) manage to over-satisfy their P nutritional needs under low Olsen P availability in soils? Sci. Hortic. 2020, 265, 109251. [Google Scholar] [CrossRef]
- Christopoulou, N.; Chatzistathis, T.; Papatheodorou, E.M.; Aschonitis, V.; Monokrousos, N. The crucial role of soil organic matter in satisfying the phosphorus requirements of olive trees (Olea europaea L.). Agriculture 2021, 11, 111. [Google Scholar] [CrossRef]
- Dabbaghi, O.; Oden, S.; Willems, T.; Attia, F.; Hammami, M.; Prinsen, E.; Mechri, B. Foliar application of bio-fertilizers influenced the endogenous concentrations of phytohormones and amino acids in leaves and roots of olive trees (Olea europaea L. cv. Chemlali). Afr. J. Agric. Res. 2018, 13, 1777–1786. [Google Scholar] [CrossRef][Green Version]
- Aneed, N.; Al-Isaw, M.; Mohammed, A.; Al-Janabi, I. Effect of foliar application with kinetin and amino acids in the vegetative growth and chemical content of young olive trees cv. “K18.” Ann. Rom. Soc. Cell Biol. 2021, 25, 10067–10076. [Google Scholar]
- El-Tanany, M.M.; Shaimaa, A.M. Effect of foliar application of cytokinin, active dry yeast and potassium on fruit size, yield, fruit quality and leaf mineral composition of Valencia orange trees. Egypt. J. Hortic. 2016, 43, 389–414. [Google Scholar] [CrossRef]
- Dastkar, E.; Soleimani, A.; Jafary, H.; de Dios Alche, J.; Bahari, A.; Zeinalabedini, M.; Salami, S.A. Differential expression of genes in olive leaves and buds of ON- versus OFF-crop trees. Sci. Rep. 2020, 10, 15762. [Google Scholar] [CrossRef] [PubMed]
- Fichtner, E.J.; Chao, Y.Y.; Ferguson, L.; Verreynne, J.S.; Tang, L.; Lovatt, C.J. Repeating cycles of ON and OFF yields in alternate bearing olive, pistachio and citrus trees—Different mechanisms, common solutions. Acta Hortic. 2021, 1315, 1–10. [Google Scholar] [CrossRef]
- Fichtner, E.J.; Lovatt, C.J. Alternate bearing in olive. In Proceedings of the VIII International Olive Symposium, Split, Croatia, 30 April 2018; pp. 2281–2297. [Google Scholar]
- Motisi, N.; Ribeyre, F.; Poggi, S. Coffee tree architecture and its interactions with microclimates drive the dynamics of coffee berry disease in coffee trees. Sci. Rep. 2019, 9, 2544. [Google Scholar] [CrossRef]
- Jiménez-Brenes, F.M.; López-Granados, F.; De Castro, A.I.; Torres-Sánchez, J.; Serrano, N.; Peña, J.M. Quantifying pruning impacts on olive tree architecture and annual canopy growth by using UAV-based 3D modelling. Plant Methods 2017, 13, 55. [Google Scholar] [CrossRef]
- Miranda-Fuentes, A.; Llorens, J.; Gamarra-Diezma, J.L.; Gil-Ribes, J.A.; Gil Moya, E. Towards an optimized method of olive tree crown volume measurement. Sensors 2015, 15, 3671–3687. [Google Scholar] [CrossRef]
- Albarracín, V.; Hall, A.J.; Searles, P.S.; Rousseaux, M.C. Responses of vegetative growth and fruit yield to winter and summer mechanical pruning in olive trees. Sci. Hortic. 2017, 225, 185–194. [Google Scholar] [CrossRef]
- Lodolini, E.M.; Polverigiani, S.; Paolasini, F.; Evangelista, G.; Tarragoni, A.; Neri, D. Effect of root pruning on vegetative-reproductive balance of young olive trees. In Proceedings of the X International Symposium on Modelling in Fruit Research and Orchard Management, Montpellier, France, 10 May 2017; pp. 113–118. [Google Scholar]
- Assirelli, A.; Romano, E.; Bisaglia, C.; Lodolini, E.M.; Neri, D.; Brambilla, M. Canopy index evaluation for precision management in an intensive olive orchard. Sustainability 2021, 13, 8266. [Google Scholar] [CrossRef]
- Contreras, R.L.G.; Duarte, R.M.; Carvajal, A.L.; Contreras, F.R.; Ramirez, F.N. Effect of rejuvenation pruning on the vegetative growth and productivity in olive under hot and arid environment of Mexico. Asian J. Agric. Hortic. Res. 2020, 6, 46–52. [Google Scholar] [CrossRef]
- Martín-Rodríguez, J.A.; Huertas, R.; Ho-Plágaro, T.; Ocampo, J.A.; Turečková, V.; Tarkowská, D.; Ludwig-Müller, J.; García-Garrido, J.M. Gibberellin–abscisic acid balances during arbuscular mycorrhiza formation in tomato. Front. Plant Sci. 2016, 7, 1273. [Google Scholar] [CrossRef] [PubMed]
- Liao, D.; Wang, S.; Cui, M.; Liu, J.; Chen, A.; Xu, G. Phytohormones regulate the development of arbuscular mycorrhizal symbiosis. Int. J. Mol. Sci. 2018, 19, 3146. [Google Scholar] [CrossRef] [PubMed]
- Abu-Elsaoud, A.M.; Nafady, N.A.; Abdel-Azeem, A.M. Arbuscular mycorrhizal strategy for zinc mycoremediation and diminished translocation to shoots and grains in wheat. PLoS ONE 2017, 12, e0188220. [Google Scholar] [CrossRef] [PubMed]
- Tedersoo, L.; Bahram, M. Mycorrhizal types differ in ecophysiology and alter plant nutrition and soil processes. Biol. Rev. 2019, 94, 1857–1880. [Google Scholar] [CrossRef]
- van der Heijden, M.G.A.; Dombrowski, N.; Schlaeppi, K. Continuum of root–fungal symbioses for plant nutrition. Proc. Natl. Acad. Sci. USA 2017, 114, 11574–11576. [Google Scholar] [CrossRef]
- Begum, N.; Qin, C.; Ahanger, M.A.; Raza, S.; Khan, M.I.; Ashraf, M.; Ahmed, N.; Zhang, L. Role of arbuscular mycorrhizal fungi in plant growth regulation: Implications in abiotic stress tolerance. Front. Plant Sci. 2019, 10, 1068. [Google Scholar] [CrossRef]
- Boutaj, H.; Chakhchar, A.; Meddich, A.; Wahbi, S.; El Alaoui-Talibi, Z.; Douira, A.; Filali-Maltouf, A.; El Modafar, C. Bioprotection of olive tree from Verticillium wilt by autochthonous endomycorrhizal fungi. J. Plant Dis. Prot. 2020, 127, 349–357. [Google Scholar] [CrossRef]
- Boutaj, H.; Chakhchar, A.; Meddich, A.; Wahbi, S.; El Alaoui-Talibi, Z.; Douira, A.; Filali-Maltouf, A.; El Modafar, C. Mycorrhizal autochthonous consortium induced defense-related mechanisms of olive trees against Verticillium dahliae. J. Plant Dis. Prot. 2020, 128, 225–237. [Google Scholar] [CrossRef]
- Hao, Z.; Xie, W.; Chen, B. Arbuscular mycorrhizal symbiosis affects plant immunity to viral infection and accumulation. Viruses 2019, 11, 534. [Google Scholar] [CrossRef]
- Dara, S.K. Non-entomopathogenic roles of entomopathogenic fungi in promoting plant health and growth. Insects 2019, 10, 277. [Google Scholar] [CrossRef]
- Mohanty, S.P.; Hughes, D.P.; Salathé, M. Using deep learning for image-based plant disease detection. Front. Plant Sci. 2016, 7, 1419. [Google Scholar] [CrossRef]
- Soudzilovskaia, N.A.; Douma, J.C.; Akhmetzhanova, A.A.; van Bodegom, P.M.; Cornwell, W.K.; Moens, E.J.; Treseder, K.K.; Tibbett, M.; Wang, Y.P.; Cornelissen, J.H.C. Global patterns of plant root colonization intensity by mycorrhizal fungi explained by climate and soil chemistry. Glob. Ecol. Biogeogr. 2015, 24, 371–382. [Google Scholar] [CrossRef]
- Lehmann, J.; Kleber, M. The contentious nature of soil organic matter. Nature 2015, 528, 60–68. [Google Scholar] [CrossRef]
- Tisdall, J. Formation of soil aggregates and accumulation of soil organic matter. In Structure and Organic Matter Storage in Agricultural Soils; CRC Press: Boca Raton, FL, USA, 2020; pp. 57–96. [Google Scholar]
- Parton, W.J.; Ojima, D.S.; Schimel, D.S. Models to evaluate soil organic matter storage and dynamics. In Structure and Organic Matter Storage in Agricultural Soils; CRC Press: Boca Raton, FL, USA, 2020; pp. 421–448. [Google Scholar]
- Ameloot, N.; Sleutel, S.; Das, K.C.; Kanagaratnam, J.; de Neve, S. Biochar amendment to soils with contrasting organic matter level: Effects on N mineralization and biological soil properties. GCB Bioenergy 2013, 7, 135–144. [Google Scholar] [CrossRef]
- Marzi, M.; Shahbazi, K.; Kharazi, N.; Rezaei, M. The influence of organic amendment source on carbon and nitrogen mineralization in different soils. J. Soil Sci. Plant Nutr. 2020, 20, 177–191. [Google Scholar] [CrossRef]
- Oldfield, E.E.; Wood, S.A.; Bradford, M.A. Direct effects of soil organic matter on productivity mirror those observed with organic amendments. Plant Soil 2017, 423, 363–373. [Google Scholar] [CrossRef]
- Caulfield, M.E.; Fonte, S.J.; Tittonell, P.; Vanek, S.J.; Sherwood, S.; Oyarzun, P.; Borja, R.M.; Dumble, S.; Groot, J.C.J. Inter-community and on-farm asymmetric organic matter allocation patterns drive soil fertility gradients in a rural Andean landscape. Land Degrad. Dev. 2020, 31, 2973–2985. [Google Scholar] [CrossRef]
- Lazicki, P.; Geisseler, D.; Lloyd, M. Nitrogen mineralization from organic amendments is variable but predictable. J. Environ. Qual. 2020, 49, 483–495. [Google Scholar] [CrossRef]
- Bello-Álvarez, Ó.F.; García-Molano, J.F.; Cuervo-Bejarano, W.J. Cuantificación de diazótrofos en la rizósfera del olivo (Olea europaea L.) cultivado en Boyacá, Colombia. Acta Agron. 2016, 65, 109–115. [Google Scholar] [CrossRef]
- Beghè, D.; García-Molano, J.F.; Fabbri, A.; Ganino, T. Olive biodiversity in Colombia. A molecular study of local germplasm. Sci. Hortic. 2015, 189, 122–131. [Google Scholar] [CrossRef]
- Bouyoucos, G.J. Hydrometer method improved for making particle size analyses of soils. Agron. J. 1962, 54, 464–465. [Google Scholar] [CrossRef]
- Yoder, R.E. A direct method of aggregate analysis of soils and a study of the physical nature of erosion losses. Agron. J. 1936, 28, 337–351. [Google Scholar] [CrossRef]
- Instituto Geográfico Agustín Codazzi. Métodos Analíticos del Laboratorio de Suelos; República de Colombia Departamento Administrativo Nacional de Estadística: Bogotá, Colombia, 2006. [Google Scholar]
- Munsell, A. Munsell Soil Color Charts; Munsell Color: New Windsor, NY, USA, 1994. [Google Scholar]
- Walkley, A.; Black, I.A. An examination of the Degtjareff method for determining soil organic matter, and a proposed modification of the chromic acid titration method. Soil Sci. 1934, 37, 29–38. [Google Scholar] [CrossRef]
- Sieverding, E. Manual de Métodos de Investigación para la Micorriza Vesículo-Arbuscular en el Laboratorio; Consultative Group on International Agricultural Research (CGIAR): Montpellier, France, 1983. [Google Scholar]
- Posada, R.H.; Sánchez de Prager, M.; Pomar, D.; Castillo, M. Metodologías Básicas para el Trabajo con Micorriza Arbuscular y Hongos Formadores de Micorriza Arbuscular; Posada, R.H., Sánchez de Prager, M., Velásquez Pomar, D., Narváez, M., Eds.; Universidad Nacional de Colombia: Palmira, Colombia, 2010; ISBN 978-958-8095-60-8. [Google Scholar]
- Dobereiner, J.; Day, J. Associative symbiosis and free-living systems. In Proceedings of the 1st International Symposium on Nitrogen Fixation, Pullman, WA, USA, 3–7 June 1974; Washington State University Press: Pullman, WA, USA, 1976; pp. 518–538. [Google Scholar]
- Wood, P.J. Specificity in the interaction of direct dyes with polysaccharides. Carbohydr. Res. 1980, 85, 271–287. [Google Scholar] [CrossRef]
- Osorio, N.W.; Habte, M. Synergistic influence of an arbuscular mycorrhizal fungus and a P solubilizing fungus on growth and P uptake of Leucaena leucocephala in an oxisol. Arid Land Res. Manag. 2001, 15, 263–274. [Google Scholar] [CrossRef]
- Tabatabai, M.A.; Bremner, J.M. Use of P-nitrophenyl phosphate for assay of soil phosphatase activity. Soil Biol. Biochem. 1969, 1, 301–307. [Google Scholar] [CrossRef]
- Miller, G.L. Use of dinitrosalicylic acid reagent for determination of reducing sugar. Anal. Chem. 1959, 31, 426–428. [Google Scholar] [CrossRef]
- Cribari-Neto, F.; Zeileis, A. Beta regression in R. J. Stat. Softw. 2010, 34, 1–24. [Google Scholar] [CrossRef]
- Lenth, R.; Singmann, H.; Love, J.; Buerkner, P.; Herve, M. Emmeans: Estimated Marginal Means, aka Least-Squares Means. 2019. Available online: https://CRAN.R-project.org/package=emmeans (accessed on 14 March 2022).
- Newson, R. Parameters behind “Nonparametric” statistics: Kendall’s tau, Somers’ D and median differences. Stata J. 2002, 2, 45–64. [Google Scholar] [CrossRef]
- RStudio Team. RStudio: Integrated Development Environment for R; RStudio Team: Boston, MA, USA, 2019. [Google Scholar]
- Lê, S.; Josse, J.; Husson, F. FactoMineR: An R package for multivariate analysis. J. Stat. Softw. 2008, 25, 1–18. [Google Scholar] [CrossRef]
- Wickham, H. Ggplot2: Elegant Graphics for Data Analysis; Springer: New York, NY, USA, 2016. [Google Scholar]
- Wei, T.; Simko, V. R Package “Corrplot”: Visualization of a Correlation Matrix; RStudio Team: Boston, MA, USA, 2017. [Google Scholar]
- Venables, W.N.; Ripley, B.D. Modern Applied Statistics with S, 4th ed.; Springer: New York, NY, USA, 2002; ISBN 0-387-95457-0. [Google Scholar]
- Weissgerber, T.L.; Milic, N.M.; Winham, S.J.; Garovic, V.D. Beyond bar and line graphs: Time for a new data presentation paradigm. PLoS Biol. 2015, 13, e1002128. [Google Scholar] [CrossRef]
- Signorell, A.; Aho, K.; Alfons, A.; Anderegg, N.; Aragon, T.; Arachchige, C. DescTools: Tools for Descriptive Statistics; R Package Version 0.99; R Studio Team: Boston, MA, USA, 2019. [Google Scholar]
- Pio, R.; de Souza, F.B.M.; Coelho, V.A.T.; Rodas, C.L.; da Silva, I.P.; de Melo, E.T. Visual symptoms and nutritional deficiencies in olive trees under subjected to nutrient deprivation. Acta Sci. Agron. 2019, 41, 39582. [Google Scholar] [CrossRef]
- Tekaya, M.; El-Gharbi, S.; Mechri, B.; Chehab, H.; Bchir, A.; Chraief, I.; Ayachi, M.; Boujnah, D.; Attia, F.; Hammami, M. Improving performance of olive trees by the enhancement of key physiological parameters of olive leaves in response to foliar fertilization. Acta Physiol. Plant. 2016, 38, 101. [Google Scholar] [CrossRef]
- Zipori, I.; Erel, R.; Yermiyahu, U.; Ben-Gal, A.; Dag, A. Sustainable management of olive orchard nutrition: A review. Agriculture 2020, 10, 11. [Google Scholar] [CrossRef]
- Erel, R.; Yermiyhu, Y.; Ben-Gal, A.; Dag, A. Olive fertilization under intensive cultivation management. Acta Hortic. 2018, 1217, 207–224. [Google Scholar] [CrossRef]
- Tejada, M.; Benítez, C. Effects of different organic wastes on soil biochemical properties and yield in an olive grove. Appl. Soil Ecol. 2020, 146, 103371. [Google Scholar] [CrossRef]
- Alcaras, L.M.A.; Rousseaux, M.C.; Searles, P.S. Responses of several soil and plant indicators to post-harvest regulated deficit irrigation in olive trees and their potential for irrigation scheduling. Agric. Water Manag. 2016, 171, 10–20. [Google Scholar] [CrossRef]
- Torres, M.; Pierantozzi, P.; Searles, P.; Rousseaux, M.C.; García-Inza, G.; Miserere, A.; Bodoira, R.; Contreras, C.; Maestri, D. Olive cultivation in the southern hemisphere: Flowering, water requirements and oil quality responses to new crop environments. Front. Plant Sci. 2017, 8, 1830. [Google Scholar] [CrossRef]
- Fikrinda, F.; Syafruddin, S.; Sufardi, S.; Sriwati, R. Combined application of native mycorrhizal and cellulolytic fungi to manage drought effects on maize. IOP Conf. Ser. Earth Environ. Sci. 2019, 334, 012072. [Google Scholar] [CrossRef]
- Hinsinger, P.; Herrmann, L.; Lesueur, D.; Robin, A.; Trap, J.; Waithaisong, K.; Plassard, C. Impact of roots, microorganisms and microfauna on the fate of soil phosphorus in the rhizosphere. Annu. Plant Rev. 2015, 48, 375–407. [Google Scholar] [CrossRef]
- Rich, M.; Eschorderet, M.; Ereinhardt, D. The role of the cell wall compartment in mutualistic symbioses of plants. Front. Plant Sci. 2014, 5, 238. [Google Scholar] [CrossRef]
- Essahibi, A.; Benhiba, L.; Babram, M.A.; Ghoulam, C.; Qaddoury, A. Influence of arbuscular mycorrhizal fungi on the functional mechanisms associated with drought tolerance in carob (Ceratonia siliqua L.). Trees 2017, 32, 87–97. [Google Scholar] [CrossRef]
- Zheng, H.; Liu, Y.; Zhang, J.; Chen, Y.; Yang, L.; Li, H.; Wang, L. Factors influencing soil enzyme activity in China’s forest ecosystems. Plant Ecol. 2017, 219, 31–44. [Google Scholar] [CrossRef]
- Ramos, F.T.; Dores, E.F.D.C.; Weber, O.L.D.S.; Beber, D.C.; Campelo, J.H., Jr.; Maia, J.C.D.S. Soil organic matter doubles the cation exchange capacity of tropical soil under no-till farming in Brazil. J. Sci. Food Agric. 2018, 98, 3595–3602. [Google Scholar] [CrossRef]
- Matsui, K.; Takata, Y.; Matsuura, S.; Wagai, R. Soil organic carbon was more strongly linked with soil phosphate fixing capacity than with clay content across 20,000 agricultural soils in Japan: A potential role of reactive aluminum revealed by soil database approach. Soil Sci. Plant Nutr. 2021, 67, 233–242. [Google Scholar] [CrossRef]
- Fink, J.R.; Inda, A.V.; Tiecher, T.; Barrón, V. Iron oxides and organic matter on soil phosphorus availability. Cienc. AgroTecnol. 2016, 40, 369–379. [Google Scholar] [CrossRef]
- Yang, X.; Chen, X.; Yang, X. Effect of organic matter on phosphorus adsorption and desorption in a black soil from northeast China. Soil Tillage Res. 2019, 187, 85–91. [Google Scholar] [CrossRef]
- Rodríguez Sousa, A.; Parra-López, C.; Sayadi-Gmada, S.; Barandica, J.M.; Rescia, A.J. Impacts of erosion on the sustainability of organic olive groves: A case study (Estepa region, southwestern Spain). Sustainability 2021, 13, 7983. [Google Scholar] [CrossRef]
- Yu, K.; Chen, X.; Pan, G.; Zhang, X.; Chen, C. Dynamics of soil available phosphorus and its impact factors under simulated climate change in typical farmland of Taihu Lake region, China. Environ. Monit. Assess. 2016, 188, 88. [Google Scholar] [CrossRef]
- Lemanowicz, J. Dynamics of phosphorus content and the activity of phosphatase in forest soil in the sustained nitrogen compounds emissions zone. Environ. Sci. Pollut. Res. 2018, 25, 33773–33782. [Google Scholar] [CrossRef] [PubMed]
- Do Nascimento, C.A.C.; Pagliari, P.H.; da Faria, L.A.; Vitti, G.C. Phosphorus mobility and behavior in soils treated with calcium, ammonium, and magnesium phosphates. Soil Sci. Soc. Am. J. 2018, 82, 622–631. [Google Scholar] [CrossRef]
- Cissé, G.; Essi, M.; Kedi, B.; Mollier, A.; Staunton, S. Contrasting effects of long-term phosphorus fertilization on glomalin-related soil protein (GRSP). Eur. J. Soil Biol. 2021, 107, 103363. [Google Scholar] [CrossRef]
- Liu, H.; Wang, X.; Liang, C.; Ai, Z.; Wu, Y.; Xu, H.; Xue, S.; Liu, G. Glomalin-related soil protein affects soil aggregation and recovery of soil nutrient following natural revegetation on the Loess Plateau. Geoderma 2020, 357, 113921. [Google Scholar] [CrossRef]
- Zhang, D.; Easterling, K.A.; Pitra, N.J.; Coles, M.C.; Buckler, E.S.; Bass, H.W.; Matthews, P.D. Non-mendelian single-nucleotide polymorphism inheritance and atypical meiotic configurations are prevalent in hop. Plant Genome 2017, 10, 32. [Google Scholar] [CrossRef] [PubMed]
- Syib’li, M.A.; Muhibuddin, A.; Djauhari, S. Arbuscular mycorrhiza fungi as an indicator of soil fertility. Agrivita J. Agric. Sci. 2013, 35, 44–53. [Google Scholar] [CrossRef]
- Kabir, A.H.; Debnath, T.; Das, U.; Prity, S.A.; Haque, A.; Rahman, M.M.; Parvez, M.S. Arbuscular mycorrhizal fungi alleviate Fe-deficiency symptoms in sunflower by increasing iron uptake and its availability along with antioxidant defense. Plant Physiol. Biochem. 2020, 150, 254–262. [Google Scholar] [CrossRef]
- Zou, Y.-N.; Zhang, D.-J.; Liu, C.-Y.; Wu, Q.-S. Relationships between mycorrhizas and root hairs. Pak. J. Bot. 2019, 51, 727–733. [Google Scholar] [CrossRef]
- Igiehon, N.O.; Babalola, O.O. Rhizosphere microbiome modulators: Contributions of nitrogen fixing bacteria towards sustainable agriculture. Int. J. Environ. Res. Public Health 2018, 15, 574. [Google Scholar] [CrossRef]
- Aasfar, A.; Bargaz, A.; Yaakoubi, K.; Hilali, A.; Bennis, I.; Zeroual, Y.; Meftah Kadmiri, I. Nitrogen fixing Azotobacter species as potential soil biological enhancers for crop nutrition and yield stability. Front. Microbiol. 2021, 12, 628379. [Google Scholar] [CrossRef]
- Menezes-Blackburn, D.; Giles, C.; Darch, T.; George, T.S.; Blackwell, M.; Stutter, M.; Shand, C.; Lumsdon, D.; Cooper, P.; Wendler, R.; et al. Opportunities for mobilizing recalcitrant phosphorus from agricultural soils: A review. Plant Soil 2018, 427, 5–16. [Google Scholar] [CrossRef] [PubMed]
- Cruz-Paredes, C.; Diera, T.; Davey, M.; Rieckmann, M.M.; Christensen, P.; dela Cruz, M.; Laursen, K.H.; Joner, E.J.; Christensen, J.H.; Nybroe, O.; et al. Disentangling the abiotic and biotic components of AMF suppressive soils. Soil Biol. Biochem. 2021, 159, 108305. [Google Scholar] [CrossRef]
- Della Mónica, I.F.; Godeas, A.M.; Scervino, J.M. In vivo modulation of arbuscular mycorrhizal symbiosis and soil quality by fungal P solubilizers. Microb. Ecol. 2020, 79, 21–29. [Google Scholar] [CrossRef] [PubMed]
- Liu, M.; Shen, Y.; Li, Q.; Xiao, W.; Song, X. Arbuscular mycorrhizal fungal colonization and soil pH induced by nitrogen and phosphorus additions affects leaf C:N:P stoichiometry in Chinese fir (Cunninghamia lanceolata) forests. Plant Soil 2021, 461, 421–440. [Google Scholar] [CrossRef]
- De Souza-Torres, A.; Govea-Alcaide, E.; Gómez-Padilla, E.; Masunaga, S.H.; Effenberger, F.B.; Rossi, L.M.; López-Sánchez, R.; Jardim, R.F. Fe3O4 nanoparticles and Rhizobium inoculation enhance nodulation, nitrogen fixation and growth of common bean plants grown in soil. Rhizosphere 2020, 17, 100275. [Google Scholar] [CrossRef]
- Da Pereira, A.P.A.; Santana, M.C.; Zagatto, M.R.G.; Brandani, C.B.; Wang, J.-T.; Verma, J.P.; Singh, B.K.; Cardoso, E.J. Nitrogen-fixing trees in mixed forest systems regulate the ecology of fungal community and phosphorus cycling. Sci. Total Environ. 2021, 758, 143711. [Google Scholar] [CrossRef]
- Singh, S.; Varma, A. Structure, Function, and Estimation of Leghemoglobin. In Rhizobium Biology and Biotechnology; Springer: Cham, Switzerland, 2017; pp. 309–330. [Google Scholar]
- Aleixo, S.; Gama-Rodrigues, A.C.; Gama-Rodrigues, E.F.; Campello, E.F.C.; Silva, E.C.; Schripsema, J. Can soil phosphorus availability in tropical forest systems be increased by nitrogen-fixing leguminous trees? Sci. Total Environ. 2020, 712, 136405. [Google Scholar] [CrossRef]
- Widdig, M.; Schleuss, P.-M.; Weig, A.R.; Guhr, A.; Biederman, L.A.; Borer, E.T.; Crawley, M.J.; Kirkman, K.P.; Seabloom, E.W.; Wragg, P.D.; et al. Nitrogen and phosphorus additions alter the abundance of phosphorus-solubilizing bacteria and phosphatase activity in grassland soils. Front. Environ. Sci. 2019, 7, 185. [Google Scholar] [CrossRef]
- Margalef, O.; Sardans, J.; Fernández-Martínez, M.; Molowny-Horas, R.; Janssens, I.A.; Ciais, P.; Goll, D.; Richter, A.; Obersteiner, M.; Asensio, D.; et al. Global patterns of phosphatase activity in natural soils. Sci. Rep. 2017, 7, 1337. [Google Scholar] [CrossRef]
- Nehls, U.; Plassard, C. Nitrogen and phosphate metabolism in ectomycorrhizas. New Phytol. 2018, 220, 1047–1058. [Google Scholar] [CrossRef]
- Bücking, H.; Kafle, A. Role of arbuscular mycorrhizal fungi in the nitrogen uptake of plants: Current knowledge and research gaps. Agronomy 2015, 5, 587–612. [Google Scholar] [CrossRef]
- Muñoz-Cobo, M.P.; Guillén, J.H. Poda del olivo. Moderna olivicoltura. Editorial Agrícola Española 1998, 52, 77. [Google Scholar]


| Variable | Depth of Horizon (cm) | ||
|---|---|---|---|
| Ap (0–12) | Bw (12–27) | C1 (27–52) | |
| Sand (%) | 22.88 | 16.88 | 6.88 |
| Silt (%) | 34.00 | 38.00 | 40.00 |
| Clay (%) | 43.12 | 45.12 | 53.12 |
| Textural class | Ar | Ar | Ar |
| Pd (g cm−3) | 2.65 | 2.65 | 2.65 |
| Bd (g cm−3) | 1.61 | 1.65 | 1.69 |
| Tpor (%) | 39.25 | 37.74 | 36.23 |
| pH | 4.76 | 4.80 | 4.93 |
| EC (dS m−1) | 1.19 | 0.98 | 0.80 |
| Exchangeable acidity (Al3+) (cmolc kg−1) | 0.30 | 0.30 | 0.30 |
| OOC (%) | 0.67 | 0.53 | 0.53 |
| OM (%) | 1.15 | 0.92 | 0.92 |
| TN (%) | 0.06 | 0.05 | 0.05 |
| P (mg kg−1) | 5.46 | 6.86 | 3.52 |
| Ca2+ (cmolc kg−1) | 9.40 | 7.50 | 8.80 |
| Mg2+ (cmolc kg−1) | 3.36 | 3.04 | 3.02 |
| K+ (cmolc kg−1) | 0.15 | 0.08 | 0.10 |
| Na+ (cmolc kg−1) | 1.02 | 1.37 | 1.19 |
| ECEC (cmolc kg−1) | 13.93 | 11.99 | 13.11 |
| Fe2+ (mg kg−1) | 50.00 | 53.00 | 49.00 |
| Mn2+ (mg kg−1) | 0.94 | 0.00 | 0.00 |
| Cu2+ (mg kg−1) | 0.18 | 0.00 | 0.00 |
| Zn2+ (mg kg−1) | 2.04 | 1.76 | 1.76 |
| Ca/Mg | 2.80 | 2.47 | 2.91 |
| Ca/K | 62.67 | 93.75 | 88.00 |
| Mg/K | 22.40 | 38.00 | 30.20 |
| Ca+Mg/K | 85.07 | 131.75 | 118.20 |
| Variable | Treatments | ||
|---|---|---|---|
| V | G | NS | |
| Sand (%) | 31.88 | 33.63 | 34.13 |
| Silt (%) | 37.25 | 37.25 | 34.75 |
| Clay (%) | 30.87 | 30.37 | 31.12 |
| Pd (g cm−3) | 2.41 | 2.55 | 2.37 |
| Bd (g cm−3) | 1.11 | 1.09 | 1.07 |
| Por (%) | 53.64 | 56.98 | 54.53 |
| MWD (mm) | 3.99 | 3.86 | 3.91 |
| LL | 39.26 | 40.73 | 40.07 |
| PL | 28.59 | 28.12 | 28.55 |
| PI | 10.67 | 12.61 | 11.52 |
| CLE | 0.06 | 0.06 | 0.06 |
| pH | 4.90 | 5.07 | 5.07 |
| EC (dS m−1) | 0.51 | 0.56 | 0.56 |
| OOC (%) | 0.39 | 0.45 | 1.05 |
| P (mg kg−1) | 56.31 | 52.06 | 33.14 |
| Ca2+ (cmolc kg−1) | 6.69 | 7.91 | 7.88 |
| K+ (cmolc kg−1) | 0.81 | 0.93 | 0.73 |
| Mg2+ (cmolc kg−1) | 3.15 | 3.34 | 3.25 |
| Na+ (cmolc kg−1) | 0.15 | 0.18 | 0.20 |
| ECEC (cmolc kg−1) | 12.60 | 13.58 | 13.44 |
| I (%) | 72.50 | 76.00 | 76.25 |
| Spo (%) | 3557.50 | 4551.25 | 4538.25 |
| Al3+ (cmolc kg−1) | 1.80 | 1.24 | 1.39 |
| Nf (CFU) | 1.71 × 10⁵ | 4.76 × 10⁵ | 1.52 × 10⁵ |
| Ps (CFU) | 3.16 × 10⁵ | 5.76 × 10⁵ | 1.32 × 10⁵ |
| cel.µO | 6.25 | 13.75 | 5.00 |
| Pho (µM/min/g) | 77.97 | 57.03 | 178.92 |
| Cel (µM/min/g) | 1.39 | 1.56 | 1.64 |
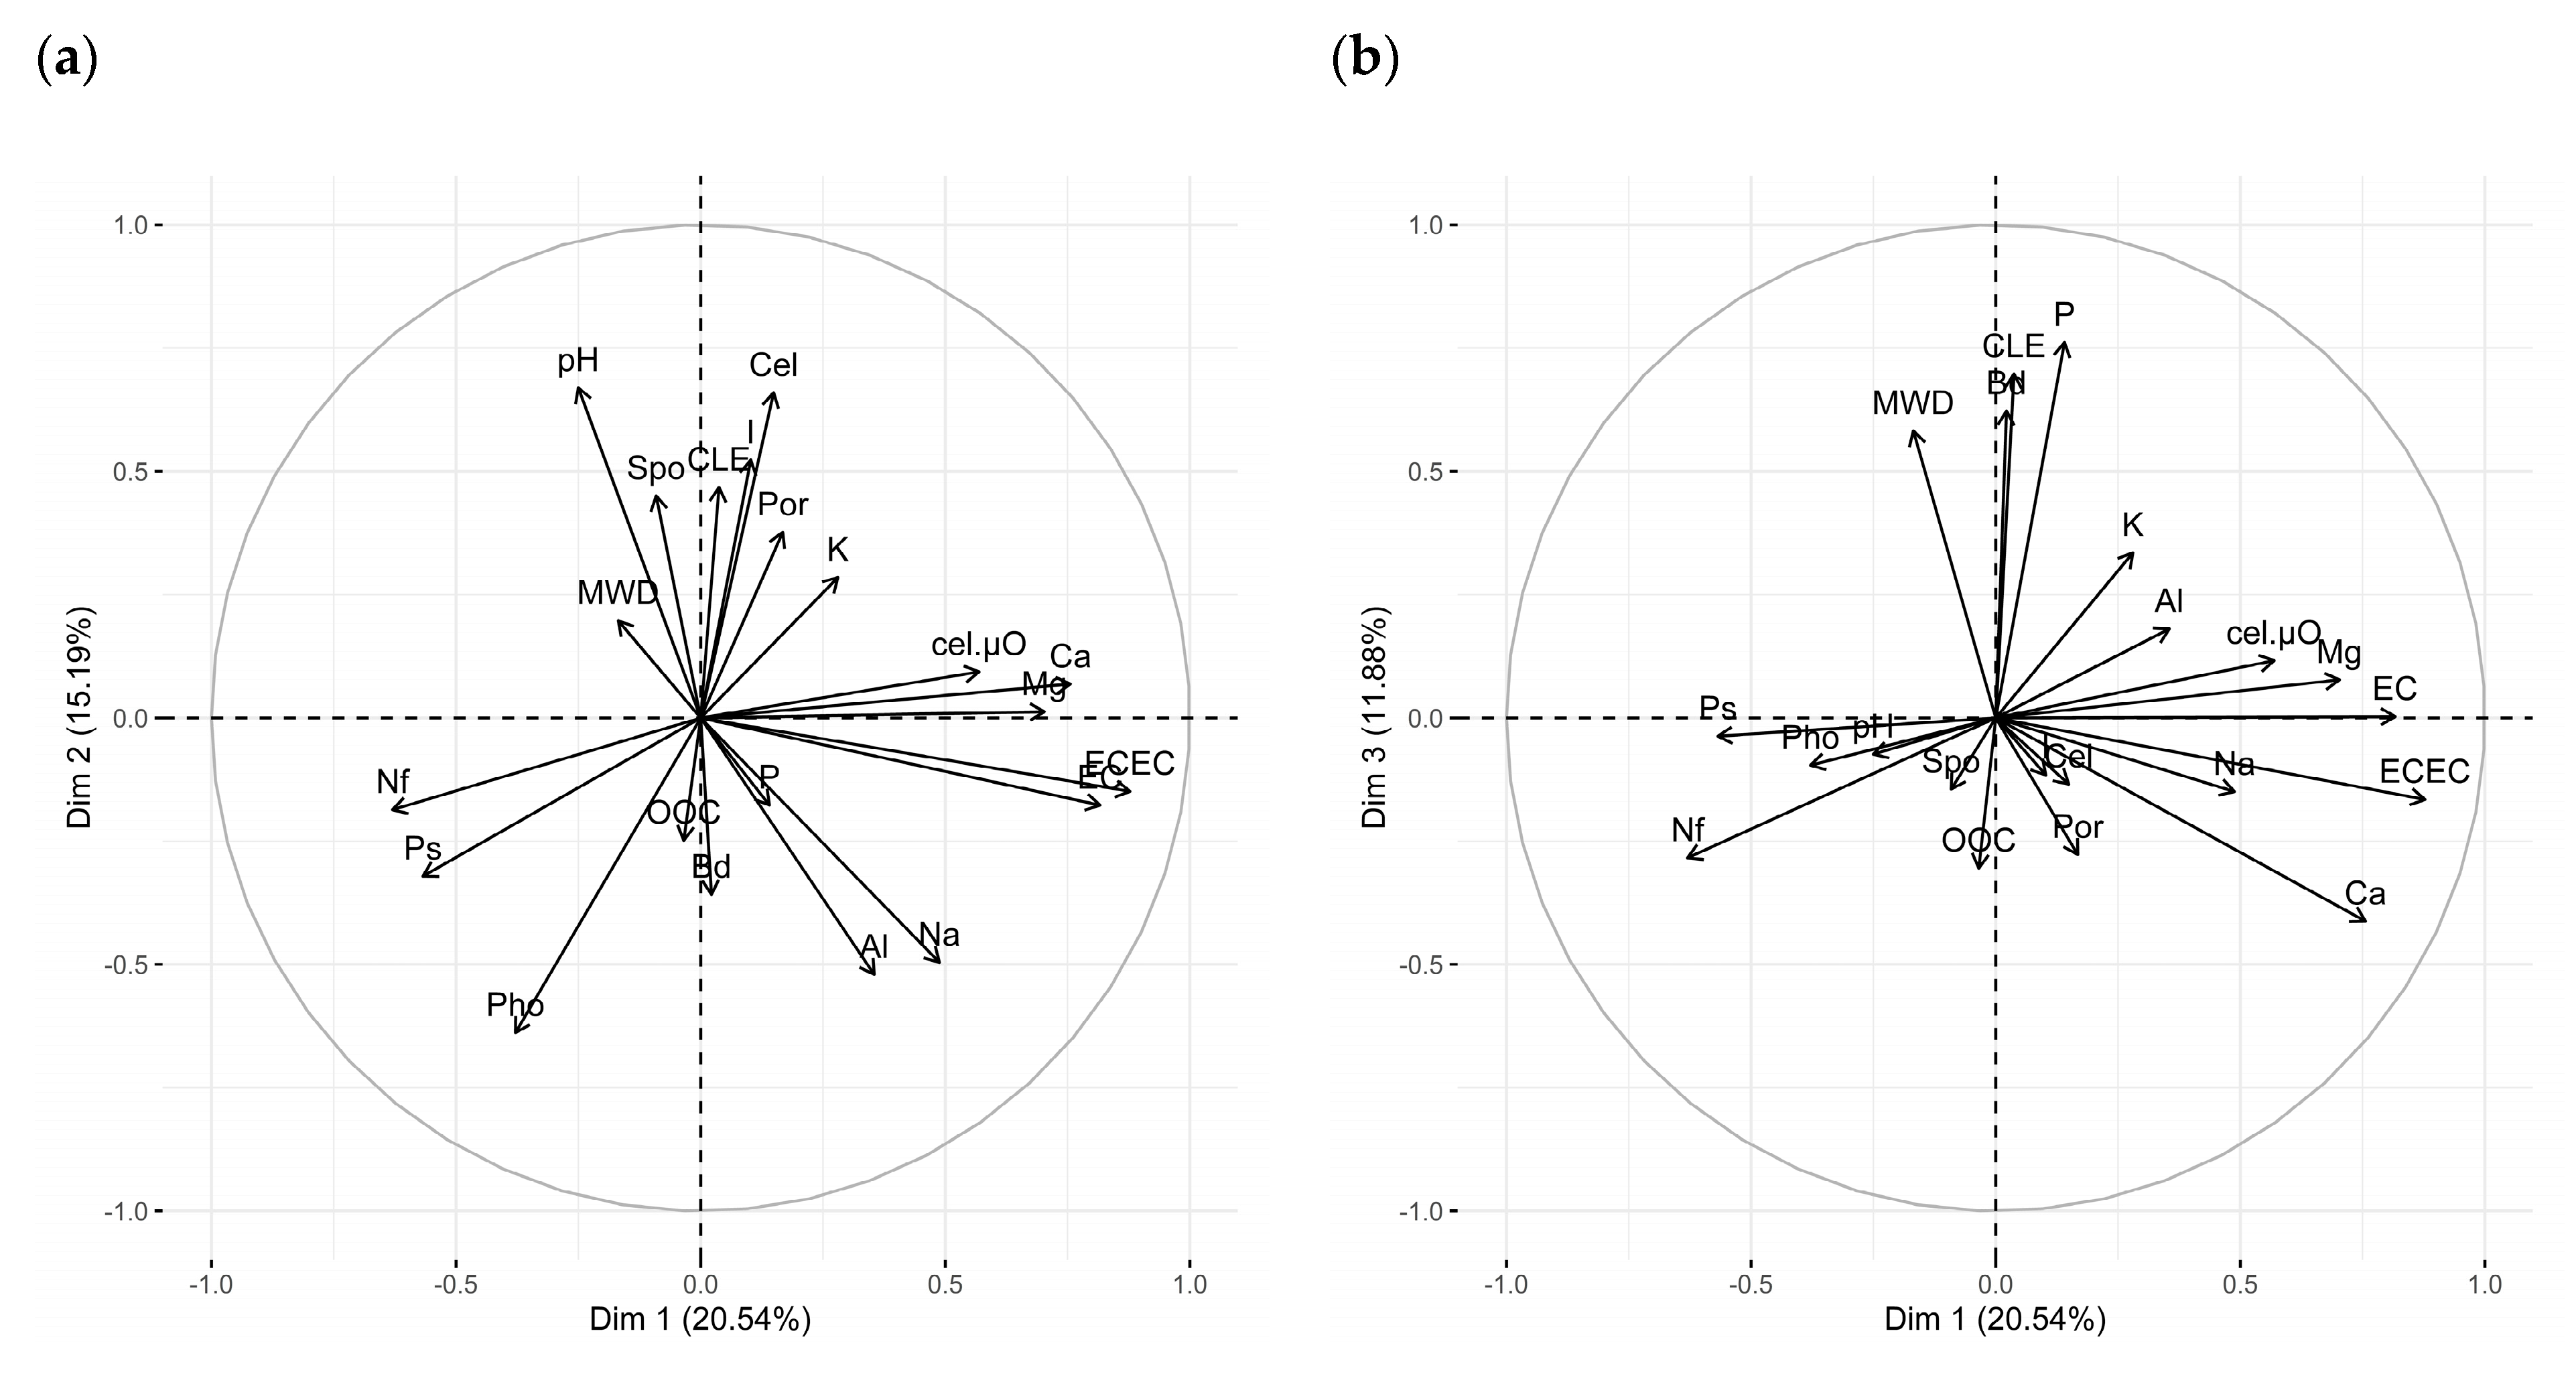
| Variable | Correlation |
|---|---|
| Dim 1 (20.54%) | |
| ECEC | 0.88 *** |
| EC | 0.82 *** |
| Ca2+ | 0.76 *** |
| Mg2+ | 0.70 *** |
| cel.µO | 0.57 *** |
| Na+ | 0.50 * |
| Ps | −0.56 *** |
| Nf | −0.63 *** |
| Dim 2 (15.19%) | |
| pH | 0.67 *** |
| Cel | 0.66 *** |
| I | 0.52 ** |
| CLE | 0.47 * |
| Spo | 0.45 * |
| Na+ | −0.50 ** |
| Al3+ | −0.52 ** |
| Pho | −0.64 *** |
| Dim 3 (11.88%) | |
| P | 0.76 *** |
| CLE | 0.70 *** |
| Bd | 0.62 *** |
| MWD | 0.58 *** |
| Ca2+ | −0.41* |
| Variables | Equation | R2 | Significance | |
|---|---|---|---|---|
| Dependent | Independent | |||
| Cellulase activity (Cel) | Inoculum percentage (I) | 0.23 | 0.017 | |
| Phosphate-solubilizing (Ps) | Nitrogen-fixing (Nf) | 0.58 | <0.0001 | |
| Effective cation Exchange capacity (ECEC) | Calcium (Ca2+) | 0.74 | <0.0001 | |
Publisher’s Note: MDPI stays neutral with regard to jurisdictional claims in published maps and institutional affiliations. |
© 2022 by the authors. Licensee MDPI, Basel, Switzerland. This article is an open access article distributed under the terms and conditions of the Creative Commons Attribution (CC BY) license (https://creativecommons.org/licenses/by/4.0/).
Share and Cite
García-Molano, J.F.; Cuervo-Bejarano, W.J.; Rodolfi, M.; Jaramillo-García, L.S.; Ganino, T. Can Olive Pruning Forms Influence the Olive Rhizosphere? The Root Microbiota and the Rhizosphere Properties in the Alto Ricaurte (Colombia). Agronomy 2022, 12, 1159. https://doi.org/10.3390/agronomy12051159
García-Molano JF, Cuervo-Bejarano WJ, Rodolfi M, Jaramillo-García LS, Ganino T. Can Olive Pruning Forms Influence the Olive Rhizosphere? The Root Microbiota and the Rhizosphere Properties in the Alto Ricaurte (Colombia). Agronomy. 2022; 12(5):1159. https://doi.org/10.3390/agronomy12051159
Chicago/Turabian StyleGarcía-Molano, José Francisco, William Javier Cuervo-Bejarano, Margherita Rodolfi, Luz Stella Jaramillo-García, and Tommaso Ganino. 2022. "Can Olive Pruning Forms Influence the Olive Rhizosphere? The Root Microbiota and the Rhizosphere Properties in the Alto Ricaurte (Colombia)" Agronomy 12, no. 5: 1159. https://doi.org/10.3390/agronomy12051159
APA StyleGarcía-Molano, J. F., Cuervo-Bejarano, W. J., Rodolfi, M., Jaramillo-García, L. S., & Ganino, T. (2022). Can Olive Pruning Forms Influence the Olive Rhizosphere? The Root Microbiota and the Rhizosphere Properties in the Alto Ricaurte (Colombia). Agronomy, 12(5), 1159. https://doi.org/10.3390/agronomy12051159