Abstract
Nitrogen (N) is an essential macronutrient for plant development and growth, and increased N deposition is affecting the diversity and productivity of plants. The objective of this study was to explore the growth response of Agropyron mongolicum Keng to N addition and to determine whether N-induced changes in soil-available nutrients have indirect impacts on the biomass of A. mongolicum via the regulation of root morphological traits and NUE. We conducted a pot experiment subjecting A. mongolicum to five N addition levels (0, 0.8, 1.6, 2.4, and 4.0 g N m−2 yr−1) under greenhouse conditions. N was provided through urea [CO(NH2)2] delivered with two equal applications and added at the seeding and tillering stages. The results showed that the total biomass response of A. mongolicum to increasing N addition appeared unimodal-shaped with an N saturation threshold at 3.20 g N m−2 yr−1. The total biomass was significantly and positively correlated with the root surface area (RSA), volume (RV), length (RL), forks number (RF), N-uptake efficiency (NUpE), and N-utilization efficiency (NUtE) (p < 0.05). N-induced changes in soil-available nutrients had an indirect impact on the total biomass of A. mongolicum via the regulation of root morphological traits and NUE.
1. Introduction
The use of fossil fuels and fertilizers has exacerbated the local and global deposition rates of atmospheric nitrogen (N) [1], Elevated levels of N strongly affect the composition of plant communities, especially in ecologically fragile and sensitive areas [1,2,3]. The desert steppe is highly vulnerable to environmental changes and anthropogenic disturbances because species are taxed at their upper biological limits [4]. Agropyron mongolicum Keng (Mongolian wheatgrass) is an important perennial grass widely distributed in the desert steppe of northern China [5,6]. It provides positive effects on soil conservation, wind breaking and sand fixing and has important ecological restoration functions [5]. A. mongolicum is a good forage grass with early spring regrowth and a high yield [6]. How A. mongolicum responds to the addition of N is unknown, but this is crucial to the restoration and management of the desert steppe ecosystem under future global change.
Studies have been conducted to report on the responses of plant species and functional groups to the addition of N at the global level [7], regional surveys [3,8], meta-analyses [9], and lab and field manipulative experiments have also been conducted [10,11]. These studies have given greater emphasis to the relationship between the above-ground part (leaves and stems) and ecosystem productivity, especially under natural conditions. Data from long-term investigations under natural N deposition have demonstrated that the external N supply could improve the competitive ability of plants for capturing other resources (e.g., light) via the increment in plant height and leaf N concentration, subsequently stimulating plant growth and ecosystem productivity [12]. However, the relevance of the roots of these plants has often been overlooked since field experiments are not conducive to root sampling. The root systems play an important role in the plant–soil ecosystem. For instance, the decomposition of dead roots and respiration in live roots make a significant contribution to carbon fluctuations [13,14], and well-developed root systems favor the promotion of photosynthetic production in above-ground parts [15,16]. The root systems also exhibit high plasticity when adapting to variable N conditions. Previous studies have demonstrated that small applications of N facilitated the extension and distribution of roots throughout the deep soil, high levels of N supplementation suppressed the elongation of lateral root [17,18]. The addition of N altered soil nutrient availability, influenced root growth and development, and affected the plant’s N-use efficiency (NUE) [19,20]. Adaptive N fertilization significantly increased root growth, NUE, and crop yield [19,21,22]. The absorption and utilization of nutrient is driven by root morphology, which contributes to the plant growth and physiological processes. However, knowledge remains limited on how root morphology affects growth of A. mongolicum and largely limits our understanding of its physiological and ecological adaptive mechanism facing environmental changes.
We conducted a pot experiment subjecting A. mongolicum to five N addition levels (0, 0.8, 1.6, 2.4, and 4.0 g N m−2 yr−1) under greenhouse conditions to explore the growth response of A. mongolicum to N addition and to determine whether N-induced changes in soil-available nutrients have indirect impacts on the biomass of A. mongolicum via the regulation of root morphological traits and NUE. We hypothesized that the total biomass of A. mongolicum has an N saturation threshold with increasing N addition gradients, and this response is mainly related to root morphological traits and NUE.
2. Materials and Methods
2.1. Experimental Conditions and Treatments
The experiment was conducted from 2 July 2020 to 4 January 2021 in a climate-controlled greenhouse at the Agricultural Research Center of Ningxia University (38°30′11″ N, 106°8′25″ E), Yinchuan, China. The relative humidity in the greenhouse was 60 ± 5%, the day/night temperature was 28/15 ± 2 °C, the average light intensity ranged from 22.60–184.20 mmol m−2 s−1, and the photoperiod was set at 16 h.
A. mongolicum seeds were collected from the desert steppe of Sidunzi Village in Yanchi County, Ningxia, China (37°20′30″ N, 107°15′38″ E). We sowed 10 healthy seeds in plastic pots (diameter: 25 cm; height: 27 cm) and filled them with 8 kg of sandy soil collected from the desert steppe (soil organic carbon was 5.87 ± 0.22 g kg−1, the pH was 9.07 ± 0.24, and the available nitrogen was 5.26 ± 0.30 mg kg−1, AP was 8.04 ± 0.72 mg kg−1, and available potassium was 119.20 ± 5.44 mg kg−1). After germination and growing into seedlings, plants were thinned to 5 seedlings per pot, with a total of 50 pots. All pots were randomly arranged in the greenhouse.
There were 5 N addition treatments (N0, ambient; N0.8, ambient + 0.80 g N m−2 yr−1; N1.6, ambient + 1.60 g N m−2 yr−1; N2.4, ambient + 2.40 g N m−2 yr−1; and N4, ambient + 4 g N m−2 yr−1) and 10 replicates for each treatment. Smaller additions of N to the N0.8 and N1.6 treatments were chosen to represent the background deposition rate in the study site, which was reported with an average of 1.20 g N m−2 yr−1 [4,23]. N additions were applied using urea [CO(NH2)2] with two equal applications dissolved in 500 mL of tap water. This was added at the seeding and tillering stages, respectively. All plants were irrigated with tap water every two days, and the soil water content was maintained at 70–80% of field capacity (21.60%) during the experiment. Each pot was randomly moved to a new position once a week during the experiment.
2.2. Plant and Soil Sampling
Whole tillers of individuals from ten replicated pots were dug up and separated into roots and shoots (leaves and stems). The roots were rinsed repeatedly using deionized water, and the water on the roots was wiped off with absorbent paper. Then, all the harvest samples were divided into two subsamples. One subsample was packed in tinfoil and immediately immersed in liquid N2 for transportation to the laboratory and stored at −80 °C for further physiological analysis. Another subsample was taken to the laboratory and stored at 4 °C for morphological properties analysis.
After the plants were harvested, 4 of the 10 replicated pots per treatment were randomly selected for soil analysis. Soil samples were sieved through a 2 mm sieve to remove the roots. The sieved samples were divided into two parts. One part was stored at 4 °C for the determination of soil NH4+-N and NO3−-N, and the other was air-dried for soil analysis of AP and pH.
2.3. Analysis of Biomass and Morphological Traits of the Roots
Five plant samples per treatment were analyzed for biomass. The root and shoot of each plant were packed in separate envelopes and dried at 65 °C to a constant mass to determine the shoot and root biomass (dry weight) of each plant, the total biomass per plant equaled the sum of root biomass and shoot biomass.
Four plant samples per treatment were analyzed for root morphological parameters. The samples of harvested fresh roots were washed carefully with water and each (one after the other) placed in the scanner’s tray. Water was added, and with the aid of a plastic forceps, the roots were homogeneously spread across the tray, and images of the entire system were taken using an Epson digital scanner (Epson Perfection V700; Seiko Epson Corp., Suwa, Japan). Then, analysis was conducted using with the WinRHIZO system (Regent Instrument Inc., Quebec, QC, Canada) on a computer connected to the scanner to determine total root length (TRL), root surface area (RSA), root volume (RV), root diameter (RD), and root forks number (RF) [19].
2.4. Determination of N Metabolic Enzyme Activities and N Assimilating Products
Nitrate reductase (NR), nitrite reductase (NiR), glutamine synthetase (GS), glutamate synthase (GOGAT), and glutamate dehydrogenase (GDH) activity were determined according to the method of Asif, et al. [19]. Total soluble protein content (SPC) was measured using the Coomassie Brilliant Blue method [24]. The ninhydrin method was used to determine the total free amino acid content (FAAC) [25]. The total amounts of soluble sugar content (SSC) and starch content (SC) were determined using the anthrone method [26].
2.5. NUE Traits and Soil Available Nutrients Analysis
The dried root and shoot samples were milled in a ball-mixer mill (MM200, Retsch, Haan, Germany) to analyze the nutrient content. The tissue N concentration was measured using an elemental analyzer (Flash EA1112, Thermo Scientific, West Palm Beach, FL, USA). Total nitrogen content (TNC) represents the sum between root N and shoot N concentration. The soil pH, available N, and P concentrations were determined using the methods described by Yuan, et al. [27]. N-use efficiency (NUpE and NUtE) was determined according to Abenavoli, et al. [28] as below:
(1) Total N Accumulation (TNA) calculated as the root N concentration × root dry weight + shoot N concentration × shoot dry weight (mg N) [28];
(2) Nitrogen Utilization Efficiency (NUtE) calculated as the total plant dry weight divided by total N concentration (g2 TDW mg−1 N) [29,30];
(3) Nitrogen Uptake Efficiency (NUpE) calculated as TNA divided by root dry weight (mg N g−1 RDW) [31].
2.6. Statistical Analysis
Data were checked for normality and homogeneity of the residuals using Levene’s test before analyses. Log transformation was applied when data did not meet the criteria for normality and homogeneity. One-way analysis of variance (ANOVA) and Tukey post hoc test were performed to examine the effects of N addition on root and shoot biomass, soil-available nutrient properties, root morphological traits, NUE, and the potential activity of enzymes and N-containing compounds related to NUE at p ≤ 0.05. A polynomial dose–response curve based on akaike information criteria (AIC) was used to estimate the response function for the total biomass of A. mongolicum per plant versus the N deposition rate, with the apex of the fitting curve providing the N saturation threshold for A. mongolicum (Table S1) [8,32]. We also used simple linear regression to test the relationships of biomass and root morphological traits and NUE across all N addition treatments. Finally, structural equation modeling (SEM) was performed to identify the N-induced changes in available soil nutrients as regulated by A. mongolicum for the uptake and utilize of N, and the subsequent impact on plant biomass. Prior to SEM, we reduced the number of variables for soil-available nutrient properties, root morphological traits, and NUE-relevant properties using principal component analyses (PCAs) [33,34]. The first principal component (PC1) was used in the subsequent SEM analysis to represent soil-available nutrients (PC1 explained 79.19% of the variance; Figure S1), root morphological characteristics (PC1 explained 75.48% of the variance; Figure S2), N metabolism enzymatic activities (PC1 explained 86.09% of the variance; Figure S3), N assimilation products (PC1 and PC2 explained 75.33% of the variance; Figure S4), and N-use efficiency (PC1 explained 73.42% of the variance; Figure S5). The rest of the variables were transformed into a score for final SEM analysis [34]. The goodness-of-fit for SEM was evaluated by χ2 tests, goodness-of-fit index (GFI), normal fit index (NFI), and the root square mean error of approximation (RMSEA). We improved the goodness-of-fit for SEM by removing pathways between the observed variables based on modification indices [33,34].
All data were analyzed using SPSS 21.0 software (SPSS Inc., Chicago, IL, USA). Figures were drawn using Origin 16.0 software (Origin Lab, Northampton, MA, USA). SEM analysis was performed in Amos 21.0 (IBM, Chicago, IL, USA) software.
3. Results
3.1. Effects of N Addition on A. mongolicum Biomass
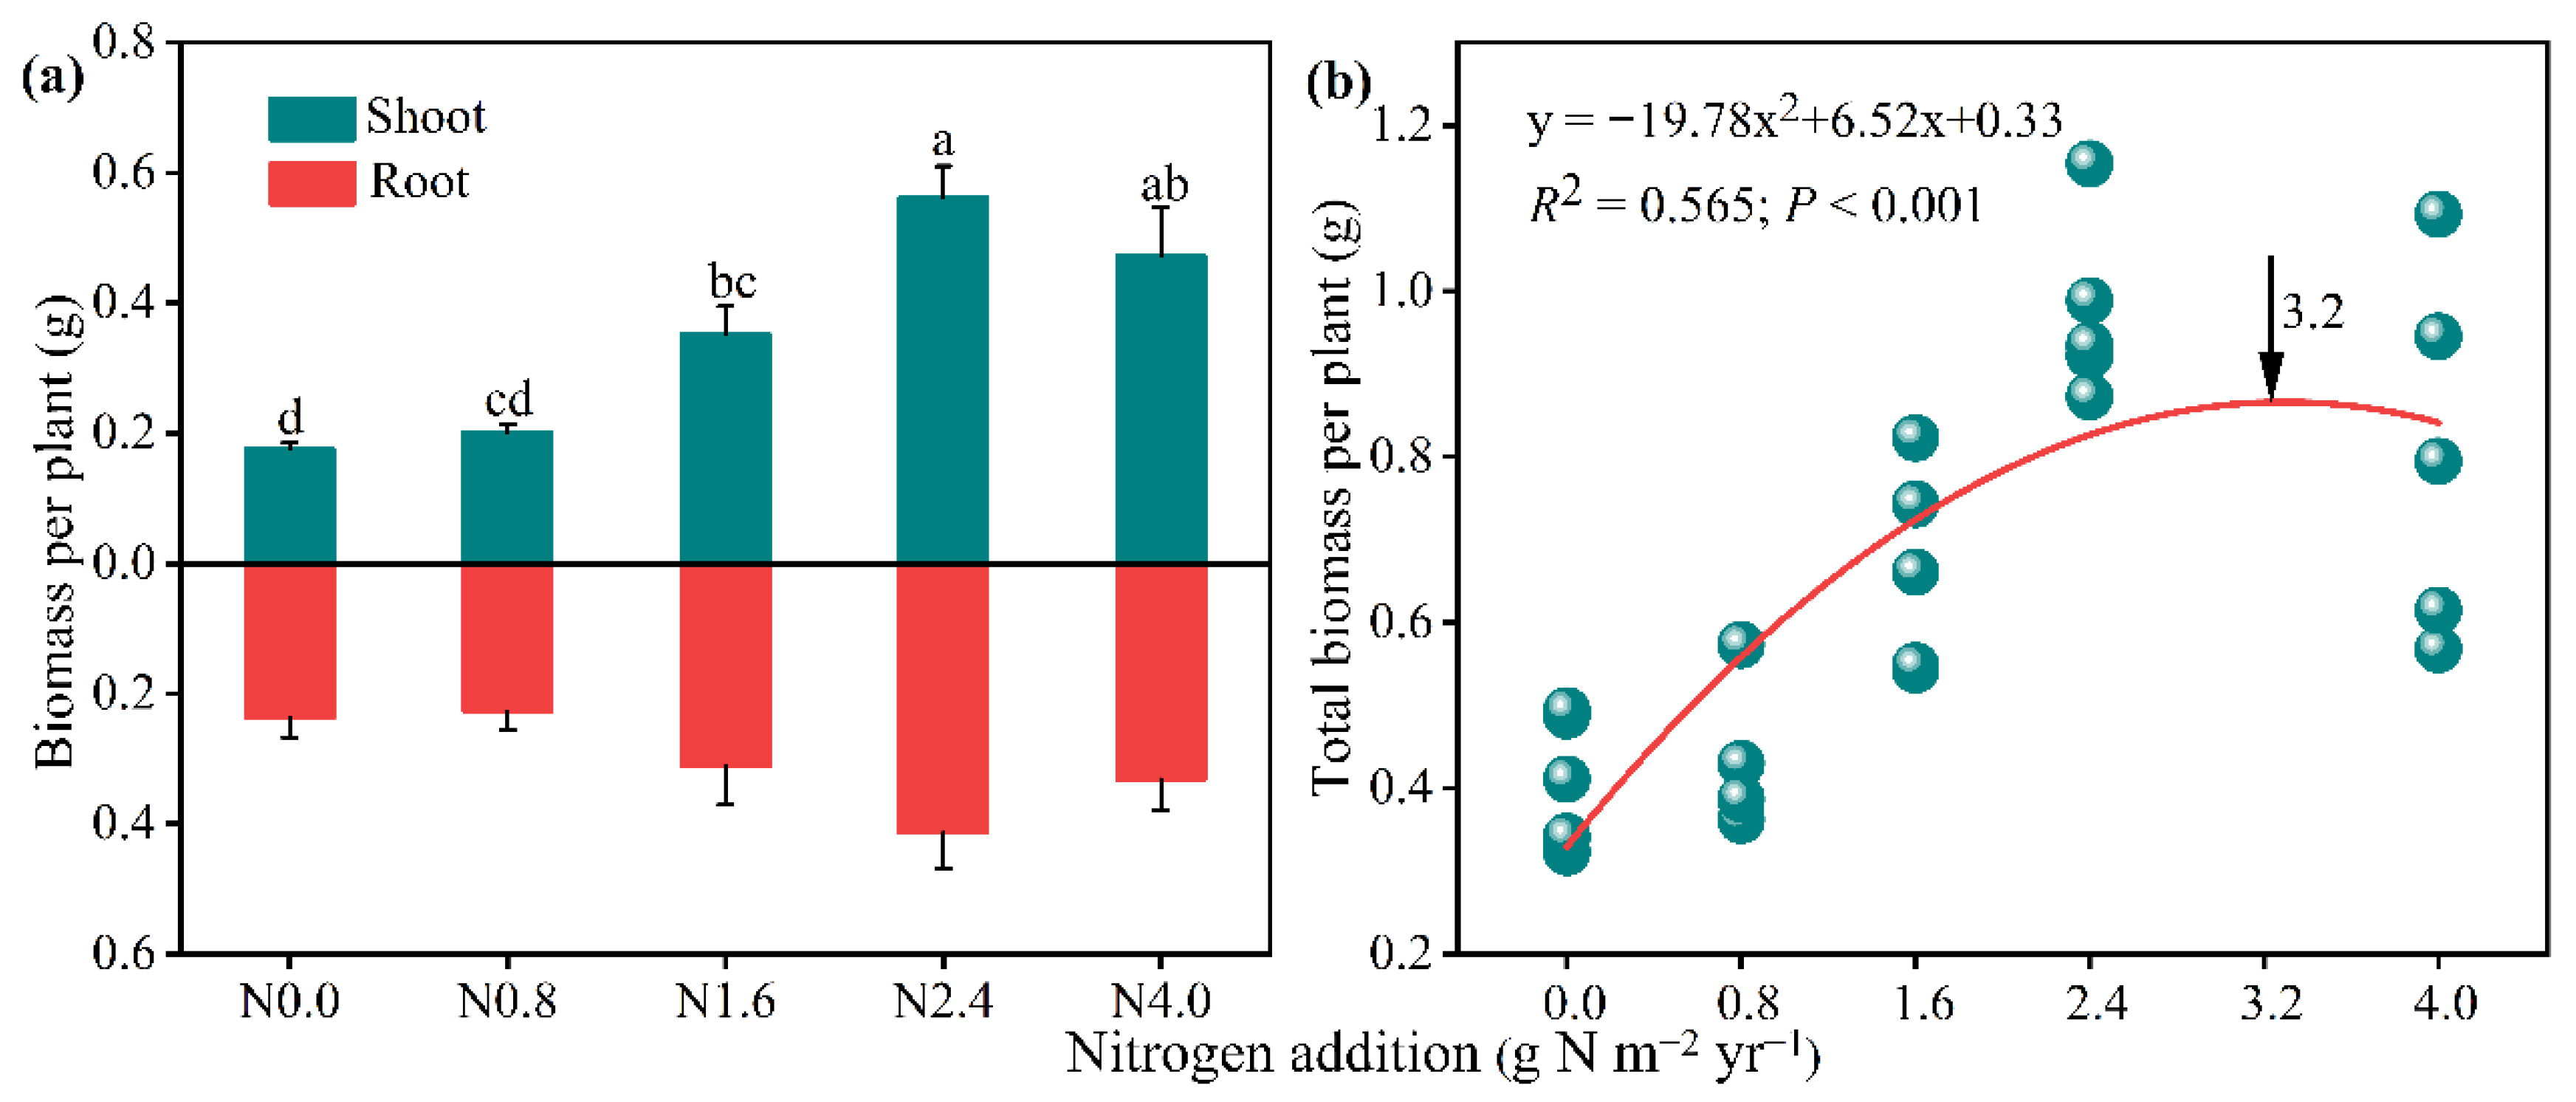
Shoot biomass significantly increased with the increased addition of N (F = 13.80, p < 0.01). Compared to the control group (N0), shoot biomass was significantly improved by 100.51% under N1.6 and 219.76% under N2.4, respectively, with the highest value at N2.4 treatment (Figure 1a). Although we did not observe any significant effects from N addition in the root biomass; they did tend to increase from N0 to N2.4 but decrease from N2.4 to N4.0 (Figure 1a). In addition, a similar trend as shoot biomass was observed in total biomass (Figure S6). Meanwhile, a quadratic equation was used to explain the relationship (R2 = 0.657) between the total biomass and the N addition gradients, which exhibited a unimodal response with the increasing N addition gradient. The N saturation threshold was 3.20 g N m−2 yr−1 (Figure 1b).

Figure 1.
Biomass of A. mongolicum in response to N addition treatments and the polynomial dose-response curve of total biomass vs. N addition levels. The arrow indicates the N saturation threshold of A. mongolicum. Data are expressed as mean ± standard error (n = 5). Different letters above the bars indicate significance differences among the N addition treatments at p < 0.05 level.
3.2. N Addition Effects on Soil-Available Nutrient Properties and Root Morphological Traits
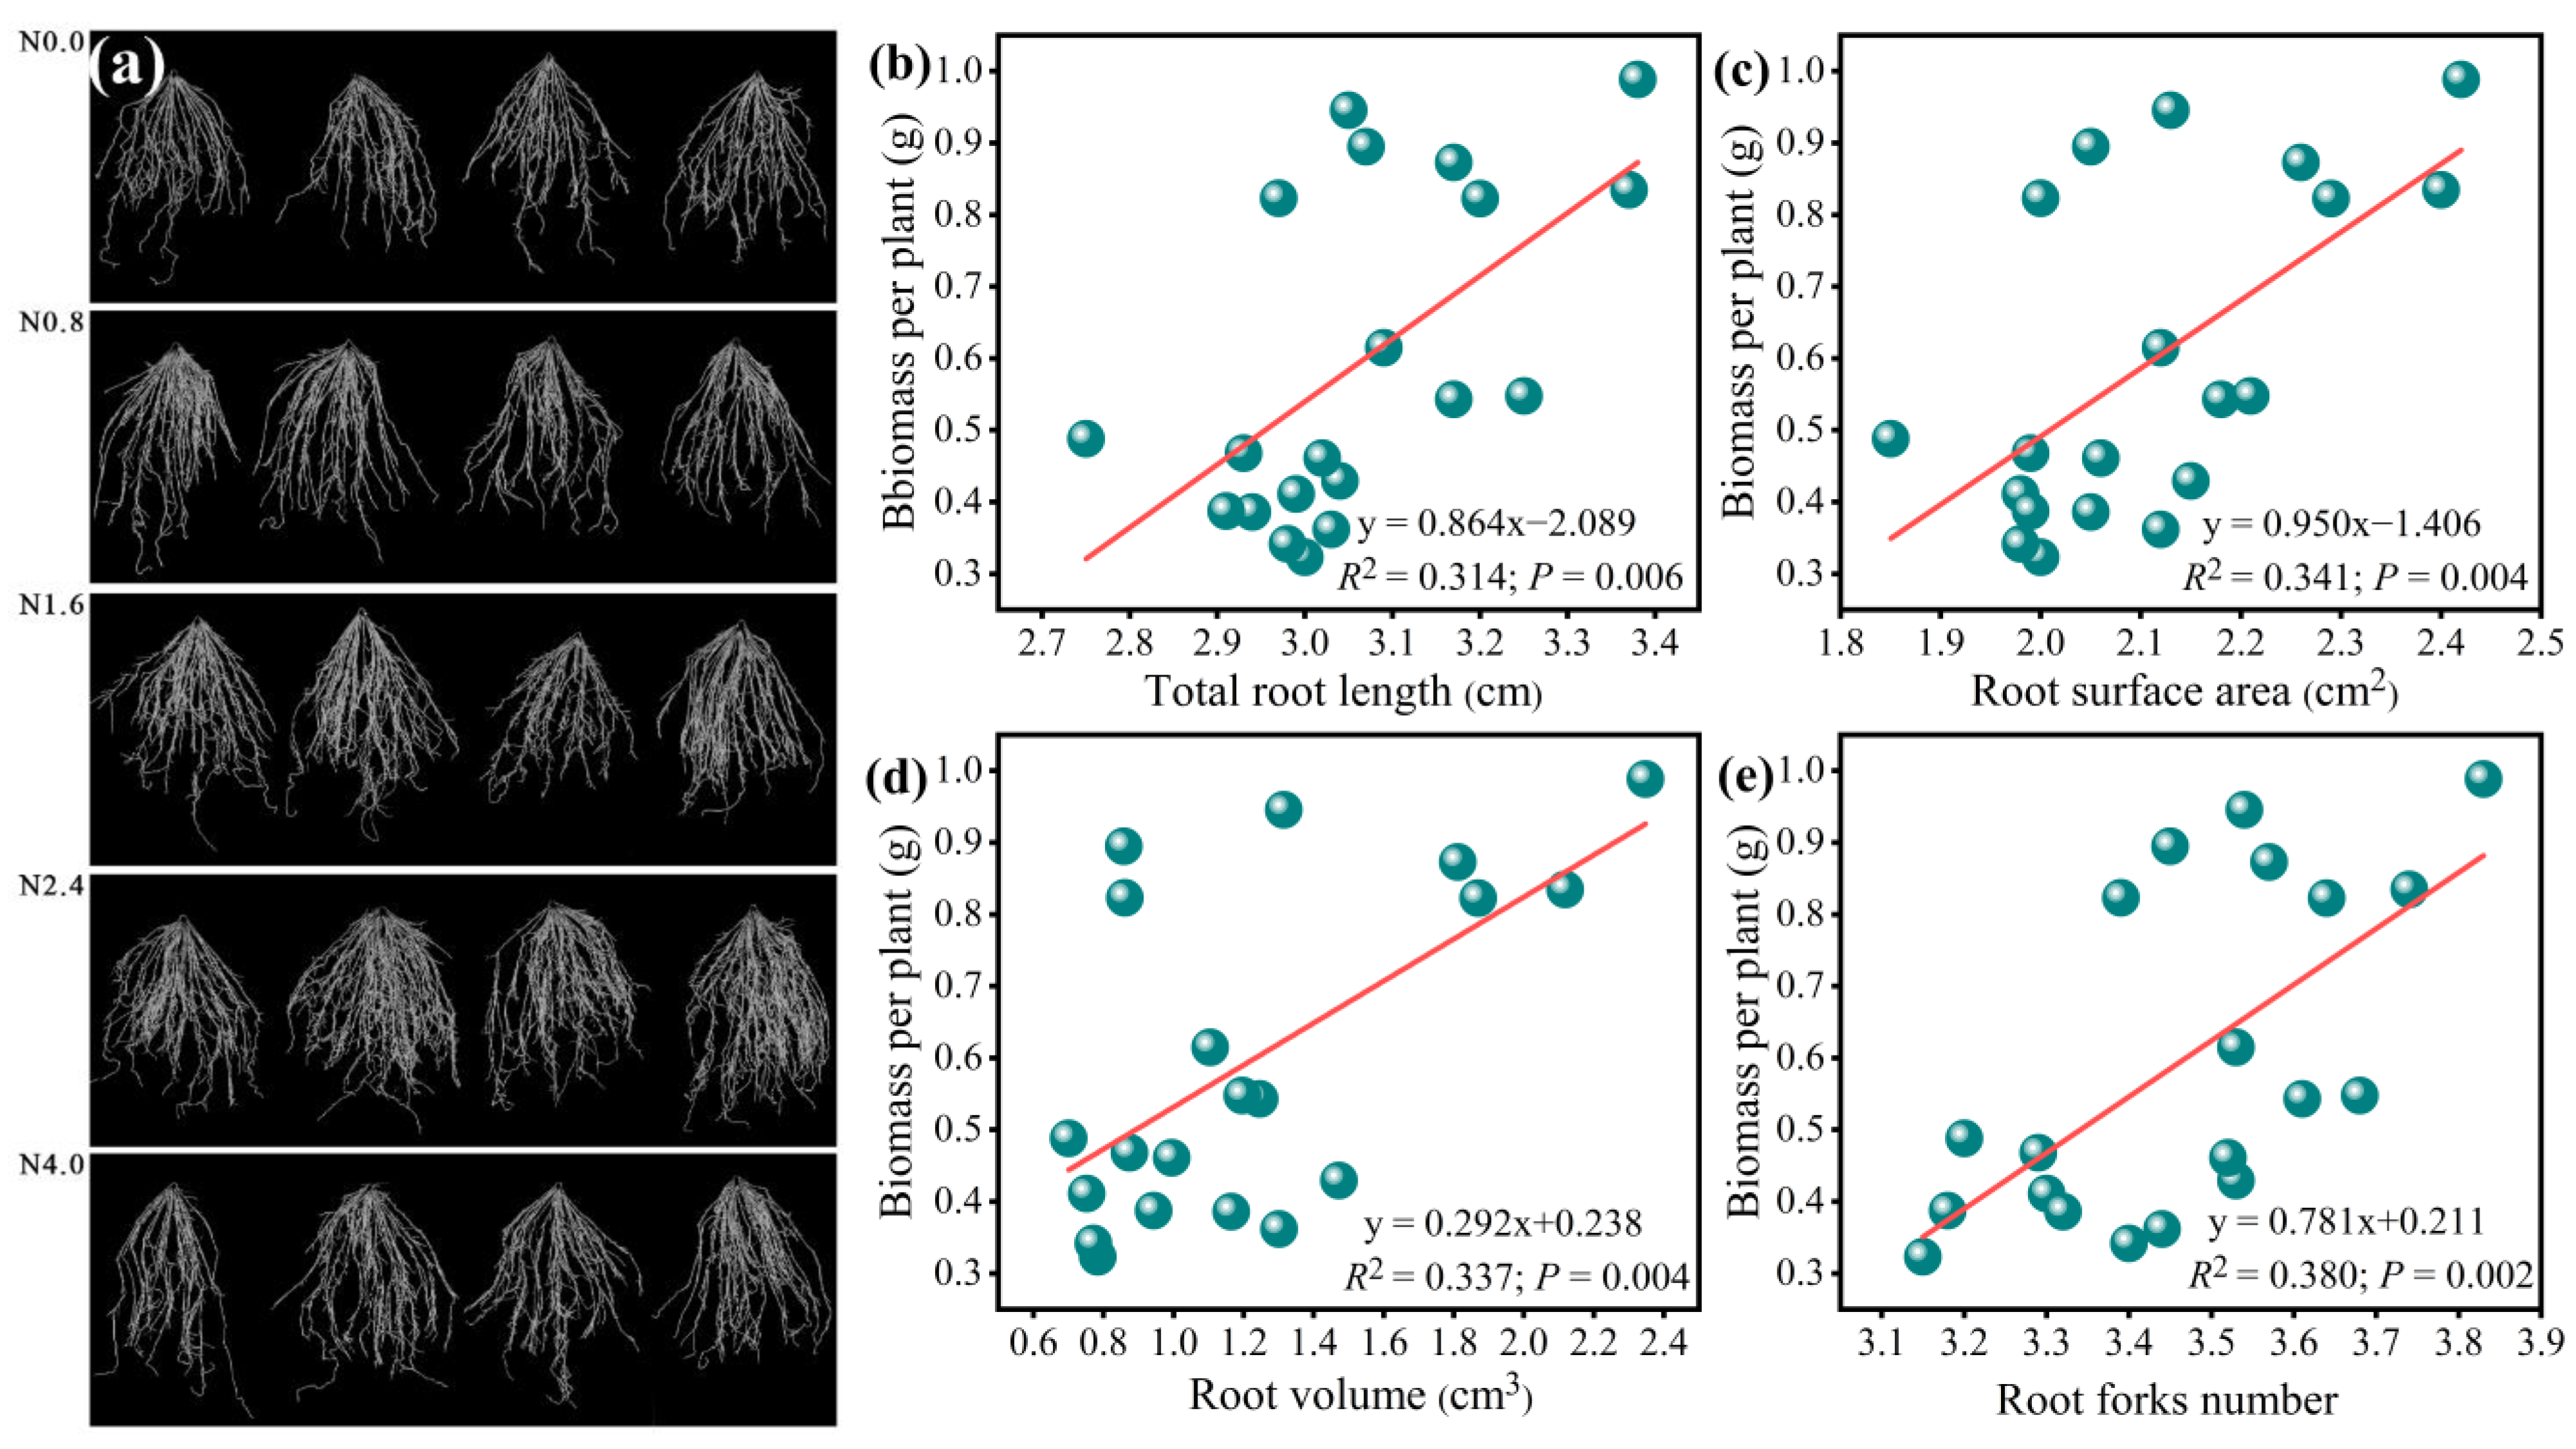
Our results showed that N addition significantly increased the soil NO3−-N and AP linearly as N increased from N0 to N4 (F = 18.14, p < 0.001 for NO3−-N; F = 18.14, p < 0.001 for AP; Table 1). Root morphological traits’ responses to N addition were observed simultaneously (Figure 2). RSA, RV, RL, and RF showed significant responses to N addition and tended to increase with increasing N addition rates from N0 to N2.4 and decreased above N2.4 (F = 13.09, p < 0.001 for RSA; F = 24.65, p < 0.001 for RV; F = 7.04, p < 0.01 for RL; F = 7.39, p< 0.001 for RF; Table 1). Linear regressions showed that the total biomass was significantly and positively related to the RSA, RV, RL, and RF (Figure 2b–e).

Table 1.
Results of one-way ANOVA for the effects of N addition on soil properties and A. mongolicum root morphological traits.
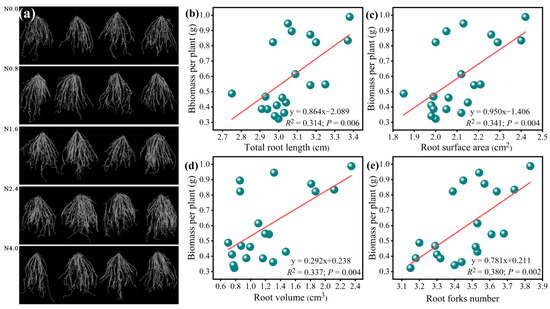
Figure 2.
Root phenotype of A. mongolicum under various N addition gradients (a) and the relationship between these root morphological parameters and the total biomass. (b)total root length, (c) root surface area, (d) root volume, (e)root forks number.
3.3. Responses of Activities of N Metabolism Enzymes and Assimilation Products in Shoot and Root to N Addition
N addition significantly improved the NR, NiR, GOGAT, GS, and GDH activities in both the shoots and roots (Figure 3). The N2.4 treatment significantly increased all the N metabolism enzyme activity compared with the N0 treatment, while there were no significant changes when N addition exceeded N2.4. For N assimilation products (Figure 4), N addition significantly affected both the shoots and roots of SPC (F = 5.85, p < 0.01 for shoot; F = 3.22, p < 0.05 for root), with the highest value of 14.82 and 2.78 at N2.4 treatment. FAAC in the shoots and roots had a similar response to increasing N addition, up to its highest value at N2.4. Non-structural carbohydrates in shoots and roots, including SSC and SC, were significantly affected by N addition. Relative to N0 treatment, both SSC (F = 23.49, p < 0.001 for shoot; F = 43.45, p < 0.001 for root), and SC (F = 3.68, p < 0.05 for shoot; F = 9.49, p < 0.001 for root) were increased when N addition treatment was lower than N2.4 but then not changed, significantly.
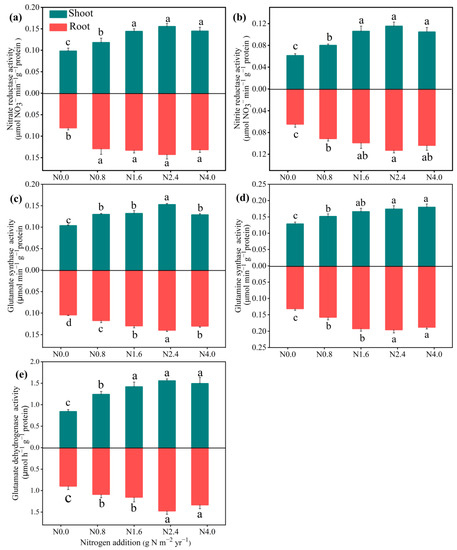
Figure 3.
Effects of N addition on N metabolism enzymatic activities of A. mongolicum. Values are the mean ± standard error (n = 4). Different letters above the bars indicate significance differences among the N addition treatments (p < 0.05). (a) nitrate reductase (NR), (b) nitrite reductase (NiR), (c) glutamine synthetase (GS), (d) glutamate synthase (GOGAT), and (e) glutamate dehydrogenase (GDH).
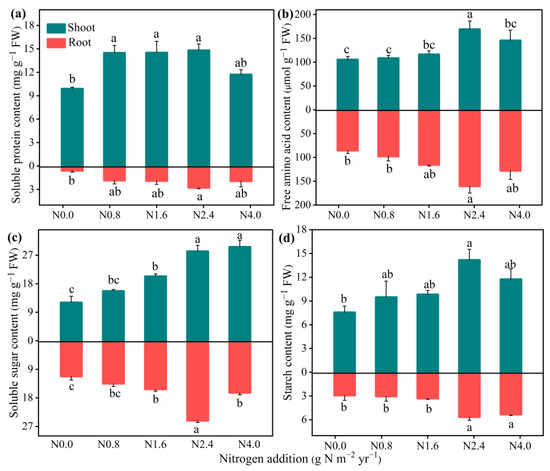
Figure 4.
Effects of N addition on N assimilation products of A. mongolicum. Values are the mean ± standard error (n = 4). (a) soluble protein content (SPC), (b) free amino acid content (FAA), (c) soluble sugar content (SSC), and (d) starch content (SC). Different letters above the bars indicate significance differences among the N addition treatments (p < 0.05).
3.4. Responses of N-Use Efficiency in A. mongolicum to N Addition
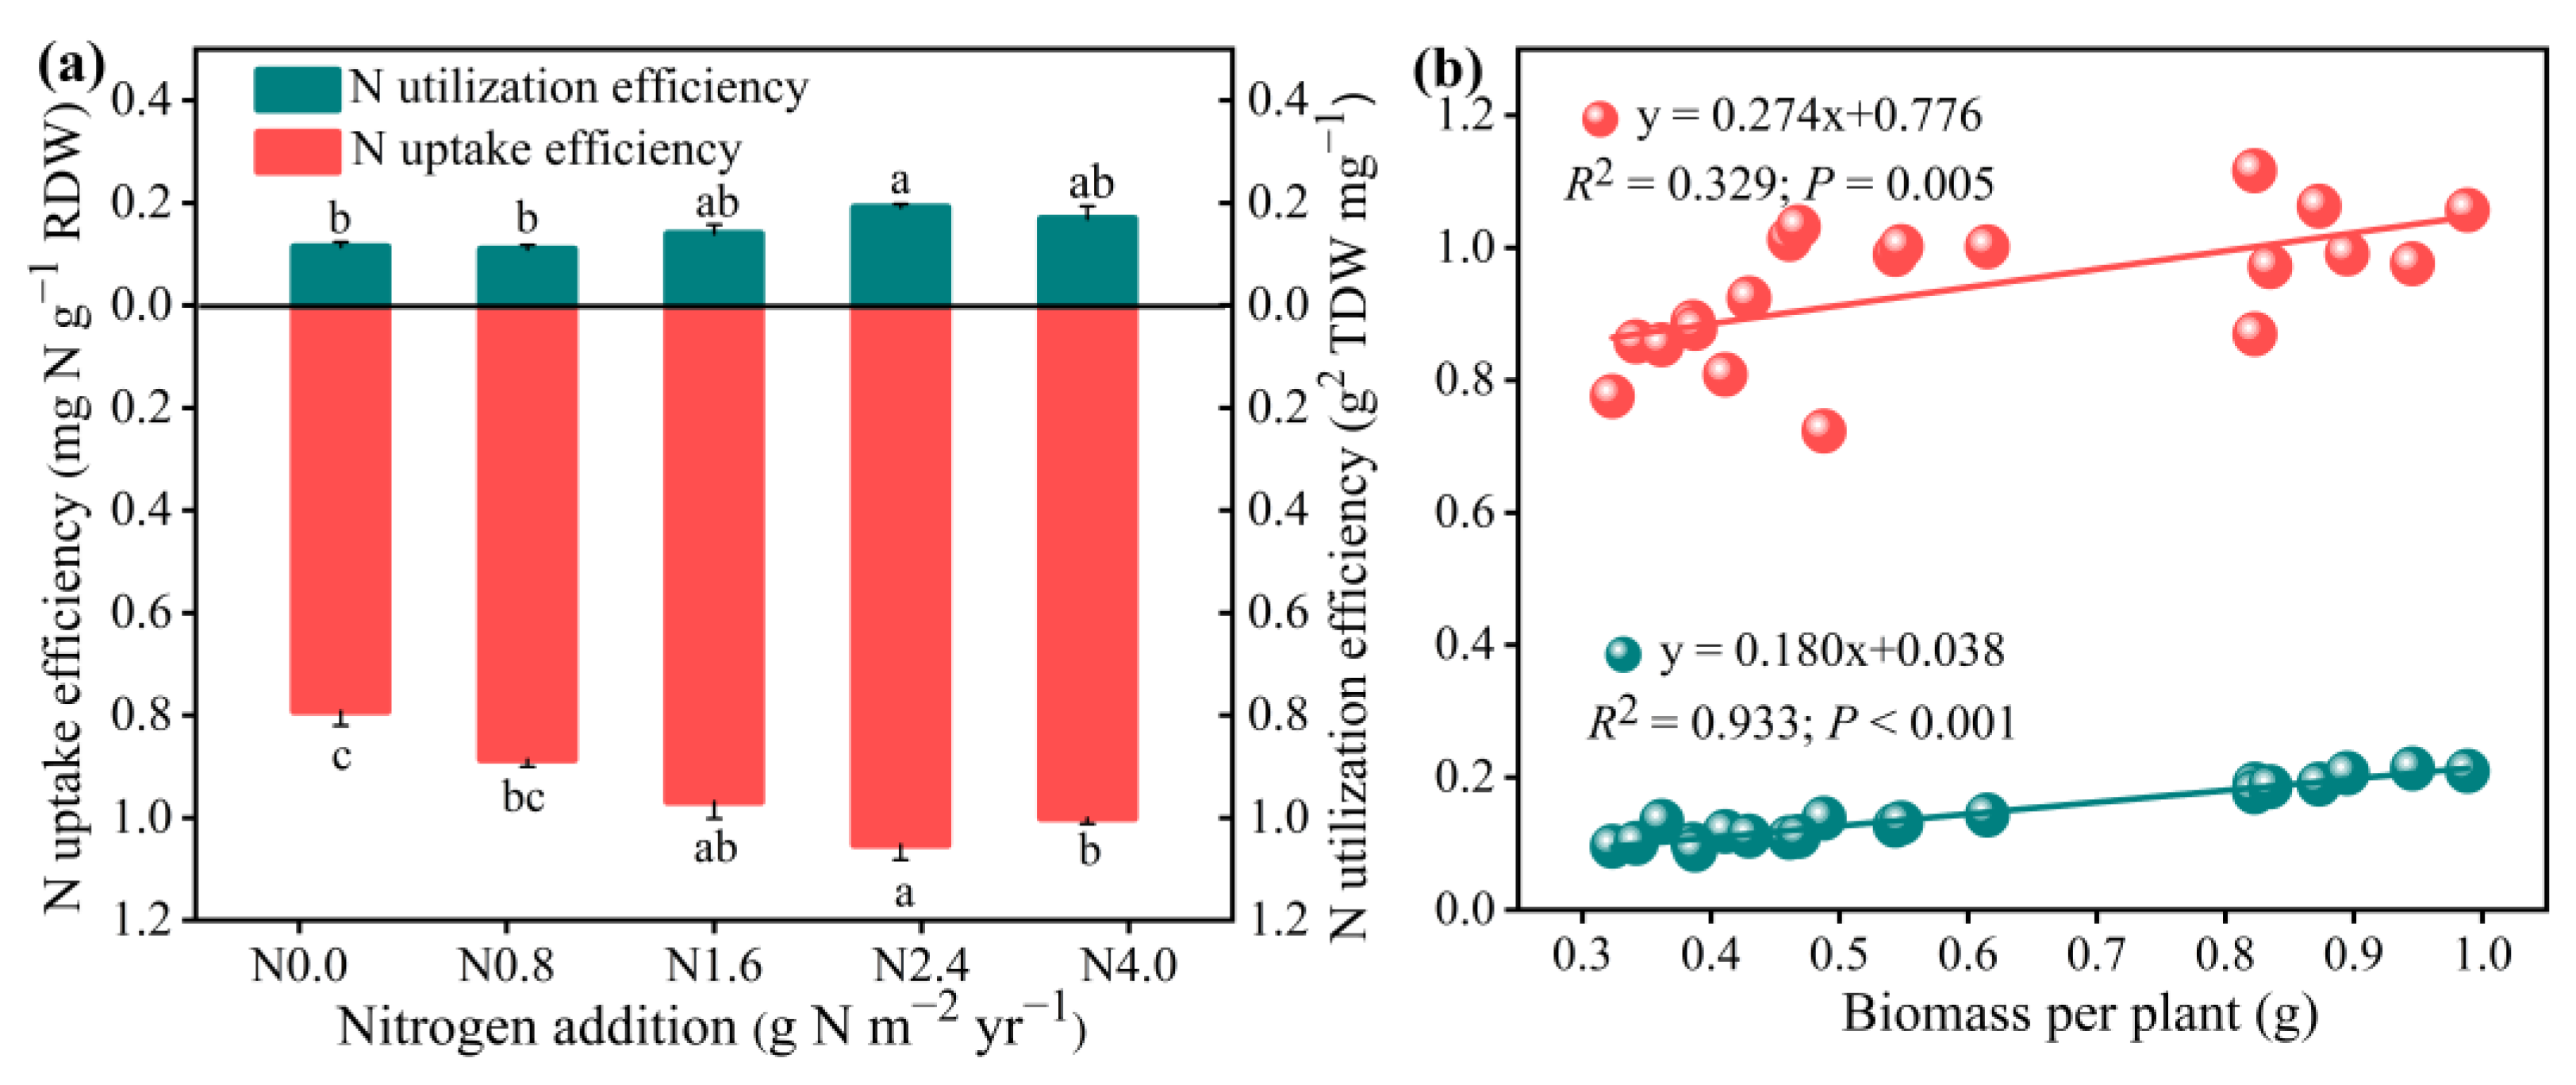
NUE was significantly affected by N addition (Figure 5). NUpE and NUtE significantly increased with increasing N addition from N0 to N2.4 but decreased more than N2.4 (F = 16.60, p < 0.001 for NUpE; F = 15.07, p < 0.001 for NUtE). Regression analysis showed that the total A. mongolicum biomass increased linearly with an increase in NUpE and NUtE.

Figure 5.
Effects of N addition on N uptake efficiency (NUpE) and N utilization efficiency (NUtE) of A. mongolicum (a), and the relationship between the NUpE and NUtE and the total biomass (b). Values are the mean ± standard error (n = 4). Different letters above bars indicate significances among the N addition treatments (p < 0.05).
3.5. Direct and Indirect Effects of Soil-Available Nutrient and N-Use Efficiency on Biomass
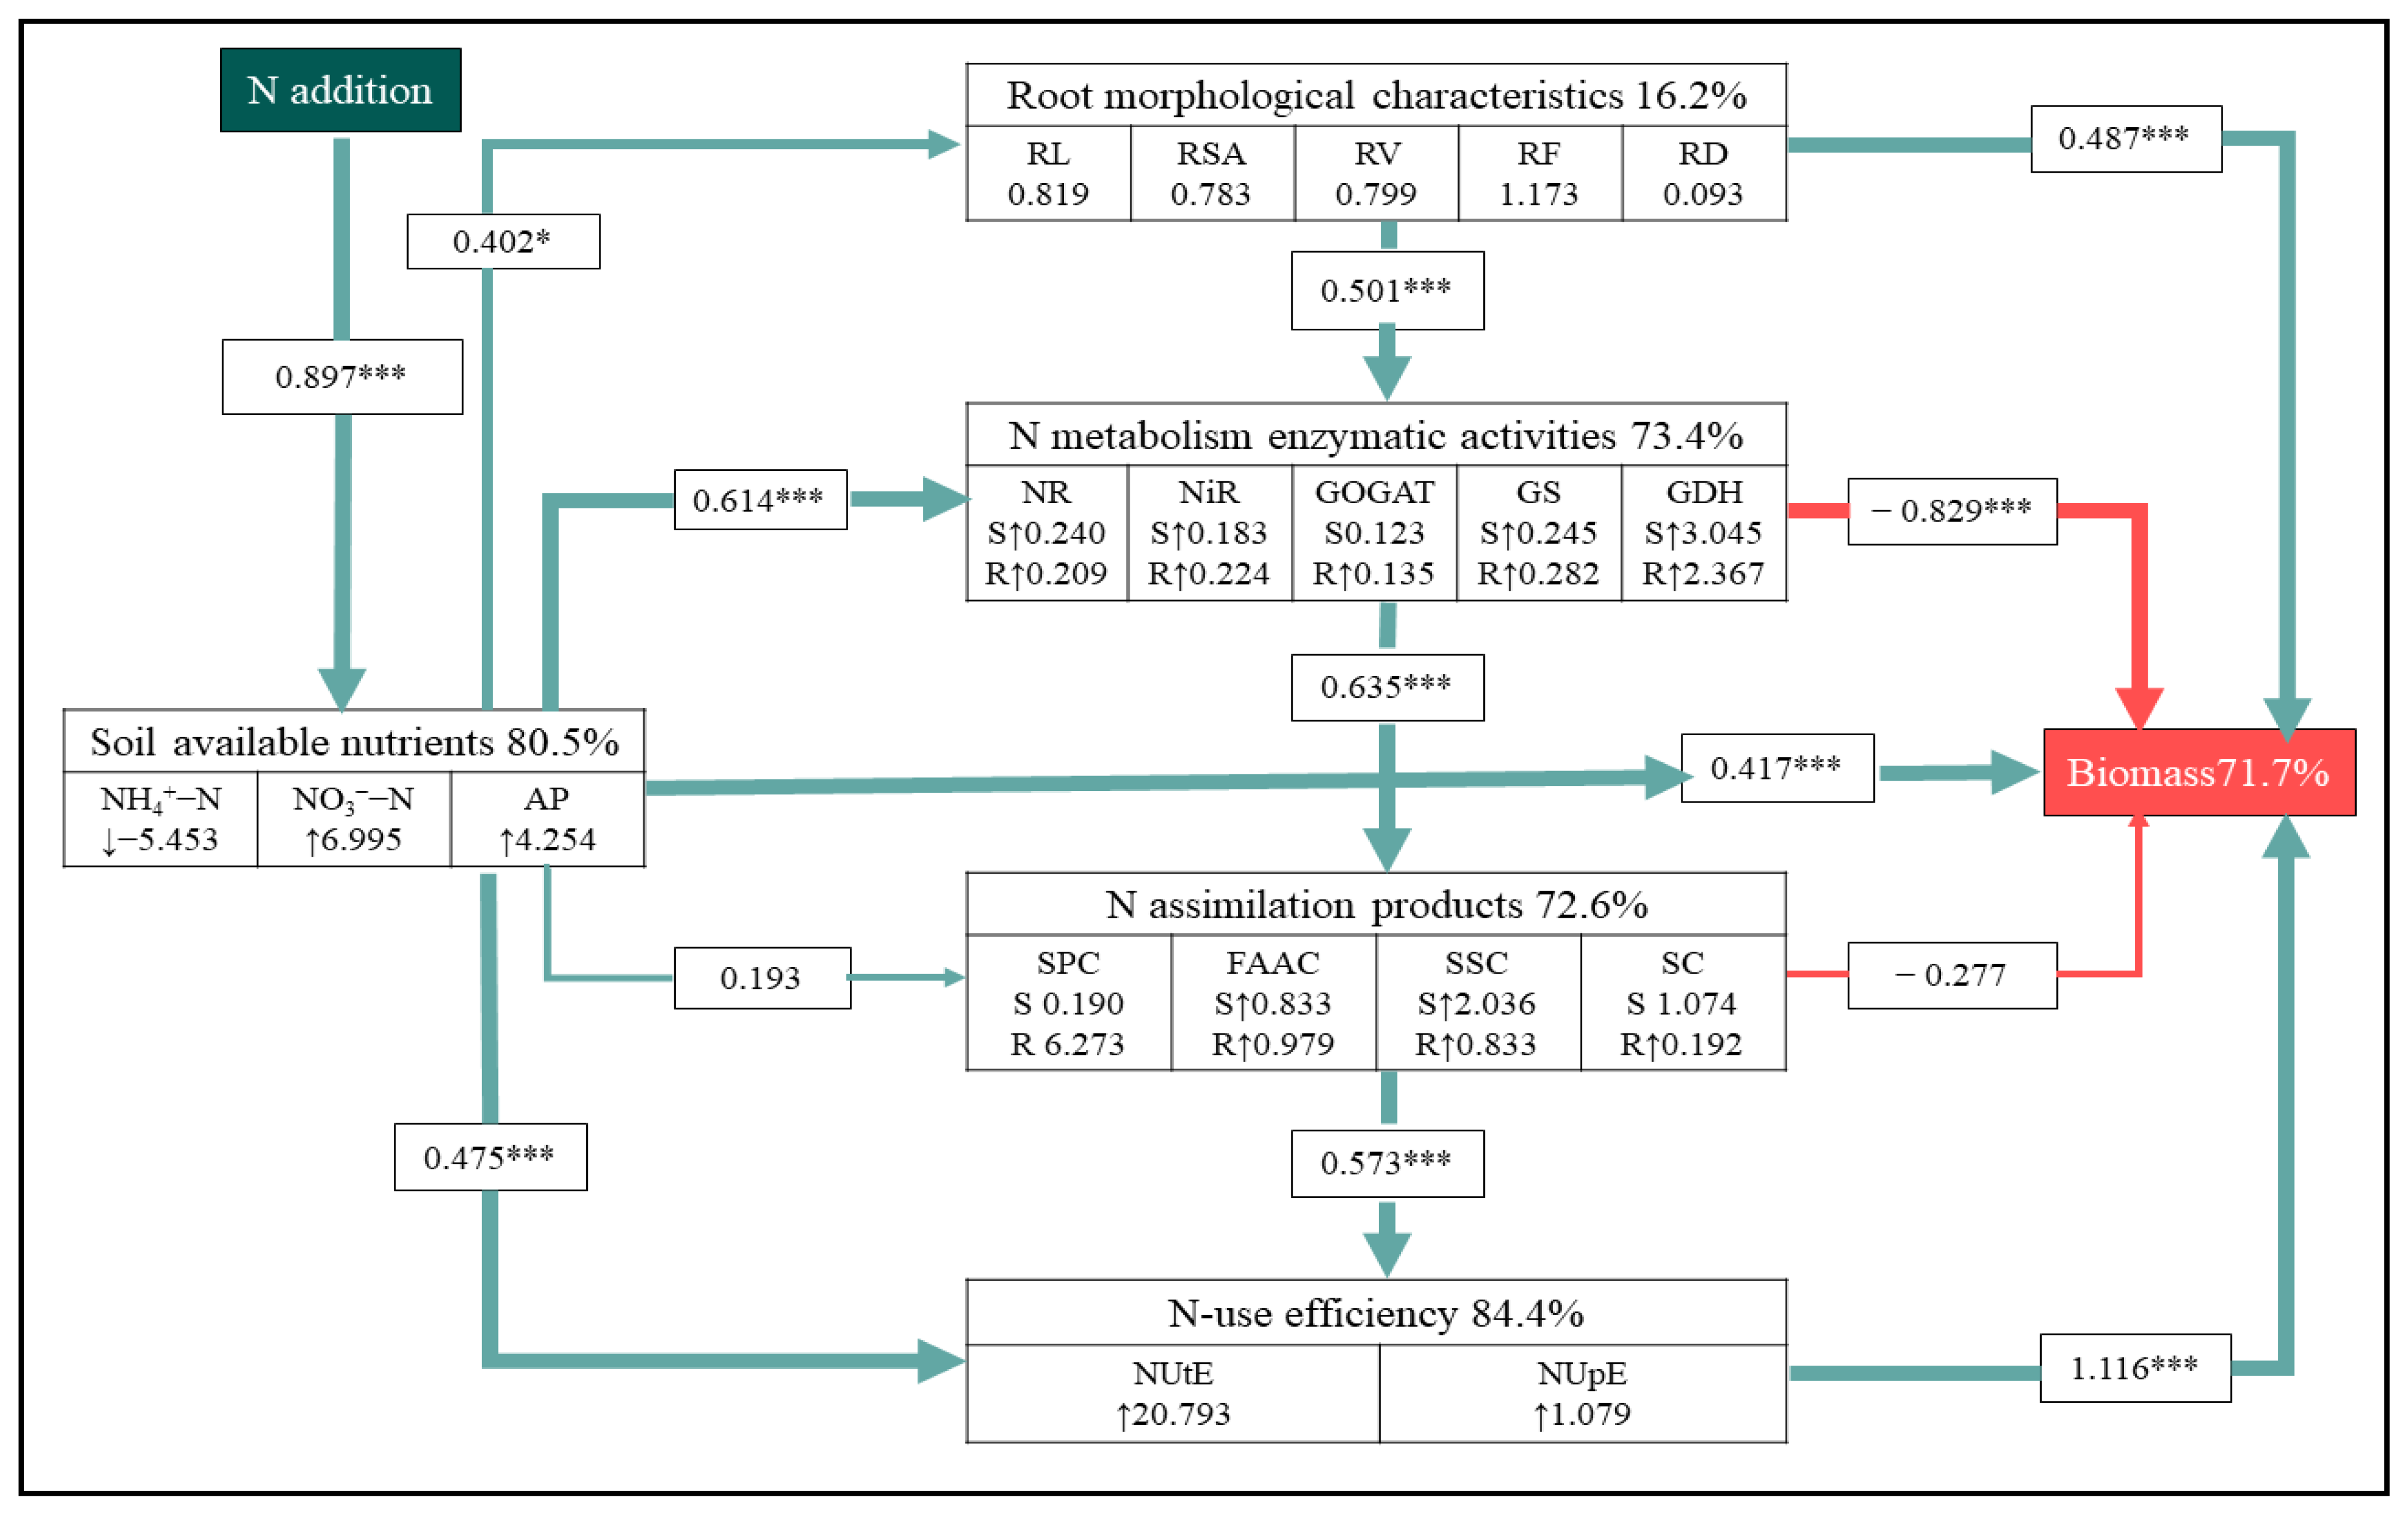
The result of SEM showed direct N-induced changes in soil available nutrients with an indirect impact on the biomass of A. mongolicum via the regulation of root morphological traits and NUE (Figure 6 and Figure S7). This model showed that N addition directly explained 80.50% of the variance in the soil available nutrients. In accordance with the results of ANOVA (Table 1), N addition had positive effects on soil NO3−-N and AP concentration (Table 1). It also showed that soil nutrient availability pathways, root morphological characteristic, N metabolism enzymatic activity, N assimilation product, and NUE together explained 71.70% of the total variance in biomass. These all had a strong direct effect on biomass. Additionally, soil-available nutrients contributed up to 16.20% and 84.40% of the biomass by influencing the root morphological characteristic and NUE, indicating that soil-available nutrients also had an indirect positive effect on biomass.

Figure 6.
Structural equation model of the effects of N addition on biomass of A. mongolicum. Green solid arrows and red solid arrows indicate positive and negative effects, respectively. The standardized path coefficients are adjacent to the arrows and indicate the size of this effect. The symbols ↑ and ↓ denote a significant increase and decrease (p < 0.05), respectively, in response to N addition. The letters S and R indicate the responses of shoots and roots to N addition, respectively. The numbers included in variables represent the slope of the linear model of each index with increasing N addition rates as a continuous predictor. The percentages beside the response variables refer to the proportion of variance explained by the model (R2). * and *** indicate statistically significant at p < 0.05, p < 0.01, and p < 0.001, respectively. Model fit: χ2 = 2.292, p = 0.994, GFI = 0.969, RMSEA < 0.001. This section may be divided by subheadings.
4. Discussion
The N saturation threshold is defined as the point when N availability exceeds plant N demand under continuous N enrichment. This threshold has been widely considered with signals of plant growth (biomass) responses to N enrichment [8,35]. Previous studies have shown that N addition has a positive effect on plant biomass, but this effect will decrease and even diminish when the N inputs surpass the N saturation threshold [32,36,37]. In this study, the low-N addition increased the root and shoot biomass of A. mongolicum, but both of them decreased under high-N addition (Figure 1), although no significant effects of N addition on the root biomass or total biomass exhibited a unimodal response to the increasing N addition gradient, with an N saturation threshold of 3.20 g N m−2 yr−1 (Figure 1), which was in agreement with this study’s initial hypothesis and consistent with previous studies [3,32]. The N saturation in dose was comparable with the value of 5–6 g N m−2 yr−1 in Tian et al. [36], but less than the 10.5 g N m−2 yr−1 reported by Bai et al. [3]. This was mainly attributed to the differences in biotic and abiotic conditions that plants experienced under laboratory and field conditions [38]. Compared with the field observations, species in the lab would not be subject to competition from other species for nutrients but may be limited by other resources such as light and phosphorus [39]. Thus, to accurately estimate the responses of plant biomass to N addition in the lab, more abiotic and biotic factors should be collectively considered in future studies.
N effects on plant growth can be directly affected by soil nutrient availability [9,34]. As Bowman et al. [8] and Deng et al. [9] reported that a small amount of N addition promoted plant growth mainly due to the increase in soil-available N and P. In this study, soil NO3−-N and AP increased with the increasing N addition, but high levels of N addition significantly decreased soil pH and increased soil N:P ratios (Table 1). Since the rise of soil acidification with high levels of N addition could result in the N-induced increase in P availability, it was insufficient to balance the increasing plant P demand, and then suppressed plant growth [9,40,41]. Furthermore, in our study, the soil N:P ratio was significantly negatively correlated with pH and significantly positively correlated with biomass of A. mongolicum (Figure S8), implying that responses of A. mongolicum to N addition affected by changes in P availability. Taken together, our results also partly supported that high N-induced soil acidification resulting in phosphorus limitation are responsible for the nonlinear responses of plant biomass to N addition.
Plant roots display high plasticity in response to diverse nutrient fluctuations. A remarkable level of variation in root morphology was observed in this study (Figure 2): low-N addition promoted RL, RSA, RV, and RF of A. mongolicum but decreased significantly at a higher N supply (Table 1), indicating that N availability alters root morphological traits, consistent with the findings reported in previous studies [10,19]. For instance, a previous study found that elevated N concentration increased RL and RS, but reduced the specific root length (SRL) and specific root surface (SRS) of Tanzania Guinea grass [42]. This change resulted from the limitation in other resources (i.e., carbohydrates) when the nutrients in the soil, especially N, was massively supplied [20,42]. Root morphological traits can influence plant dry matter accumulation by directly increasing plant nutrient absorption and indirectly affecting NUE by altering RL and RSA [42,43]. Our results showed that the total biomass of A. mongolicum was significantly affected by root morphological traits following N addition (Figure 6), which we confirmed with linear regressions between biomass and RL, RSA, RV, and RF (Figure 2). These results indicated that A. mongolicum supplied with external N will tend to have a well-developed root system that is more efficient in absorbing nutrients and promotes plant growth.
Plant growth adaptation to N fluctuations is paralleled by the adjustment of N in the biochemistry process [10,20]. N-induced changes in NUE can be regarded as potential mechanisms interpreting the responses of plants to N addition [19]. The NO3– absorbed by the root system is converted to ammonium by NR and NiR and then is assimilated to Gln and Glu via the activities of GS and GOGAT [20]. Alterations in N-metabolism-related enzyme activities under different N levels cause the discrepant absorption and formation of N-containing compounds [44] and finally affect NUE [19]. In the present study, the increase in NR, NiR, GS, GOGAT, and GDH at low N addition rates and decrease at high N addition rates were observed in the roots and shoots of A. mongolicum (Figure 3); a similar response had also been found in the N-containing compounds (Figure 4). In addition, our results showed that N addition altered NUE, and specifically, excess N addition significantly decreased the NUpE and NUtE (Figure 5). These indicated that the response of A. mongolicum to N addition was affected by NUE. The phenomenon has been widely considered as one of the most important mechanisms underlying the effects of N deposition on plant productivity [19,42]. Cotton and rice exposed to low-N conditions, resulted in increasing NUpE and NUtE in shoots and roots, respectively. Higher NUEs were positively correlated with higher yield [19,21]. The results from SEM analyses showed that N addition generated a significant indirect effect on biomass via the NUE pathway (Figure 6). Meanwhile, linear regression also demonstrated well-correlated relationships between the biomass and NUE (Figure 6). Therefore, the lower NUE, as evidenced by declining N metabolism and assimilation at high N addition rates, could explain the growth response of A. mongolicum to N addition.
5. Conclusions
The current study showed that A. mongolicum grew in response to increasing N addition rates and that growth was unimodal-shaped, with a N saturation threshold at 3.20 g N m−2 yr−1. The effect of N-induced changes in soil available nutrients on the total biomass A. mongolicum was related to root morphological traits and N-use efficiency. These findings highlight the N saturation threshold for A. mongolicum as conductive for protecting native species survival and ecosystem services in nutrient-limited desert grassland, and the importance of root morphological traits and NUE in regulating biomass production can provide valuable insights for future breeding and cultivation studies in A. mongolicum Keng.
Supplementary Materials
The following supporting information can be downloaded at: https://www.mdpi.com/article/10.3390/agronomy12051146/s1, Figure S1: Species-sample bi-plot of Principal Component Analysis (PCA) of soil available nutrients; Figure S2: Species-sample bi-plot of Principal Component Analysis (PCA) of root morphological characteristics; Figure S3: Species-sample bi-plot of Principal Component Analysis (PCA) of N metabolism enzymatic activities; Figure S4: Species-sample bi-plot of Principal Component Analysis (PCA) of N assimilation products; Figure S5: Species-sample bi-plot of Principal Component Analysis (PCA) of N-use efficiency; Figure S6: Total biomass of A. mongolicum in response to N addition treatments; Figure S7: The standardized total and direct effect size of each variable on the biomass of A. mongolicum; Figure S8: The relationship between soil pH and soil N:P ratio (a), and relationship between biomass of A. mongolicum Keng and soil N:P ratio (b); Table S1: Model selection of the response of total biomass of A. mongolicum to the increase of nitrogen addition.
Author Contributions
Conceptualization, A.X., B.C. and D.X.; methodology, A.X. and B.C.; formal analysis, A.X. and B.C.; investigation, A.X., X.W. (Xing Wang) and X.W. (Xiaojia Wang); resources, A.X.; data curation, A.X.; writing—original draft preparation, A.X.; writing—review and editing, B.C. and D.X.; supervision, A.X. and B.C.; visualization, D.X. and B.C.; project administration, B.C.; funding acquisition, B.C. All authors have read and agreed to the published version of the manuscript.
Funding
This work was funded by the Top Discipline Construction Project of Pratacultural Science (Project No. NXYLXK2017A01) and the National Key Research and Development Projects of China (Nos. 2017YFC0504402 and 2016YFC0500505).
Data Availability Statement
The data presented in this study are available in Supplementary Material.
Acknowledgments
We gratefully acknowledge Xiaobo Yuan from the College of Pastoral Agriculture Science and Technology, Lanzhou University, for his support in data analysis.
Conflicts of Interest
The authors declare no conflict of interest.
References
- Galloway, J.N.; Townsend, A.R.; Erisman, J.W.; Bekunda, M.; Cai, Z.; Freney, J.R.; Martinelli, L.A.; Seitzinger, S.P.; Sutton, M.A. Transformation of the nitrogen cycle: Recent trends, questions, and potential solutions. Science 2008, 320, 889–892. [Google Scholar] [CrossRef] [PubMed] [Green Version]
- Zhao, Y.N.; Yang, B.; Li, M.X.; Xiao, R.Q.; Rao, K.Y.; Wang, J.Q.; Zhang, T.; Guo, J.X. Community composition, structure and productivity in response to nitrogen and phosphorus additions in a temperate meadow. Sci. Total Environ. 2019, 654, 863–871. [Google Scholar] [CrossRef] [PubMed]
- Bai, Y.F.; Wu, J.G.; Clark, C.M.; Naeem, S.; Pan, Q.M.; Huang, J.H.; Zhang, L.X.; Han, X.G. Tradeoffs and thresholds in the effects of nitrogen addition on biodiversity and ecosystem functioning: Evidence from inner Mongolia Grasslands. Glob. Chang. Biol. 2010, 16, 358–372. [Google Scholar] [CrossRef]
- Bai, Y.X.; She, W.W.; Zhang, Y.Q.; Qiao, Y.G.; Fu, J.; Qin, S.G. N enrichment, increased precipitation, and the effect of shrubs collectively shape the plant community in a desert ecosystem in northern China. Sci. Total Environ. 2020, 716, 135379. [Google Scholar] [CrossRef]
- Li, G.Q.; Zhao, P.; Shao, W.S.; Jin, C.Q.; Song, L.X.; Chen, Y.Y. Effect of enclosure on reproductive allocation of wheatgrass Agropyron mongolicum populations in desert steppes. Ecol. Evol. 2019, 9, 14023–14030. [Google Scholar] [CrossRef] [Green Version]
- Zhao, Y.; Gao, C.P.; Shi, F.L.; Yun, L.; Jia, Y.S.; Wen, J.Q. Transcriptomic and proteomic analyses of drought responsive genes and proteins in Agropyron mongolicum Keng. Curr. Plant Biol. 2018, 14, 19–29. [Google Scholar] [CrossRef]
- Yuan, Z.Y.; Chen, H.Y.H. Decoupling of nitrogen and phosphorus in terrestrial plants associated with global changes. Nat. Clim. Chang. 2015, 5, 465–469. [Google Scholar] [CrossRef]
- Bowman, W.D.; Murgel, J.; Blett, T.; Porter, E. Nitrogen critical loads for alpine vegetation and soils in Rocky Mountain National Park. J. Environ. Manag. 2012, 103, 165–171. [Google Scholar] [CrossRef]
- Deng, Q.; Hui, D.F.; Dennis, S.; Reddy, K.C. Responses of terrestrial ecosystem phosphorus cycling to nitrogen addition: A meta-analysis. Glob. Ecol. Biogeogr. 2017, 26, 713–728. [Google Scholar] [CrossRef]
- Luo, J.; Zhou, J.J.; Masclaux-Daubresse, C.; Wang, N.; Wang, H.; Zheng, B. Morphological and physiological responses to contrasting nitrogen regimes in Populus cathayana is linked to resources allocation and carbon/nitrogen partition. Environ. Exp. Bot. 2019, 162, 247–255. [Google Scholar] [CrossRef]
- Wang, X.; Guo, X.; Yu, Y.; Cui, H.; Wang, R.Q.; Guo, W.H. Increased nitrogen supply promoted the growth of non-N-fixing woody legume species but not the growth of N-fixing Robinia pseudoacacia. Sci. Rep. 2018, 8, 17896. [Google Scholar] [CrossRef]
- Yang, H.; Li, Y.; Wu, M.; Zhang, Z.H.E.; Li, L.; Wan, S. Plant community responses to nitrogen addition and increased precipitation: The importance of water availability and species traits. Glob. Chang. Biol. 2011, 17, 2936–2944. [Google Scholar] [CrossRef]
- Chen, G.T.; Tu, L.H.; Peng, Y.; Hu, H.L.; Hu, T.X.; Xu, Z.F.; Liu, L.; Tang, Y. Effect of nitrogen additions on root morphology and chemistry in a subtropical bamboo forest. Plant Soil 2016, 412, 441–451. [Google Scholar] [CrossRef]
- Zhang, X.Y.; Wang, W.W. The decomposition of fine and coarse roots: Their global patterns and controlling factors. Sci. Rep. 2015, 5, 9940. [Google Scholar] [CrossRef] [PubMed]
- Zhang, H.; Xue, Y.G.; Wang, Z.Q.; Yang, J.C.; Zhang, J.H. Morphological and physiological traits of roots and their relationships with shoot growth in “super” rice. Field Crops Res. 2009, 113, 31–40. [Google Scholar] [CrossRef]
- Qi, W.Z.; Liu, H.H.; Liu, P.; Dong, S.; Zhao, B.Q.; So, H.B.; Li, G.; Liu, H.D.; Zhang, J.W.; Zhao, B. Morphological and physiological characteristics of corn (Zea mays L.) roots from cultivars with different yield potentials. Eur. J. Agron. 2012, 38, 54–63. [Google Scholar] [CrossRef]
- Hu, J.; Gettel, G.; Fan, Z.B.; Lv, H.F.; Zhao, Y.M.; Yu, Y.L.; Wang, J.G.; Butterbach-Bahl, K.; Li, G.Y.; Lin, S. Drip fertigation promotes water and nitrogen use efficiency and yield stability through improved root growth for tomatoes in plastic greenhouse production. Agric. Ecosyst. Environ. 2021, 313. [Google Scholar] [CrossRef]
- Li, B.H.; Li, G.J.; Kronzucker, H.J.; Baluska, F.; Shi, W.M. Ammonium stress in Arabidopsis: Signaling, genetic loci, and physiological targets. Trends Plant Sci. 2014, 19, 107–114. [Google Scholar] [CrossRef]
- Asif, I.; Dong, Q.; Wang, Z.; Wang, X.R.; Gui, H.P.; Zhang, H.H.; Pang, N.C.; Zhang, X.L.; Song, M.Z. Growth and nitrogen metabolism are associated with nitrogen-use efficiency in cotton genotypes. Plant Physiol. Biochem. 2020, 149, 61–74. [Google Scholar] [CrossRef]
- Xu, G.H.; Fan, X.R.; Miller, A.J. Plant nitrogen assimilation and use efficiency. Annu. Rev. Plant Biol. 2012, 63, 153–182. [Google Scholar] [CrossRef] [Green Version]
- Ju, C.X.; Buresh, R.J.; Wang, Z.Q.; Zhang, H.; Liu, L.J.; Yang, J.C.; Zhang, J.H. Root and shoot traits for rice varieties with higher grain yield and higher nitrogen use efficiency at lower nitrogen rates application. Field Crops Res. 2015, 175, 47–55. [Google Scholar] [CrossRef]
- Liu, Y.; Yang, M.; Yao, C.S.; Zhou, X.N.; Li, W.; Zhang, Z.; Gao, Y.M.; Sun, Z.C.; Wang, Z.M.; Zhang, Y.H. Optimum Water and Nitrogen Management Increases Grain Yield and Resource Use Efficiency by Optimizing Canopy Structure in Wheat. Agronomy 2021, 11, 441. [Google Scholar] [CrossRef]
- Liu, X.J.; Zhang, Y.; Han, W.X.; Tang, A.H.; Shen, J.L.; Cui, Z.L.; Vitousek, P.; Erisman, J.W.; Goulding, K.; Christie, P.; et al. Enhanced nitrogen deposition over China. Nature 2013, 494, 459–462. [Google Scholar] [CrossRef] [PubMed]
- Bradford, M.M. A rapid and sensitive method for the quantitation of microgram quantities of protein utilizing the principle of protein-dye binding. Anal. Biochem. 1976, 72, 248–254. [Google Scholar] [CrossRef]
- Yokoyama, S.; Hiramatsu, J.I. A modified ninhydrin reagent using ascorbic acid instead of potassium cyanide. J. Biosci. Bioeng. 2003, 95, 204–205. [Google Scholar] [CrossRef]
- He, J.L.; Ma, C.F.; Ma, Y.L.; Li, H.; Kang, J.Q.; Liu, T.X.; Polle, A.; Peng, C.H.; Luo, Z.B. Cadmium tolerance in six poplar species. Environ. Sci. Pollut. Res. Int. 2013, 20, 163–174. [Google Scholar] [CrossRef]
- Yuan, X.B.; Niu, D.C.; Gherardi, L.A.; Liu, Y.B.; Wang, Y.; Elser, J.J.; Fu, H. Linkages of stoichiometric imbalances to soil microbial respiration with increasing nitrogen addition: Evidence from a long-term grassland experiment. Soil Biol. Biochem. 2019, 138, 107580. [Google Scholar] [CrossRef]
- Abenavoli, M.R.; Longo, C.; Lupini, A.; Miller, A.J.; Araniti, F.; Mercati, F.; Princi, M.P.; Sunseri, F. Phenotyping two tomato genotypes with different nitrogen use efficiency. Plant Physiol. Biochem. 2016, 107, 21–32. [Google Scholar] [CrossRef]
- Siddiqi, M.Y.; Glass, A.D.M. Utilization index: A modified approach to the estimation and comparison of nutrient utilization efficiency in plants. J. Plant Nutr. 1981, 4, 289–302. [Google Scholar] [CrossRef]
- Sánchez Rodríguez, E.; Rubio Wilhelmi, M.M.; Blasco, B.; Constán Aguilar, C.; Romero, L.; Ruiz, J.M. Variation in the use efficiency of N under moderate water deficit in tomato plants (Solanum lycopersicum) differing in their tolerance to drought. Acta Physiol. Plant. 2011, 33, 1861–1865. [Google Scholar] [CrossRef]
- Elliot George, C.; Lauchli, A. Phosphorus Efficiency and Phosphate-Iron Interaction in Maize. Agron. J. 1985, 77, 399–403. [Google Scholar] [CrossRef]
- Zong, N.; Shi, P.L.; Song, M.H.; Zhang, X.Z.; Jiang, J.; Chai, X. Nitrogen Critical Loads for an Alpine Meadow Ecosystem on the Tibetan Plateau. Environ. Manag. 2016, 57, 531–542. [Google Scholar] [CrossRef] [PubMed]
- Zhang, J.Y.; Ai, Z.M.; Liang, C.T.; Wang, G.L.; Liu, G.B.; Xue, S. How microbes cope with short-term N addition in a Pinus tabuliformis forest-ecological stoichiometry. Geoderma 2019, 337, 630–640. [Google Scholar] [CrossRef]
- Yuan, X.B.; Niu, D.C.; Weber-Grullon, L.; Fu, H. Nitrogen deposition enhances plant-microbe interactions in a semiarid grassland: The role of soil physicochemical properties. Geoderma 2020, 373, 114446. [Google Scholar] [CrossRef]
- Aber, J.; McDowell, W.; Nadelhoffer, K.; Magill, A.; Berntson, G.; Kamakea, M.; Fernandez, I. Nitrogen Saturation in Northern Forest Ecosystems:hypotheses revisited. BioScience 1989, 11, 921–934. [Google Scholar] [CrossRef]
- Tian, D.S.; Wang, H.; Sun, J.; Niu, S.L. Global evidence on nitrogen saturation of terrestrial ecosystem net primary productivity. Environ. Res. Lett. 2016, 11. [Google Scholar] [CrossRef] [Green Version]
- Regni, L.; Proietti, P. Effects of Nitrogen Foliar Fertilization on the Vegetative and Productive Performance of the Olive Tree and on Oil Quality. Agriculture 2019, 9, 252. [Google Scholar] [CrossRef] [Green Version]
- Xu, X.; Yan, L.; Xia, J. A threefold difference in plant growth response to nitrogen addition between the laboratory and field experiments. Ecosphere 2019, 10, e02572. [Google Scholar] [CrossRef]
- Poorter, H.; Fiorani, F.; Pieruschka, R.; Wojciechowski, T.; Putten, W.H.v.d.; Kleyer, M.; Schurr, U.; Postma, J. Pampered inside, pestered outside? Differences and similarities between plants growing in controlled conditions and in the field. New Phytol. 2016, 212, 838–855. [Google Scholar] [CrossRef]
- Gong, X.Y.; Chen, Q.; Dittert, K.; Taube, F.; Lin, S. Nitrogen, phosphorus and potassium nutritional status of semiarid steppe grassland in Inner Mongolia. Plant Soil 2010, 340, 265–278. [Google Scholar] [CrossRef]
- Li, Y.; Niu, S.L.; Yu, G.R. Aggravated phosphorus limitation on biomass production under increasing nitrogen loading: A meta-analysis. Glob. Chang. Biol. 2016, 22, 934–943. [Google Scholar] [CrossRef] [PubMed]
- Dupas, E.; Monteiro, F.A. Nitrogen and potassium, but not boron, change the morphology, production and nutrient concentration of Tanzania guineagrass roots. J. Plant Nutr. 2018, 41, 2222–2231. [Google Scholar] [CrossRef]
- Jiang, S.Y.; Sun, J.Y.; Tian, Z.W.; Hu, H.; Michel, E.J.S.; Gao, J.W.; Jiang, D.; Cao, W.X.; Dai, T.B. Root extension and nitrate transporter up-regulation induced by nitrogen deficiency improves nitrogen status and plant growth at the seedling stage of winter wheat (Triticum aestivum L.). Environ. Exp. Bot. 2017, 141, 28–40. [Google Scholar] [CrossRef]
- Wang, Q.; Liu, C.H.; Huang, D.; Dong, Q.L.; Li, P.M.; van Nocker, S.; Ma, F.W. Physiological evaluation of nitrogen use efficiency of different apple cultivars under various nitrogen and water supply conditions. J. Integr. Agric. 2020, 19, 709–720. [Google Scholar] [CrossRef]


Publisher’s Note: MDPI stays neutral with regard to jurisdictional claims in published maps and institutional affiliations. |
© 2022 by the authors. Licensee MDPI, Basel, Switzerland. This article is an open access article distributed under the terms and conditions of the Creative Commons Attribution (CC BY) license (https://creativecommons.org/licenses/by/4.0/).