1. Introduction
Corn is the largest food crop in China, which plays an important role in the ternary structure of grain, the economy and feed [
1,
2,
3,
4]. Harvest is one of the important links in the corn production process [
5,
6,
7]. With the improvement of corn varieties and the development of harvesting technology, the corn combined harvesting method has developed rapidly. The operating parameters of a corn combine harvester cleaning system directly affect the cleaning loss rate and impurity rate [
8,
9,
10]. At present, corn combine harvesters lack a real-time and accurate monitoring system for cleaning loss information. In the actual operation process, the machine cannot adjust the appropriate working parameters of threshing and cleaning mechanism in real time according to the working conditions, meaning that it can only be adjusted intermittently according to artificial experience.
In the cleaning process, recognizing lost corn kernels is the premise and basis to realize the real-time monitoring of cleaning loss information [
11,
12,
13]. The recognition methods for the loss of grain kernels mainly include impacting sound signals, image processing and impacting piezoelectric signals [
14,
15,
16,
17]. The sound signal recognition method mainly uses a high-sensitivity microphone to collect the sound signals generated by grain kernels and impurities impacting sensitive plate. However, during the harvesting operation, the strong noise from mechanical vibration and the surroundings interferes with the weak sound signals, which affects the recognition accuracy [
18]. The image processing recognition method is affected by the dust generated in the working environment, resulting in poor image quality, and thus this technique is still in the laboratory research stage [
19,
20,
21].
At present, using the impacting piezoelectric signal recognition method is a hot research topic for loss monitoring, and is widely used in rice and other crops [
22]. This method distinguishes kernels and impurities based on peak values or specific frequency impacting signals [
23,
24,
25]. Since the impacting signal characteristic of corn kernels and impurities are similar, some scholars use support vector machine (SVM) method to preprocess impacting signals and then judge the number of lost kernels [
26]. However, this method possesses the problems of high requirements for system hardware and a time-consuming analysis process [
27].
In this paper, in order to solve the problem of the time-consuming signal analysis process and low recognition accuracy in corn combine harvesters, this paper analyzes the impacting signals of corn kernels and impurities using the spectrum method to obtain the distinguishing characteristics from two impacting signals. In addition, on the basis of the conventional hardware signal processing circuit, the software judgment program for the holding time of the output square wave signal is added to improve the accuracy and reliability of a cleaning loss kernel recognition system for a corn combine harvester.
2. Materials and Methods
2.1. Structure and Working Principle
When the corn combine harvester works, only corn ears and bracteal leaves can enter the thresher mechanism after the action of the snapping roller. A corn ear consists of the corn kernel and corncob. After being hit by the threshing roller, the corn kernels separate from the corncob, and the corncob is also crushed [
28]. The corn harvest loss mainly includes the non-threshing loss and the cleaning loss. The non-threshing loss mainly refers to the kernels that are not separate from the corncob, which is convenient for manual observation and can be solved by adjusting the speed and gap of the threshing roller. Under the action of the vibrating screen and the pneumatic field in the cleaning mechanism, the proportion of corn kernels thrown out by the vibrating screen along with the impurities is determined as the cleaning loss. Therefore, the cleaning loss material is a mixture of corn kernels, crushed corncob and crushed bracteal leaf, as shown in
Figure 1. In this paper, crushed corncob and crushed bracteal leaf are collectively referred to as impurities.
2.2. Impacting Piezoelectric Signal Acquisition
The impacting signal acquiring mechanism is mainly composed of a frame, basic plate, anti-vibration rubber pad, sensitive plate and piezoelectric sensor, as shown in
Figure 2. The anti-vibration rubber pad can isolate the influence of machine vibration on signal interference. Since the surface area of the piezoelectric sensor is small, a sensitive plate is pasted on the piezoelectric sensor to increase the contact area, so as to increase the probability of acquiring the lost corn kernel. The sensitive plate needs a certain strength and needs to avoid the frequency close to the machine unit to avoid resonance. Through the finite element modal simulation analysis and optimization, the size of the sensitive plate is 235 mm × 120 mm × 1 mm (length × width × depth), which is made of 304 stainless steel. To increase the stiffness of the sensitive plate, the two long edges are folded at 5 mm.
The piezoelectric sensor adopts YT-5L piezoelectric ceramics produced by Baoding Yitian Technology Company, China. Its performance parameters are shown in
Table 1.
The impacting signal acquiring mechanism is installed at the end of the cleaning screen of the corn combine harvester. The lost corn kernels and impurities are expelled by the end of the cleaning screen and impact on the sensitive plate. In order to avoid the interference caused by the corn kernels and impurities repeatedly jumping on the sensitive plate, the angle of the sensitive plate to the ground is set to 45°, which was verified by tests.
2.3. Signal Analysis for Corn Kernel and Impurity
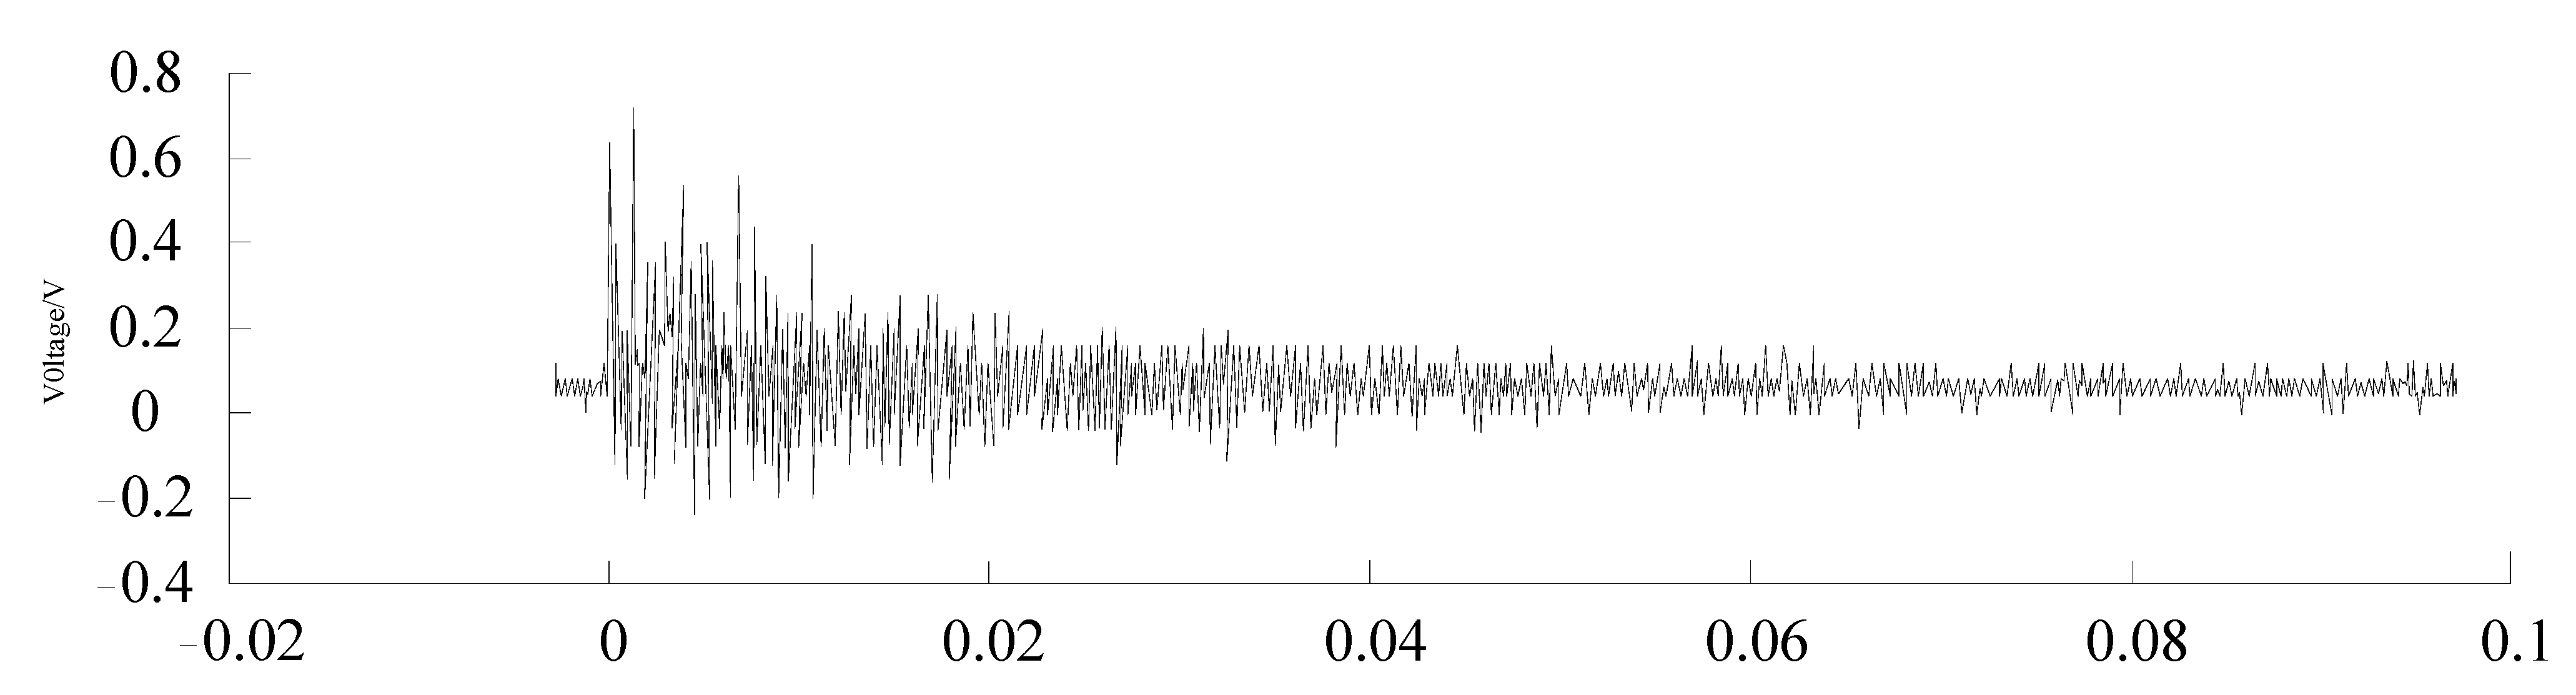
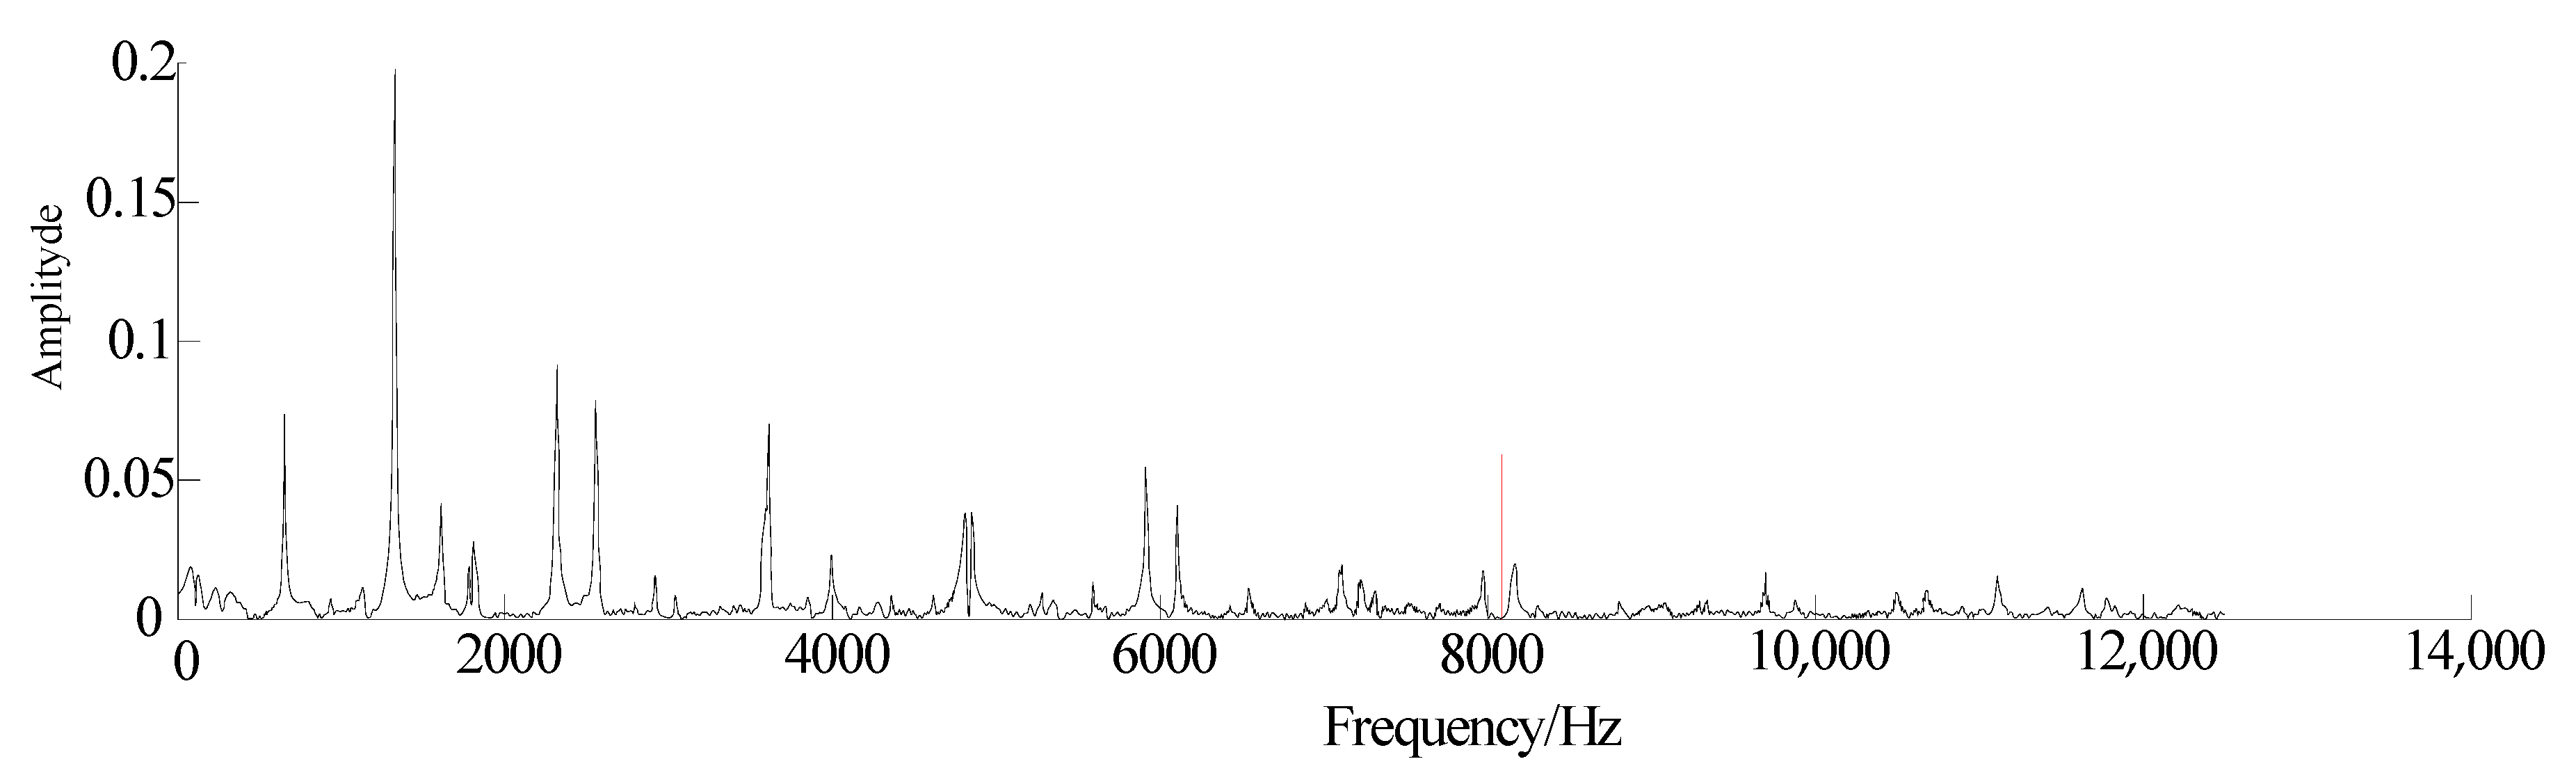
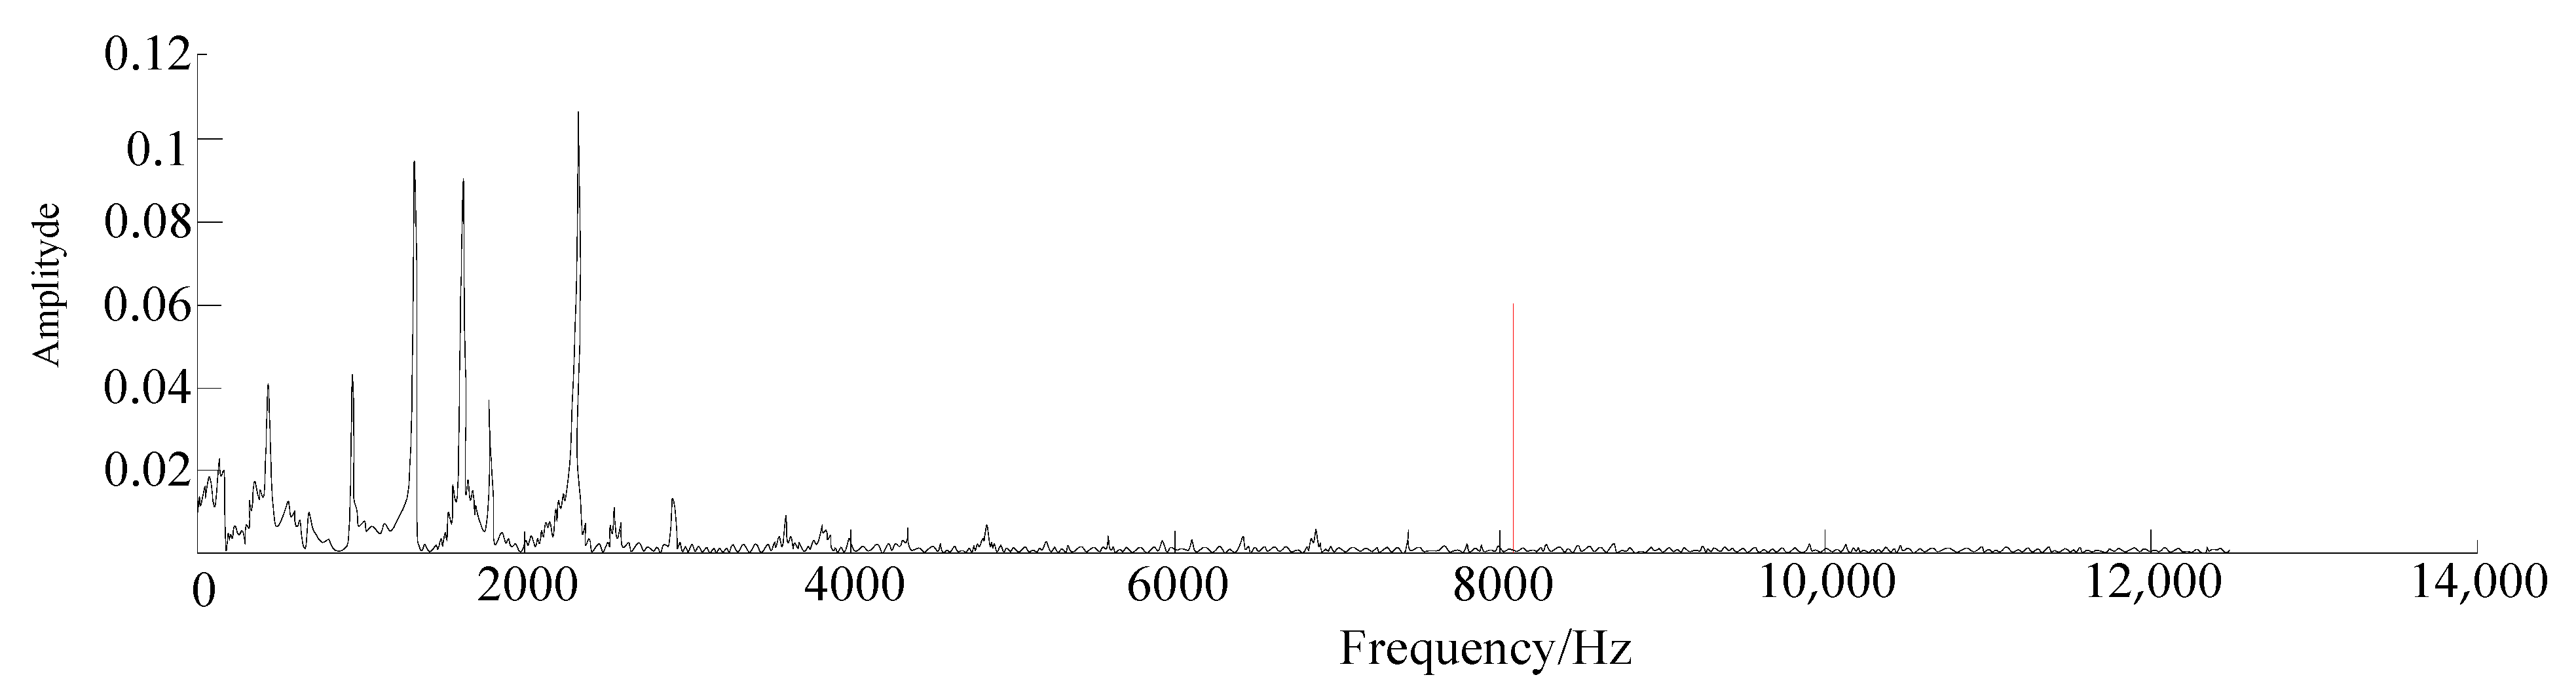
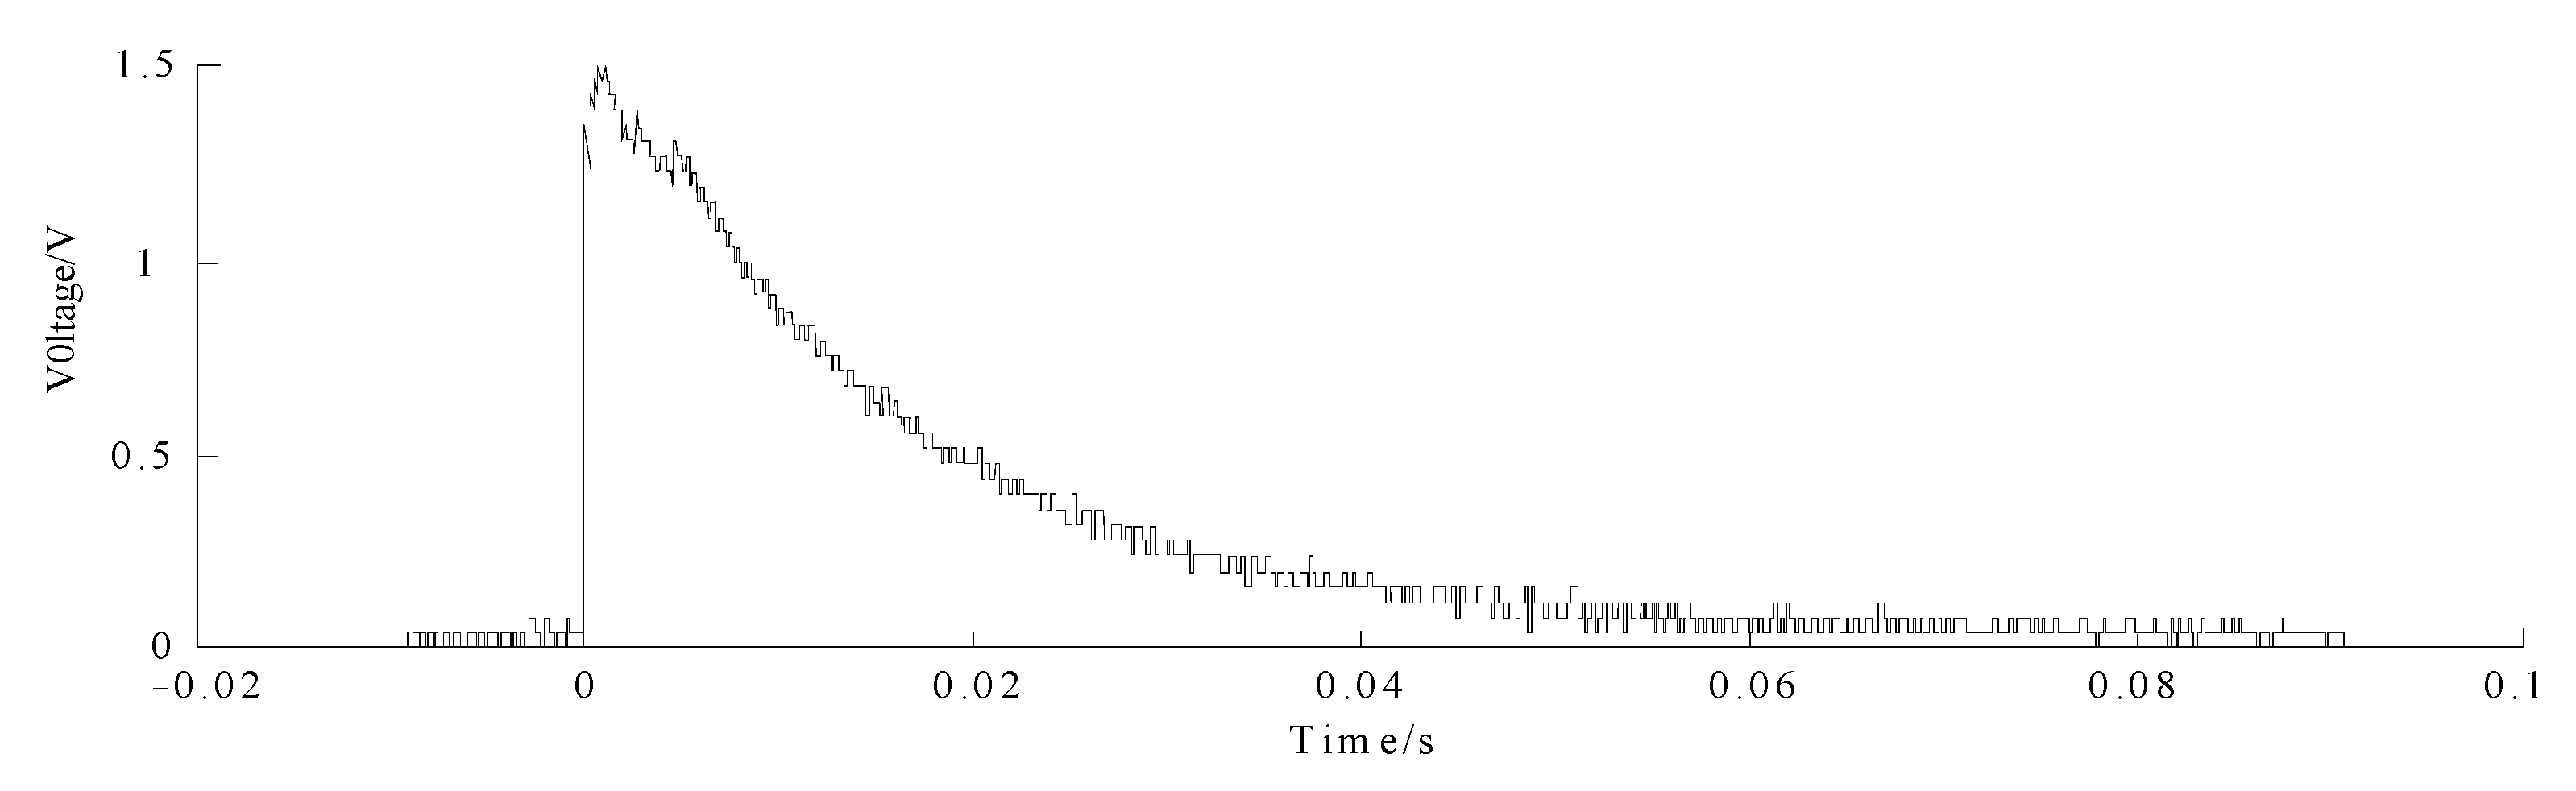
In order to explore the difference between corn kernel signals and impurity signals impacting the sensitive plate and to ensure the consistency of test conditions, corn kernels and impurities were randomly selected from the materials after threshing and cleaning and dropped from 40 cm height onto the sensitive plate. The voltage signal was generated by the piezoelectric ceramic after the material impacted the sensitive plate. The piezoelectric signals of corn kernel and impurities are shown in
Figure 3 and
Figure 4, and their time-domain signal characteristics are so similar that they cannot be distinguished. The time-domain signal of corn kernels and impurities are converted into the spectrum analysis diagram by Fourier transform, as shown in
Figure 5 and
Figure 6. It can be seen from the vibration signal generated by the corn kernels that there still existed a vibration amplitude in the frequency band greater than 8 kHz, as shown in
Figure 5. However, for the vibration signal generated by impurities, the vibration amplitude in the spectrum band greater than 8 kHz was basically zero, as shown in
Figure 6. Therefore, the high-pass filter with the cut-off frequency of about 8 kHz was used to filter out all of the vibration signals below 8 kHz and retain the vibration signals above 8 kHz, and then the reserved signals were only the vibration signals of corn kernels without impurity vibration signals, so as to realize the separation of corn kernel and impurity vibration signals.
2.4. High-Pass Filter Design
The ratio of resistance and capacitance of the high-pass filter was adjusted according to the cut-off frequency. This paper used 2-order high-pass filtration circuit, and its performance indicators include magnification and cut-off frequency, which are defined as follows:
where
A denotes magnification; f denotes cut-off frequency;
R1,
R2,
R3 and
R4 denote the resistor value in
Figure 7; and
C1 and
C2 denote the capacitance value in
Figure 7.
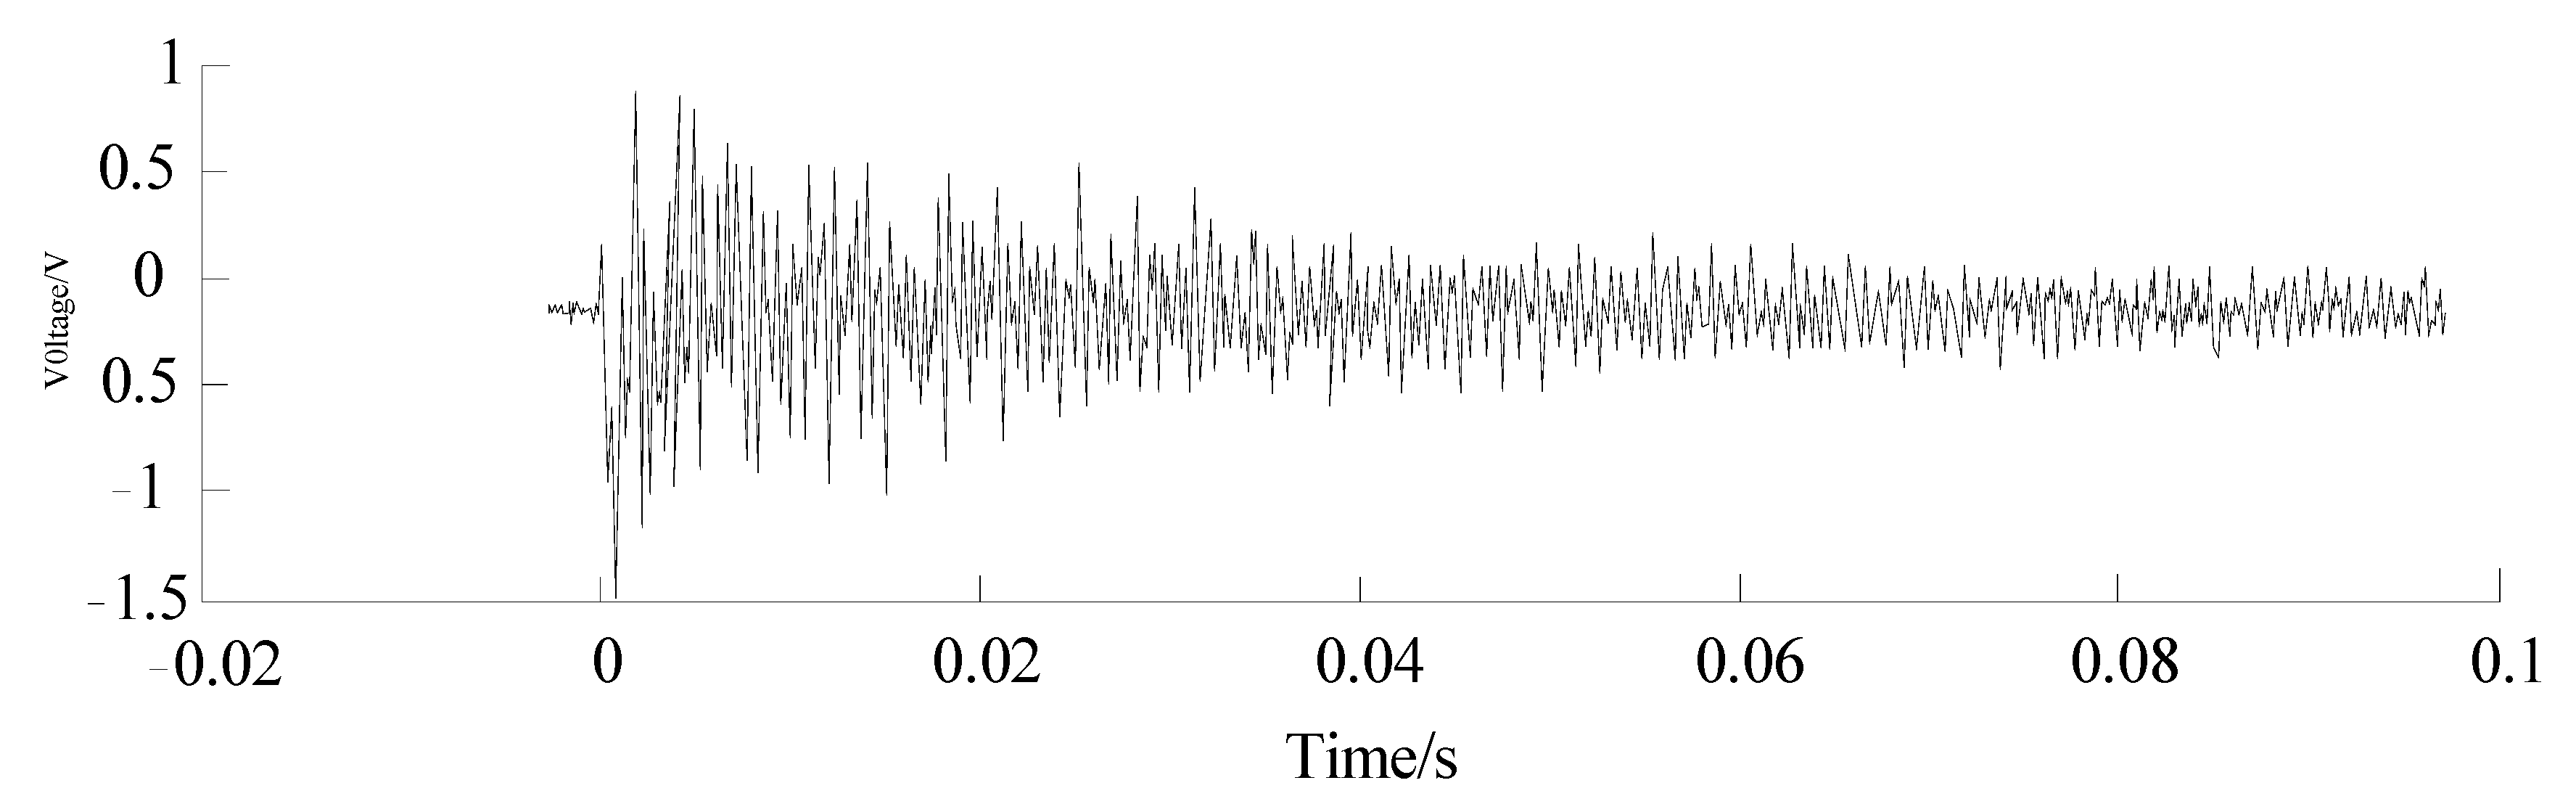
The supply voltage of the designed cleaning loss kernel recognition system is 3.3 V. The maximum amplitude of the voltage signal generated by the corn kernel and impurities is close to 1 V, so the magnification of the designed second-order high-pass filter is determined to be 3 times, so the magnification of the second-order high-pass filter is determined as 3. If the magnification is excessively large, it will enter the saturation region of the operational amplifier, and the resulting signal cannot not perform linear amplification. According to the magnification of 3, the cut-off frequency is designed as 8.7 kHz. The designed 2-order high-pass filtration circuit is shown in
Figure 7, and the corn kernel impacting signal after filtering is shown in
Figure 8.
Figure 7.
Two-order high-pass filtration circuit with a cutoff frequency of 8.7 kHz.
Figure 7.
Two-order high-pass filtration circuit with a cutoff frequency of 8.7 kHz.
Figure 8.
Corn kernel impacting signal after filtering with a cutoff frequency of 8.7 kHz.
Figure 8.
Corn kernel impacting signal after filtering with a cutoff frequency of 8.7 kHz.
2.5. Envelope Wave Detection Circuit Design
The principle of signal envelope wave detection is mainly to use the unidirectional conduction characteristics of the diode and the charging-discharging process of the detection load (RC) to complete the extraction of the modulated signal. In the design of the envelope wave detection circuit, the value selection of the resistor R and the capacitor C is difficult and needs to be debugged constantly. Generally, R is selected above 50 K, and C is selected at the nF level and above. When the value of the time constant RC is too large, the waveform slope will slow, and the duty ratio of the formed square wave signal after comparing with the reference voltage of voltage comparator will increase relatively, which easily causes the signal overlap of the formed square wave signal, the decrease in the sensor acquisition speed or the increase in the detection error. When the time constant RC is too small, the waveform will steepen, the effect of envelope detection wave is poor, and even a single kernel impact signal will produce multiple peak values above the reference voltage, thus increasing the detection error. The designed envelope detection wave circuit is shown in
Figure 9, and the signal after filtering and envelope wave detection is shown in
Figure 10.
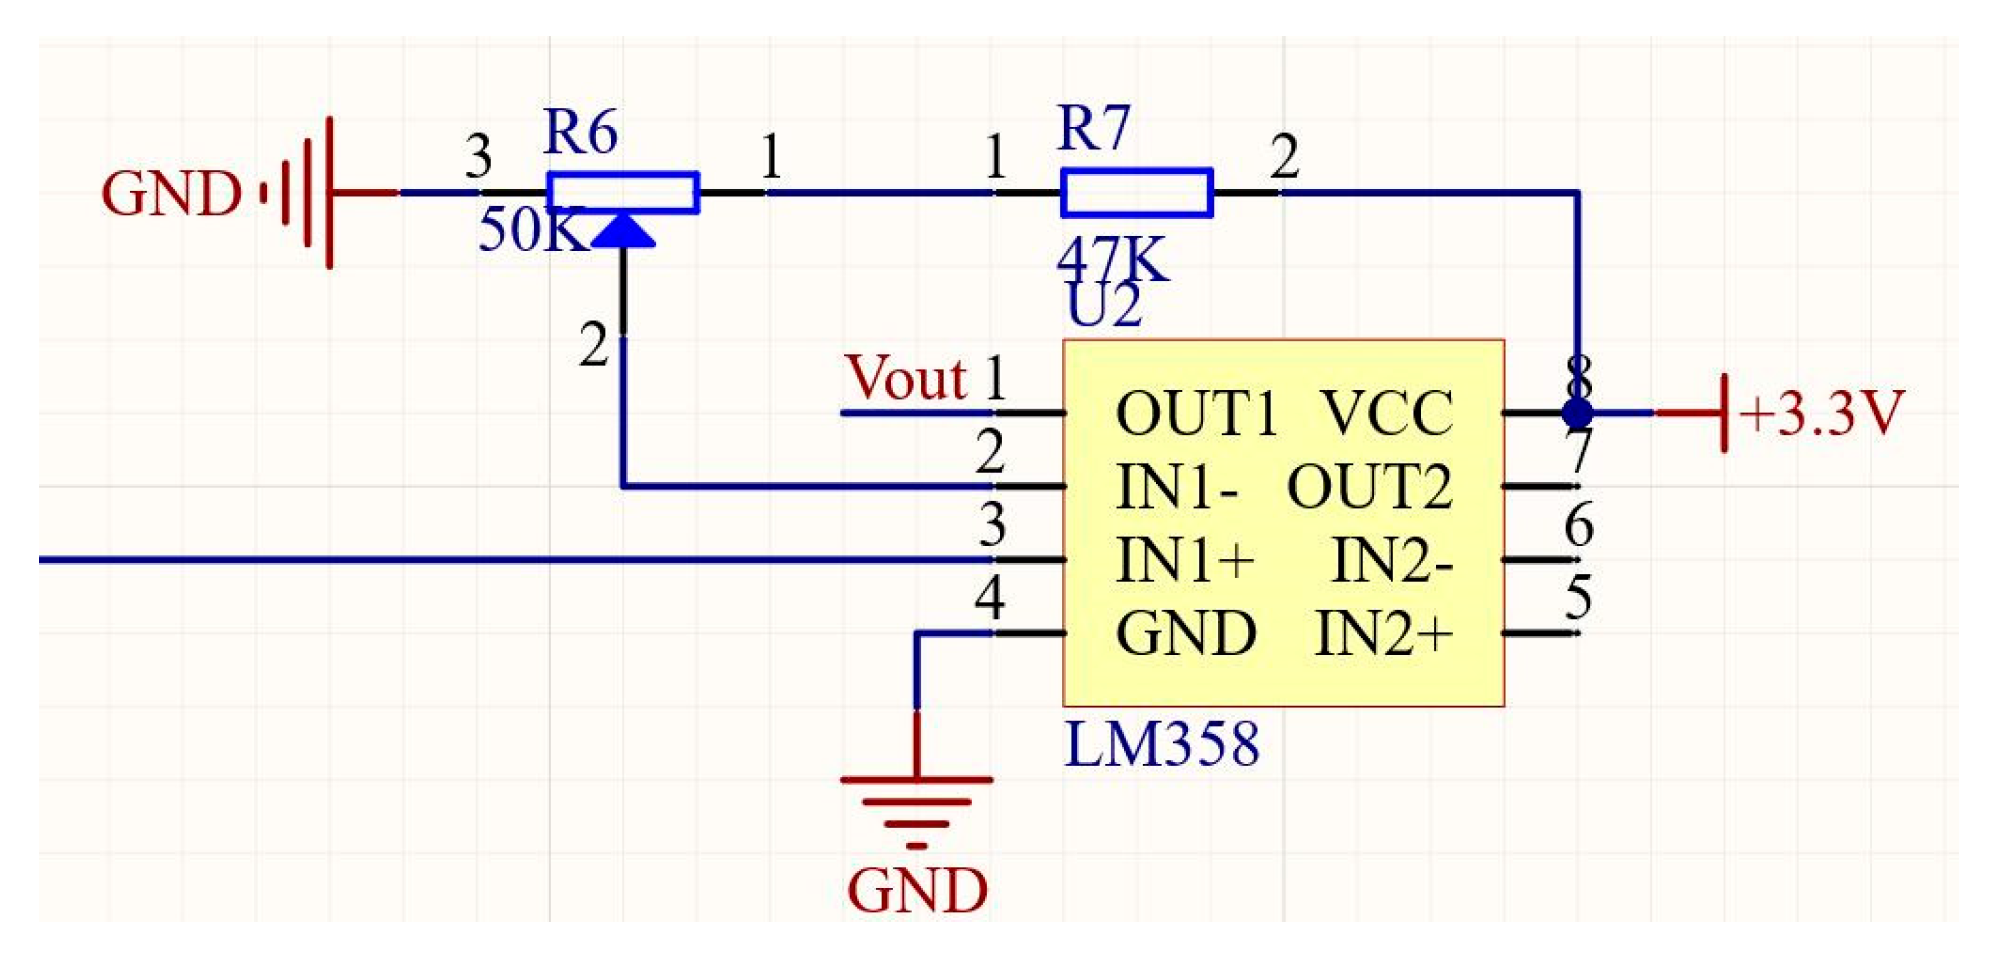
2.6. Voltage Comparator Design
The voltage comparator can convert the analog signal into a digital signal, which is convenient when using the digital circuit to process the signal. The designed voltage comparison circuit is shown in
Figure 11. The trigger level of the voltage comparator can be adjusted by changing the resistance value (R6) and the width of the collected vibration signal (duty ratio), thereby determining the detection time of each corn kernel. For the designed voltage comparator circuit in this paper, the detection time of one corn kernel is about 20 ms—that is, 50 corn kernels can be identified per minute in the theoretical state. After the corn kernel impact signal is processed by the circuit of 2-order high-pass filtration and envelope wave detection and voltage comparison, a square wave signal that can be used for digital signal processing is obtained, as shown in
Figure 12.
2.7. Lost Corn Kernel Recognition and Counting System Design
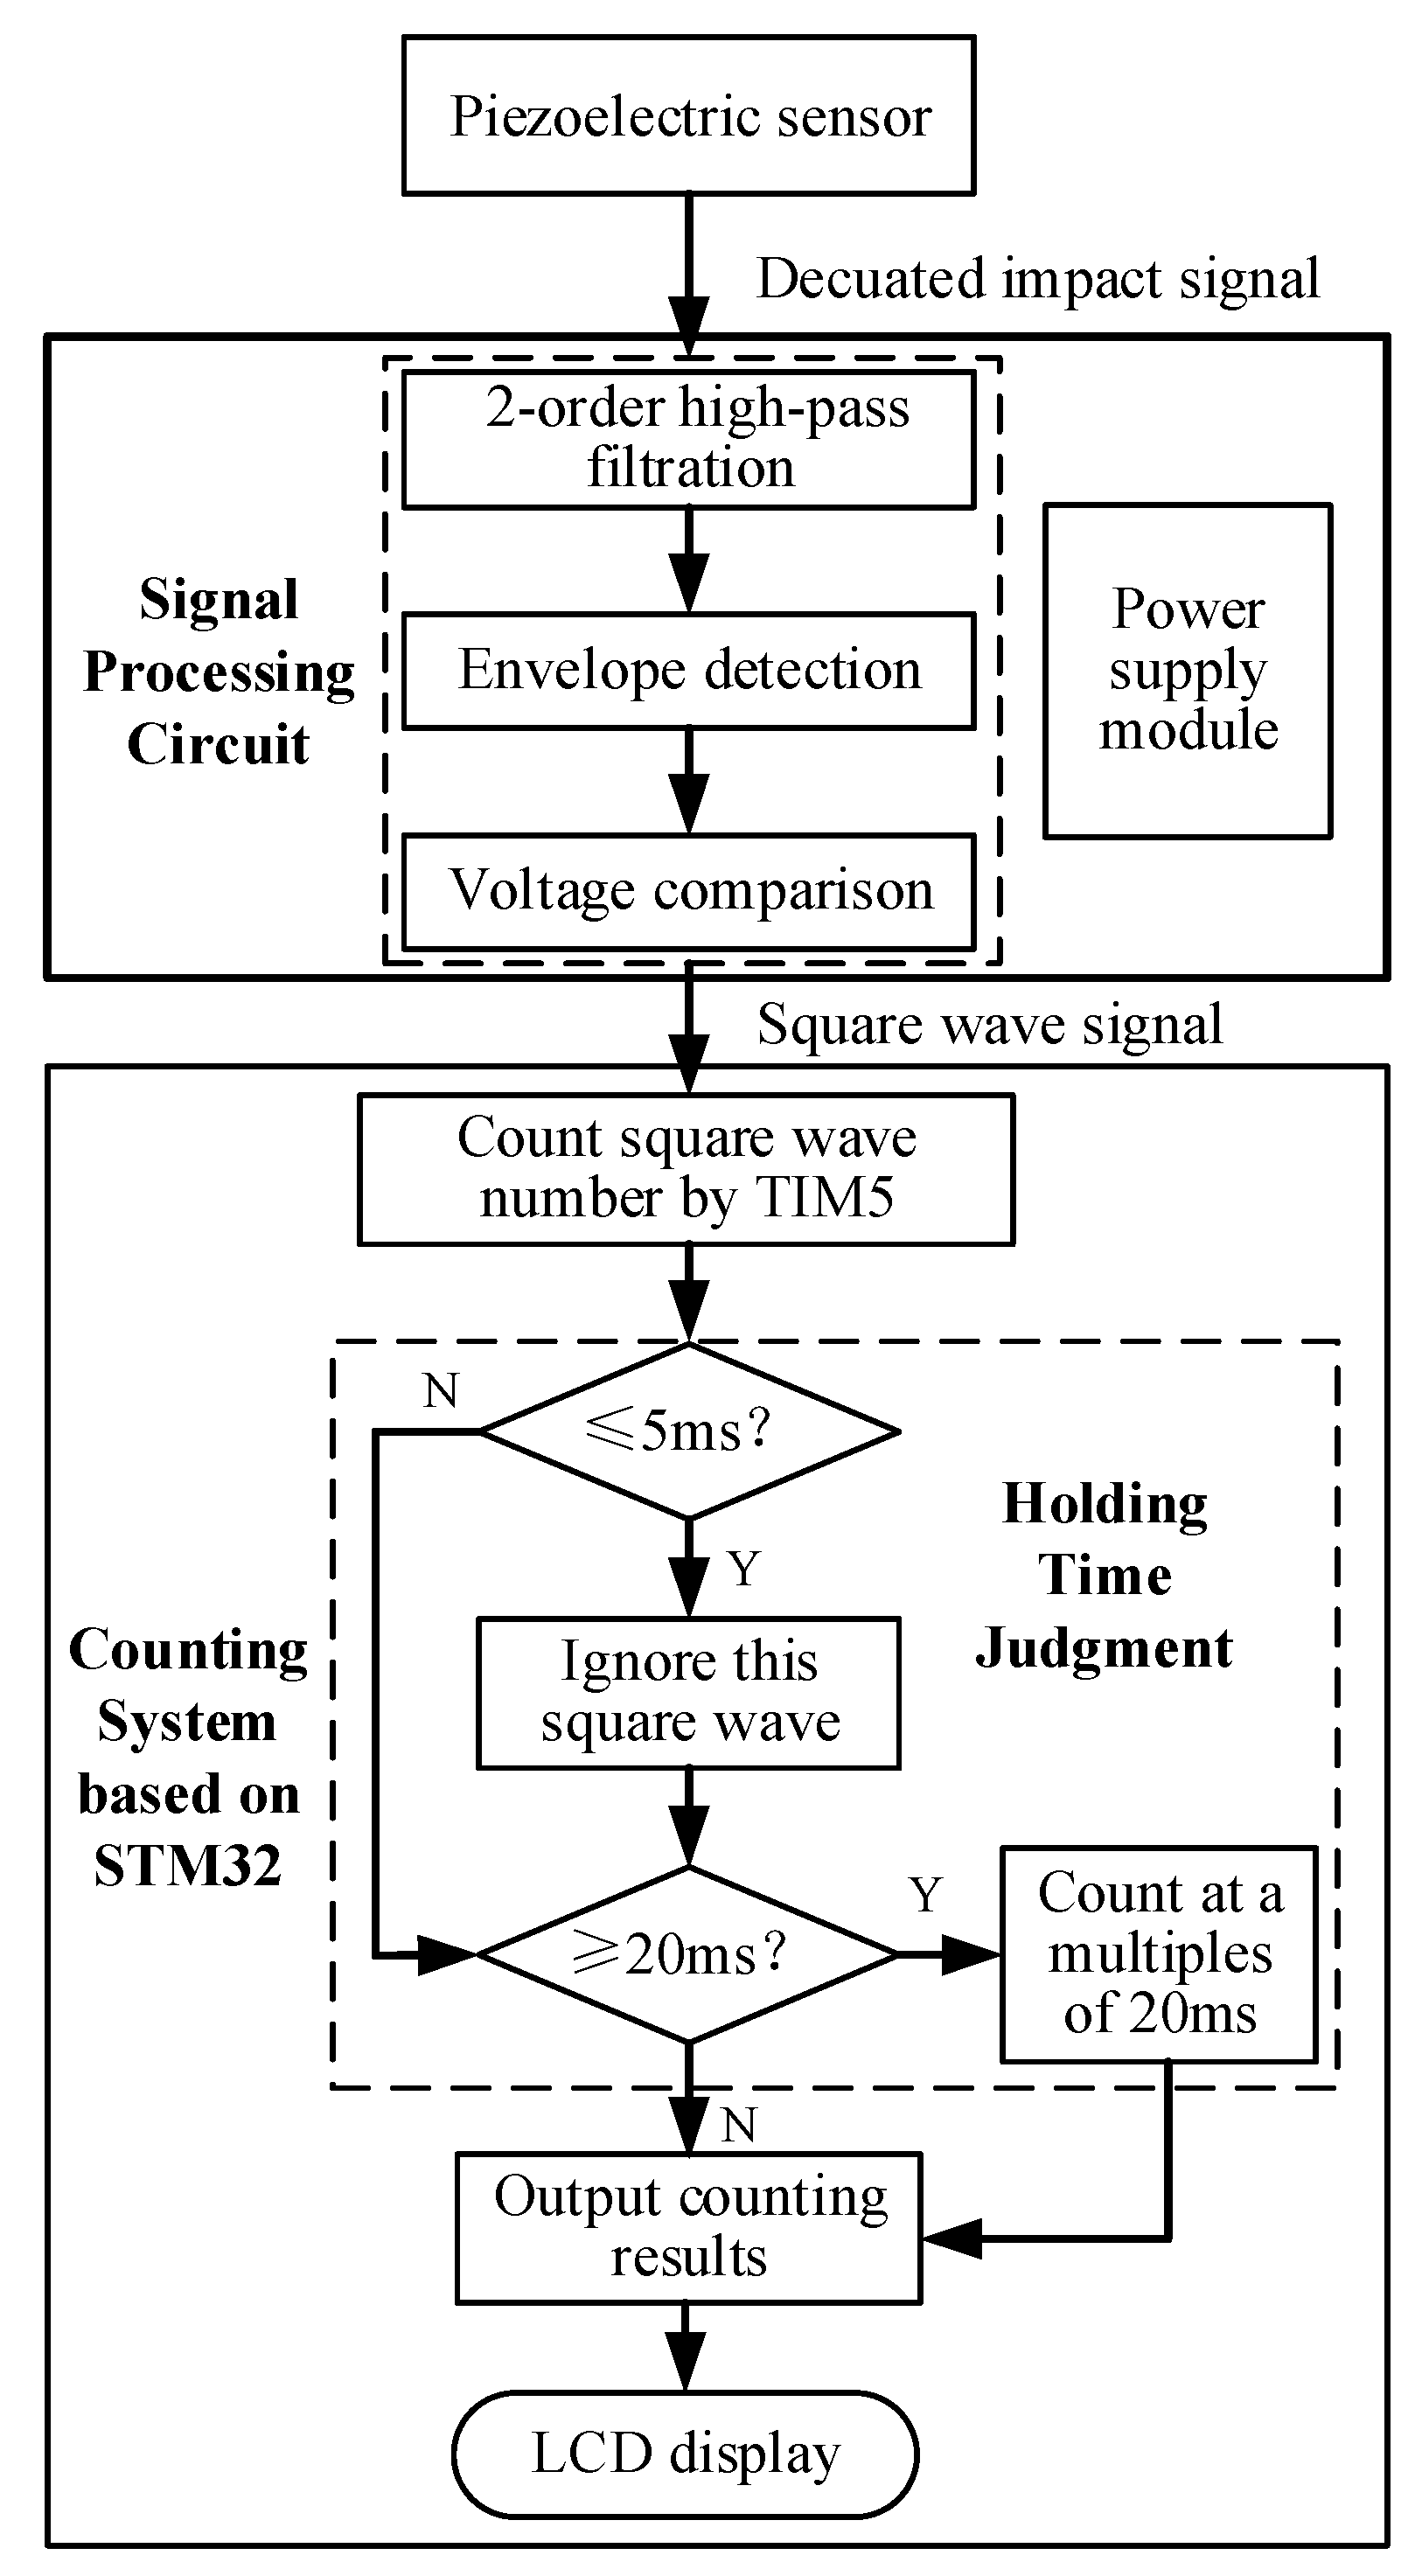
After threshing and cleaning, the lost corn kernels and impurities impact on the sensitive plate to obtain a mixed impacting signal; after the high-pass filter circuit, the impacting signals generated by impurities are filtered out, and only the impacting signal of the corn kernels are retained. After processing the signals by envelope wave detection and voltage comparison, the square wave signal generated by the corn kernels can be obtained. When identifying the lost corn kernels, there is a problem that several lost kernels impact the sensitive plate at the same time. Since the system needs about 20 ms to identify a corn kernel, if several kernels fall at the same time within 20 ms, the system cannot distinguish the impacting signal generated by one or more kernels. In addition, some impacting signals of impurities still have weak signal above 8.7 kHz, which leads to the wrong square wave signal being generated by the system.
In order to reduce the problem of loss recognition when multiple grains impact simultaneously and the misrecognition of impurities, the counting method of this system is proposed according to the output holding time of square wave signal. The square wave signal with a holding time more than 20 ms is counted according to the multiple of 20 ms, and the signal with a holding time of less than 5 ms is not calculated, so as to reduce the error of recognition and counting. In order to improve the processing speed of the system, a 32-bit STM32F103ZET6 low-power microcontroller based on ARM Cortex TM-M3 core from ST Company was selected. In summary, the schematic diagram of the losing corn kernel recognition and counting system is shown in
Figure 13.
3. Test and Discussion
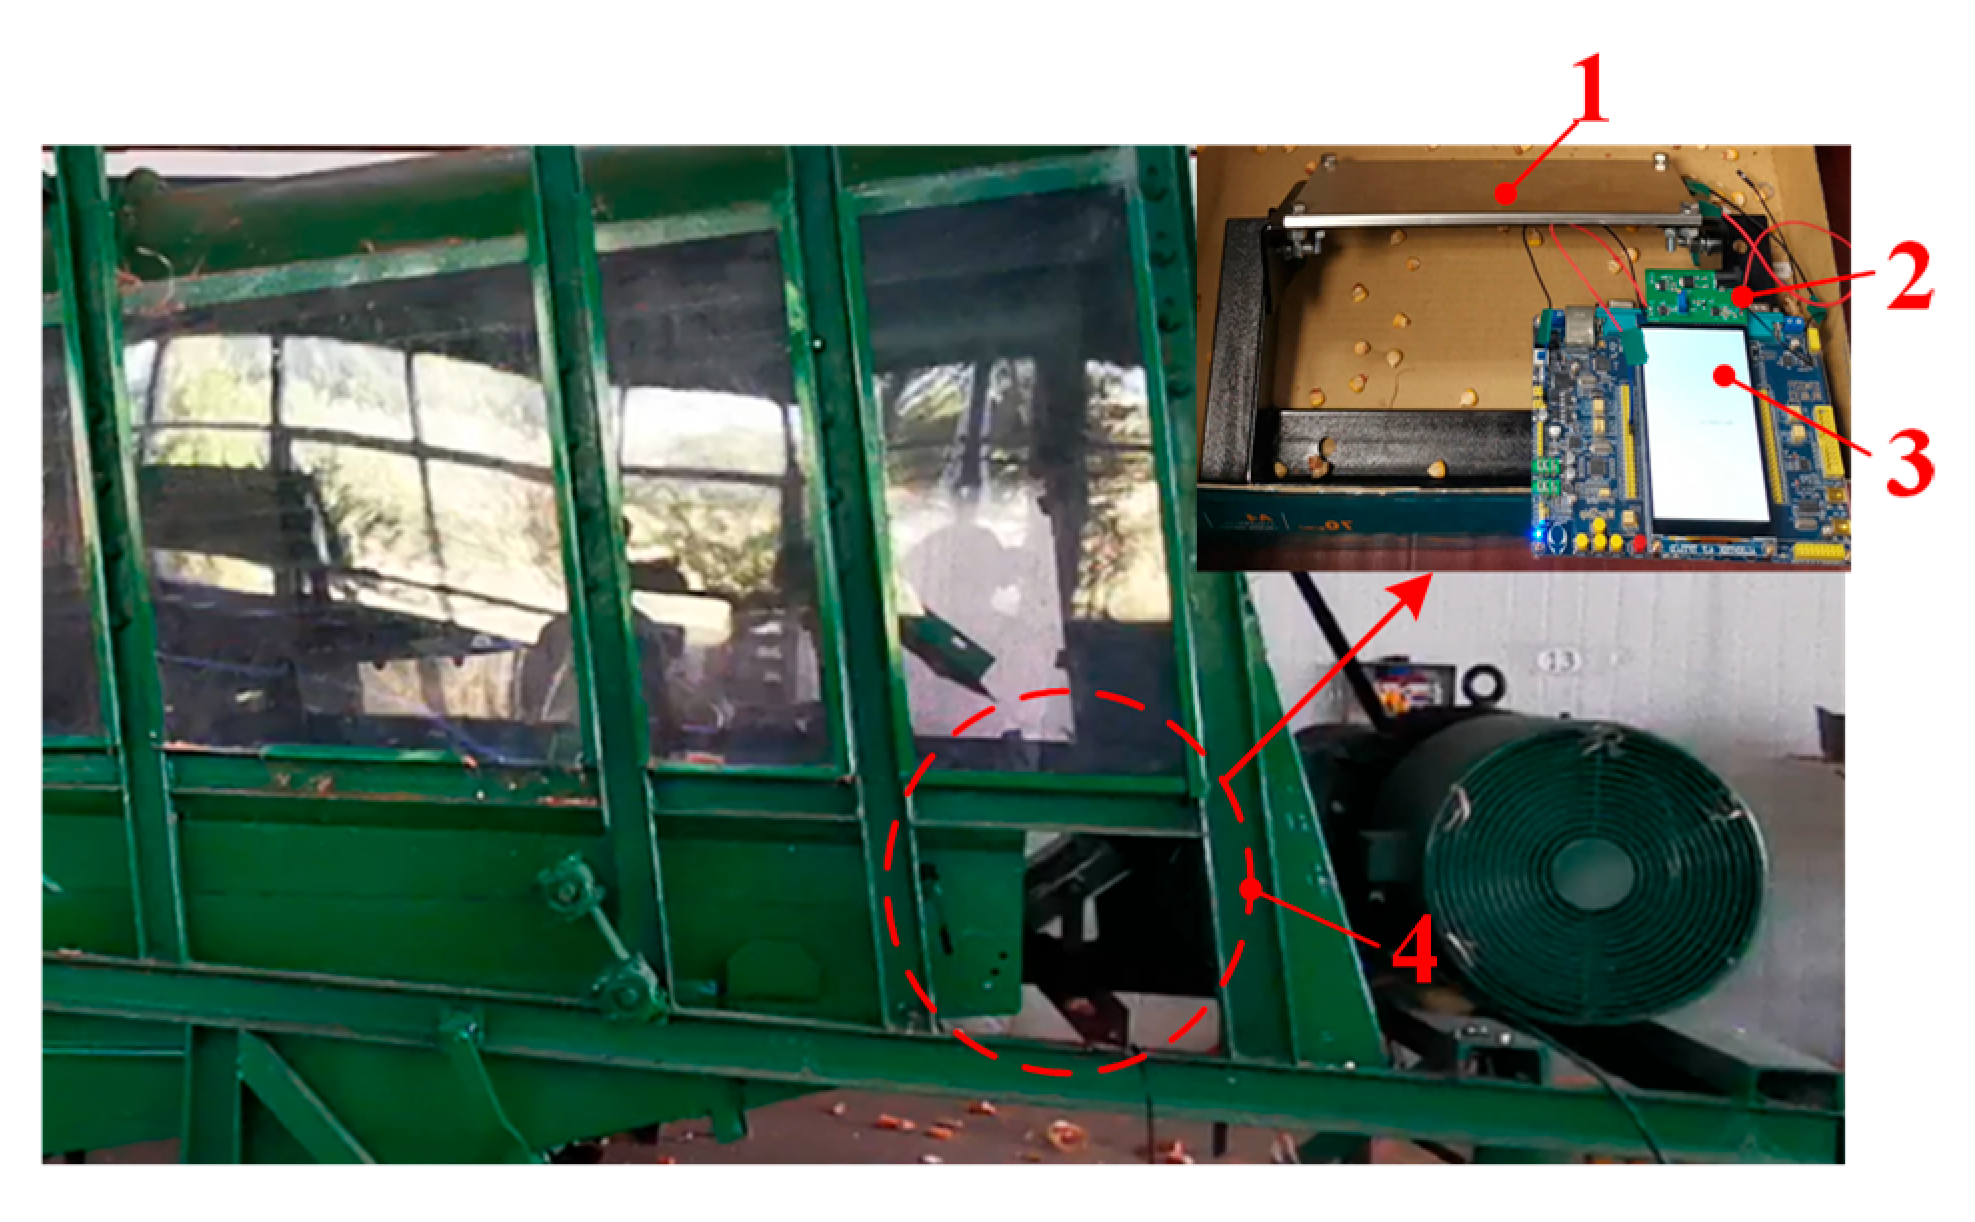
The corn kernel recognition and counting system was installed at the end of the corn harvest test platform, which was located at the outlet of the loss kernels and impurities after threshing and cleaning, as shown in
Figure 14 The simulation identification test of mixture including corn kernels and impurities was carried out. The conveyor belt was used to simulate the collision process of the mixture lost in the corn combine harvester’s cleaning and threshing mechanism, and these mixtures were transported and impacted the sensitive plate at a fixed height and speed. The falling height was 40 cm, and the installation angle of the sensitive plate was 45°. In order to verify the accuracy and reliability of the cleaning loss kernel recognition system, the recognition accuracy test of single, double, three and five corn kernels and impurities impacting the sensitive plate at the same time was carried out, and each group of tests was repeated 100 times.
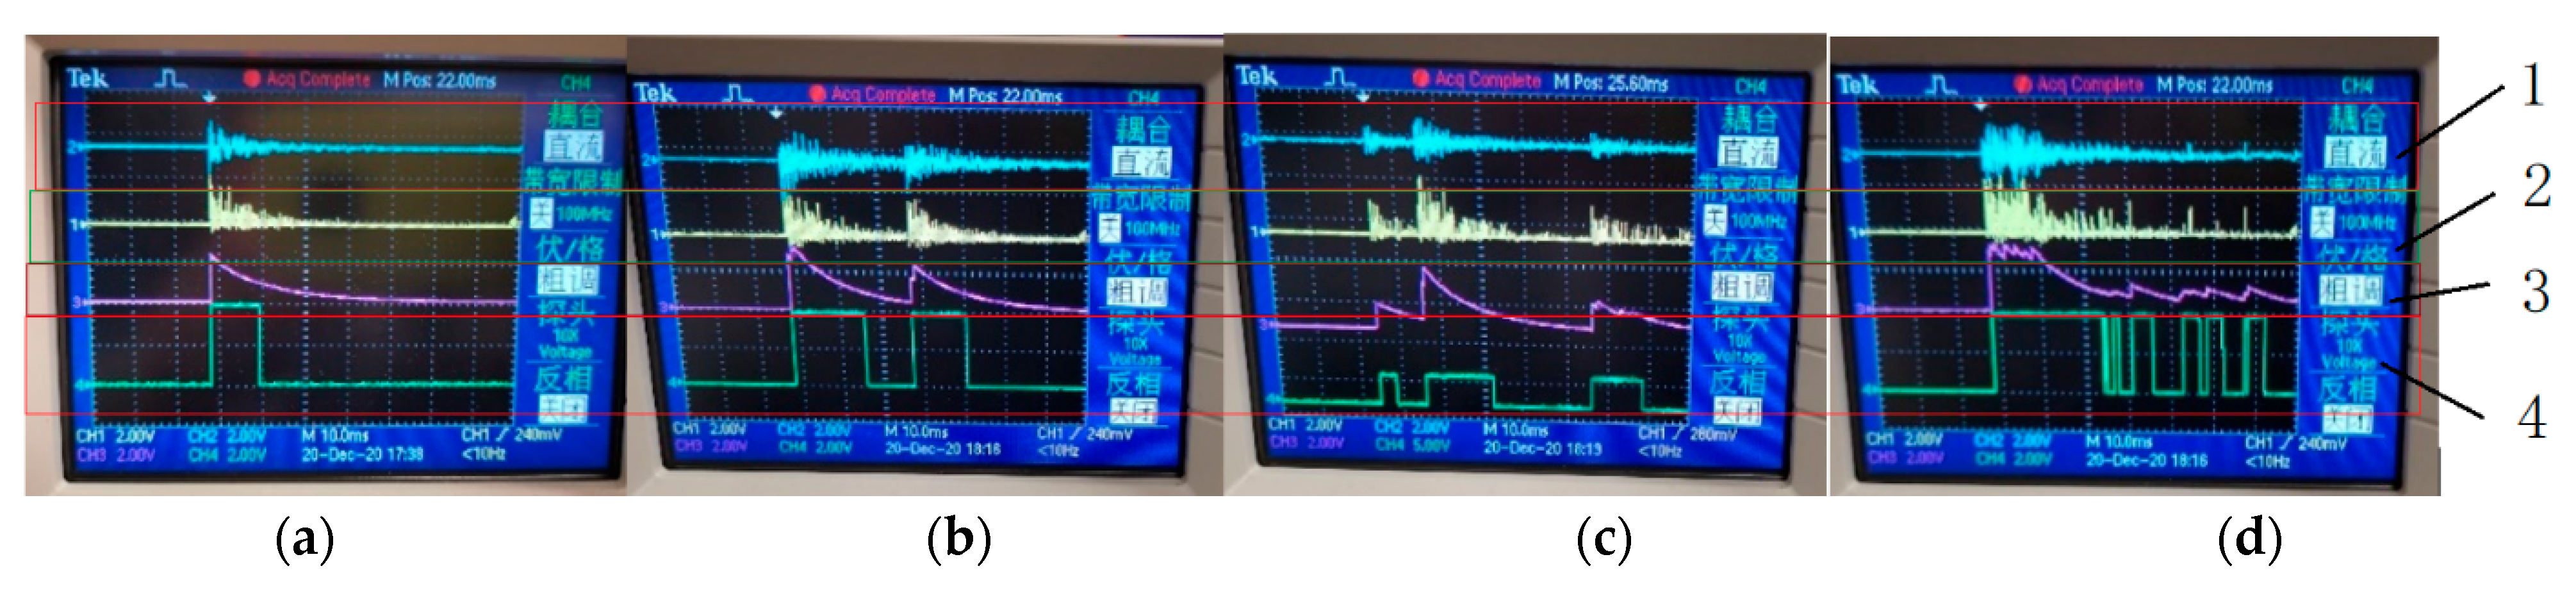
The output square wave signals processed by the piezoelectric element, high-pass filter, envelope detection circuit and the voltage comparator were detected with a multiple-channel oscilloscope, so as to compare the relationship between the square wave number and the kernel number displayed in the display module. The test results are shown in
Figure 15. From the signal displayed in the oscilloscope, the accuracy of the designed signal processing circuit was verified, and the square wave used for counting was obtained. As shown in
Figure 15d, five corn kernels impacting the sensitive plate at the same time generated six square waves. Using the judgment program for the holding time of the square wave eliminated the influence of the wrong square wave, which improved the counting accuracy.
Figure 14.
Test device of corn kernel recognition and counting system. (1) Impact signal acquisition module, (2) signal processing module, (3) counting display module, and (4) corn kernel recognition and counting system.
Figure 14.
Test device of corn kernel recognition and counting system. (1) Impact signal acquisition module, (2) signal processing module, (3) counting display module, and (4) corn kernel recognition and counting system.
Figure 15.
Multiple-channel oscilloscope signal display diagram. (a) One corn kernel; (b) two corn kernels; (c) three corn kernels; and (d) five corn kernels. (1) The signal through the detection piezoelectric element, (2) the signal through the detection piezoelectric element and high-pass filter, (3) the signal through the detection piezoelectric element, high-pass filter and envelope detection circuit, and (4) the signal through the detection piezoelectric element, high-pass filter, envelope detection circuit and voltage comparator.
The number of corn kernels identified by the counting display module was recorded, so as to obtain the test data of the accurate recognition rate and misidentified kernels, as shown in
Table 2. The test results show that the recognition accuracy rate gradually decreased as the number of simultaneous impacting kernels increased. The recognition accuracy rate of one kernel reached 93%; for the test group of two kernels, the recognition accuracy rate reached 88%, the number of times that two kernels were misidentified as one kernel was 11, and the number of times where the kernel was unidentified was only one. For the test group of three kernels, the recognition accuracy rate reached 80%, the number of times that three kernels were misidentified as two kernels was 13. For the test group of five kernels, the recognition accuracy rate was 68%; five kernels were misidentified as four kernels 17 times, and were misidentified as three kernels 14 times. It can be seen from the test data in
Table 2 that the recognition accuracy of the system when kernels impact the sensitive plate simultaneously was high. Although there were some misidentifications, the difference between the recognized kernel number and the actual impacting kernel number was small. With this system, corn kernels and impurities can be accurately distinguished and recognized.
At present, the research into cleaning loss monitoring sensors mostly adopts the principle of piezoelectric type, which has the characteristics of simple structure, high resolution accuracy and being suitable for complex working environments. Corn kernels have a specific shape compared with other grains, resulting in a large difference in the impacting signal from different parts of the corn kernel and inaccurate loss monitoring data. The accuracy of the lost kernel recognition system applied in Chinese corn harvesting equipment is about 85%. The recognition accuracy rates of this designed system were 90.5% and 88.7%, respectively, when the number of kernels impacting at the same time was two or less or three, which had strongly high accuracy. That is to say, when using this system to monitor corn cleaning loss rate, it is necessary to design a screen so that the number of kernels impacting the sensitive plate simultaneously is less than three, so as to ensure the accuracy of the system, which is easy to realize. The system designed in this paper used a single sensitive plate and sensor, and the recognition accuracy can be improved by increasing the number of sensitive plates and sensors, which is the focus of future research.
4. Conclusions
Aiming at the problem that corn cleaning loss detection devices possess a time-consuming signal processing process and low recognition accuracy, based on the principle of the impacting piezoelectric effect, the impacting signals of corn kernels and impurities were analyzed by means of the frequency spectrum method to obtain the characteristic frequency of 8.7 kHz. Adding the judgment program to the holding time of the square wave signal on the basis of the conventional hardware signal conditioning circuit, the recognition accuracy with multiple corn kernels impacting the sensitive plate simultaneously was improved.
Tests have shown that the recognition accuracy rate with three corn kernels impacting the sensitive plate at the same time could reach more than 80%, and one sensitive plate could detect 20 to 30 corn kernels per minute. In actual operation, the probability of multiple lost corn kernels impacting the sensitive plate simultaneously is small, and so that the designed system can satisfy the requirement of identifying the losing kernels during corn direct harvesting.
In order to further improve the detection accuracy of multiple corn kernels impacting the sensitive plate at the same time, due to multiple kernels impacting the sensitive plate at different positions, future studies will reduce the area of the sensitive plate and increase the number of sensitive plates, so as to further improve the sensitivity of the system detecting more corn kernels.
Author Contributions
Conceptualization, M.Z. and L.J.; methodology, M.Z.; software, L.J.; valida-tion, C.W. and G.W.; formal analysis, M.Z.; investigation, M.Z.; resources, C.W.; data curation, M.Z.; writing—original draft preparation, L.J.; writing—review and editing, M.Z.; visualization, C.W.; supervision, C.W. project administration, C.W.; funding acquisition, M.Z. All authors have read and agreed to the published version of the manuscript.
Funding
This research was funded by Jiangsu Provincial Agricultural Science and Technology Independent Innovation Fund SCX(20)3031 and Institute-level basic scientific research business expenses project of the Chinese Academy of Agricultural Sciences (S202008, S202204).
Data Availability Statement
The data presented in this study are available on request from the authors.
Acknowledgments
The authors thank the editor and anonymous reviewers for providing helpful suggestions for improving the quality of this manuscript.
Conflicts of Interest
The authors declare no conflict of interest.
References
- China Bureau of Statistics. 2020 China Statistical Yearbook; China Statistics Press: Beijing, China, 2020.
- Wojcieszak, D.; Przybył, J.; Czajkowski, Ł.; Majka, J.; Pawłowski, A. Effects of harvest maturity on the chemical and energetic properties of corn stover biomass combustion. Materials 2022, 15, 2831. [Google Scholar] [CrossRef] [PubMed]
- Jia, X. Research on the Supply and Demand of Corn Market in China; Chinese Academy of Agricultural Sciences: Beijing, China, 2014. [Google Scholar]
- Cheng, X.; Jia, X.; Chen, M.; Li, Q. Experiment and analysis on test device of corn ear picking by pulling stalk upwards. Trans. Chin. Soc. Agric. Eng. (Trans. CSAE) 2016, 32, 50–55. [Google Scholar]
- Xu, L.Z.; Li, Y.; Li, Y.M.; Chai, X.; Qiu, J. Research progress on cleaning technology and device of grain combine harvester. Trans. Chin. Soc. Agric. Mach. 2019, 50, 1–16. [Google Scholar]
- Zhou, D.; Xu, C.; Xin, Y.; Hou, P.; Wu, B.; Yu, H.; Zhang, J.; Zhang, Q. Model study on the combination of operating parameters of corn kernel harvesters. Appl. Sci. 2021, 11, 10328. [Google Scholar] [CrossRef]
- Hou, L.; Wang, K.; Wang, Y.; Li, L.; Ming, B.; Xie, R.; Li, S. In-field harvest loss of mechanically-harvested maize grain and affecting factors in China. Int Agric. Biol. Eng. 2021, 14, 29–37. [Google Scholar] [CrossRef]
- Yang, R.; Chen, D.; Zha, X.; Pan, Z.; Shang, S. Optimization design and experiment of ear-picking and threshing devices of corn plot kernel harvester. Agriculture 2021, 11, 904. [Google Scholar] [CrossRef]
- Zhao, L.; Chen, L.; Yuan, F.; Wang, L. Simulation study of rice cleaning based on DEM-CFD coupling method. Processes 2022, 10, 281. [Google Scholar] [CrossRef]
- Al-Sammarraie, M.A.; Alhadithi, S.A. Determination of Grain Losses on Combine Harvester. Sci. Eng. Res. 2021, 8, 196–202. [Google Scholar]
- Lian, Y.; Chen, J.; Guan, Z.; Song, J. Development of a monitoring system for grain loss of paddy rice based on a decision tree algorithm. Int. Agric. Biol. Eng. 2021, 14, 224–229. [Google Scholar] [CrossRef]
- Bomoi, M.I.; Nawi, N.M.; Aziz, S.A.; Kassim, M.S.M. Sensing Technologies for Measuring Grain Loss during Harvest in Paddy Field: A Review. AgriEngineering 2022, 4, 292–310. [Google Scholar] [CrossRef]
- Chaab, R.K.; Karparvarfard, S.H.; Rahmanian-Koushkaki, H.; Mortezaei, A.; Mohammadi, M. Predicting header wheat loss in a combine harvester, a new approach. Saudi Soc. Agric. Sci. 2020, 19, 179–184. [Google Scholar] [CrossRef]
- Yu, Y.; Qin, X.; Hussain, S.; Hou, W.; Weis, T. Pedestrian Counting Based on Piezoelectric Vibration Sensor. Appl. Sci. 2022, 12, 1920. [Google Scholar] [CrossRef]
- Lee, U.; Islam, P.; Kochi, N.; Tokuda, K.; Nakano, Y.; Naito, H.; Kawasaki, Y.; Ota, T.; Sugiyama, T.; Ahn, D.-H. An Automated, Clip-Type, Small Internet of Things Camera-Based Tomato Flower and Fruit Monitoring and Harvest Prediction System. Sensors 2022, 22, 2456. [Google Scholar] [CrossRef]
- Zhao, Z.; Li, Y.; Chen, J.; Xu, J. Grain separation loss monitoring system in combine harvester. Comput. Electron. Agric. 2011, 76, 183–188. [Google Scholar] [CrossRef]
- Li, Y.; Chen, Y. Monitoring method and device of attachment loss in combine harvester. Int. Agric. Eng. J. 2011, 20, 14–19. [Google Scholar]
- Wang, S.; Xu, Q.; Peng, C. Studies on the measurement of chip microprocessors system of single seed drill. J. Huazhong Agric. Univ. 1998, 17, 96–100. [Google Scholar]
- Fu, J.; Yuan, H.; Zhao, R.; Chen, Z.; Ren, L. Peeling Damage Recognition Method for Corn Ear Harvest Using RGB Image. Appl. Sci. 2020, 10, 3371. [Google Scholar] [CrossRef]
- Zhang, T.; Zhao, D.; Zhou, T. Application of Image Processing on Combine Harvester Attachment Loss. J. Agric. Mech. Res. 2009, 31, 70–72. [Google Scholar]
- Nanjing University. A Real-Time Online Detection Method of Grain Harvest and Clearing Loss Based on Image Processing. CN Patent 107123115, 1 September 2017. [Google Scholar]
- Liang, Z. Study on Designing Method of Multi-duct Air-and-Screen Cleaning Unit and Grain Sieve Loss Monitoring and Controlling Technology; Jiangsu University: Zhenjiang, China, 2018. [Google Scholar]
- Liang, Z. Selecting the proper material for a grain loss sensor based on DEM simulation and structure optimization to improve monitoring ability. Precis. Agric. 2021, 22, 1120–1133. [Google Scholar] [CrossRef]
- Shirinov, A.V.; Schomburg, W.K. Pressure sensor from a PVDF film. Sens. Actuators 2008, 142, 48–55. [Google Scholar] [CrossRef]
- Liang, Z.; Li, Y.; Zhao, Z.; Xu, L. Structure Optimization of a Grain Impact Piezoelectric Sensor and Its Application for Monitoring Separation Losses on Tangential-Axial Combine Harvesters. Sensors 2015, 15, 1496–1517. [Google Scholar] [CrossRef] [PubMed] [Green Version]
- Xie, C. Development and Experiment of Adaptive Control System for Rapeseed Seed Cleaning Loss; Jiangsu University: Zhenjiang, China, 2020. [Google Scholar]
- Liang, Z.; Li, Y.; Xu, L.; Zhao, Z. Sensor for monitoring rice grain sieve losses in combine harvesters. Biosyst. Eng. 2016, 147, 51–56. [Google Scholar] [CrossRef]
- Krzysiak, Z.; Samociuk, W.; Skic, A.; Bartnik, G.; Zarajczyk, J.; Szmigielski, M.; Dziki, D.; Wierzbicki, S.; Krzywonos, L. Effect of sieve drum inclination angle on wheat grain cleaning in a novel rotary cleaning device. Trans. ASABE 2017, 60, 1751–1758. [Google Scholar] [CrossRef]
| Publisher’s Note: MDPI stays neutral with regard to jurisdictional claims in published maps and institutional affiliations. |
© 2022 by the authors. Licensee MDPI, Basel, Switzerland. This article is an open access article distributed under the terms and conditions of the Creative Commons Attribution (CC BY) license (https://creativecommons.org/licenses/by/4.0/).


