Article

A Study on Optimum Insulation Thickness in Walls of Chinese Solar Greenhouse for Energy Saving

Horticultural College, Shenyang Agricultural University, National & Local Joint Engineering Research Center of Northern Horticultural Facilities Design & Application Technology, Shenyang 110866, China
*
Author to whom correspondence should be addressed.
Agronomy 2022, 12(5), 1104; https://doi.org/10.3390/agronomy12051104
Submission received: 28 March 2022 / Revised: 22 April 2022 / Accepted: 28 April 2022 / Published: 30 April 2022
(This article belongs to the Special Issue Frontier Studies in Agricultural Greenhouse Equipment and Systems)

Abstract

:
Chinese solar greenhouses (CSGs) are characterized by unique walls to reduce the transmission of heat and promote the energy conservation in winter production, which promotes cultivation in the northeast region of China in winter. Effective selection of insulation material is important for the CSG based on the energy consumption and economic analysis. However, choosing the thickness of the insulation material in walls often discussed with the structure of CSG. There is a lack of research combing the optimal insulation thickness for improving the energy conservation. The aim of this study was to find the optimum insulation thickness during the energy conservation based on the structure of walls, the energy consumption in local climatic conditions, the cost of insulation material, and economic payback period over a lifetime. By the economic analysis of insulation thickness, thermal resistance, lifetime energy saving, and payback period, three kinds of typical walls (clay brick (CB), hollow concrete block (HCB) and fly ash block (FAB)) combed with four insulation materials including the expanded polystyrene, the foamed PVC, the perlite, and the rock wool were calculated. The optimum insulation thickness can be found when energy savings reached the maximum. In the northeast region, the association of FAB with rock wool as the insulation layer was the most economic composite wall structure. The optimum insulation thickness was 0.05 m, with the cost only 5 USD/m2. The thermal resistance of composite wall had a significant effect on the payback period. When thermal resistance increased from 0.2 to 1.2 m2K/W, the payback period varied from 0.4 to 4.3 years. What is more, the energy consumption in local climatic conditions had a more significant effect on payback period. It can be assumed that insulation materials are more favored in cold climatic regions where heating degree-days over 1600 °C days for payback periods is less than 2 years. These results have strong practical and economical significance in saving energy and improving the environment of CSG.

1. Introduction

In the northeast region of China, Chinese solar greenhouses (CSGs) are a typical horticultural facility widely used to produce vegetables and fruits in winter. CSGs are composed of transparent film on the south roof through which the sunlight can be transferred into the greenhouse and walls used in north, east, and west sides which reduce the transmission rate of heat and then energy consumption.
As an energy saving production building, the thermal environment in CSG based on both solar collection and the energy conservation must ensure a sufficient night temperature for production especially in cold areas. In order to obtain good thermal performance, the design of the shape, including the south facing roof, and good insulation of the north wall and sidewalls were discussed and simulated by several researchers [1,2]. Guohong et al. simulated the dynamic thermal characteristics of wall configurations with insulation layers and showed the importance of the structure and conservation characteristics for energy storage in CSG. Results showed the necessity of using good heat insulation material for the wall layers, and those with high thermal conductivity and volumetric specific heat should be used for the inner layers. The proper use of wall materials is important to reduce energy consumption and secure winter vegetable production.
In order to maintain the best temperature conditions inside CSGs, researchers analyzed the effect of walls in different aspects. Mobtaker et al. (2019) determined the material of the north side of the greenhouse and average value of the cover transmittance in six shapes of greenhouses [3]. Duansheng et al. measured the thermal environment of CSGs and showed the wall body with the heat preservative layer composed of a heat-conducting and exothermic material outside and with a heat-insulating layer in the middle was the ideal wall body structure of CSGs [4]. To determine the heat transfer properties of walls composed of different materials, Guohong et al. analyzed theoretical values of heat flux through walls using the frequency response method and suggested that polystyrene foam plastic is a better thermal insulation material and brick is an adequate thermal storage material [5]. Other studies have reported that similar applications of various walls improved the thermal characteristics of CSGs [6,7].
On the other hand, due to the limited energy intercepted by CSGs in winter, decreasing the transmission rate of heat and energy becomes important in utilization of protected horticulture. To determine the optimum structure and material of north walls, the dynamic heat storage/release characteristics of the wall materials, such as phase-change material wallboard, the block bricks, and the insulation board were simulated by numerical models [8]. Zhang et al. analyzed the temperature distribution in a closed and empty CSGs and demonstrated that temperature stratification and non-uniformity were more obvious when the north wall was thinner, suggesting a desirable thickness of the north wall for energy conservation [9]. Li et al. compared the effects of heat preservation of different wall materials by measuring the heat gained, the temperature of the wall, and the inner air temperature of the greenhouse [10]. The arrangement of materials plays an important role in the performance of heat preservation of walls. Guohong et al. confirmed that the thermal properties of the greenhouse are largely determined by the combination of wall mass, thermal resistance, and insulation thickness [1]. Zhang et al. highlighted the way to use phase-change materials for improving the thermal characteristics in CSGs [11]. However, although several kinds of wall materials and constructions have been practically applied in CSG, there is a lack of research combing the structure of walls with an economic analysis. Moreover, the optimal insulation material thickness and its applicability are insufficient.
Although there is research on the determination of the selection of proper insulation material in civil buildings [9,10,11,12], as the energy source requirements and the structure of CSGs are quite different from civil buildings, it is difficult to identify the same results.
Some researchers tried to use a new heating system to improve the heating effect, such as an electric warm-air machine or a diesel hot-air stove [13,14]. Mazzeo et al. (2021) analyzed the performance of a venlo solar greenhouse and identified the effect of location and the choice of the glass [15]. Bonuso et al. (2020) focused on the ventilation analysis of solar greenhouses with a symmetrical flat pitched roof and single span located in a warm temperature climate [16]. Mahdavi et al. (2019) studied the energy and exergy and showed the effect of heat exchangers and photovoltaic/thermal collectors in raising and lowering the temperature in summer and winter [17].
However, the hot-blast stove is still the main heating system used in CSGs which offers heat by consuming coal [18]. The assessment of economic investment includes not only the construction cost of a CSG but also the running costs. The cost of walls is the largest part of the construction cost and the heating cost is the largest part of the running cost. Therefore, how to balance the initial cost and running cost is an unavoidable problem [19,20].
Due to the deficiency of systematic building design standards or guidelines for CSGs, there is lack of research on the optimal combination of insulation thickness and wall structure to achieve energy conservation of CSGs in cold areas [21,22]. The goal of this study was to find the optimum insulation thickness based on the structure of walls, the energy consumption in local climatic conditions, the cost of insulation material, and economic payback period over a lifetime. In order to contribute to the initial design and construction of CSG walls, three typical walls of CSGs were selected, with consideration of four insulation materials including expanded polystyrene, foamed PVC, perlite, and rock wool to determine the optimum insulation thickness of external walls in CSG.

2. Materials and Methods

In this study, a typical kind of CSG was used as shown in Figure 1, located in Shenyang city, China (Longitude, 123.4 E, Latitude, 41.8 N). The annual variations in air temperature are shown in Figure 2. Three common materials used for the construction of the main walls in the CSG including the brick, the hollow concrete block, and the fly ash block as shown in Figure 3 were considered. From the interior to the exterior, the composite wall consists of a 240-mm-thick layer of each wall material, and a 20-mm-thick layer of the external plaster and variable-thickness insulation materials. Four insulation materials including expanded polystyrene, foamed PVC, perlite, and rock wool were chosen to determine the optimum insulation thickness of external walls in greenhouses as shown in Figure 4. The values of the parameter used in the calculations for the insulation materials and walls are given in Table 1, Table 2 and Table 3.
The cost of the CSG included initial costs and running costs. The cost of insulation materials belonged to the initial cost of construction. The cost of energy consumption belonged to the running cost. To decrease the running cost of energy consumption, the thick insulation materials were often used in walls which caused a high initial cost of CSG. Therefore, the economic analysis of the CSG was performed using the P1, P2 method of life cycle savings [23]. The optimum insulation thickness was estimated by maximizing the energy saving which balances the initial cost and running cost [24]. More information about the nomenclature used in the study has been listed in Nomenclature Section.
(1)
Heating load for walls
The hot-blast stove is one of the most widely used heating equipment for CSGs in cold winter at present. It is composed of stove burning by coal and a blast pump which can blow the heated air into the greenhouse. When evaluating the heating energy in the CSG, heat loss in the unit surface of the wall was calculated with Equation (1)
q = U ( T o T i )
where q (W/m2) is the heat loss per unit area of external wall, U is (W/(m2 K)) the overall heat transmission coefficient of external walls. T o is the outside ambient temperature, T i is the constant inside ambient temperature.
The annual energy consumption for heating per unit area of external wall can be calculated by:
Q h e a t = 86400 · U · H D D
HDD is degree-days described in Equation (2).
The overall heat transmission coefficient U for a typical wall with insulation is given by:
U = 1 R i + R w + R i n s + R 0
where Ri and Ro (m2K/W) are the thermal resistance of heat transfer coefficients of the inside and outside environment, respectively, Rw (m2K/W) is the thermal resistance of wall without insulation materials, where Rins is the thermal resistance of insulating material, which can also be expressed as x/kins, where x (m) is the thickness of insulating material, kins (W/mK) is the thermal conductivity of the insulating material.
R i n s = x k i n s
Total resistance of the main wall Rwt is as follows:
R w t = R i + R w + R 0
So, the overall heat transmission coefficient is expressed as follows:
U = 1 R w t + R i n s
The annual energy requirement for heating per unit area of external wall can be estimated written as:
E h e a t = Q h e a t η
Then, the E h e a t is expressed as:
E h e a t = 86400 · U · H D D ( R w t + R i n s ) η
(2)
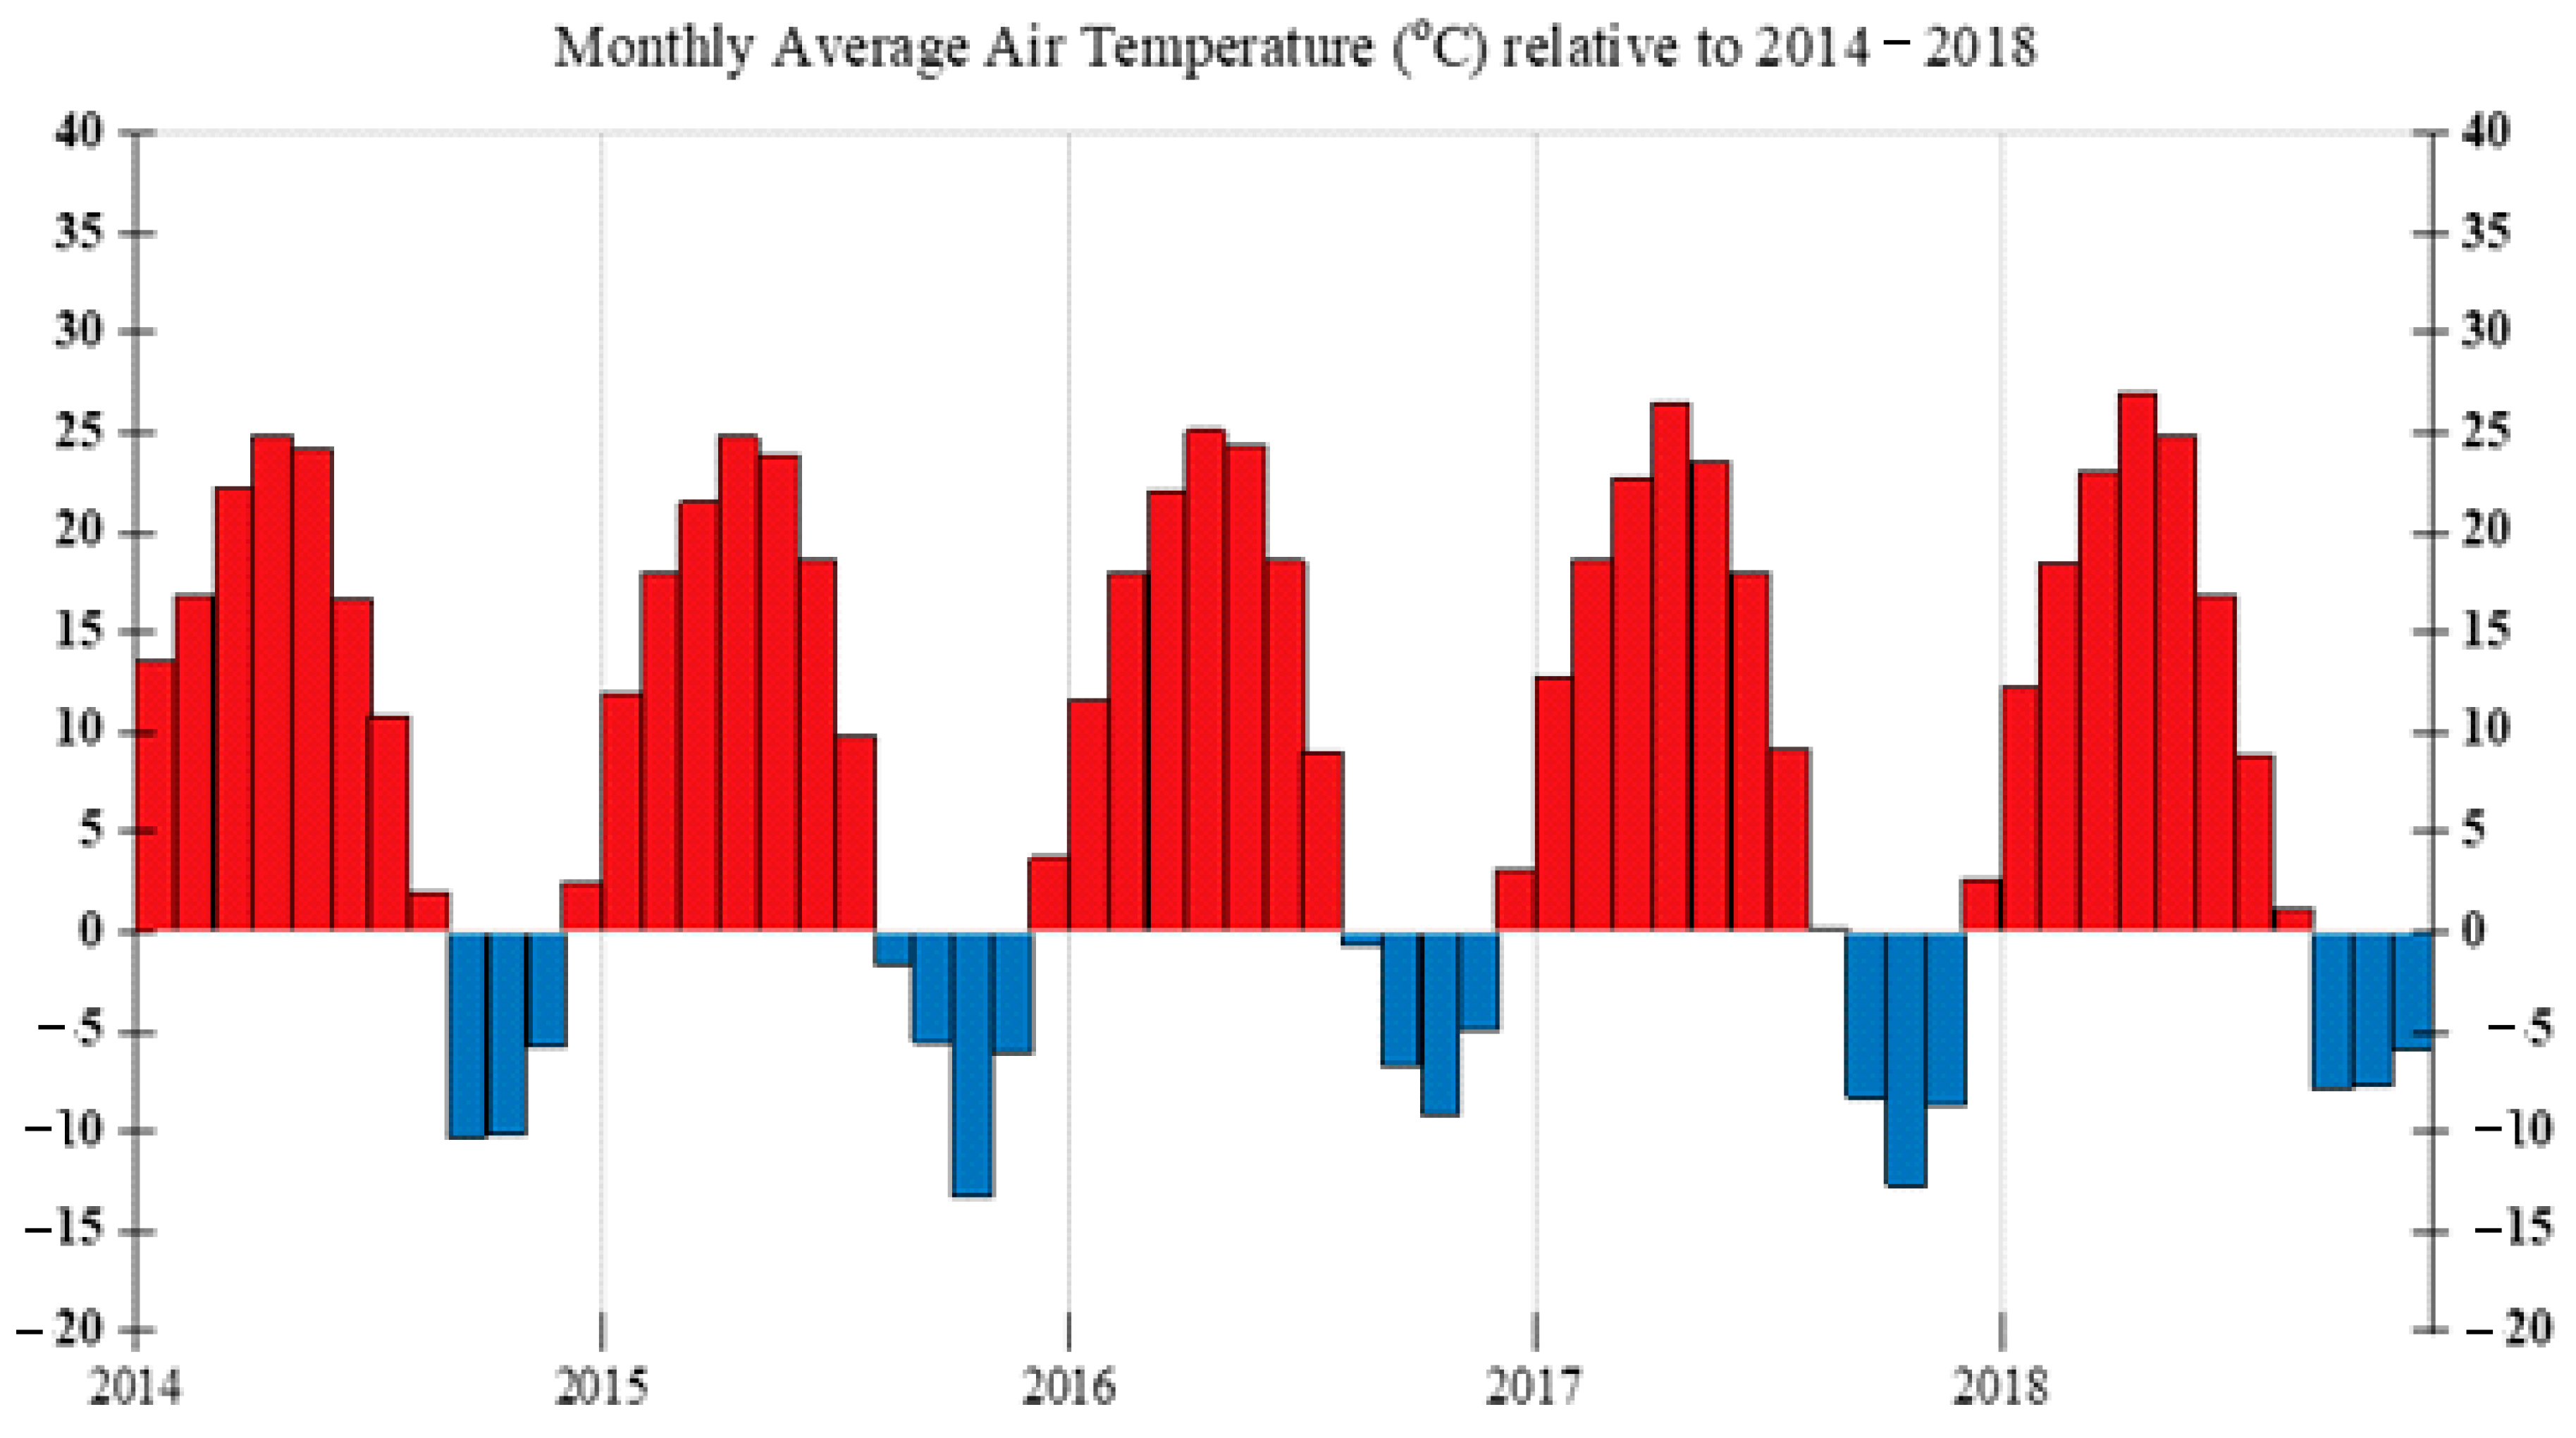
Calculation of degree-days
The degree-days method, which is the most efficient way to determine the heat transfer in the envelope, is used to calculate the degree-days in CSG. In northeast of China, CSGs are used as the main horticultural structure to provide the environment for overwinter plants [19]. There are no cooling systems inside the CSG, so the cooling degree-days was zero. The heating degree-days (HDD) is calculated to be the sum of difference between the outside temperature (Tout) and the inside setting temperature (Tset). Tout is calculated by the mean monthly temperature from the meteorological data based on China Meteorological Agency in Shenyang regions (Latitude, 123°23′, Longitude, 41°48′). The inside temperature (Tset) is set at 15 °C for heating at night [25,26]. When the inside temperature is below 15 °C, the heating system works.
H D D = j = 1 n ( T s e t T o u t ) j T o u t T s e t
(3)
Economic assessment for the optimum insulation thickness
By using insulating material in CSG, heat loss through the CSG was significantly reduced. However, the optimal thickness should be determined by the difference in the saved energy cost and the cost of insulating material during the lifetime of CSG.
The saved energy costs for unit walls are calculated with the following equation:
C h e a t = 86400 × H D D × C c o a l ( R w t + R i n s ) × H u × η
Ccoal is the cost of coal. Hu is the heating value of the coal and η is the efficiency of the heating system.
The cost of insulation is given by
C i n s = C i x
Cins is the cost of insulation in USD/m2 and Ci is the cost of insulation in USD/m3. x is the thickness of insulation.
The economic analysis of total cost was performed using the P1, P2 method of life cycle savings. The optimal thickness was found by maximizing the life cycle saving. P1 and P2 are determined from economic parameters. P1 is the ratio of the life-cycle fuel cost to the first year fuel cost. P2 is the ratio of the life cycle expenditures to initial investment.
Life cycle saving (LCS) is the difference between the saved energy cost over the lifetime and the insulation payout:
L C S = C h e a t × P W F P 2 C i x
The optimum thickness of insulation material can be determined by maximizing the LCS. So, x can be calculated by setting the differential of LCS with respect to x.
The present worth factor (PWF) is calculated based on the inflation and interest rates.
P 1 = P W F ( d , i , n ) = j = 1 N ( 1 + i ) j 1 ( 1 + d ) j { i d 1 [ 1 ( 1 + i 1 + d ) N ]             i f     i d N 1 + d             i f   i = d
P 2 = 1 + P 1 M s R v ( 1 + d f ) N
where Ms is the ratio of the annual maintenance and operation cost to the original first cost, Rv is the ratio of the resale value to the first cost. P2 can be taken as 1 if the maintenance and operation cost is zero. N is the lifetime and is 10 years based on research [27,28].
The payback period of insulation cost, Np can be calculated by setting the LCS to be zero, the payback period Np for heating is given by:
N p = ln [ 1 ( P 2 C i H u η ( R w t + R w t 2 k i n s ) ( d i ) / 86400 H D D C i ( 1 + d ) ] ln [ ( 1 + i ) / ( 1 + d ) ]
If i = d, the payback period Np can be calculated by:
N p = P i C i H u η ( R w t + R w t 2 k i n s ) ( 1 + i ) 86400 H D D C c o a l

3. Results

Using an economic analysis of total cost, the optimum insulation thickness was calculated based on the thermal characteristic of wall and insulation materials, energy consumption, and payback period. Three types of typical walls (clay brick (CB), hollow concrete block (HCB), and fly ash block (FSB)) combined with four insulation materials including the expanded polystyrene, foamed PVC, perlite, and rock wool were calculated.

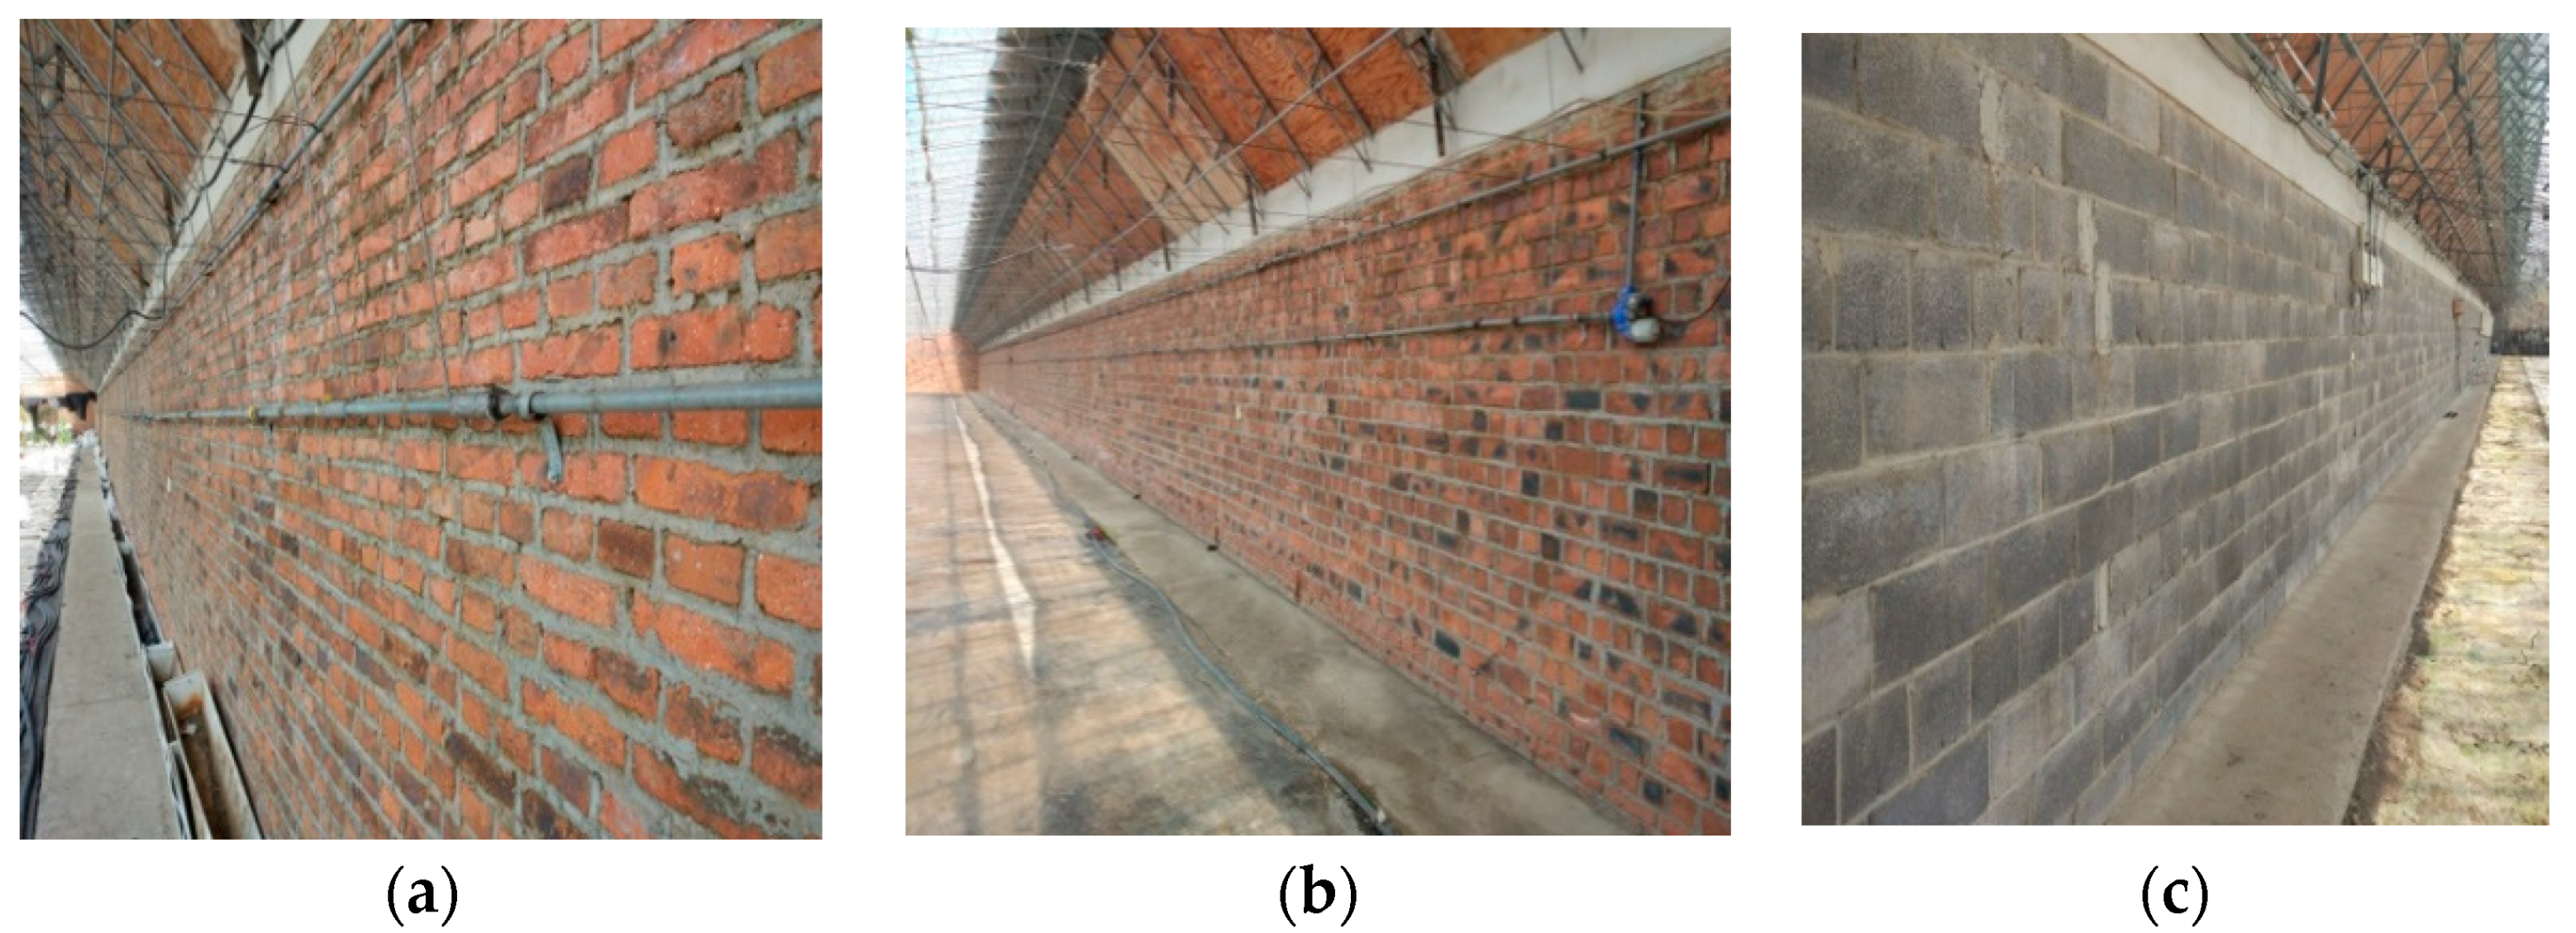
3.1. Effect of Insulation Thickness on the Energy Saving for Three Typical Walls

Figure 5 shows the energy saving over the life time of 10 years of four insulations on the thickness for three typical walls. With the increase in insulation thickness, there were dramatic increases in the energy savings and the maximum energy saving values were reached in all three typical walls. Then, with the increase in insulation thickness, variations in energy saving are gentle. It means that the increase in thickness will not influence the energy savings when the insulation thickness reached fairly thick. It can be seen that the maximum energy cost varies between 4.2 and 7.3 USD/m2 depending on the wall and the price of the insulation material. The maximum energy saving for the clay brick wall is 4.89 USD/m2 with expanded polystyrene at 0.17 m. The maximum energy saving for the hollow concrete block wall is 7.3 USD/m2 with rock wool at 0.15 m. The maximum energy saving for the fly ash block wall is 4.2 USD/m2 with rock wool at 0.13 m. Variations in energy savings showed almost the same trends using expanded polystyrene and rock wool as insulators. This can be explained by the fact that two insulation materials have similar values in thermal conductivity and cost. The least economical insulation material is foamed PVC as when the thickness of insulator is over the optimum value the energy saving showed a decrease trend. This result is in conformity with results in other literature [29,30].

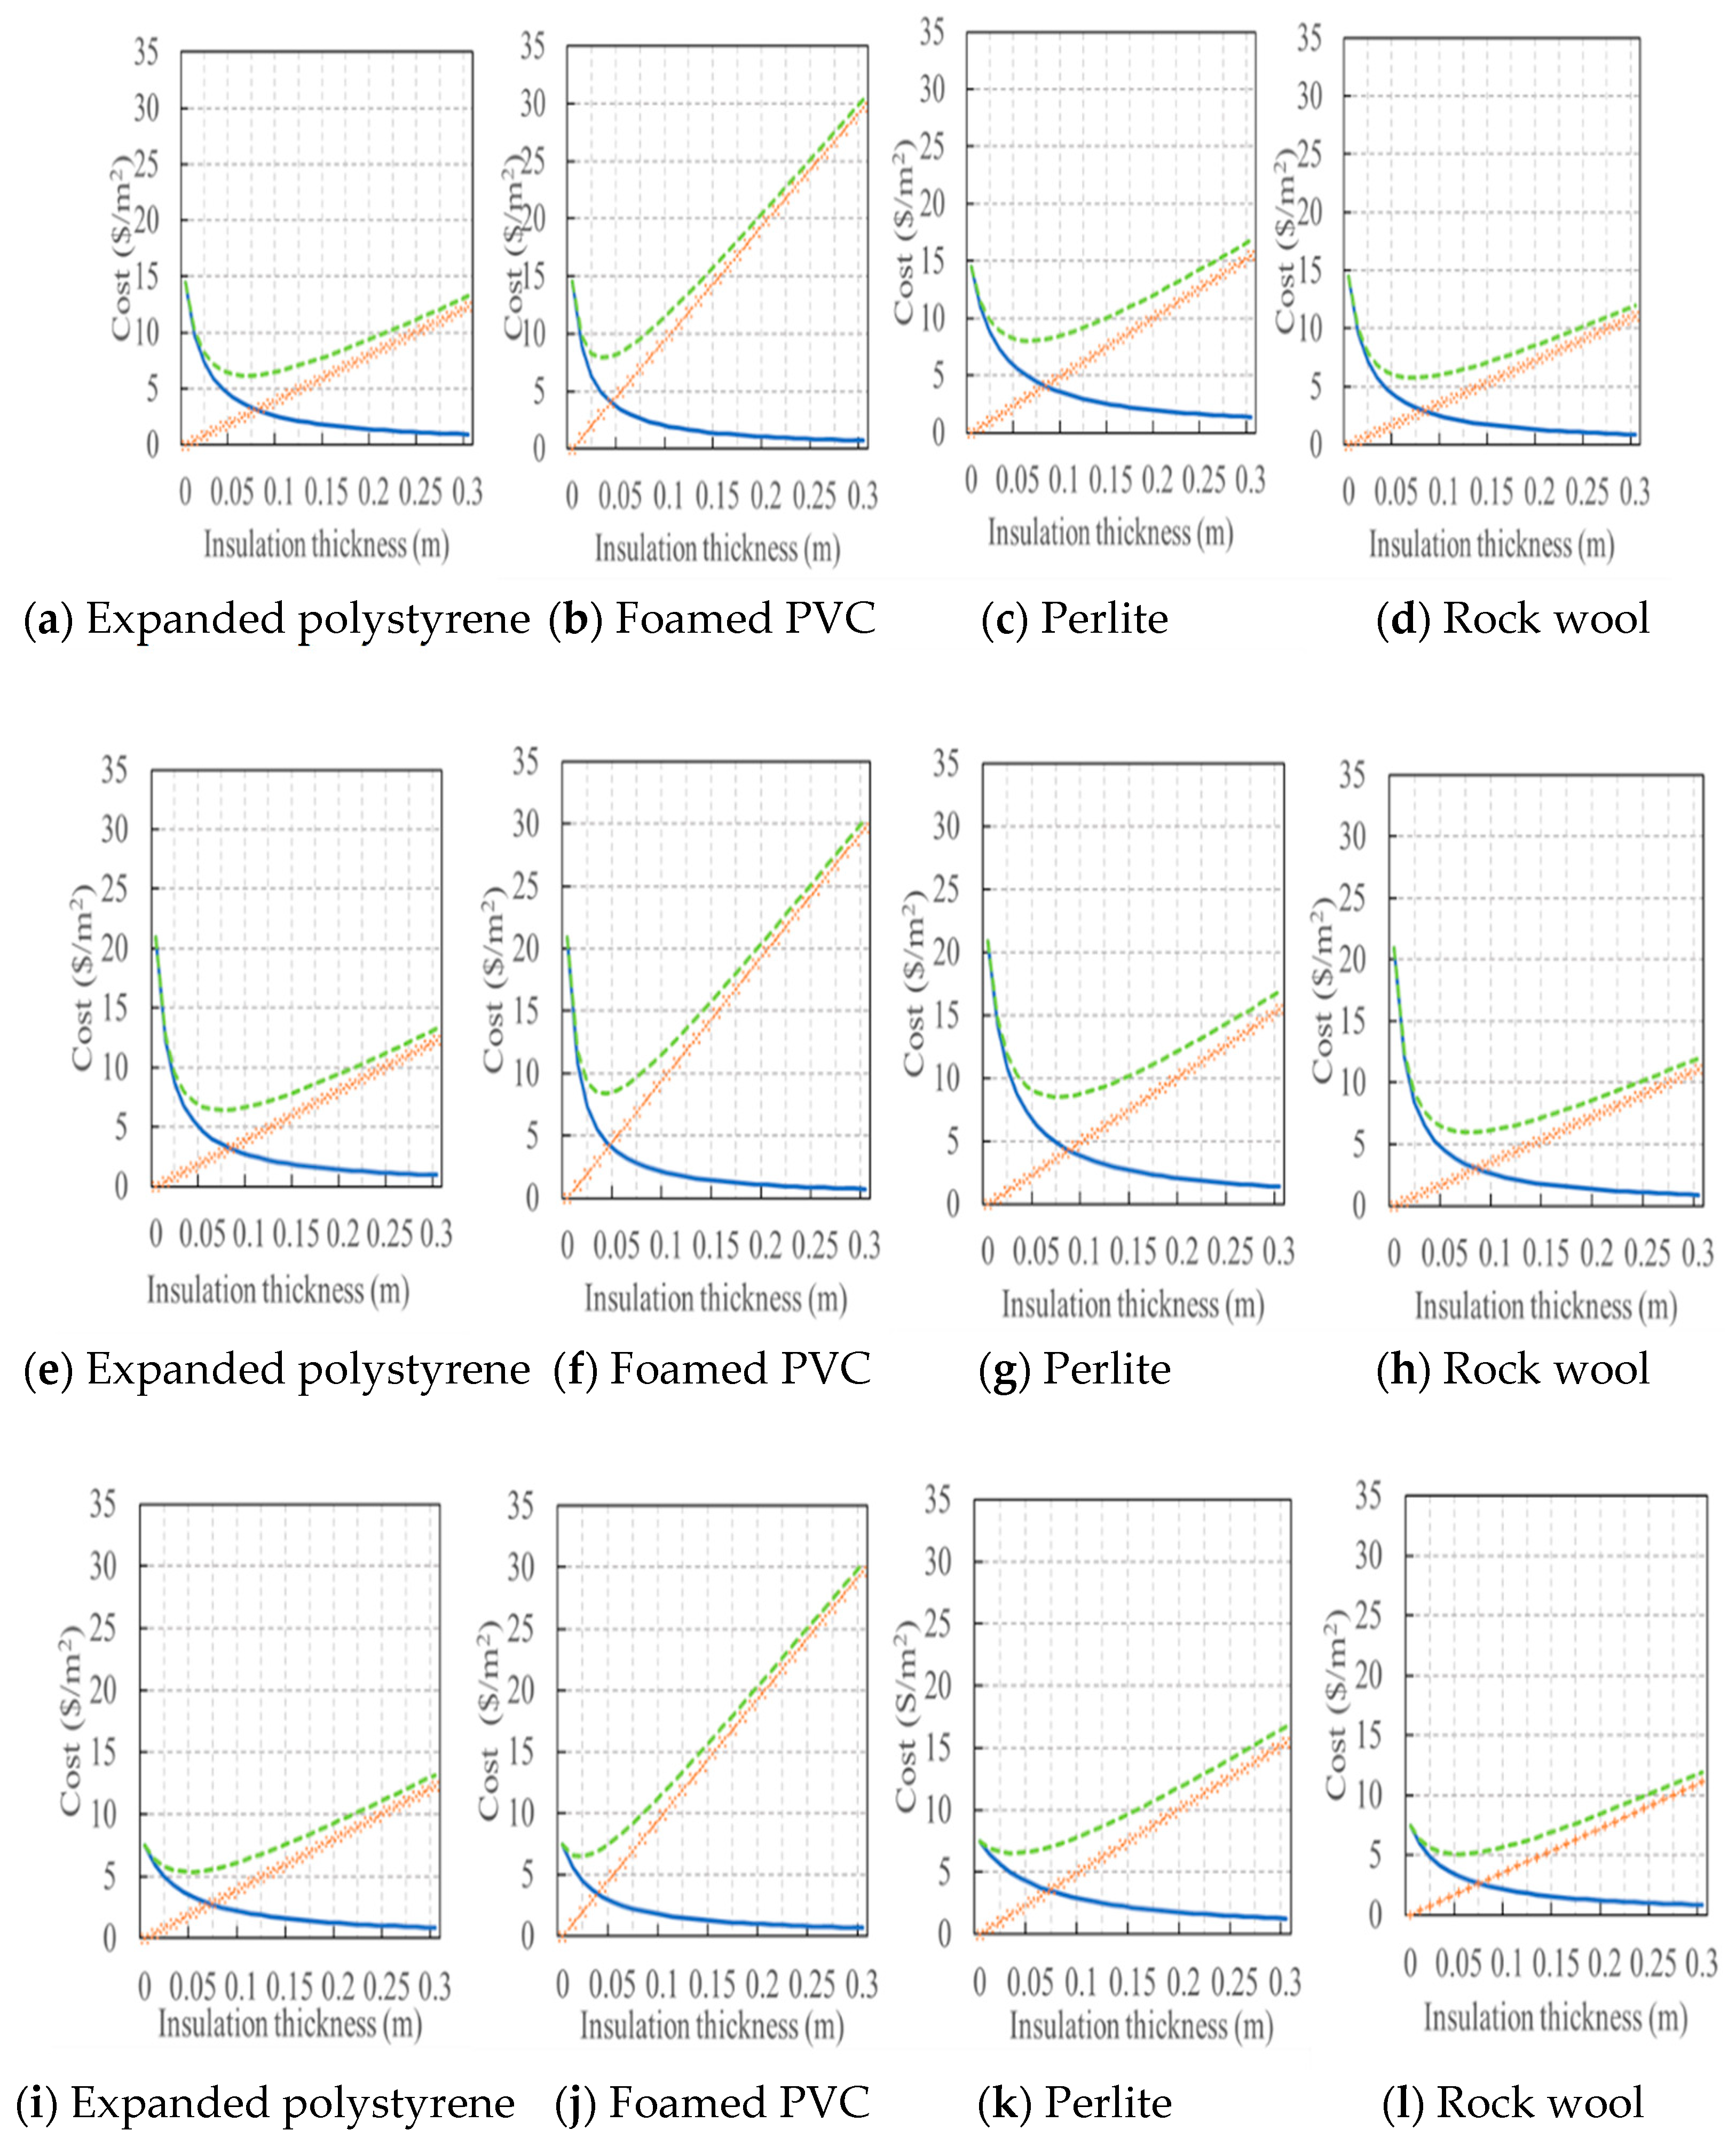
3.2. Annual Cost of Heating versus Insulation Thickness for Different Insulating Materials

Figure 6 shows the total cost of the fuel and insulating materials used in three walls. The relationship between the insulation cost and thickness is a linear relationship. It can be noted from these figures that the total cost was correlated with the cost of insulating material. The cost of fuel decreases obviously with the increase in the insulation thickness and then the cost tends to be a constant value. The variations in the total cost are near parabolic curves. The optimum insulation thickness can be found when then the total cost reaches the minimum value of the curve. The minimum cost appears at the point of insulation thickness of 0.05 m for the clay wall with the rock wool, 0.04 m for the foamed PVC with the rock wool, and 0.05 m for the fly ash block wall with rock wool. The total cost of the fly ash block with rock wool as the insulation layer is the lowest among all wall and insulation material compositions, with the total cost only 5 USD/m2. This result identified the composition function of insulation materials and wall materials which can be used as a supplement to other theoretical results [30].

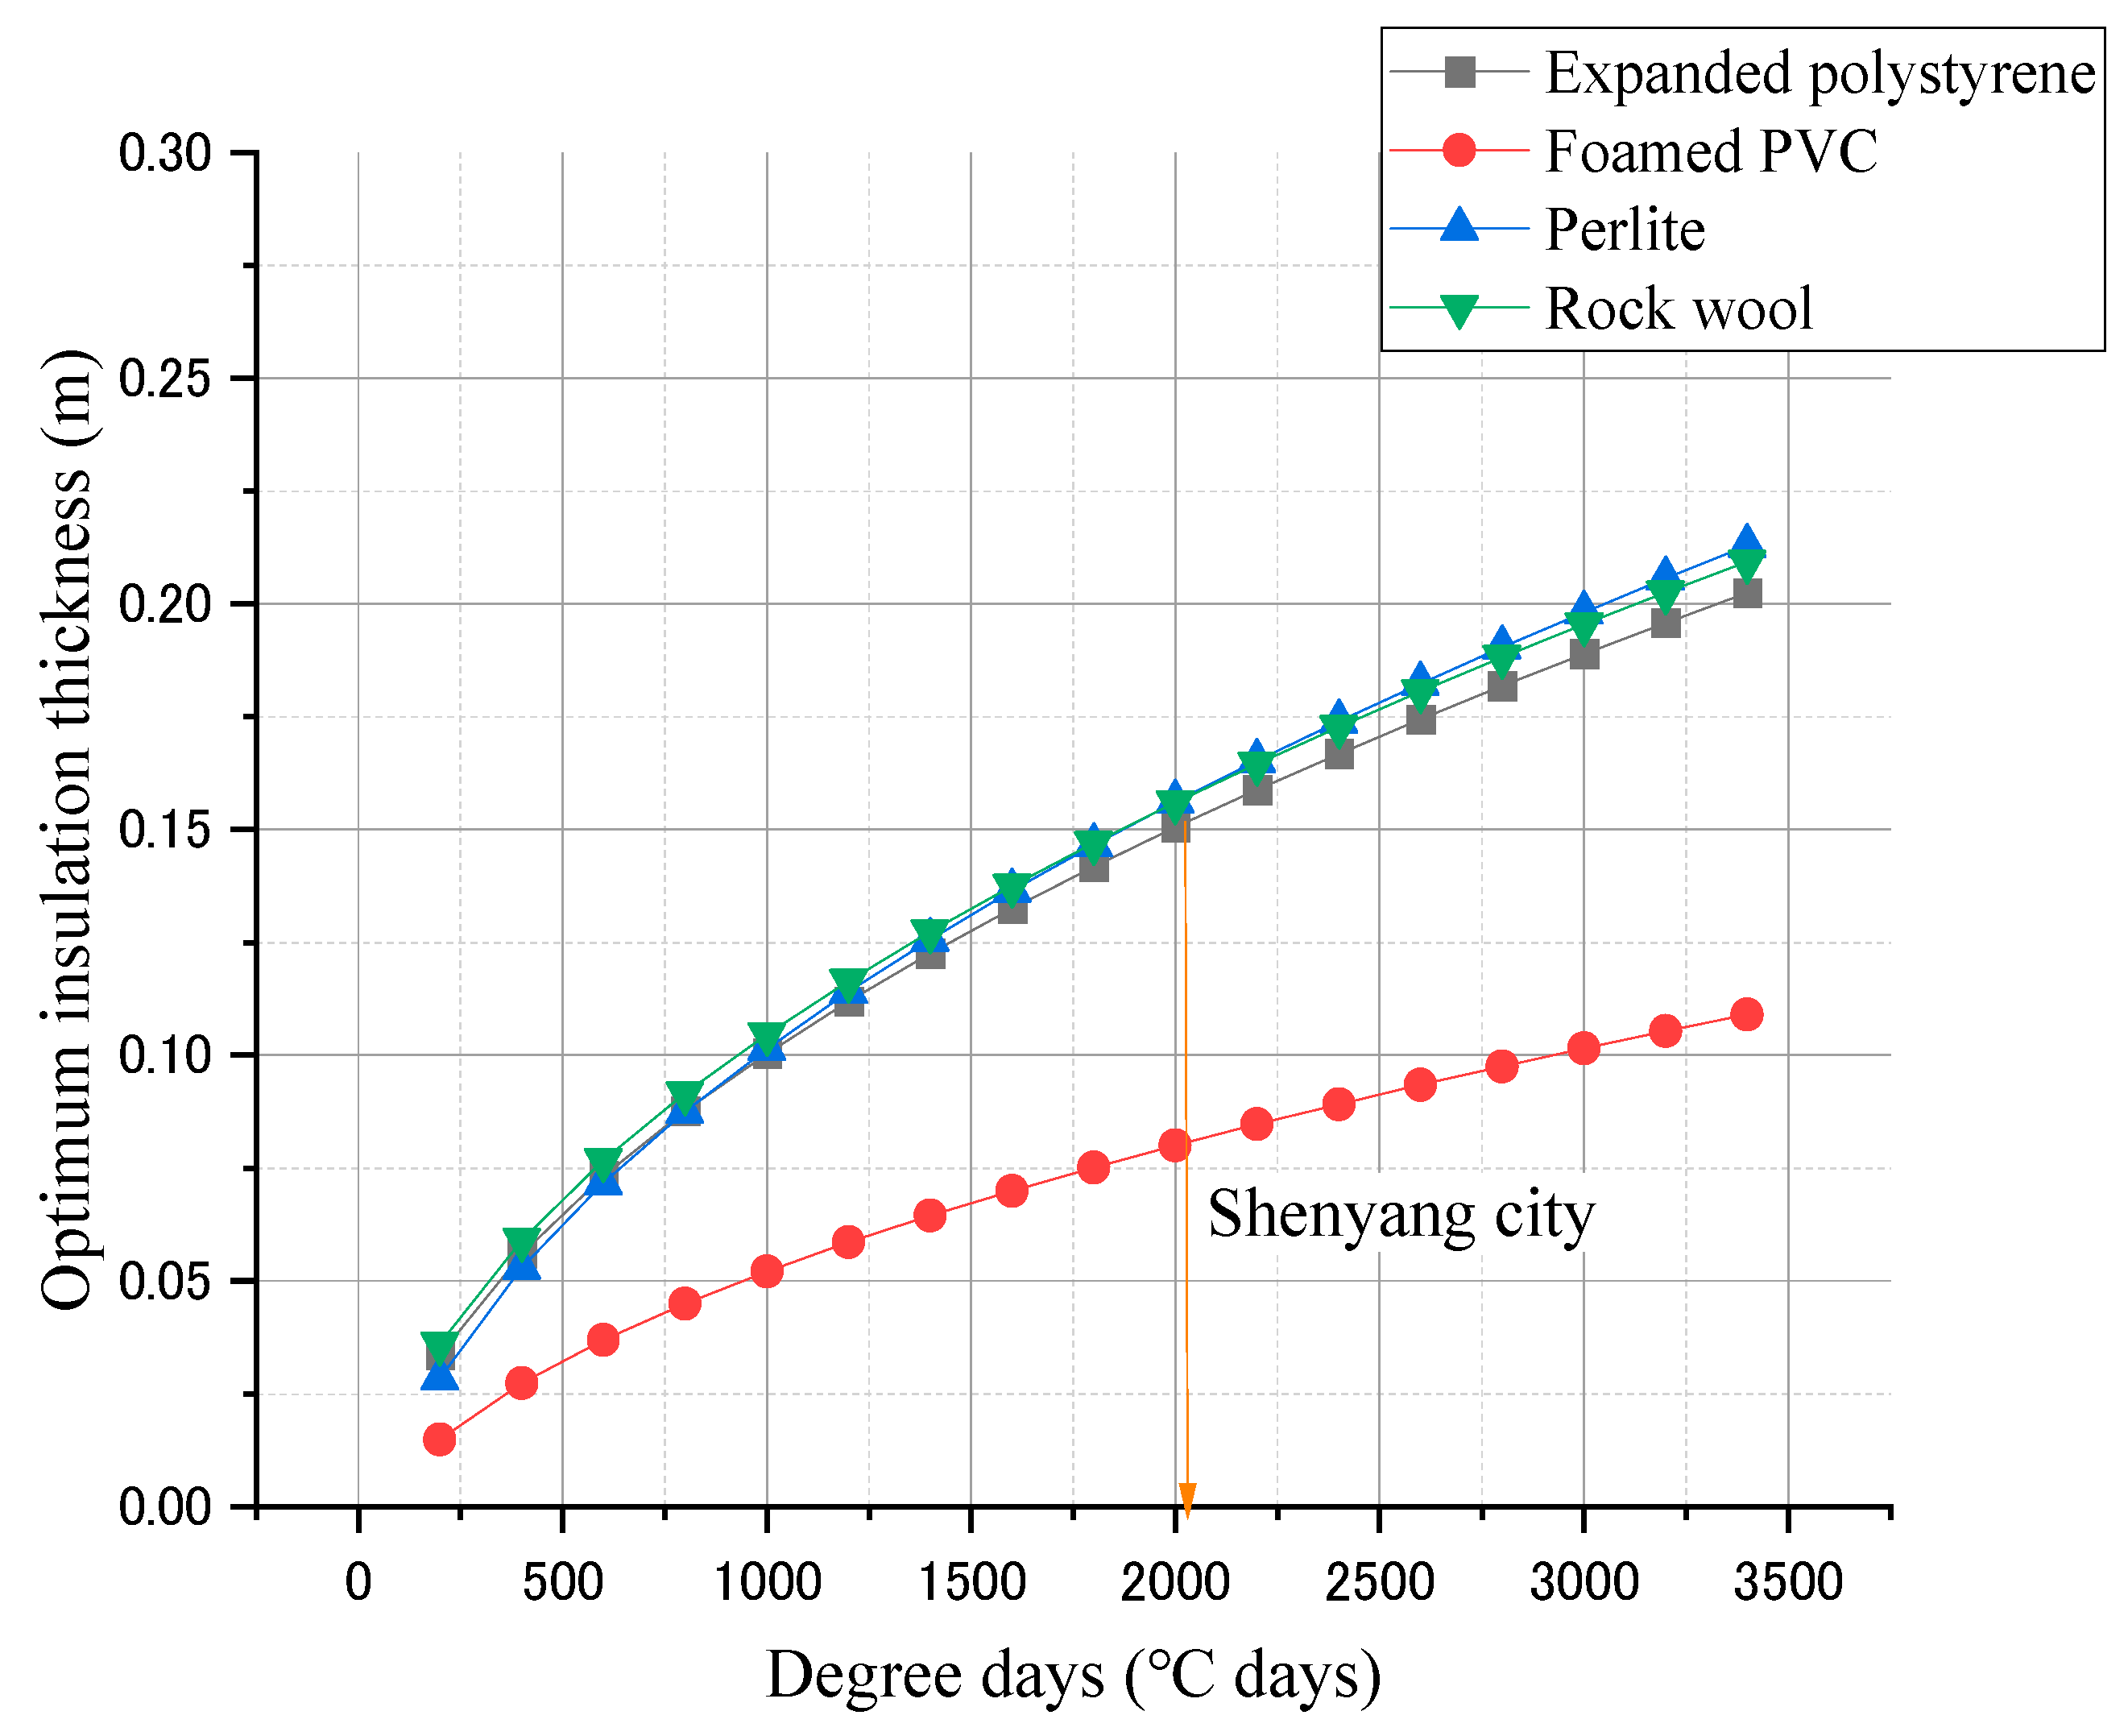
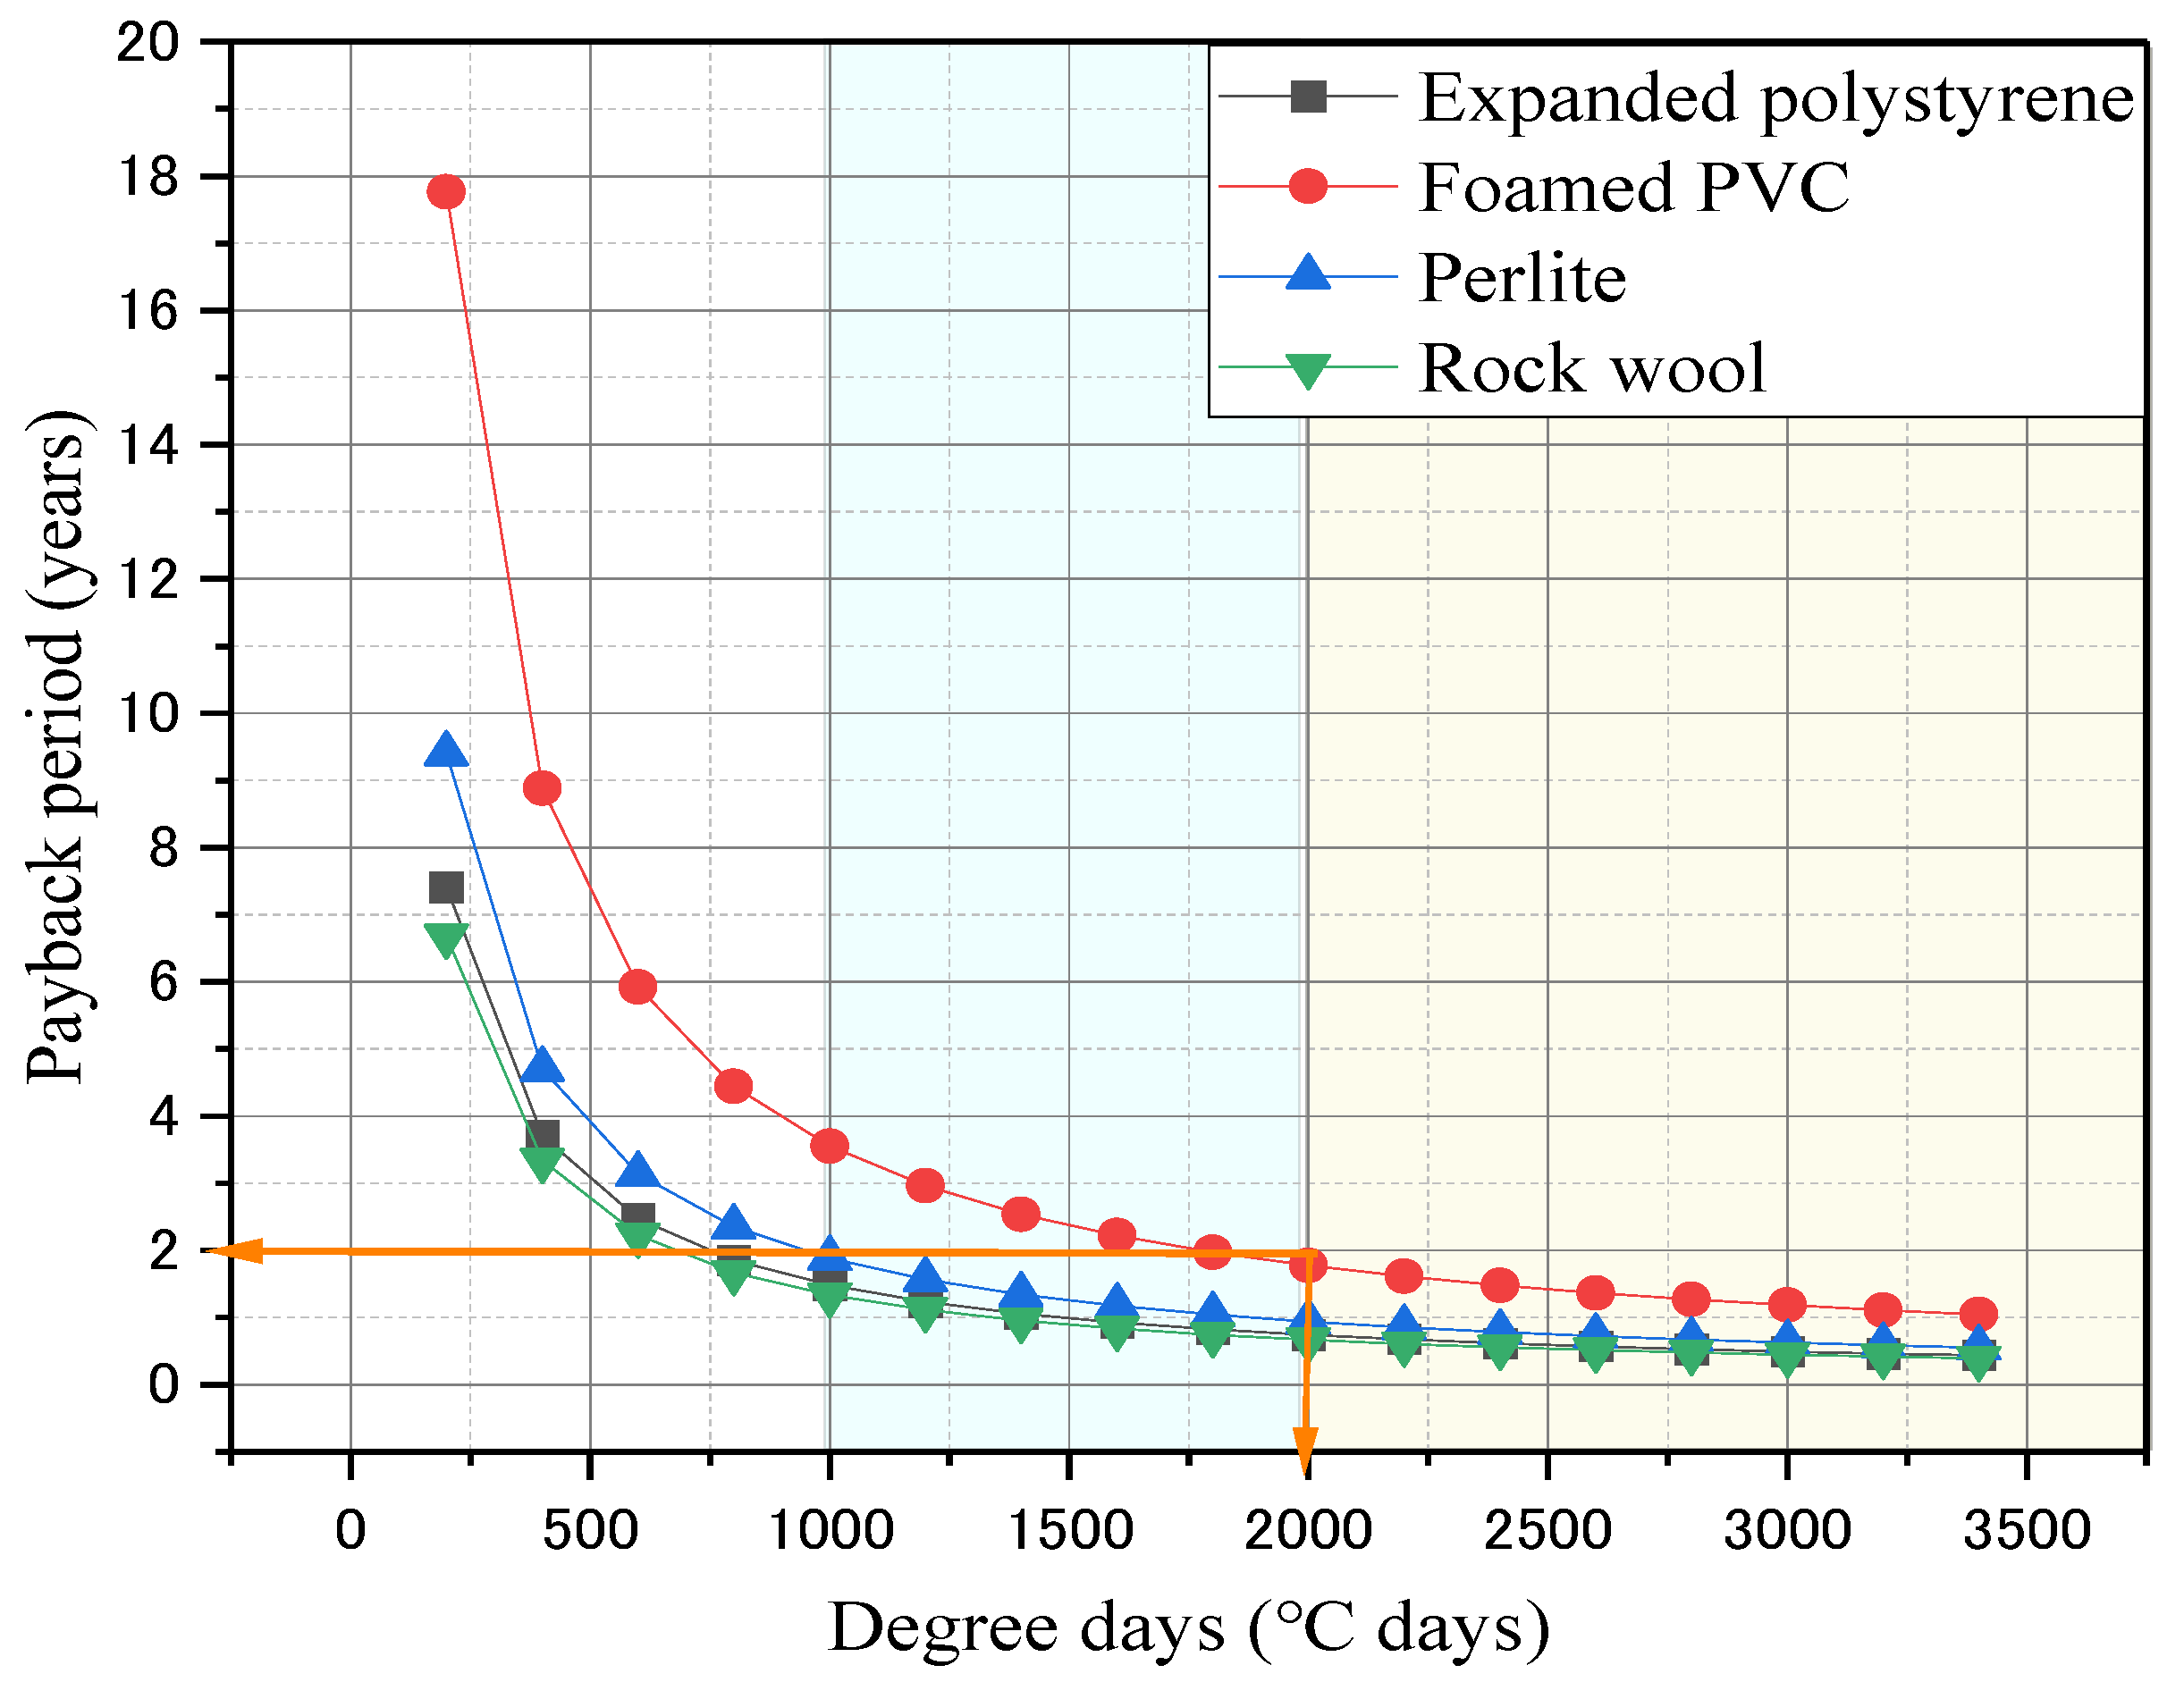
3.3. Impact Factors on the Optimum Insulation Thickness

Figure 7 illustrates the effect of thermal resistance of the composite wall on the optimum insulation thickness. The optimum insulation thickness will decrease linearly with the increase in Rwt. For the insulating material of expanded polystyrene, perlite, and rock wool, the optimum simulation thickness was in the range of 0.1–0.2 m and was 0.05–0.1 m for that in the insulation of foamed PVC, with the Rwt of 0.2–1.2 m2K/W. According to the result, the optimum insulation thickness can be proposed in Shenyang for these representative materials.
Figure 8 shows the effect of Rwt on the payback period for different insulating materials at the optimum thickness. It can be found the payback period appears linearly with the increase in Rwt and the increase rates are different in four insulating materials. As the price of foamed PVC is higher than other materials, the payback period of foamed PVC is over 4 years and is relatively longer than other insulating materials. Although high thermal characteristics are important for maintaining the optimum thermal environment theoretically, based on the result in the payback period the suggested Rwt for insulating materials is in the range of 0.2–1.2 m2K/W. This means that the improvement in the thermal characteristic of walls is a practical method for the actual running of the CSG.
Figure 9 illustrates the effect of degree-days on the optimum insulation thickness which is based on different degree-days and calculated from Equation (12). The degree-days in Shenyang city is about 2070 (°C day) and the optimum insulation thickness for each material can be found on the vertical axis. According to these results, the optimum insulation thickness for different areas can be proposed. With the increase in HDD, the optimum insulation thickness showed an increasing trend. The insulator of foamed PVC showed better thermal characteristics than other insulators, so it can be suggested for use in high HDD regions.
Relationships between payback period and optimum thickness of insulating material are shown in Figure 10 based on the optimum insulation thickness of different insulating materials. With the increase in energy consumption days, the payback period tends to decrease. It can be found that the payback period decreases dramatically from 200 to 2000 °C days of HDD. While, the variations in payback periods became gentle after the HDD over 1600 °C days and are within 2 years for four insulations. According to Equation (9), values of HDD are decided by the meteorological parameters and the setting temperature in CSG. It can be seen that the insulation materials are more economic for the cold climate areas where the HDD over 2000 °C days.

4. Discussion

CSGs are currently widely used in the northeast of China and realized the low energy consumption in the horticultural sector, regardless of the low temperature in winter. To improve the thermal insulation ability and the practicality, research has been focused on the structure and the material of CSGs to improve the energy store and conservation. To clarify the effect of material and structure combined with the economical characteristics during conservation, in this study, the optimal combination of the insulation thicknesses and the economic benefit of external walls of CSGs were analyzed in Shenyang region of China which is the representative vegetable production area. The optimum insulation thickness is estimated by maximizing the energy saving in conservation. In order to contribute to the assessment of CSG, we focused on three kinds of walls which are widely applied in the production including clay brick, hollow concrete block wall, fly ash block and wall, and four types of insulation materials including expanded polystyrene, foamed PVC, perlite, and rock wool were proposed using cost analysis in this research.
Based on structure of main walls, it can be found that the main part of CSGs with hollow concrete blocks showed high-energy saving characteristics in the energy conservation. This occurs because the structure of the hollow concrete block improves the thermal insulation compared with other materials. So, the main wall made by hollow concrete blocks with insulating material can be suggested as an economic composite structure to the cold area where the HDD over 2000 °C days.
Regarding the energy consumption in local climatic conditions (Shenyang city) and the cost of insulating materials, expanded polystyrene and rock wool are recommended insulating materials. Although the foamed PVC has lower thermal conductivity, it is not fit for use as an energy-saving material due to the high price.
Regarding the economic payback period over a lifetime, it can be found that the energy consumption in local climatic conditions had a significant effect on payback period. The cost of the fly ash block with rock wool is the lowest, with the cost only 5 USD/m2. Based on the calculation of HDD, it can be found that the insulating materials are more economic for the cold climate areas.
Energy store and conservation are two important functions of walls to realize the thermal environment of CSGs. In this study, we focused on the function of energy conservation to analyze the optimum insulation thickness in walls. All structures of walls and insulating materials are the most representative of CSGs in the northeast of China using coal as an energy source for heating. The practical value and significance of this research provide a useful tool for selecting the economic insulation materials according to the structure of walls in CSGs. Moreover, the results of this study can be extended to the analysis of other materials and greenhouses in different climates. Future work can involve the energy efficiency calculations in different regions to achieve more globally energy savings in CSGs.

Author Contributions

Conceptualization, H.X. and T.L.; methodology, R.W.; software, X.G., C.M. and J.D.; writing—review and editing, R.W. All authors have read and agreed to the published version of the manuscript.

Funding

This research was funded by National Key Research Program of China (grant number 2019YFD1001902).

Institutional Review Board Statement

Not applicable.

Informed Consent Statement

Not applicable.

Data Availability Statement

Data presented in this study are available on fair request to the corresponding author.

Acknowledgments

We gratefully acknowledge Wei Jia for generously providing us with materials used for experiments.

Conflicts of Interest

The authors declare no conflict of interest.

Nomenclature

Cicost of insulating material (USD/m3) Q h e a t energy consumption for heating per unit area of external wall (W/m2)
Cheattotal heating cost (USD/m2 year)Rinsthermal resistance of insulating material (m2K/W)
Ccoalcost of coal (USD/m2 year)Rwttotal resistance of the main wall (m2K/W)
C i n s cost of insulating material (USD/m2) Rvthe ratio of the resale value to the first cost (%)
dinterest rate (%)Riheat transfer coefficients of the inside (m2K/W)
E h e a t energy requirement for heating per unit area of external wall (W/m2)Roheat transfer coefficients of the outside (m2K/W)
HDDheating degree-day (°C days)Rwthermal resistance of insulation of wall without insulation materials (m2K/W)
Huheating value of coal (J/kg) T s e t inside setting temperature of CSG (°C)
iinflation rate (%) T i inside ambient temperature (°C)
kinsthermal conductivity of insulating material (W/(mK)) T o outside ambient temperature (°C)
LCTlife cycle total cost (USD) T o u t average outside temperature for recent five years (°C)
LCSlife cycle saving (USD)Uoverall heat transmission coefficient of external wall (W/(m2 K))
Msratio of the annual maintenance and operation cost to the original first cost (%)xinsulation thickness (m)
Nlifetime of CSG (years)ηefficiency of the heating system
P1ratio of the life-cycle fuel cost to the first-year fuel cost ρ density of material (kg/m3)
P2ratio life-cycle expenditures to initial investmentjfirst count of heating degree days
PWFpresent worth factornlast count of heating degree days
qheat loss per unit area of external wall (W/m2)

References

  1. Tong, G.; Christopher, D.M.; Zhao, R.; Wang, J. Effect of Location and Distribution of Insulation Layers on the Dynamic Thermal Performance of Chinese Solar Greenhouse Walls. Appl. Eng. Agric. 2014, 30, 457–469. [Google Scholar]
  2. Xu, F.; Li, S.; Ma, C.; Zhao, S.; Han, J.; Liu, Y.; Hu, B.; Wang, S. Thermal Environment of Chinese Solar Greenhouses: Analysis and Simulation. Appl. Eng. Agric. 2013, 29, 991–997. [Google Scholar]
  3. Mobtaker, H.G.; Ajabshirchi, Y.; Ranjbar, S.F.; Matloobi, M. Simulation of thermal performance of solar greenhouse in north-west of Iran: An experimental validation. Renew. Energy 2019, 135, 88–97. [Google Scholar] [CrossRef]
  4. Chen, D.; Zheng, H.; Liu, B. Comprehensive study on the meteorological environment of the sunlight greenhouse I. Preliminary study on the thermal effect of the wall body and covering materials. Trans. Chin. Soc. Agric. Eng. 1990, 62, 77–81. [Google Scholar]
  5. Tong, G.; Wang, T.; Bai, Y.; Liu, W. Heat transfer property of wall in solar greenhouse. Trans. Chin. Soc. Agric. Eng. 2003, 193, 186–189. [Google Scholar]
  6. Tong, G.; David, M.C. Simulation of temperature variations for various wall materials in Chinese solar greenhouses using computational fluid dynamics. Trans. Chin. Soc. Agric. Eng. 2009, 253, 153–157. [Google Scholar]
  7. Liu, S.; Xue, Q.; Li, C.; Wang, T.; Li, Z.; Gong, Z. Effects of Different Wall Treatments on Thermal Insulation of Solar Greenhouse in Tianjin Area. Chin. Agric. Sci. Bull. 2012, 28, 170–179. [Google Scholar]
  8. Guan, Y.; Bai, J.; Gao, X.; Hu, W.; Chen, C.; Hu, W. Thickness Determination of a Three-layer Wall with Phase Change Materials in a Chinese Solar Greenhouse. Procedia Eng. 2017, 205, 130–136. [Google Scholar] [CrossRef]
  9. Zhang, X.; Wang, H.; Zou, Z.; Wang, S. CFD and weighted entropy based simulation and optimisation of Chinese Solar Greenhouse temperature distribution. Biosyst. Eng. 2016, 142, 12–26. [Google Scholar] [CrossRef]
  10. Li, X.; Chen, Q. Effects of different wall materials on the performance of heat preservation of wall of sunlight greenhouse. Chin. J. Eco-Agric. 2006, 14, 185–189. [Google Scholar]
  11. Zhang, L.Y.; Xu, G.Y.; Ma, C.W.; Lan, Y. Application of aerated concrete in solar greenhouses. J. Shenyang Agric. Univ. 2006, 37, 459–462. [Google Scholar]
  12. Kurekci, N.A. Determination of optimum insulation thickness for building walls by using heating and cooling degree day values of all Turkey’s provincial centers. Energy Build. 2016, 118, 197–213. [Google Scholar] [CrossRef]
  13. Yu, J.; Yang, C.; Tian, L.; Liao, D. A study on optimum insulation thickness of external walls in hot summer and cold winter zone of China. Appl. Energy 2009, 86, 2520–2529. [Google Scholar] [CrossRef]
  14. Yuan, J.; Farnham, C.; Emura, K.; Alam, M.A. Proposal for optimum combination of reflectivity and insulation thickness of building exterior walls for annual thermal load in Japan. Build. Environ. 2016, 103, 228–237. [Google Scholar] [CrossRef]
  15. Mazzeo, D.; Baglivo, C.; Panico, S.; Congedo, P.M. Solar greenhouses: Climates, glass selection, and plant well-being. Sol. Energy 2021, 230, 222–241. [Google Scholar] [CrossRef]
  16. Bonuso, S.; Panico, S.; Baglivo, C.; Mazzeo, D.; Matera, N.; Congedo, P.M.; Oliveti, G. Dynamic Analysis of the Natural and Mechanical Ventilation of a Solar Greenhouse by Coupling Controlled Mechanical Ventilation (CMV) with an Earth-to-Air Heat Exchanger (EAHX). Energies 2020, 13, 3676. [Google Scholar] [CrossRef]
  17. Mahdavi, S.; Sarhaddi, F.; Hedayatizadeh, M. Energy/exergy based-evaluation of heating/ cooling potential of PV/T and earth-air heat exchanger integration into a solar greenhouse. Appl. Therm. Eng. 2019, 149, 996–1007. [Google Scholar] [CrossRef]
  18. Li, T.; Han, Y.; Liu, X.; Luo, X.; Xu, H. Heat transfer effect of cylinder ektexine on air temperature in greenhouse. Trans. Chin. Soc. Agric. Eng. 2011, 272, 237–242. [Google Scholar]
  19. Aynur, U.; Figen, B. Determination of the energy savings and the optimum insulation thickness in four the different insulated exterior walls. Renew. Energy 2010, 35, 88–94. [Google Scholar]
  20. Vincelas, F.F.C.; Ghislain, T. The determination of the most economical combination between external wall and the optimum insulation material in Cameroonian’s buildings. J. Build. Eng. 2017, 9, 155–163. [Google Scholar] [CrossRef]
  21. Wang, Y.; Lü, A.; Shi, Y.; Sun, R. Application of the Technology of Exhaust Gas Recirculation to a Diesel-Hot-Air Stove in Greenhouses. Trans. Chin. Soc. Agric. Eng. 2002, 184, 104–107. [Google Scholar]
  22. Li, N.; Li, Z.F.; Shen, S.H. Assessment of the heating effect of electric warm-air machine in solar greenhouse and its economic investment. J. Meteorol. Environ. 2013, 294, 100–105. [Google Scholar]
  23. John, A.D.; William, A.B. Solar Engineering of Thermal Processes; A Wiley-Interscience Publication: Hoboken, NJ, USA, 1991; Volume 910, pp. 770–781. [Google Scholar]
  24. Liu, C.; Ma, C.; Wang, P.; Zhao, S.; Cheng, J.; Wang, M. Analysis on affecting factors of heat preservation properties for thermal insulation covers. Trans. Chin. Soc. Agric. Eng. 2015, 31, 186–193. [Google Scholar]
  25. Kaygusuz, K.; Kaygusuz, A. Energy and sustainable development part II: Environments impacts of energy use. Energy Sources 2004, 26, 1071–1082. [Google Scholar] [CrossRef]
  26. Dai, J.; Luo, W.; Qiao, X.; Wang, C. Model based decision support system for greenhouse heating temperature set point optimization. Trans. Chin. Soc. Agric. Eng. 2006, 2211, 187–191. [Google Scholar]
  27. Li, T.L. Current situation and prospects of greenhouse industry development in China. J. Shenyang Agric. Univ. 2005, 36, 131–138. [Google Scholar]
  28. Yoon, J.; Lee, E.J.; Krarti, M. Optimization of Korean crop storage insulation systems. Energy Conversat. Manag. 2003, 44, 1145–1162. [Google Scholar] [CrossRef]
  29. Yang, J.; Zou, Z.; Zhang, Z.; Wang, Y.; Zhang, Z.; Yan, F. Optimization of earth wall thickness and thermal insulation property of solar greenhouse in Northwest China. Trans. Chin. Soc. Agric. Eng. 2009, 25, 180–185. [Google Scholar]
  30. Xu, H.; Zhang, Y.; Li, T.; Wang, R. Simplified Numerical Modeling of Energy Distribution in a Chinese Solar Greenhouse. Appl. Eng. Agric. 2017, 33, 291–304. [Google Scholar] [CrossRef]
Figure 1. A photo showing the appearance of the CSG in this study.
Agronomy 12 01104 g001
Figure 2. Average air temperature in Shenyang city (2014–2018), China.
Agronomy 12 01104 g002
Figure 3. The inside surface of three typical walls used in CSGs. (a) Clay brick wall. (b) Hollow concrete block wall. (c) Fly ash block wall.
Agronomy 12 01104 g003
Figure 4. Typical structure of walls (unit, mm).
Agronomy 12 01104 g004
Figure 5. Lifetime energy savings versus thickness of insulating materials for three typical walls. (a) Clay brick wall. (b) Hollow concrete block wall. (c) Fly ash block wall.
Agronomy 12 01104 g005
Figure 6. Effect of thickness of insulating materials on the total cost for three typical walls. (ad) For the clay brick wall, (eh) for the hollow concrete block wall, and (il) for the fly ash block wall.
Agronomy 12 01104 g006
Figure 7. The effect of Rwt on the optimum thickness of insulating materials.
Agronomy 12 01104 g007
Figure 8. The effect of Rwt on the payback period for different insulating materials at the optimum thickness.
Agronomy 12 01104 g008
Figure 9. The effect of degree-days on the optimum thickness of insulating materials.
Agronomy 12 01104 g009
Figure 10. The relationship between degree-days and the payback period for different insulating materials at the optimum thickness.
Agronomy 12 01104 g010
Table 1. Thermal characteristic and cost of insulating materials.
Insulation MaterialThermal Conductivity (W/mK)Cost of Insulation Material (USD/m2)
Expanded polystyrene0.04041.00
Foamed PVC0.03098.80
Perlite0.06051.50
Rock wool0.03836.98
Table 2. Thermal characteristic of wall materials.
Wall MaterialThermal Conductivity (w/mk)Specific Heat (J/kgK)Density (kg/m3)
Clay brick0.4651800880
Hollow concrete block0.6711250860
Fly ash block0.2421550800
Table 3. The parameters used in calculations.
ParameterValue
Price of coal0.33 USD/kg
Efficiency of the heating system (η)0.65
Heating value of coal (Hu) 29.295   × 106 J/kg
Inflation rate (i)4%
Interest rate (d)4%
Lifetime of CSG (N)10 years
Present worth factor (PWF)9.52
Heat transfer coefficients of the inside (Ri)0.13 m2K/W
Heat transfer coefficients of the outside (Ro)0.04 m2K/W
Ratio of the annual maintenance and operation cost to the original first cost (Ms)1.2%
Publisher’s Note: MDPI stays neutral with regard to jurisdictional claims in published maps and institutional affiliations.

