Abstract
Nitrogen (N) plays a vital role in plant growth; however, the yield response to N fertilizer is regularly declining in the major cropping systems due to overuse and the upper limit of yields. Heavy losses of N are also documented due to its excessive use in the rice-wheat rotation system, resulting in low nitrogen-use efficiencies (NUE) and environmental problems. Therefore, a three-year field experiment was performed with different N managements to investigate the impact of reduced N input rates in this exhaustive cropping system. Reducing the N application rates did not affect the wheat and rice yields significantly, only during the second wheat season was the yield slightly reduced as compared to higher N input treatments. Decreasing the N input rates in the prior crop and present crop, and the interactions of both rice and wheat seasons (R × W) did not influence the yields of either crop. A reduction in N fertilizer had a considerable impact on dry matter production during the wheat seasons but demonstrated no effect during the rice season. The accumulation of N was significantly reduced during both crop seasons by lowering the rate of N application. In addition, the NUE indices were significantly influenced by N fertilizer application rates. In conclusion, N fertilizer input rates for both rice and wheat crops can be lowered as compared to present fertilization rates without any risk of yield decline. Lowering the N input increases the NUE and effectively reduces N losses, and soil N status can also be maintained.
1. Introduction
Rice and wheat are widely grown throughout the world and are a staple food for millions of people. Rice is a predominant source of calories for more than half of the world’s population [1]. China leads the world in producing both rice and wheat. The yields of rice and wheat in China during 2020 were approximately 213.61 m tones (30.341 m ha) and 134.25 m tones (23.38 m ha), respectively [2]. Crop rotation is widely practiced across the world to produce cereal grains. The rice-wheat rotation system covers 9.5 to 13.5 M ha of land and is practiced in sub-tropical to warm temperate climatic zones. It is the most important food production base in the Chinese agriculture system [3,4], and is commonly adopted by farmers around the Yangtze River Basin, where both crops have been grown for years in sequence [5].
Fertilizers are very important for cereal crop production, and among them, nitrogen (N) is an important fertilizer for uplifting the grain yields of cereal crops [6]. Therefore, high quantities of manufactured N are used throughout the world to boost the production of cereals such as rice and wheat crops [7]. China consumes about one third of the total N produced worldwide. In China, about 26.87 M tons of N was consumed during the year 2019, which accounts for about 25% of the world’s use [8]. The total application of N during rice-wheat rotation is 550 kg ha−1 which may increase to 650 kg ha−1 in some counties of the Taihu Lake region [9]. For the rice season only, the N application rate is increased to 360 kg ha−1 in some regions of Jiangsu Province [10]. However, the yields do not increase in parallel with N consumption; from 1990 to 2008, N consumption increased by approximately 50%, while only a 10% increase in crop yields was observed [11]. The overuse of fertilizers, especially N, is very common, and the use of organic fertilizers has all but stopped except in open field vegetables [12,13]. The high nutrient input results in high N residues and a higher release of reactive N into the environment. Ju et al. [14] stated that N losses of even 329 kg ha−1 were observed in a single double-cropped cycle under farmer’s fertilization practice in rice and wheat rotation, and this high application of N fertilizers has resulted in well-described deadly effects on the environment, such as eutrophication [15], acidification, and greenhouse gas emissions (GHGs) [16,17].
Nitrogen use efficiency (NUE) is an index generally utilized in evaluating fertilizer management. These excessive N inputs, besides harming the environment, also significantly decrease the NUE [18]. The NUE is further divided into various components, such as agronomic efficiency (AEN), physiological efficiency (PEN), partial factor productivity (PFPN), and recovery efficiency (REN) [19,20]. The results of pooled research from the USA, Asia, and Europe have proposed the NUE catalogs under well-managed practices as follows: AEN (25–30 kg kg−1 N), PEN (50–60 kg kg−1 N), PFPN (60–80 kg kg−1 N), and REN (0.5–0.8 kg kg−1 N) [21]. The agronomic efficiency reported in the study region is hardly 12 kg kg−1 N, while in advanced countries it is double the value observed in China [22,23,24]. N fertilizer is usually carelessly used, and the N fertilizer’s recovery efficiency achieved after the cropping period was only 33% [25,26]. Nevertheless, various issues were recorded in the present rice-wheat rotation system, which include a loss of important nutrients and low nutrient utilization efficiency resulting from the extra input of nutrients and reduced soil nutrient supply ability [27,28,29].
The production of both rice and wheat is stable; however, the concerns associated with their production are the low NUE and environmental issues [30]. Excessive quantities and inappropriate methods of fertilizer input lead to a low NUE and higher losses through leaching, volatilization, runoff, and denitrification [31,32,33]. Thus, in the present scenario, it is critical to quantify the ongoing N fertilization rates and enhance N management strategies and policies in rice and wheat growing areas of China, as it is of domestic and international benefit [34]. According to a study performed by Zhang et al. [35], about 45% of rice fields in China receive an extra amount of N fertilizer.
Fertilizer management can help lessen the N wastage without reducing crop yield [36]. Through proper farmer training, a decrease of 15–20% in N fertilizer use was observed as compared to the control group in rice production [37,38]. According to the study, N application rates can be lowered by 30–60% in rice/wheat systems through knowledge-building optimal N management approaches in southern China [22]. As stated by Huang et al. [39], unnecessary N use in rice production can be minimized over shorter and longer periods without sacrificing yield through site-specific nutrient management practices. Ju [40] reported that unused N was somewhat consumed by the later crop, and 7.5% of the total applied N was recovered from residual N. Using suitable N fertilizer quantities and making complete use of the leftover N in the soil can help to maintain higher grain yields in various crops, while limiting the hunting of nutrients present in soil by crops and eradicating huge amounts of nutrient losses and remnants in soil. Dong et al. [41] stated that the concentrations of nutrients (organic C, K, P, and N) in soils are good indicators of soil health and productivity, as they can be directly taken up by plants and contribute impressively to soil fertility.
The reduction in N application in exhaustive rice and wheat cropping systems has not been widely investigated. Although a few studies have reported no effect on rice yield with a reduction in N fertilizer, the researchers did not consider the impact of reducing fertilizer in the current crop on the upcoming crop in a rigorous farming system (rice/wheat rotation). There may prevail a linkage in terms of fertilizer decline between the present crop and the succeeding crop. Therefore, we conducted this three-year field trial using reduced N application rates:
- to compare the implications of N reduction on yield, NUE, and soil fertility in rice and wheat crops;
- to evaluate whether the present crop affects the succeeding crop concerning the crop yield, NUE, and soil fertility;
- to ascertain the optimal N fertilizer rates for attaining high NUE and high grain yields in exhaustive wheat-rice production systems.
We hope that the findings of this study will provide a sound basis to lessen the use of N in an exhaustive rice/wheat rotation, and help to contribute towards the production of more grains with fewer environmental costs.
2. Materials and Methods
2.1. Site and Soil
The experiment was conducted from the wheat season in 2015 to the rice season in 2018 using randomized complete block design at experimental sites in Danyang city (34°36′ N, 119°10′ E) owned by Nanjing Agricultural University, P.R. China. Summer rice and winter rotation were practiced earlier in the field selected for the experiment. Data regarding the daily temperature extremes and average rainfall were collected using an automatic weather station (Watch Dog 2900Et, Spectrum, Aurora, IL, USA), and are given in Figure 1. The daily mean temperature was 17.15 °C and the average annual rainfall was 1269.5 mm, with almost two-thirds of the precipitation concentrated in the paddy season. The soil of the experimental location was categorized as yellow loam (FAO soil taxonomy, 1974), having key physico-chemical characteristics as presented in Table S1.
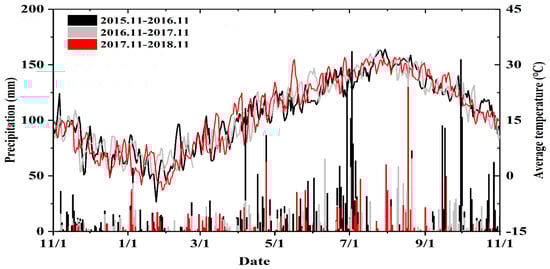
Figure 1.
Temperature and rainfall measurements during the wheat and rice growing seasons from November 2015 to November 2018. Black, grey, and red lines indicate the average temperatures in November 2015–November 2016, November 2016–November 2017, and November 2017–November 2018, respectively. Black, grey, and red bars represent the rainfall events in November 2015–November 2016, November 2016–November 2017, and November 2017–November 2018, respectively.
2.2. Experimental Design and Treatments
2.2.1. Wheat
The wheat cultivar Yangmai20# was used for this study and was sown in 2015–2016 on the 5 November, while during the next two years, seeds were planted in the second week of November. The wheat seeds were broadcasted at a sowing rate of 22.5 g m−2 in each of the experimental plots. The treatments consist of three N levels: W1 (225 kg N ha−1), W2 (180 kg N ha−1), and W3 (135 kg N ha−1). P (90 kg ha−1) and K (90 kg ha−1) were added at the time of sowing in each treatment, while 40% of the N fertilizer of each treatment was added during sowing and the remaining N fertilizer was split into different growth stages (Table 1). The crop was harvested at maturity.

Table 1.
Nitrogen application rates for the experimental treatments at various growth stages of wheat.
2.2.2. Rice
The rice variety Wuyunjing#24 was used as a test material during all three years. Seeds were sown in the last week of May and seedlings were shifted on the 20th June. The crop was harvested in October each year when it reached maturity. The plant spacing was 13 cm × 30 cm during all three years and three seedlings were planted per hill. The plot size was 18 m2 (3 m × 6 m) and plots were parted by 0.5 m-wide lanes, embedded with a plastic film of 60 cm into the soil to form a fence. Three levels of N were used as treatments: R1 (300 kg N ha−1), R2 (240 kg N ha−1), and R3 (180 kg N ha−1). Similar to the wheat crop, 40% of the N fertilizer was applied at the time of sowing (Table 2) along with identical amounts of P and K fertilizers.
Table 2.
Nitrogen application rates for the experimental treatments at various growth stages of rice (kg ha−1).
In addition, the treatments of both wheat and rice were pooled together to form a total of nine treatment: R1W1, R1W2, R1W3, R2W1, R2W2, R2W3, R3W1, R3W2, and R3W3. A treatment (CK) where no N fertilizer was used was also included. All the treatments were replicated thrice. Urea (N 60%) was used as a source of N fertilizer in the study and 60% of the N fertilizer was used basally as indicated in Table 1 and Table 2, while the remaining amount was top-dressed in splits. Dry-wet irrigation method (DW) was used during the rice season to attain more water-proficient irrigation. All the experimental plots were submerged alternatingly to attain a water layer of 40–60 mm, and not re-irrigated until the water level dropped to a certain depth beneath the topsoil; during the peak flowering period, a 50 mm water layer was maintained. Irrigation cycles were then continued after peak flowering until essential drainage was managed before crop harvesting [42]. The crop management practices were consistent with local farmers’ practices.
2.3. Sampling and Measurements
Twenty plants of rice or wheat were selected at three important growth phases of panicle initiation (PI), heading (HS), and maturity (MS) for observation of the tiller number in each plot. In order to reduce the boundary effect, three illustrative plants were tagged from every plot based on average tiller number and were selected from the third row. Plant samples selected from the field were parted into stems, sheaths, green leaf blades, and panicles/spikes. Samples were then desiccated in the oven(Labor-Mix, LP-321, Esztergom, Hungary) for half an hour at a temperature of 105 °C, and then dried at 80 °C for 72 h until the constant weight was achieved. After drying, samples were weighed, sieved, and utilized for N estimation. The collected samples were digested using H2SO4-H2O2, and the famous Kjeldahl method was used to calculate the N content at each growing stage [43]. At the maturity stage, samples were harvested from all plots to calculate the effective panicle number, spikelets per panicle (SN/P), filled grain percentage (FG%), and grain weight (1000 grains). FG% was calculated for the rice-growing season only, by dividing the number of filled grains by the total spikelet number. The soil samples were collected before the application of N fertilizer to determine the impact of the reduction in N rates. The collected samples were thoroughly mixed and sub-samples were extracted. Soil samples were collected using an auger (LX-1, Serve Real, Wuxi, China) with a 2 cm internal diameter at the key growth stages of PI, HS, and MS from the 0–20 cm soil layer during both the crop seasons to determine the soil’s available N contents. Fresh soil samples were analyzed for available N content in the form of ammonium (NH4+) and nitrate (NO3−) after extraction with 0.01 mol L−1 calcium chloride using a continuous flow analyzer, or stored in a freezer at −20 °C until analysis by a similar method within 25 days.
2.4. Calculation of N Use Efficiencies
NUE is divided into the following parameters depending upon the objectives of the study: agronomic efficiency of N (AEN), recovery efficiency of N (REN), partial factor productivity of N (PFPN) and physiological efficiency of N (PEN). These parameters were calculated using the formulas described in [5].
where YN denotes the yield (kg ha−1) achieved using a specific rate of N, Y0 represents the yield (kg ha−1) obtained from control treatment, UN is the sum of N (kg ha−1) taken up by the straw and grain, and U0 represents the quantity of N absorbed in the treatment where no N was used. FN typifies the quantity of N used (kg ha−1).
2.5. Statistics
The data collected were analyzed by using the statistical software SPSS 21.0 (SPSS Inc. Chicago, IL, USA). A two-way analysis of variance (ANOVA) for the grain yields, N uptake, dry matter accumulation, NUE indices, and soil N contents from the three replicates was conducted at the harvest stage, considering these effects: rice N application rate, wheat N application rate, and rice N application rate × wheat N application rate. The differences between treatment means were compared for all the parameters using Duncan’s multiple range test at a p-value of <0.05. Sigma Plot (14.0) and R software were used to construct the figures.
3. Results
3.1. Impact of N Reduction on Grain Yield and Yield Related Attributes of Wheat and Rice
3.1.1. Wheat
The wheat grain yields and associated attributes from three consecutive seasons were analyzed and are presented in Figure 2. The spikes per m−2 were significantly influenced by N rates during the first and third year of the experiment. On the other hand, the reduction in N rates did not significantly affected the SN/P and grain weight during the three years. The number of panicles per m−2 remained higher in the 2016–2017 season under the same N rates, but the SN/P and grain weight were higher in the 2017–2018 wheat season. The grain yield ranged between 2.47–4.07 t ha−1, 3.24–5.13 t ha−1, and 5.87–6.73 t ha−1 during the 2015–2016, 2016–2017, and 2017–2018 growing seasons, respectively. Interestingly, no obvious differences were noticed in the grain yields of wheat by lowering the N application rate to as low as 135 kg ha−1 from the common farmer’s practice of 225 kg ha−1 in any of the three years of the experiment, except for the treatments R2W3 and R3W3 where a decrease in the grain yield was noticed during the 2016–2017 season by reducing the N supply. Reducing the N fertilizer during previous rice seasons had no effect on wheat grain yield, while N reduction during the current wheat season significantly influenced the grain yield only in the 2016–2017 season. The interaction of R × W exhibited no significant differences for yield during all three wheat seasons.
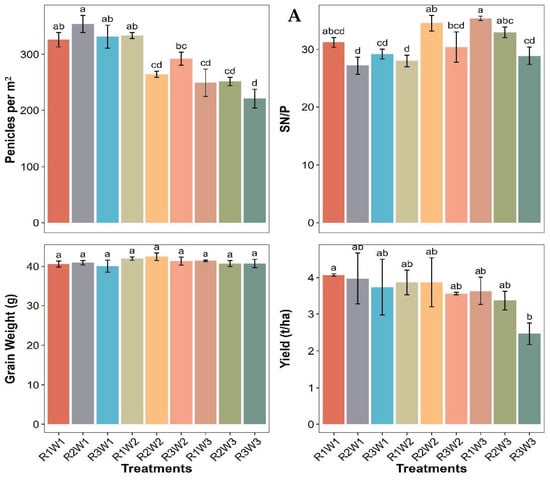
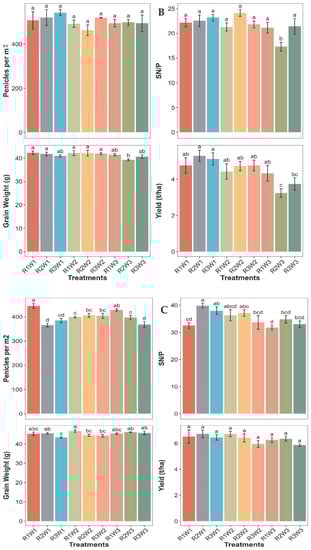
Figure 2.
Yield and related attributes under different N rates during the wheat season in 2015–16 (A), 2016–17 (B), and 2017–18 (C). SN/P represents the spikelet number per panicle. R1 = 300 kg N ha−1, R2 = 240 kg N ha−1, R3 = 180 kg N ha−1 represent the rice fertilizer rates and W1 = 225 kg N ha−1, W2 = 180 kg N ha−1, W3 = 135 kg N ha−1 represent the wheat fertilizer rates. Vertical bars represent the S.E of the means (n = 3). Mean bars among treatments marked by the same letters are not significantly different at p < 0.05.
3.1.2. Rice
The combined results depict that a reduction of 20–40% in the N application rate from the conventional farmers’ N fertilization level of 300 kg/ha caused no marked variations in rice grain yields among the treatments in all three crop seasons of the experiment (Figure 3), which indicates that decreasing the N fertilizer rate did not significantly reduce the rice grain yields. The grain yields during the rice seasons ranged between 12.49–13.94 t ha−1 (2016), 9.74–11.08 t ha−1 (2017), and 12.01–10.77 t ha−1 (2018). The total panicle number decreased from 2016 to 2018, while the highest grain weight was observed during the third year of study. The FG% also reached a maximum during the 2018 rice season. Reducing the N fertilizer inputs in the previous wheat season and the present rice season had no significant effects on the yield or related attributes during the three consecutive years. The R × W interaction for the grain yield and yield traits between the different treatments was also non-significant, except for the SN/P in the 2018 rice season.
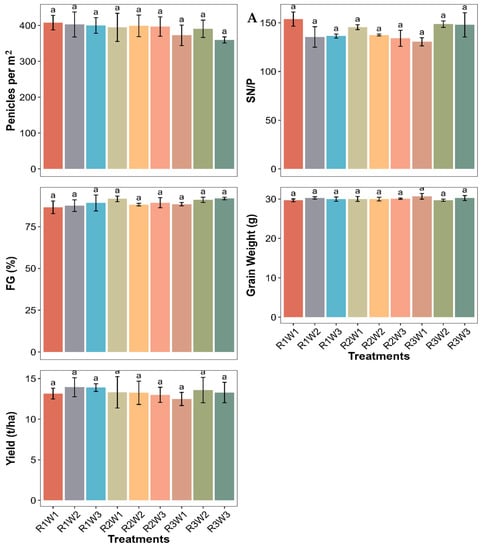
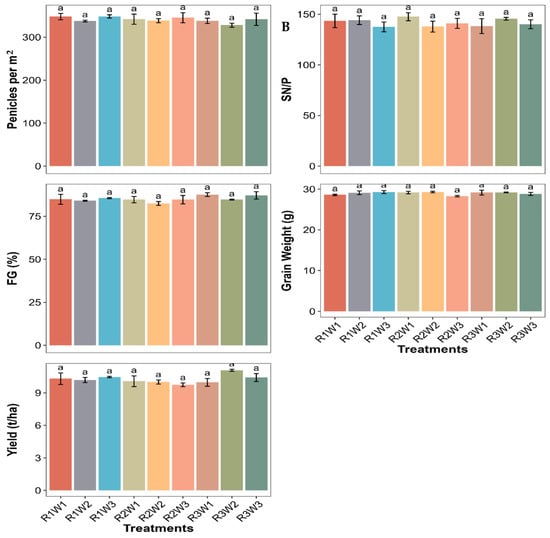
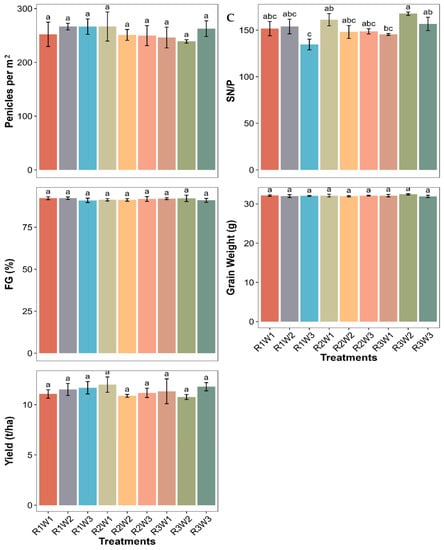
Figure 3.
Yield and related attributes under different N rates during rice season in 2016 (A), 2017 (B), and 2018 (C). SN/P and FG (%) represent the spikelet number per panicle and grain filling percentage, respectively. R1 = 300 kg N ha−1, R2 = 240 kg N ha−1, R3 = 180 kg N ha−1 represent the rice fertilizer rates and W1 = 225 kg N ha−1, W2 = 180 kg N ha−1, W3 = 135 kg N ha−1 represent the wheat fertilizer rates. Vertical bars represent the S.E of the means (n = 3). Mean bars among treatments marked by the same letters are not significantly different at p < 0.05.
3.2. Dry Matter Accumulation
The dry matter (DM) content accumulation at maturity in the wheat season ranged between 6.06–11.73 t ha−1, 7.86–14.26 t ha−1, and 7.68–10.88 t ha−1 during 2015–2016, 2016–2017, and 2017–2018, respectively (Table 3). The treatment R2W1 demonstrated the maximum DM accumulation during the first study year, and RIWI during the second and third growing seasons of wheat. The N fertilizer reduction in wheat significantly influenced the DM content during the first two crop years. The R interactions significantly affected DM only during the 2015–2016 wheat season. The R × W interactions for all the treatments during the three consecutive wheat seasons showed no significant impact.
Table 3.
Dry matter accumulation and N accumulation at maturity under different N rates in three wheat seasons (2015–2018).
The DM content at rice crop harvest was accessed under different N application rates, and trends similar to yield were observed; no remarkable variations were noted between different N rates. The dry matter contents in three rice seasons from 2016–2018 ranged between 21.47–25.77 t ha−1, 20.43–22.16 t ha−1, and 19.9–24.18 t ha−1, respectively (Table 4). The R × W interactions produced a significant difference only during the 2016 rice season, while the N reduction during the current crop (R) and earlier crop (W) remained non-significant throughout the experiment (Table 3).
Table 4.
Dry matter accumulation and N accumulation at maturity under different N rates in three rice seasons (2016–2018).
3.3. Nitrogen Accumulation
The results from three years of experimentation illustrate that, along with the decline in the N fertilizer application rates, the N accumulation also decreases. In the wheat crop, the reduction in N application significantly reduced the quantity of N accumulation during the whole experiment. During all three years, the highest amount of N accumulated in the treatments where N application was higher, and the lowest was detected in treatments where the least amount of N was used. In comparison with R3W3, the N accumulation in treatment R1W1 enhanced from 27% to 80% in three wheat-growing seasons (Table 3). The reduction in the N rate during the current wheat season (W) and previous rice season (R) significantly reduced the N accumulation during all three wheat seasons. However, R × W interactions were non-significant during the 2015–2016 and 2017–2018 wheat season (Table 3).
A significant decrease in N accumulation was observed in 2016 with reduced N application, while in the 2017 and 2018 rice seasons the differences were not statistically different from each other in various treatments (Table 4). In the 2016, 2017, and 2018 rice seasons, increases of 33%, 6.99%, and 4.70%, respectively, were observed in N accumulation in treatment R1W1 as compared with R3W3. Reducing the N application rate in the current rice crop (R) only produced significant effects in the 2016 growing season, while during 2017 and 2018, no evident differences were observed. However, the N decline in the wheat seasons (W) and the R × W interactions remained non-significant during all three rice seasons (Table 4).
3.4. Nitrogen Use Efficiency
The NUE indicators also demonstrate trends similar to other parameters, which show a negative correlation with N fertilizer rates. The various components of NUE are explained further below.
3.4.1. Nitrogen Agronomic Efficiency (AEN)
The AEN during the wheat seasons remained between 10.88–19.56 kg kg−1, 16.50–24.67 kg kg−1, and 22.26–36.38 kg kg−1 during the years 2015–2016, 2016–2017, and 2017–2018, respectively (Table 5) The R and R × W interactions remained non-significant during all the wheat seasons (W). In the rice crop, the lowest N application rate, R3, showed the highest AEN in all three growing seasons, ranging between 15.16–26.34 kg kg−1, 7.33–15.93 kg kg−1, and 9.8–20.5 kg kg−1 in years 2016, 2017, and 2018, respectively (Table 6). The AEN increased in 2017 as compared to the previous year’s rice season, but in 2018, it again showed a decreasing trend relative to the earlier two seasons. Reducing the N input significantly improved the AEN for both crops, as higher N rates possessed lower values for AEN than reduced N application rates in both crops. The W and R × W interactions were non-significant for the rice crop during the entire experiment, while the reduction during the current rice season (R) significantly affected AEN in all years.
Table 5.
Indices of NUE under different N input rates during wheat seasons in the three-year experiment (2016–2018).
Table 6.
Indices of NUE under different N input rates during rice seasons in the three-year experiment (2016–2018).
3.4.2. Nitrogen Partial Factor Productivity (PFPN)
In the present experiment, decreasing the N application rates increased the PFPN gradually in the wheat crop. The PFPN during the wheat seasons 2015–2016, 2016–2017, and 2017–2018 increased by 18.47–48.4%, 12.10–35.73%, and 24.69–57.04%, respectively, in N treatments W2 and W3 as compared to W1 (Table 5). Lowering the N in the rice season (R) and R × W interactions did not significantly influence the PFPN in the wheat crop. However, the decline in N use during the wheat seasons (W) had a significant effect during the years 2015–2016 and 2017–2018.
The peak value for PFPN in rice was observed for the minimum N application rate R3. In the rice seasons, the PFPN of R2 and R3 increased by 19.42–62.36% (2016), 20.36–76.58% (2017), and 28.38–68.01% (2018) as compared to R1 (Table 6). The N reduction during the wheat (W) season and R × W interactions for all three years remained non-significant, while N reduction during the current seasons (R) significantly affected the PFPN during all the three years. The PFPN remained lower in the wheat-growing seasons as compared to rice, which suggested that rice had notably higher grain yields in our whole experiment as compared to wheat.
3.4.3. Nitrogen Physiological Efficiency (PEN)
In the three wheat seasons, the PEN ranged between 25.59–44.62 kg kg−1, 33.75–71.56 kg kg−1, and 52.18–78.97 kg kg−1, respectively (Table 5). The PEN was not significantly affected during wheat seasons 2015–2016 and 2016–2017 by the N application rates. However, during the 2017–2018 growing season, a significant difference was observed among different N input treatments, where the uppermost PEN was obtained in the R2W3 treatment and the lowest was observed for R1W1. The R × W interactions remained non-significant during all three years of study (Table 5).
The PEN during the three rice seasons 2016, 2017, and 2018 ranged between 21.20–38.26 kg kg−1, 16.77–36.15 kg kg−1, and 23.38–34.62 kg kg−1, respectively (Table 6). The R3 treatment had the maximum PEN value during all three rice growing seasons. The reduction in the N application rate during previous wheat (W) seasons, current rice (R) seasons, and R × W interactions remained non-significant. The effects of N application rates on PEN were consistent, as lower N rates exhibited higher values for PEN for both crops during the whole experiment.
3.4.4. Nitrogen Recovery Efficiency (REN)
During the first wheat season, the maximum REN was observed in the RIW1 treatment, while during the next two years, R3W3 and R1W3 exhibited the highest values of REN, respectively (Table 5). The reduction in N in the current wheat (W) season had a significant impact only during 2017–2018, while the R × W interactions remained non-significant throughout. In the rice season, the treatment R3 (where the least amount of N fertilizer was applied) had the highest REN values during all three years. Increases of 7.81%, 29.76%, and 35%% were observed in treatment R3 as compared to treatment R1 from the 2016–2018 rice seasons, respectively (Table 6). Lowering the N fertilizer rate during the present crops and R × W interactions had no dominant effect on the REN of either the rice or wheat crops.
3.5. Soil N Status
Ammonium (NH4+) and nitrate (NO3−) are the chief N forms present in the soil, which represent the soil capacity to supply N to plants. The NH4+ and NO3− contents present in the soil at various growth stages (PI, HS, and MS) of wheat and rice crops during the three-year trial are presented in Tables S2–S5. It is evident from the data that higher NH4+-N and NO3−-N contents were present in the soil during the early growth stages of both the crops, and rapid reduction was noted in the soil N contents from PI to MS. Similarly, more NH4+-N and NO3−-N contents were present during the wheat crop season as compared to rice. No significant differences were noted among various treatments regarding the soils’ available N contents. Lower soil N contents were observed during rice seasons as compared to wheat, this is attributable to flooding conditions and the anaerobic soil environment. The reduction in the N rate during the current season and previous season mostly remained non-significant, R × W interactions for NH4+ were significant only at PI in the first year of the trial, while for NO3− contents, it was significant at HS in both the second and third year of the experiment. For the rice season, the interaction of R × W produced a significant difference for both NH4+ and NO3− only at MS in the first year of the experiment.
4. Discussion
Nitrogen plays a vital role in the growth and development of plants. In our study, the three consecutive rice-wheat rotations depicted no substantial decline in the grain yield of either wheat or rice with a reduction in N fertilizer application rates of 20–40%. The average annual yield across three years of rice-wheat rotation in our experiment was 17.45 t ha−1, which was higher than the average annual yield (13.17 t ha−1) documented in this region [44]. We used the controlled soil drying irrigation method (DW) during the rice crop and the improvement in the paddy yield may attributed to this [45]. The boost in crop yields during the last year could be due to greater sunshine hours in the rice growing season and a prolonged dry season in winter as these conditions favor crop development and yield formation [46]. The increase in the N utilization ratio by reducing the N input at the early growth stage could be another reason behind higher crop production [18].
The response of grain yield towards N in an extensive rice-wheat rotation system is decreasing because of the overuse of nitrogenous fertilizers in China [47]. The plant demand is below the level of fertilizer application in a growing region, which is why no notable differences were observed among the treatments in our experiment. The split input of N fertilizer played a vital part in increasing the grain yield in this study and various studies have reported an increase in grain yields by postponing N fertilizer use to different crop stages [48]. The fertilizer input increases grain yields but, after a certain limit, it fails to respond and the same was observed in our study. Delaying N application increases the grain sink size and total dry matter which helps indirectly in improving crop yields [6]. The outcomes from our trial are also near the recommended levels, as no noteworthy differences were seen between the highest N treatments and others in either crop [5,14]. Over-fertilization also causes lodging and delayed maturity in treatments with a higher input of N, which limits plants’ ability to produce. The splitting of N fertilizer helped in maintaining the yields of rice and wheat as this approach prolonged the availability of N to plants for longer periods. Dry matter (DM) accumulation is one of the main growth factors of wheat and rice. The reason for the lack of difference between reduced and high fertilizer rates might be that under reduced N rates, proper growth of crops is maintained by enhancing the DM of the leaves, stem, and ears at different growth stages of rice and wheat, thus promoting total dry matter accumulation [49]. In our study, a reduction in fertilizer application at later growth stages of wheat and rice had no notable consequences on DM accumulation. The DW method showed a positive impact on the DM accumulation of rice by enhancing the uptake of nutrients to the stem, leaves, and ears, improving its dry weight and in turn helping in dry matter accumulation which was in line with Kundu et al. [50].
The way the plant responds to applied fertilizer is crucial to determine the proper levels of fertilizer for crops. The quantity of N uptake varies with N application rates as expected [51]. Along with higher N application rates, a delay in N input may also be the reason for increased N accumulation in our study [6]. In early growth stages, plant roots are less developed and unable to uptake more N, which results in higher N losses at early stages [52], thus the reduction in N application at early plant stages is feasible. The N accumulation was greater at later stages of the crops. The summer rice crop exhibited more N accumulation than the winter wheat in our study, despite abundant fertilizer supplies, which might be due to the poor N assimilation efficiency of the wheat variety selected for this study. NH4+ and NO3− are the inorganic forms in which N is mostly absorbed from the soil. Lower N contents during the rice season as compared to wheat can be attributed to more rainfall which can result in persistent leaching, volatilization, and denitrification [53]. No significant differences in N contents were found in this study by the reduction of N fertilizer among treatments, but great variation was found among the N contents of soil at various growth periods (Tables S2–S5). Higher soil available N during the wheat season is credited to the least availability of surface water and less precipitation. During the growth of both crops, the early growth stages exhibit higher soil N contents as compared to maturity, which is compatible with plant growth. N reduction having no remarkable impact on the soil available N indicates that soil fertility is not affected by reducing N fertilizer, rather it minimizes the N loss [5]. The C:N ratio analysis of the experimental soil was not performed, which is a limitation of our study, as the C:N ratio (if determined) gives a clear picture of soil N relations.
The NUE is the index used to describe the rise in grain yield per unit of N available. The NUE indices largely depend upon the quantity of N used, N accumulation, and grain yield. Better synchrony among crop N requirements and accessible N resources is a key factor to increase NUE. AEN is the term used to describe a surge in grain yield due to fertilizer input. The findings of this study disclosed the positive impact of N reduction on AEN, as higher figures were obtained with the reduced N rates for both the crops (Table 5 and Table 6. Dobermann [21] recommended an AEN value of 25–30 kg kg−1 under good management practices, while in our study, even with a 20–40% reduction in N fertilizer, the AEN is below the proposed value which predicts that higher N fertilizer levels are in practice in the growing region. Decent values of AEN can be attained by lowering the input rate of N in both wheat and rice crops. The constant reduction in N fertilizer for longer periods at the cost of yield decrease is not feasible. The major reasons for lower NUE values were the high grain yields from control treatments and higher N fertilizer inputs.
PEN is another key index that describes the effectiveness with which the applied N fertilizer is converted to economical yield. Compared to the 50–60 kg kg−1 recommended PEN, the values in our experiment during wheat seasons were optimum but remained lower for rice because of higher yields from the plots with zero N fertilizer input during the rice season [5]. The higher values of AEN and PEN in reduced N application treatments were likely artifacts of lower N accumulation and somewhat lower yields as compared to the highest N application rate. PFPN is vital for agronomists as it provides a relation between N input from all available sources and economic gains. The N input gradually raises the yield and the capability of consuming the native N supplies from the soil-flood water system. In the present trial, the highest PFPN values were obtained from the lowest N input rates during the three-year experiment. This suggests that reducing the N input and delaying its application will help to improve the NUE [48,54]. The higher PFPN values observed in our experiment might be due to the higher grain yields observed in our study. The REN during the wheat seasons in our experiment remained lower, which might be due to the higher N accumulation reported in previous experiments at similar N input rates, and the fact that yield in the control treatments remained very low. The lower grain yields in control plots in this trial were ambiguous. A greater uptake of N in rice at the MS resulted in a higher REN during all rice seasons compared to that reported by others. The lower values of REN in wheat indicate a poor N uptake from applied N. Thus, the outcomes of this research suggest that high N input rates should not be encouraged in a rigorous rice-wheat rotation system.
5. Conclusions
It can be concluded that the application of 20–40% less N as compared to the recommended rate can significantly increase the N use efficiency without affecting the yield in both rice and wheat crops. Our study revealed that the application of 180 kg N per hectare resulted in a good yield and NUE in the rice crop, whereas, in the wheat season, a reduction in the grain yield was observed during the second crop season. The residual N in the soil aided in sustaining the yield for up to one year in wheat; thus, it would be a good strategy to reduce the N application rate and subsequently apply the recommended N rate in the next season to achieve sustainable rice and wheat production and reduce environmental pollution by increasing N use efficiency. Regarding the soil fertility, a reduced N application rate had no effect. Overall, it is suggested that N fertilization should be managed in a sustainable way to reduce the environmental impact and to increase the crop production without influencing the soil health and biodiversity. Our study and other related studies represent a good source of information for farmers and the institutes responsible for the management of chemical N fertilizers. Future studies should also include observations of the C:N status and soil temperature, as these are also potential soil effectors.
Supplementary Materials
The following supporting information can be downloaded at: https://www.mdpi.com/article/10.3390/agronomy12040920/s1. Table S1: Physico-chemical properties of experimental soil before the experiment. Table S2: Indices of NH4+-N under different N input rates during wheat seasons in the three-year experiment (2015–2018). Table S3: Indices of NH4+-N under different N input rates during rice growing seasons in the three-year experiment (2016–2018). Table S4: Indices of NO3-N under different N input rates during three wheat growing seasons (2015–2018). Table S5: Indices of NO3-N under different N input rates during the three rice growing seasons (2016–2018).
Author Contributions
Conceptualization, M.Y.N. and G.L.; methodology, M.Y.N. and G.L.; software, Y.Z.; validation, S.A. and J.Z.; formal analysis, M.Y.N.; investigation, M.Y.N.; resources, Y.D.; data curation, M.Y.N. and J.Z.; writing—original draft preparation, M.Y.N.; writing—review and editing, M.Y.N. and G.L.; visualization, M.Y.N. and J.Z.; supervision, Y.D.; project administration, Y.D. and G.L.; funding acquisition, G.L. All authors have read and agreed to the published version of the manuscript.
Funding
This work was funded by National natural science foundation of China (31871573), Key Research and Development Program of Jiangsu Province (BE2017369) and Jiangsu Agriculture Science and Technology Innovation Fund (JASTIF) under number CX (18)1002.
Conflicts of Interest
The authors declare no conflict of interest.
References
- Carrijo, D.R.; Lundy, M.E.; Linquist, B.A. Rice Yields and Water Use under Alternate Wetting and Drying Irrigation: A Meta-Analysis. Field Crop. Res. 2017, 203, 173–180. [Google Scholar] [CrossRef]
- FAOSTAT. Available online: http://www.fao.org/faostat/en/#home (accessed on 18 August 2021).
- Zhang, F.; Chen, X.; Vitousek, P. Chinese Agriculture: An Experiment for the World. Nature 2013, 497, 33–35. [Google Scholar] [CrossRef]
- Hu, C.; Li, S.L.; Qiao, Y.; Liu, D.H.; Chen, Y.F. Effects of 30 Years Repeated Fertilizer Applications on Soil Properties, Microbes and Crop Yields in Rice-Wheat Cropping Systems. Exp. Agric. 2015, 51, 355–369. [Google Scholar] [CrossRef]
- Liu, X.; Xu, S.; Zhang, J.; Ding, Y.; Li, G.; Wang, S.; Liu, Z.; Tang, S.; Ding, C.; Chen, L. Effect of Continuous Reduction of Nitrogen Application to a Rice-Wheat Rotation System in the Middle-Lower Yangtze River Region (2013–2015). Field Crop. Res. 2016, 196, 348–356. [Google Scholar] [CrossRef]
- Pan, S.; Huang, S.; Zhai, J.; Wang, J.; Cao, C.; Cai, M.; Zhan, M.; Tang, X. Effects of N Management on Yield and N Uptake of Rice in Central China. J. Integr. Agric. 2012, 11, 1993–2000. [Google Scholar] [CrossRef]
- Ma, W.; Li, J.; Ma, L.; Wang, F.; Sisák, I.; Cushman, G.; Zhang, F. Nitrogen Flow and Use Efficiency in Production and Utilization of Wheat, Rice, and Maize in China. Agric. Syst. 2008, 99, 53–63. [Google Scholar] [CrossRef]
- Bouwman, A.F.; Boumans, L.J.M.; Batjes, N.H. Emissions of N2O and NO from fertilized fields: Summary of available measurement data. Glob. Biogeochem. Cycles 2002, 16, 6-1–6-13. [Google Scholar] [CrossRef]
- Zhu, S.; Chen, S. The Impact of Temperature on Nitrification Rate in Fixed Film Biofilters. Aquac. Eng. 2002, 26, 221–237. [Google Scholar] [CrossRef]
- Xing, G.; Cao, Y.; Shi, S.; Sun, G.; Du, L.; Zhu, J. N Pollution Sources and Denitrification in Waterbodies in Taihu Lake Region. Sci. China Ser. B Chem. 2001, 44, 304–314. [Google Scholar] [CrossRef]
- Duan, Y.; Xu, M.; Gao, S.; Yang, X.; Huang, S.; Liu, H.; Wang, B. Nitrogen Use Efficiency in a Wheat-Corn Cropping System from 15 Years of Manure and Fertilizer Applications. Field Crop. Res. 2014, 157, 47–56. [Google Scholar] [CrossRef]
- Gao, C.; Sun, B.; Zhang, T.L. Sustainable Nutrient Management in Chinese Agriculture: Challenges and Perspective. Pedosphere 2006, 16, 253–263. [Google Scholar] [CrossRef]
- Yang, H.S. Resource Management, Soil Fertility and Sustainable Crop Production: Experiences of China. Agric. Ecosyst. Environ. 2006, 116, 27–33. [Google Scholar] [CrossRef]
- Ju, X.T.; Xing, G.X.; Chen, X.P.; Zhang, S.L.; Zhang, L.J.; Liu, X.J.; Cui, Z.L.; Yin, B.; Christie, P.; Zhu, Z.L.; et al. Reducing Environmental Risk by Improving N Management in Intensive Chinese Agricultural Systems. Proc. Natl. Acad. Sci. USA 2009, 106, 3041–3046, Erratum in Proc. Natl. Acad. Sci. USA 2009, 106, 8077–8078. [Google Scholar] [CrossRef] [PubMed] [Green Version]
- Le, C.; Zha, Y.; Li, Y.; Sun, D.; Lu, H.; Yin, B. Eutrophication of Lake Waters in China: Cost, Causes, and Control. Environ. Manag. 2010, 45, 662–668. [Google Scholar] [CrossRef] [PubMed]
- Guo, J.H.; Liu, X.J.; Zhang, Y.; Shen, J.L.; Han, W.X.; Zhang, W.F.; Christie, P.; Goulding, K.W.T.; Vitousek, P.M.; Zhang, F.S. Significant Acidification in Major Chinese Croplands. Science 2010, 327, 1008–1010. [Google Scholar] [CrossRef] [Green Version]
- Nayak, D.; Saetnan, E.; Cheng, K.; Wang, W.; Koslowski, F.; Cheng, Y.F.; Zhu, W.Y.; Wang, J.K.; Liu, J.X.; Moran, D.; et al. Management Opportunities to Mitigate Greenhouse Gas Emissions from Chinese Agriculture. Agric. Ecosyst. Environ. 2015, 209, 108–124. [Google Scholar] [CrossRef] [Green Version]
- Peng, S.; Buresh, R.J.; Huang, J.; Yang, J.; Zou, Y.; Zhong, X.; Wang, G.; Zhang, F. Strategies for Overcoming Low Agronomic Nitrogen Use Efficiency in Irrigated Rice Systems in China. Field Crop. Res. 2006, 96, 37–47. [Google Scholar] [CrossRef]
- Zheng, Y.M.; Ding, Y.F.; Wang, Q.S.; Li, G.H.; Wu, H.; Yuan, Q.; Wang, H.Z.; Wang, S.H. Favorable Effect of Nitrogen before Transplanting on Nitrogen Distribution and Utilization Efficiency in Rice Rhizosphere Soil. Sci. Agric. Sin. 2007, 40, 314–321. [Google Scholar]
- Dobermann, A.; Cassman, K.G. Plant Nutrient Management for Enhanced Productivity in Intensive Grain Production Systems of the United States and Asia. Plant Soil 2002, 247, 153–175. [Google Scholar] [CrossRef]
- Dobermann, A. Nutrient Use Efficiency–Measurement and Management. In Proceedings of the IFA International Workshop on Fertilizer Best Management Practices, Brussels, Belgium, 7–9 March 2007. [Google Scholar]
- Ju, C.; Buresh, R.J.; Wang, Z.; Zhang, H.; Liu, L.; Yang, J.; Zhang, J. Root and Shoot Traits for Rice Varieties with Higher Grain Yield and Higher Nitrogen Use Efficiency at Lower Nitrogen Rates Application. Field Crop. Res. 2015, 175, 47–55. [Google Scholar] [CrossRef]
- Xue, Y.; Duan, H.; Liu, L.; Wang, Z.; Yang, J.; Zhang, J. An Improved Crop Management Increases Grain Yield and Nitrogen and Water Use Efficiency in Rice. Crop Sci. 2013, 53, 271–284. [Google Scholar] [CrossRef]
- Zhang, J.H.; Liu, J.L.; Zhang, J.B.; Cheng, Y.N.; Wang, W.P. Nitrate-Nitrogen Dynamics and Nitrogen Budgets in Rice-Wheat Rotations in Taihu Lake Region, China. Pedosphere 2013, 23, 59–69. [Google Scholar] [CrossRef]
- Garnett, T.; Conn, V.; Kaiser, B.N. Root Based Approaches to Improving Nitrogen Use Efficiency in Plants. Plant Cell Environ. 2009, 32, 1272–1283. [Google Scholar] [CrossRef]
- Raun, W.R.; Johnson, G.V. Improving Nitrogen Use Efficiency for Cereal Production. Agron. J. 1999, 91, 357–363. [Google Scholar] [CrossRef] [Green Version]
- Shi, X.J. Characteristics of Nutrient Cycling in the Rice-Wheat Rotation System; China Agricultural University: Beijing, China, 2003. [Google Scholar]
- Fan, M.S.; Jiang, R.F.; Zhang, F.S.; Lu, S.H.; Liu, X.J. Nutrient Management Strategy of Paddy Rice-Upland Crop Rotation System. Chin. J. Appl. Ecol. 2008, 19, 424–432. [Google Scholar]
- Peng, S.; Huang, J.; Zhong, X.; Yang, J.; Wang, G.; Zou, Y.; Zhang, F.; Zhu, Q.; Buresh, R.; Witt, C. Challenge and Opportunity in Improving Fertilizer-Nitrogen Use Efficiency of Irrigated Rice in China. Agric. Sci. China 2002, 1, 776–785. [Google Scholar]
- Jing, Q.; Bouman, B.A.M.; Hengsdijk, H.; Van Keulen, H.; Cao, W. Exploring Options to Combine High Yields with High Nitrogen Use Efficiencies in Irrigated Rice in China. Eur. J. Agron. 2007, 26, 166–177. [Google Scholar] [CrossRef]
- Kirda, C.; Derici, M.R.; Schepers, J.S. Yield Response and N-Fertiliser Recovery of Rainfed Wheat Growing in the Mediterranean Region. Field. Crop. Res. 2001, 71, 113–122. [Google Scholar] [CrossRef]
- Shi, Z.; Li, D.; Jing, Q.; Cai, J.; Jiang, D.; Cao, W.; Dai, T. Effects of Nitrogen Applications on Soil Nitrogen Balance and Nitrogen Utilization of Winter Wheat in a Rice-Wheat Rotation. Field. Crop. Res. 2012, 127, 241–247. [Google Scholar] [CrossRef]
- Zhu, J.G.; Han, Y.; Liu, G.; Zhang, Y.L.; Shao, X.H. Nitrogen in Percolation Water in Paddy Fields with a Rice/Wheat Rotation. Nutr. Cycl. Agroecosystems 2000, 57, 75–82. [Google Scholar] [CrossRef]
- Wu, L.; Chen, X.; Cui, Z.; Wang, G.; Zhang, W. Improving Nitrogen Management via a Regional Management Plan for Chinese Rice Production. Environ. Res. Lett. 2015, 10. [Google Scholar] [CrossRef]
- Zhang, H.; Yu, C.; Kong, X.; Hou, D.; Gu, J.; Liu, L.; Wang, Z.; Yang, J. Progressive Integrative Crop Managements Increase Grain Yield, Nitrogen Use Efficiency and Irrigation Water Productivity in Rice. Field. Crop. Res. 2018, 215. [Google Scholar] [CrossRef]
- Chen, X.; Cui, Z.; Fan, M.; Vitousek, P.; Zhao, M.; Ma, W.; Wang, Z.; Zhang, W.; Yan, X.; Yang, J.; et al. Producingmore Grain with Lower Environmental Costs. Nature 2014, 514, 486–489. [Google Scholar] [CrossRef]
- Hu, R.; Cao, J.; Huang, J.; Peng, S.; Huang, J.; Zhong, X.; Zou, Y.; Yang, J.; Buresh, R.J. Farmer Participatory Testing of Standard and Modified Site-Specific Nitrogen Management for Irrigated Rice in China. Agric. Syst. 2007, 94, 331–340. [Google Scholar] [CrossRef]
- Huang, J.; Hu, R.; Cao, J.; Rozelle, S. Training Programs and In-The-Field Guidance to Reduce China’s Overuse of Fertilizer without Hurting Profitability. J. Soil Water Conserv. 2008, 63, 165A–167A. [Google Scholar] [CrossRef]
- Huang, J.; Huang, Z.; Jia, X.; Hu, R.; Xiang, C. Long-Term Reduction of Nitrogen Fertilizer Use through Knowledge Training in Rice Production in China. Agric. Syst. 2015, 135, 105–111. [Google Scholar] [CrossRef]
- Ju, X. ACCUMULATION AND MOVEMENT OF NO3-N IN SOIL PROFILE IN WINTER WHEAT-SUMM ER MAIZE ROTATION SYSTEM. Acta Pedol. Sin. 2003, 40, 538–546. [Google Scholar]
- Dong, W.; Zhang, X.; Wang, H.; Dai, X.; Sun, X.; Qiu, W.; Yang, F. Effect of Different Fertilizer Application on the Soil Fertility of Paddy Soils in Red Soil Region of Southern China. PLoS ONE 2012, 7, e44504. [Google Scholar] [CrossRef] [Green Version]
- Ye, Y.; Liang, X.; Chen, Y.; Liu, J.; Gu, J.; Guo, R.; Li, L. Alternate Wetting and Drying Irrigation and Controlled-Release Nitrogen Fertilizer in Late-Season Rice. Effects on Dry Matter Accumulation, Yield, Water and Nitrogen Use. Field. Crop. Res. 2013, 144, 212–224. [Google Scholar] [CrossRef]
- Douglas, L.A.; Riazi, A.; Smith, C.J. A Semi-Micro Method for Determining Total Nitrogen in Soils and Plant Material Containing Nitrite and Nitrate. Soil Sci. Soc. Am. J. 1980, 44, 431–433. [Google Scholar] [CrossRef]
- Li, H.; Liu, L.; Wang, Z.; Yang, J.; Zhang, J. Agronomic and Physiological Performance of High-Yielding Wheat and Rice in the Lower Reaches of Yangtze River of China. Field. Crop. Res. 2012, 133, 119–129. [Google Scholar] [CrossRef]
- Yang, J.; Liu, K.; Wang, Z.; Du, Y.; Zhang, J. Water-Saving and High-Yielding Irrigation for Lowland Rice by Controlling Limiting Values of Soil Water Potential. J. Integr. Plant Biol. 2007, 49, 1445–1454. [Google Scholar] [CrossRef]
- Hofmeier, M.; Roelcke, M.; Han, Y.; Lan, T.; Bergmann, H.; Böhm, D.; Cai, Z.; Nieder, R. Nitrogen Management in a Rice-Wheat System in the Taihu Region: Recommendations Based on Field Experiments and Surveys. Agric. Ecosyst. Environ. 2015, 209, 60–73. [Google Scholar] [CrossRef]
- Chai, R.; Niu, Y.; Huang, L.; Liu, L.; Wang, H.; Wu, L.; Zhang, Y. Mitigation Potential of Greenhouse Gases under Different Scenarios of Optimal Synthetic Nitrogen Application Rate for Grain Crops in China. Nutr. Cycl. Agroecosystems 2013, 96, 15–28. [Google Scholar] [CrossRef]
- Xu, H.; Zhong, G.; Lin, J.; Ding, Y.; Li, G.; Wang, S.; Liu, Z.; Tang, S.; Ding, C. Effect of Nitrogen Management during the Panicle Stage in Rice on the Nitrogen Utilization of Rice and Succeeding Wheat Crops. Eur. J. Agron. 2015, 70, 41–47. [Google Scholar] [CrossRef]
- Newton, C.P.; Swapan, K.P.; Md, A.S.; Shabuj, C.P. Dry Matter Partitioning, Yield and Grain Protein Content of Fine Aromatic Boro Rice (cv. BRRI dhan50) in Response to Nitrogen and Potassium Fertilization. Bangladesh J. Bot. 2021, 50, 103–111. [Google Scholar] [CrossRef]
- Kundu, A.; Raha, P.; Dubey, A.N. Impact of Source and Method of Potassium Application on Dry Matter Accumulation and Partitioning of Potassium in Rice (Oryza sativa L.). J. Soil Sci. Plant Nutr. 2021, 21, 2252–2263. [Google Scholar] [CrossRef]
- Hou, W.; Khan, M.R.; Zhang, J.; Lu, J.; Ren, T.; Cong, R.; Li, X. Nitrogen Rate and Plant Density Interaction Enhances Radiation Interception, Yield and Nitrogen Use Efficiency of Mechanically Transplanted Rice. Agric. Ecosyst. Environ. 2019, 269, 183–192. [Google Scholar] [CrossRef]
- Gabrielle, B.; Recous, S.; Tuck, G.; Bradbury, N.J.; Nicolardot, B. Ability of the SUNDIAL Model to Simulate the Short-Term Dynamics of 15N Applied to Winter Wheat and Oilseed Rape. J. Agric. Sci. 2001, 137, 157–168. [Google Scholar] [CrossRef]
- Liu, Z.; Meng, Y.; Cai, M.; Zhou, J. Coupled Effects of Mulching and Nitrogen Fertilization on Crop Yield, Residual Soil Nitrate, and Water Use Efficiency of Summer Maize in the Chinese Loess Plateau. Environ. Sci. Pollut. Res. 2017, 24, 25849–25860. [Google Scholar] [CrossRef]
- Cassman, K.G.; Pingali, P.L. Extrapolating Trends from Long-Term Experiments to Farmers’ Fields: The Case of Irrigated Rice Systems in Asia. In Agricultural Sustainability: Economic, Environmental and Statistical Considerations; John Wiley and Sons: Frederiksberg, Denmark, 1995; ISBN 0-471-95009-2. [Google Scholar]
Publisher’s Note: MDPI stays neutral with regard to jurisdictional claims in published maps and institutional affiliations. |
© 2022 by the authors. Licensee MDPI, Basel, Switzerland. This article is an open access article distributed under the terms and conditions of the Creative Commons Attribution (CC BY) license (https://creativecommons.org/licenses/by/4.0/).